
Combining Theory-Driven Evaluation and Causal Loop Diagramming for Opening the ‘Black Box’ of an Intervention in the Health Sector: A Case of Performance-Based Financing in Western Uganda


Abstract
:1. Introduction
2. Materials and Methods
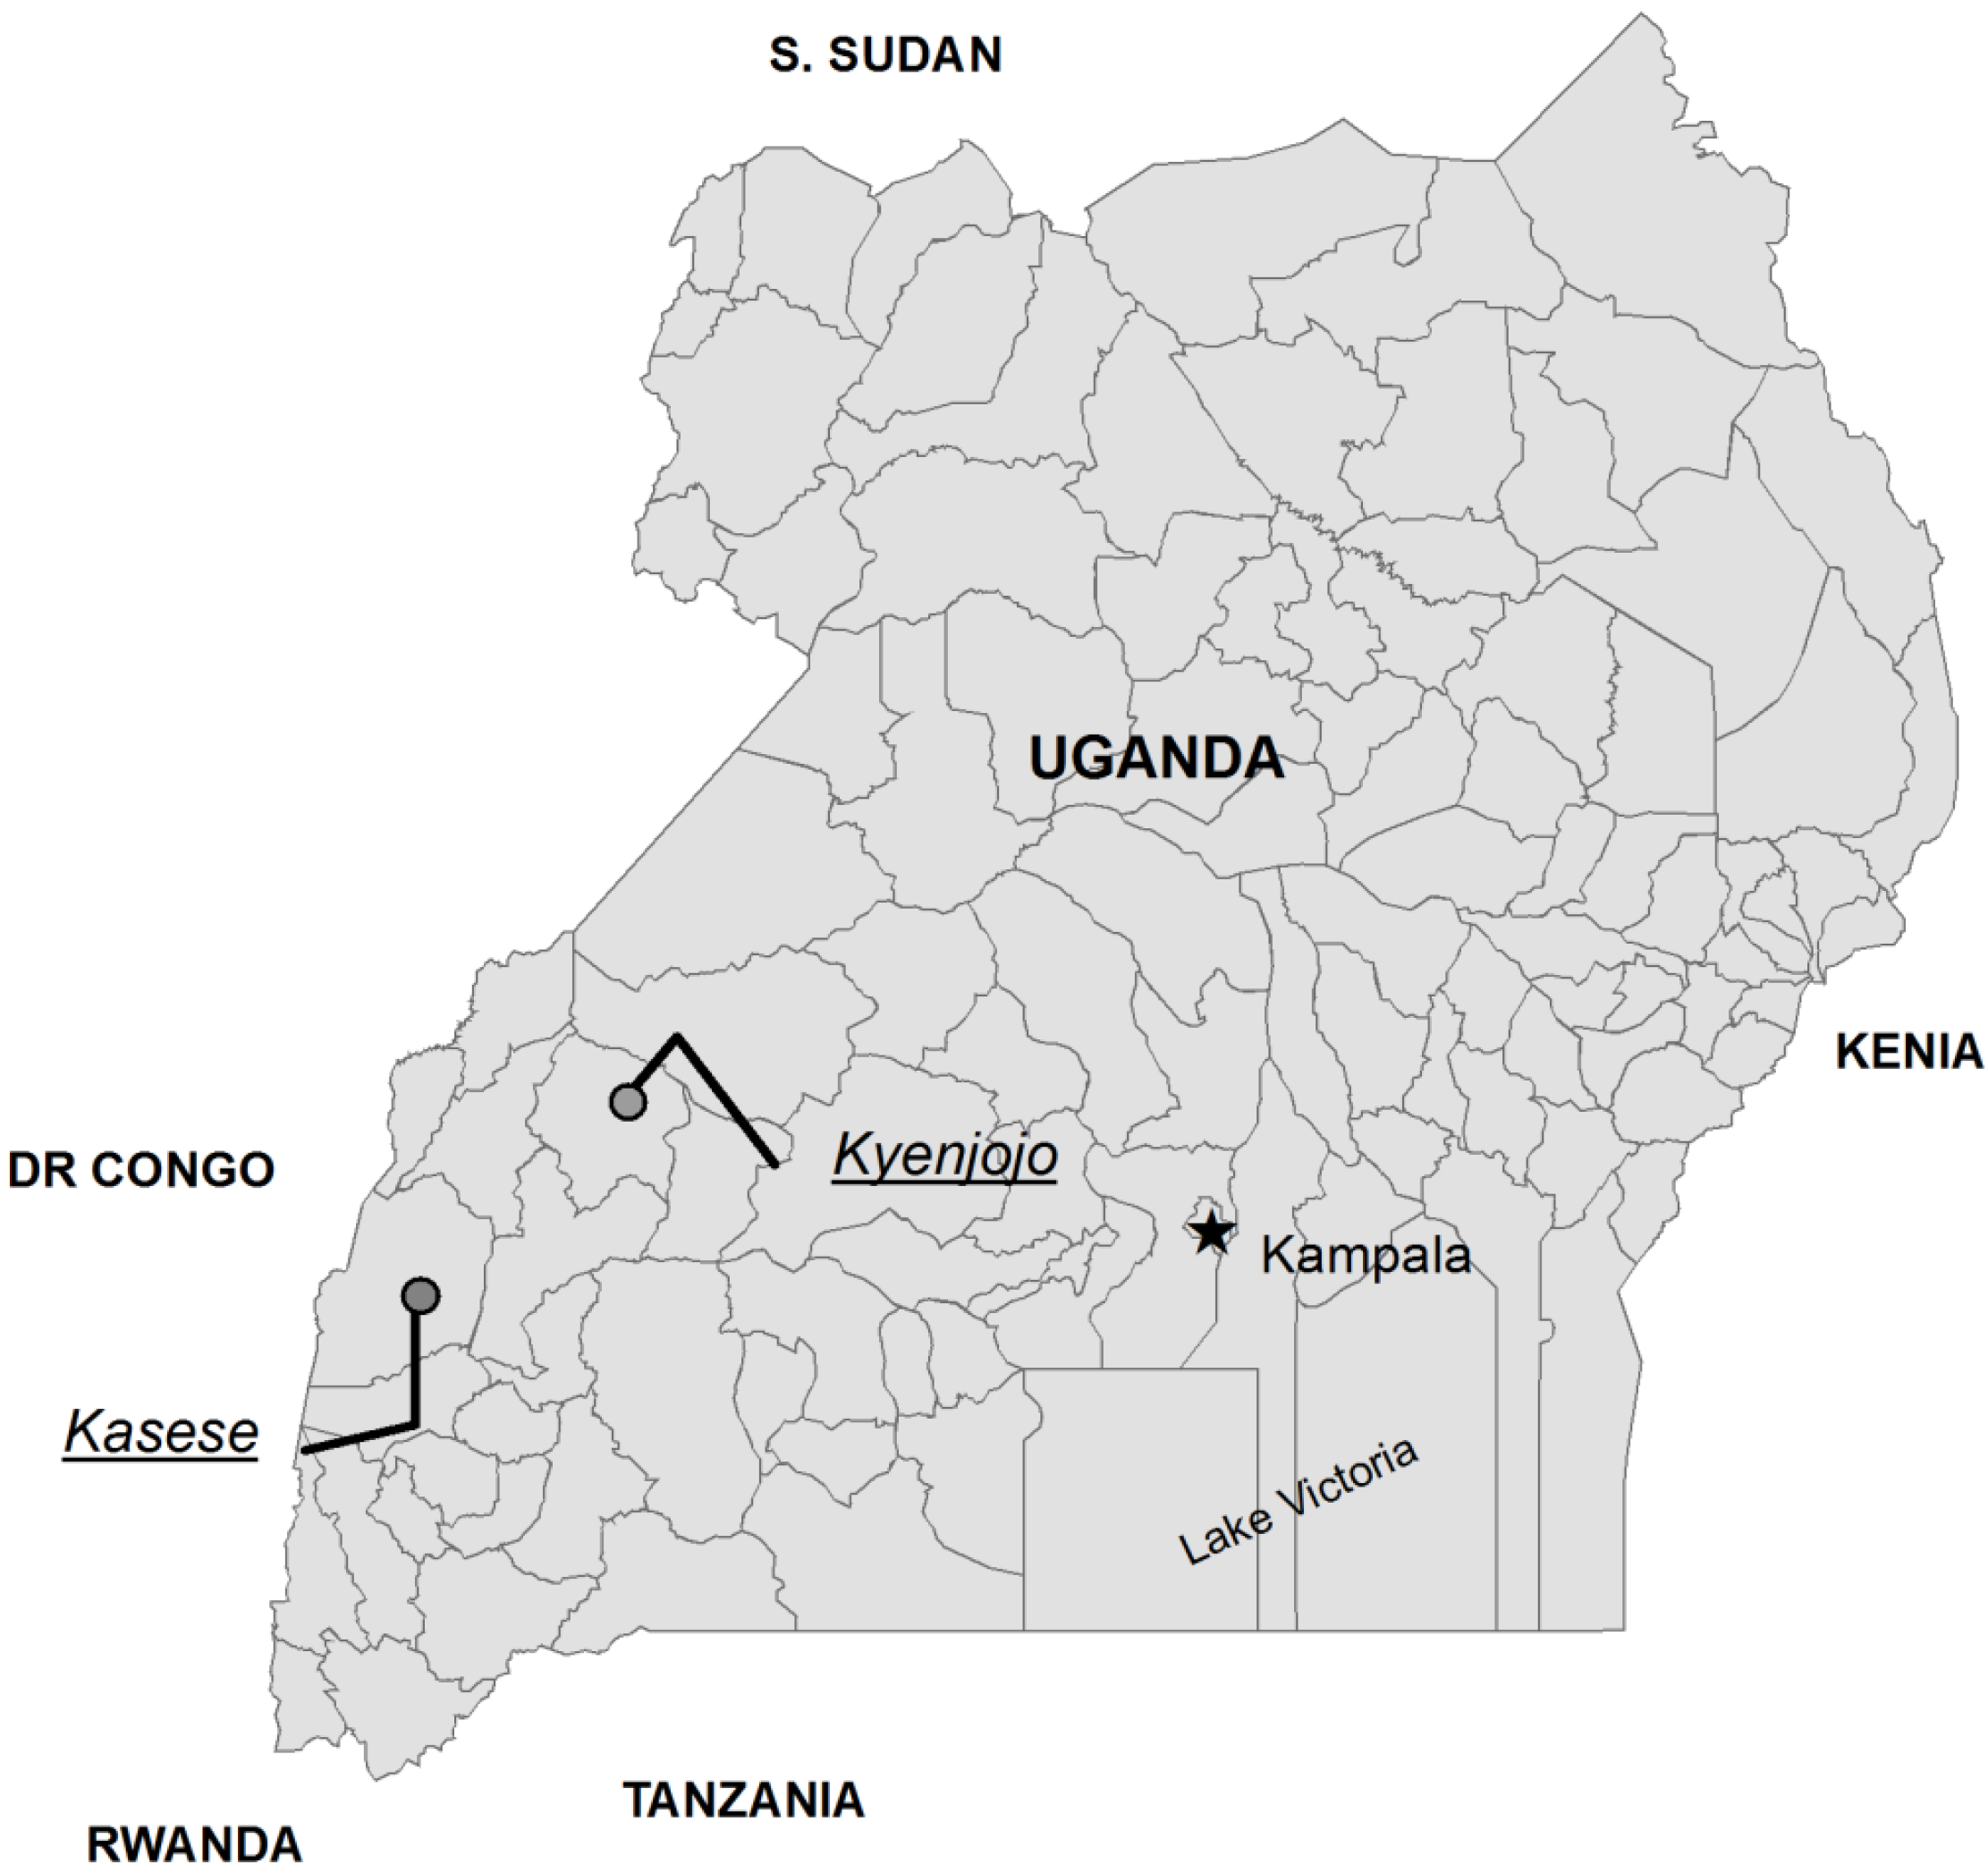
2.1. Study Setting
2.2. BTC’s PBF Intervention
2.3. Data Collection and Analysis
2.4. Causal Loop Analysis
2.5. Limitations
3. Results
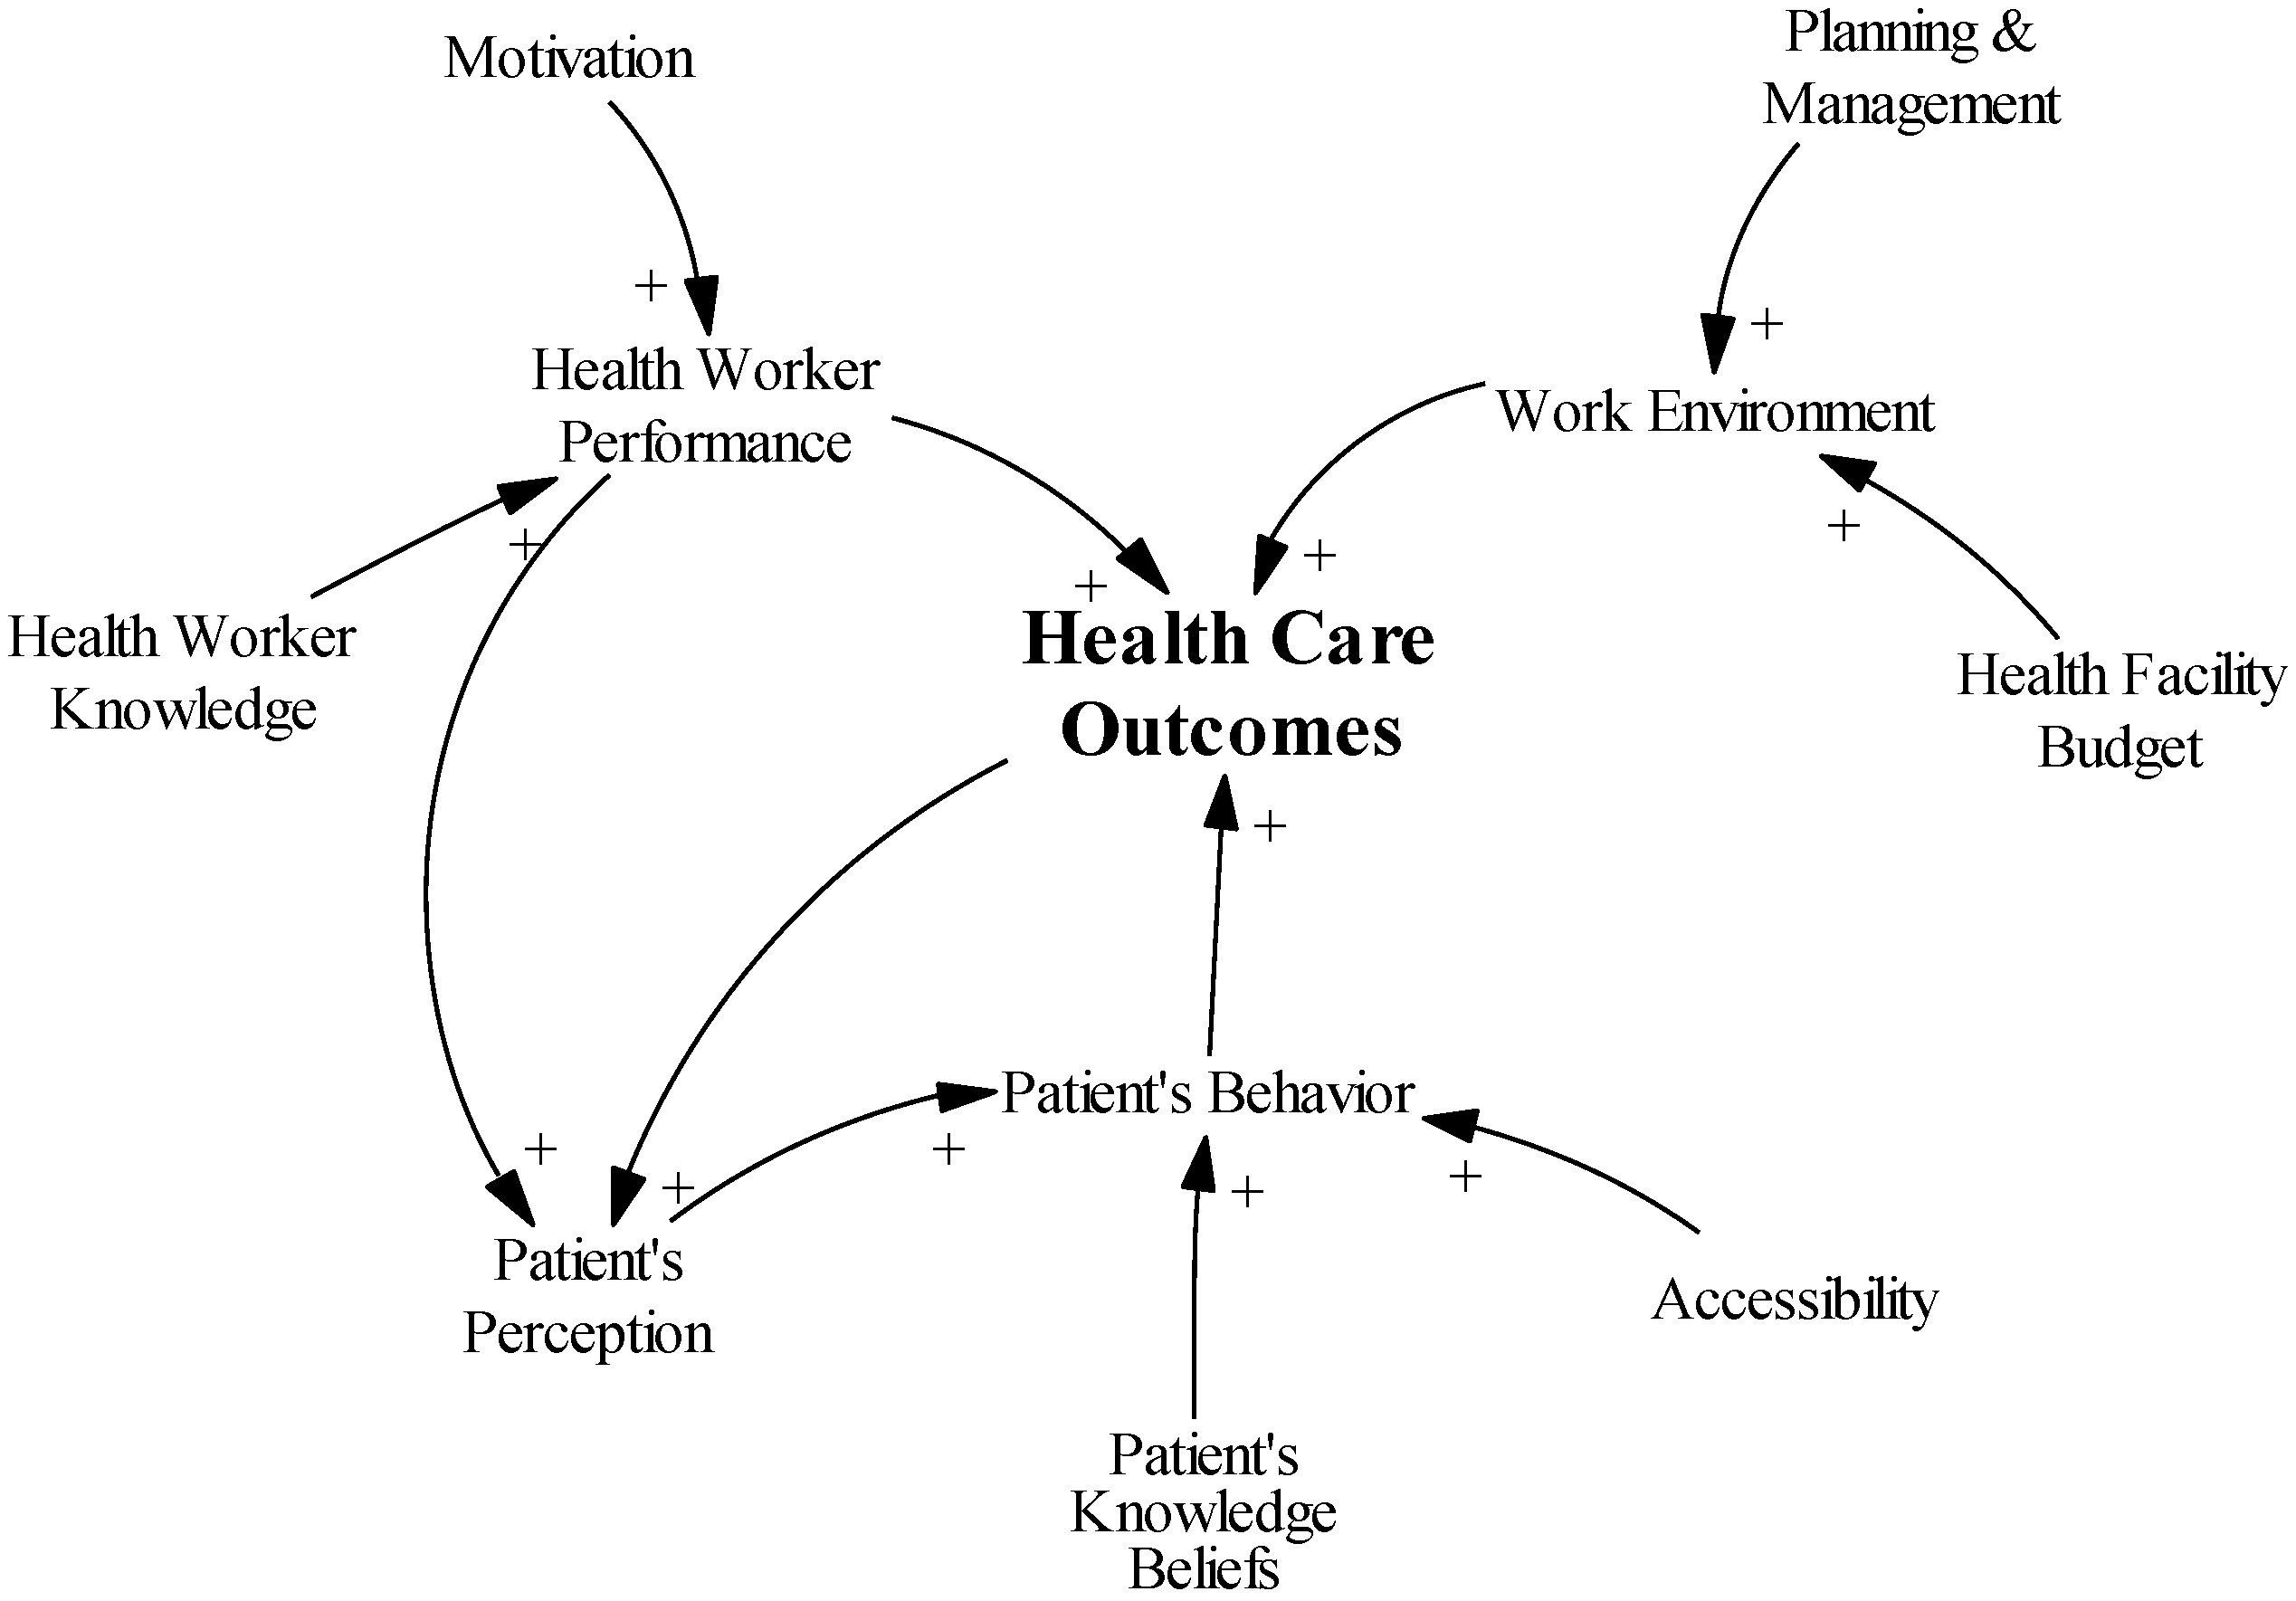
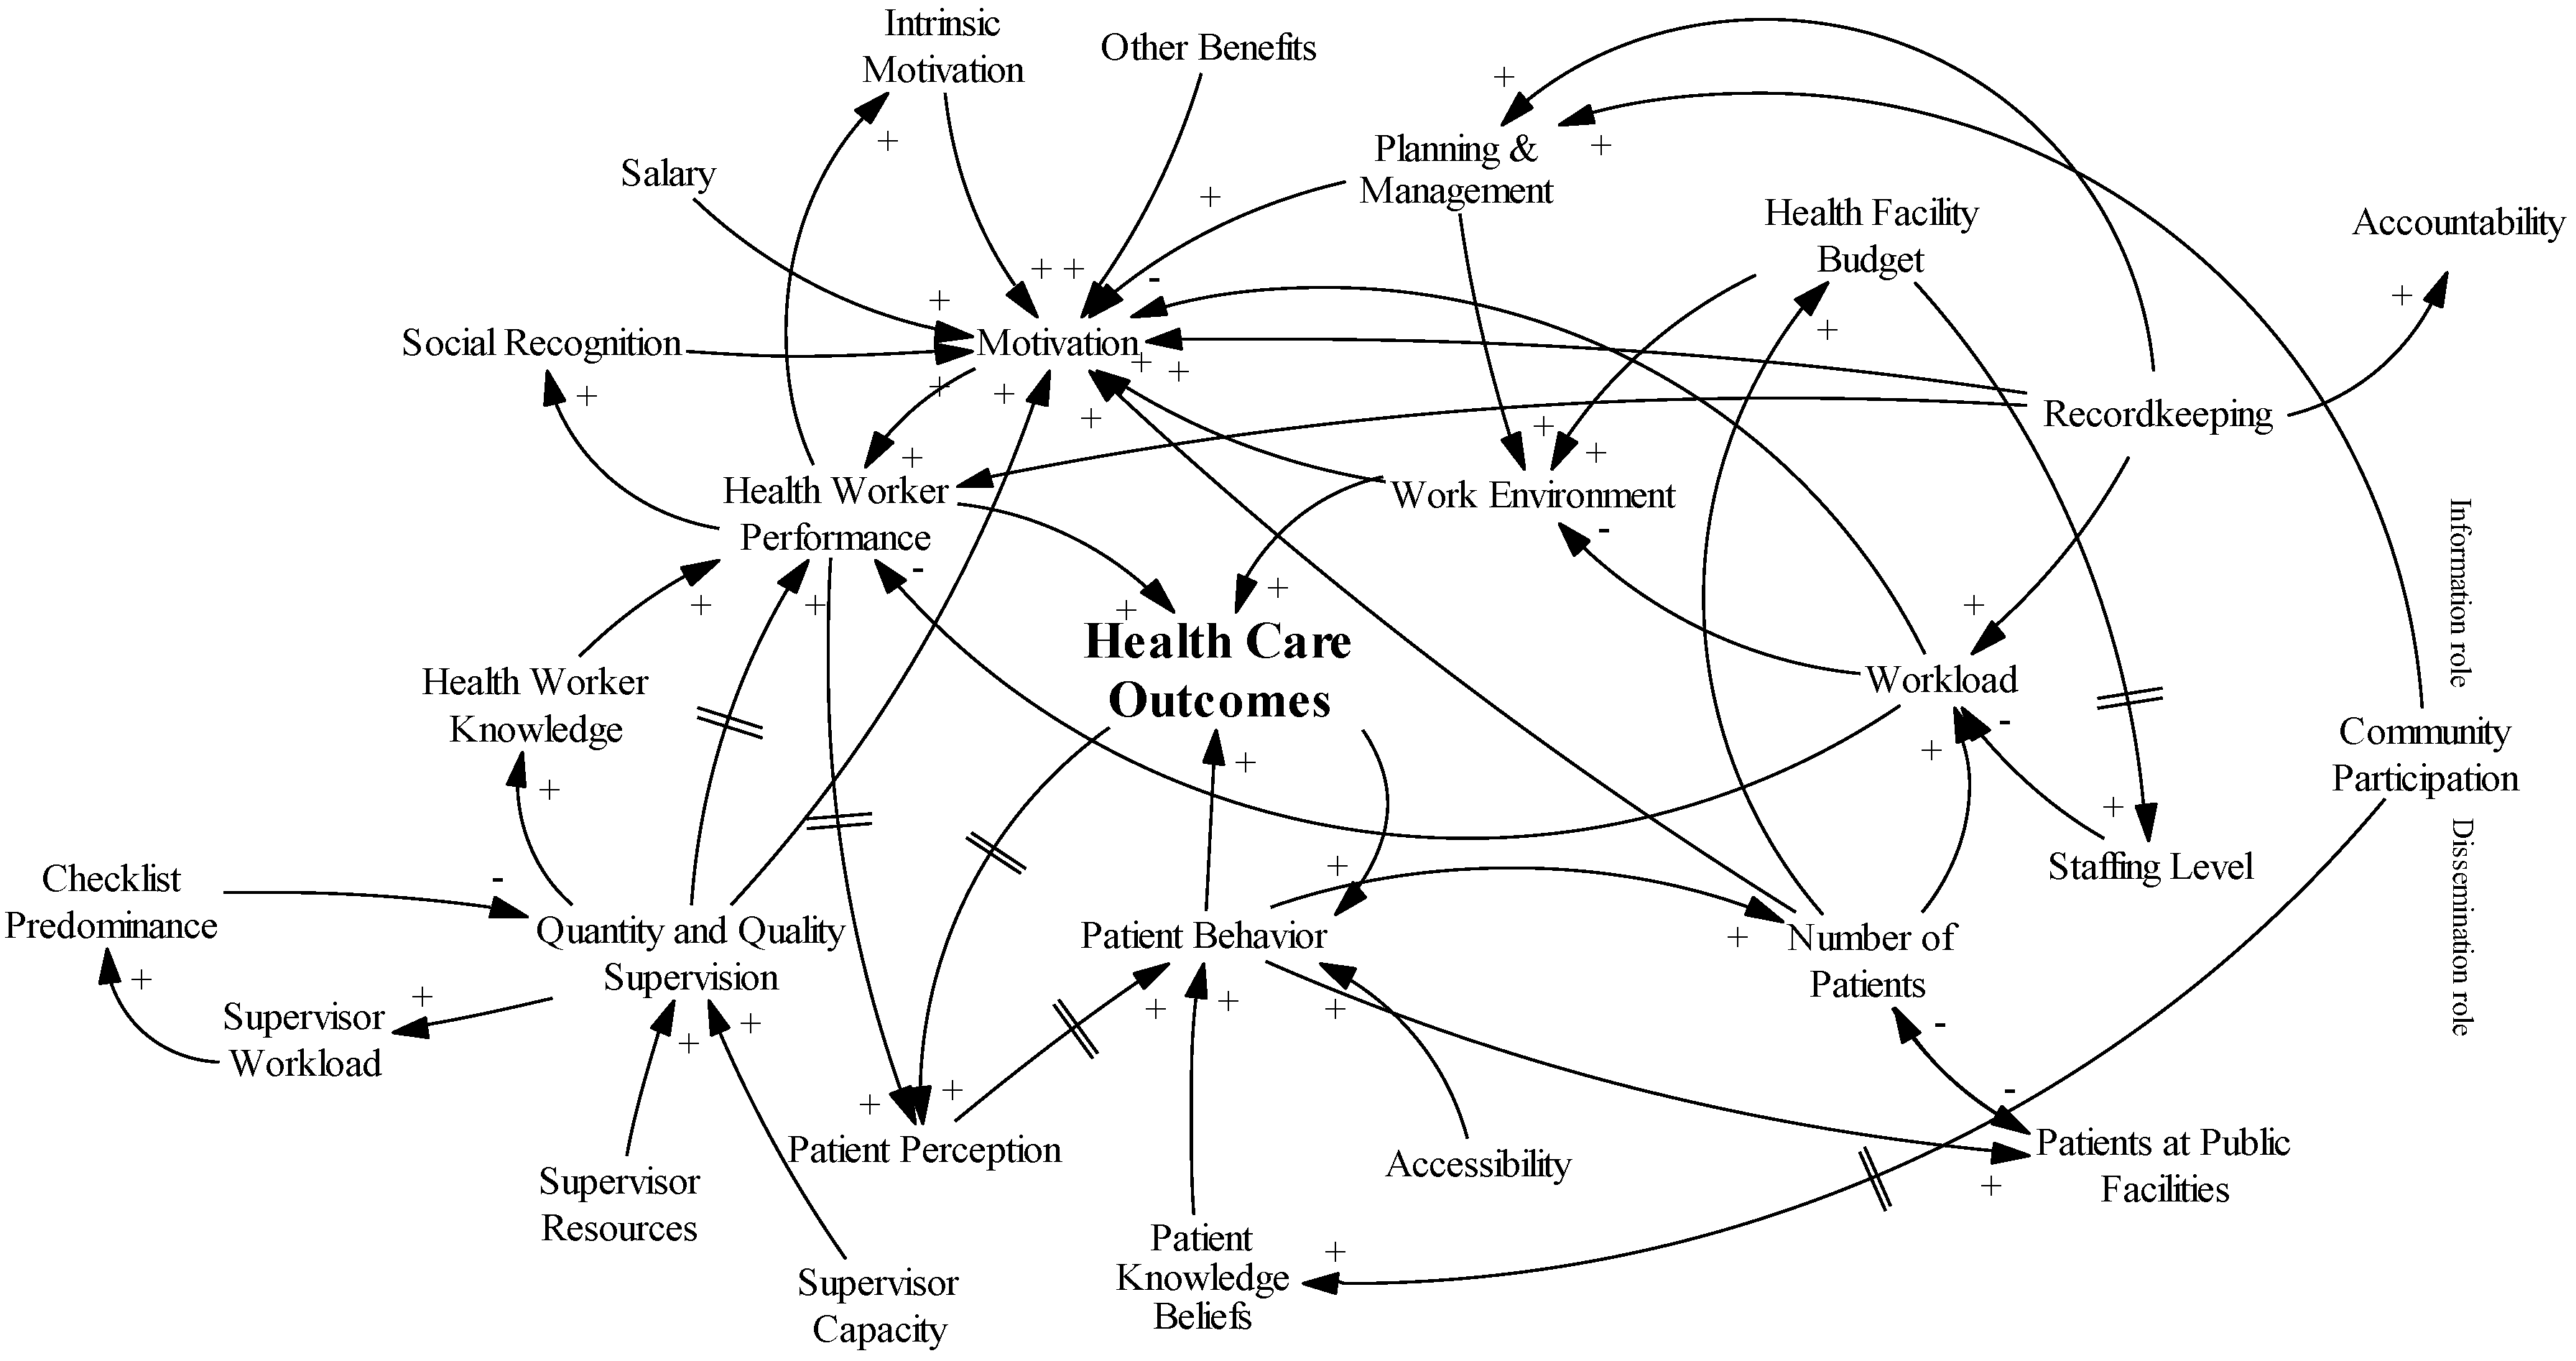
3.1. CLD Set-Up
3.2. Motivation
“I wouldn’t say we are extremely happy with what we are paid.”(Resp. 2 Clinical Officer)
“I feel good when I’m putting on my white… (LAUGHS) and the way I am serving patients and the way how the community is appreciating…”(Resp. 21 Nurse)
“Those incentives are good. They are good, but we do not have them […] They are good because they improve on one’s motivation.”(Resp. 14 Nurse)
“Of course government sector is the best because of their payment. They can also give you a study leave.”(Resp. 21 Nurse)
3.3. Recordkeeping
“It helps us in planning. It helps us in making decisions—like we are able to know that we have such a number of patients […] who will need such an amount of treatment or drugs.”(Resp. 6 Nursing Officer)
“We have to keep it to show that we are working.”(Resp. 20 Nurse)
“[O]nly sometimes the challenging part of it is when you are overloaded with work […] but in general the data, the way we are collecting it, doesn't need much effort or time.”(Resp. 11 Midwife)
3.4. Supervision
“Supervision helps us to improve on the quality of work.”(Resp. 11 Midwife)
“Others […] They just come and give you a talk and they go [without] even checking what has gone wrong and correct you.”(Resp. 19 Nursing Officer)
“It is so encouraging like when I am doing work and they come in to supervise me and tell me I'm doing a good work.”(Resp. 10 Clinical Officer)
3.5. Community Participation
“No, they should have less [decision power] simply because they are not the technical persons.”(Resp. 14 Nurse)
3.6. Working Environment
“[T]oday I have seen only two people […], so if there are supposed to be two health workers on duty, you cannot both come to see two people.”(Resp. 5 Clinical Officer)
“I will give an example of the maternity ward. You find someone is attending to a mother in labor, soon you find that the one at [the delivery] is the one who is supposed to attend to those who have already delivered. So the work that should be done by four people is being done by one person.”(Resp. 2 Clinical Officer)
“[I]f those sets are not there we improvise with the […] razor blade.”(Resp. 17 Nurse)
3.7. Maternal Mortality
“[T]he crises of money […] they get anemia, malnutrition which can complicate labor, they can end up dying.”(Resp. 13 Nurse)
“They have their traditional beliefs […], they are those with a rigid mind even though you teach, they will become stubborn.”(Resp. 19 Nursing Officer)
“[P]eople come from mountainous areas and you find the transportation itself being bad, and ambulance services still low.”(Resp. 11 Midwife)
“Also health workers, they are there who are quarrelsome to mothers. And you find that the mothers fear to express the way she is feeling.”(Resp. 4 Midwife)
3.8. Introducing the PBF Intervention
3.9. Causal Loop Analysis
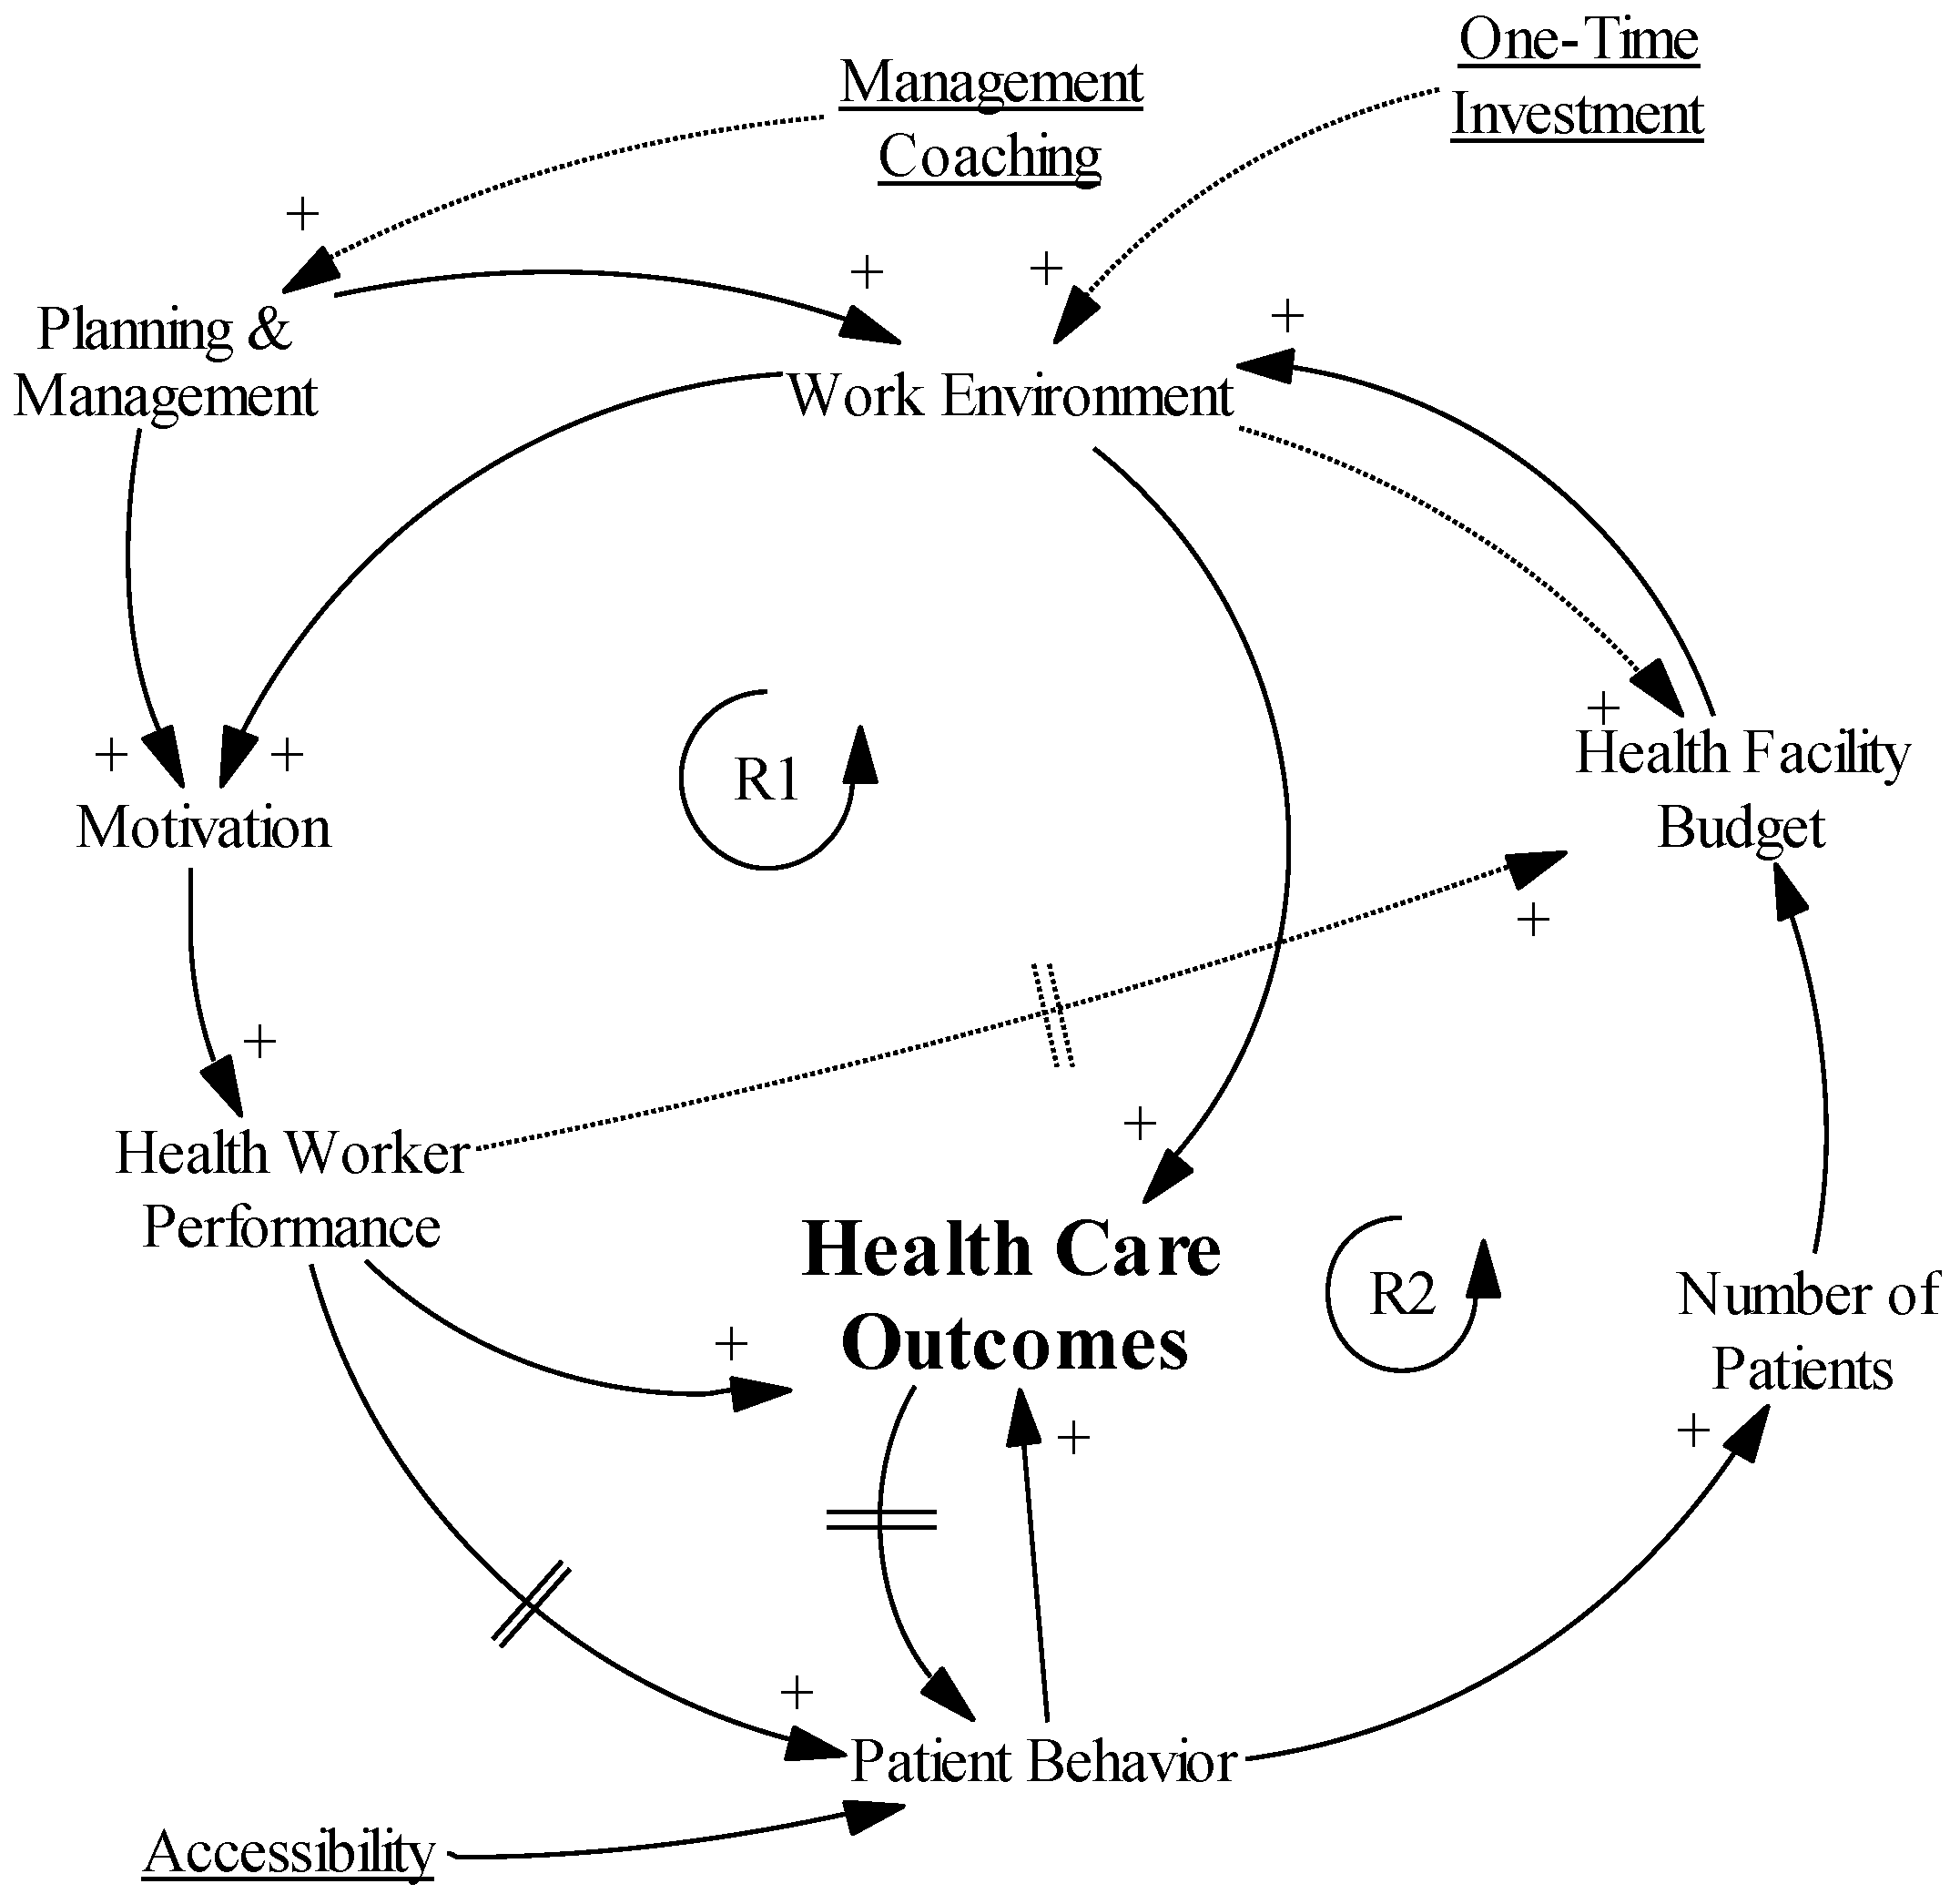
3.9.1. Hypothesis 1: “Success to the Successful”
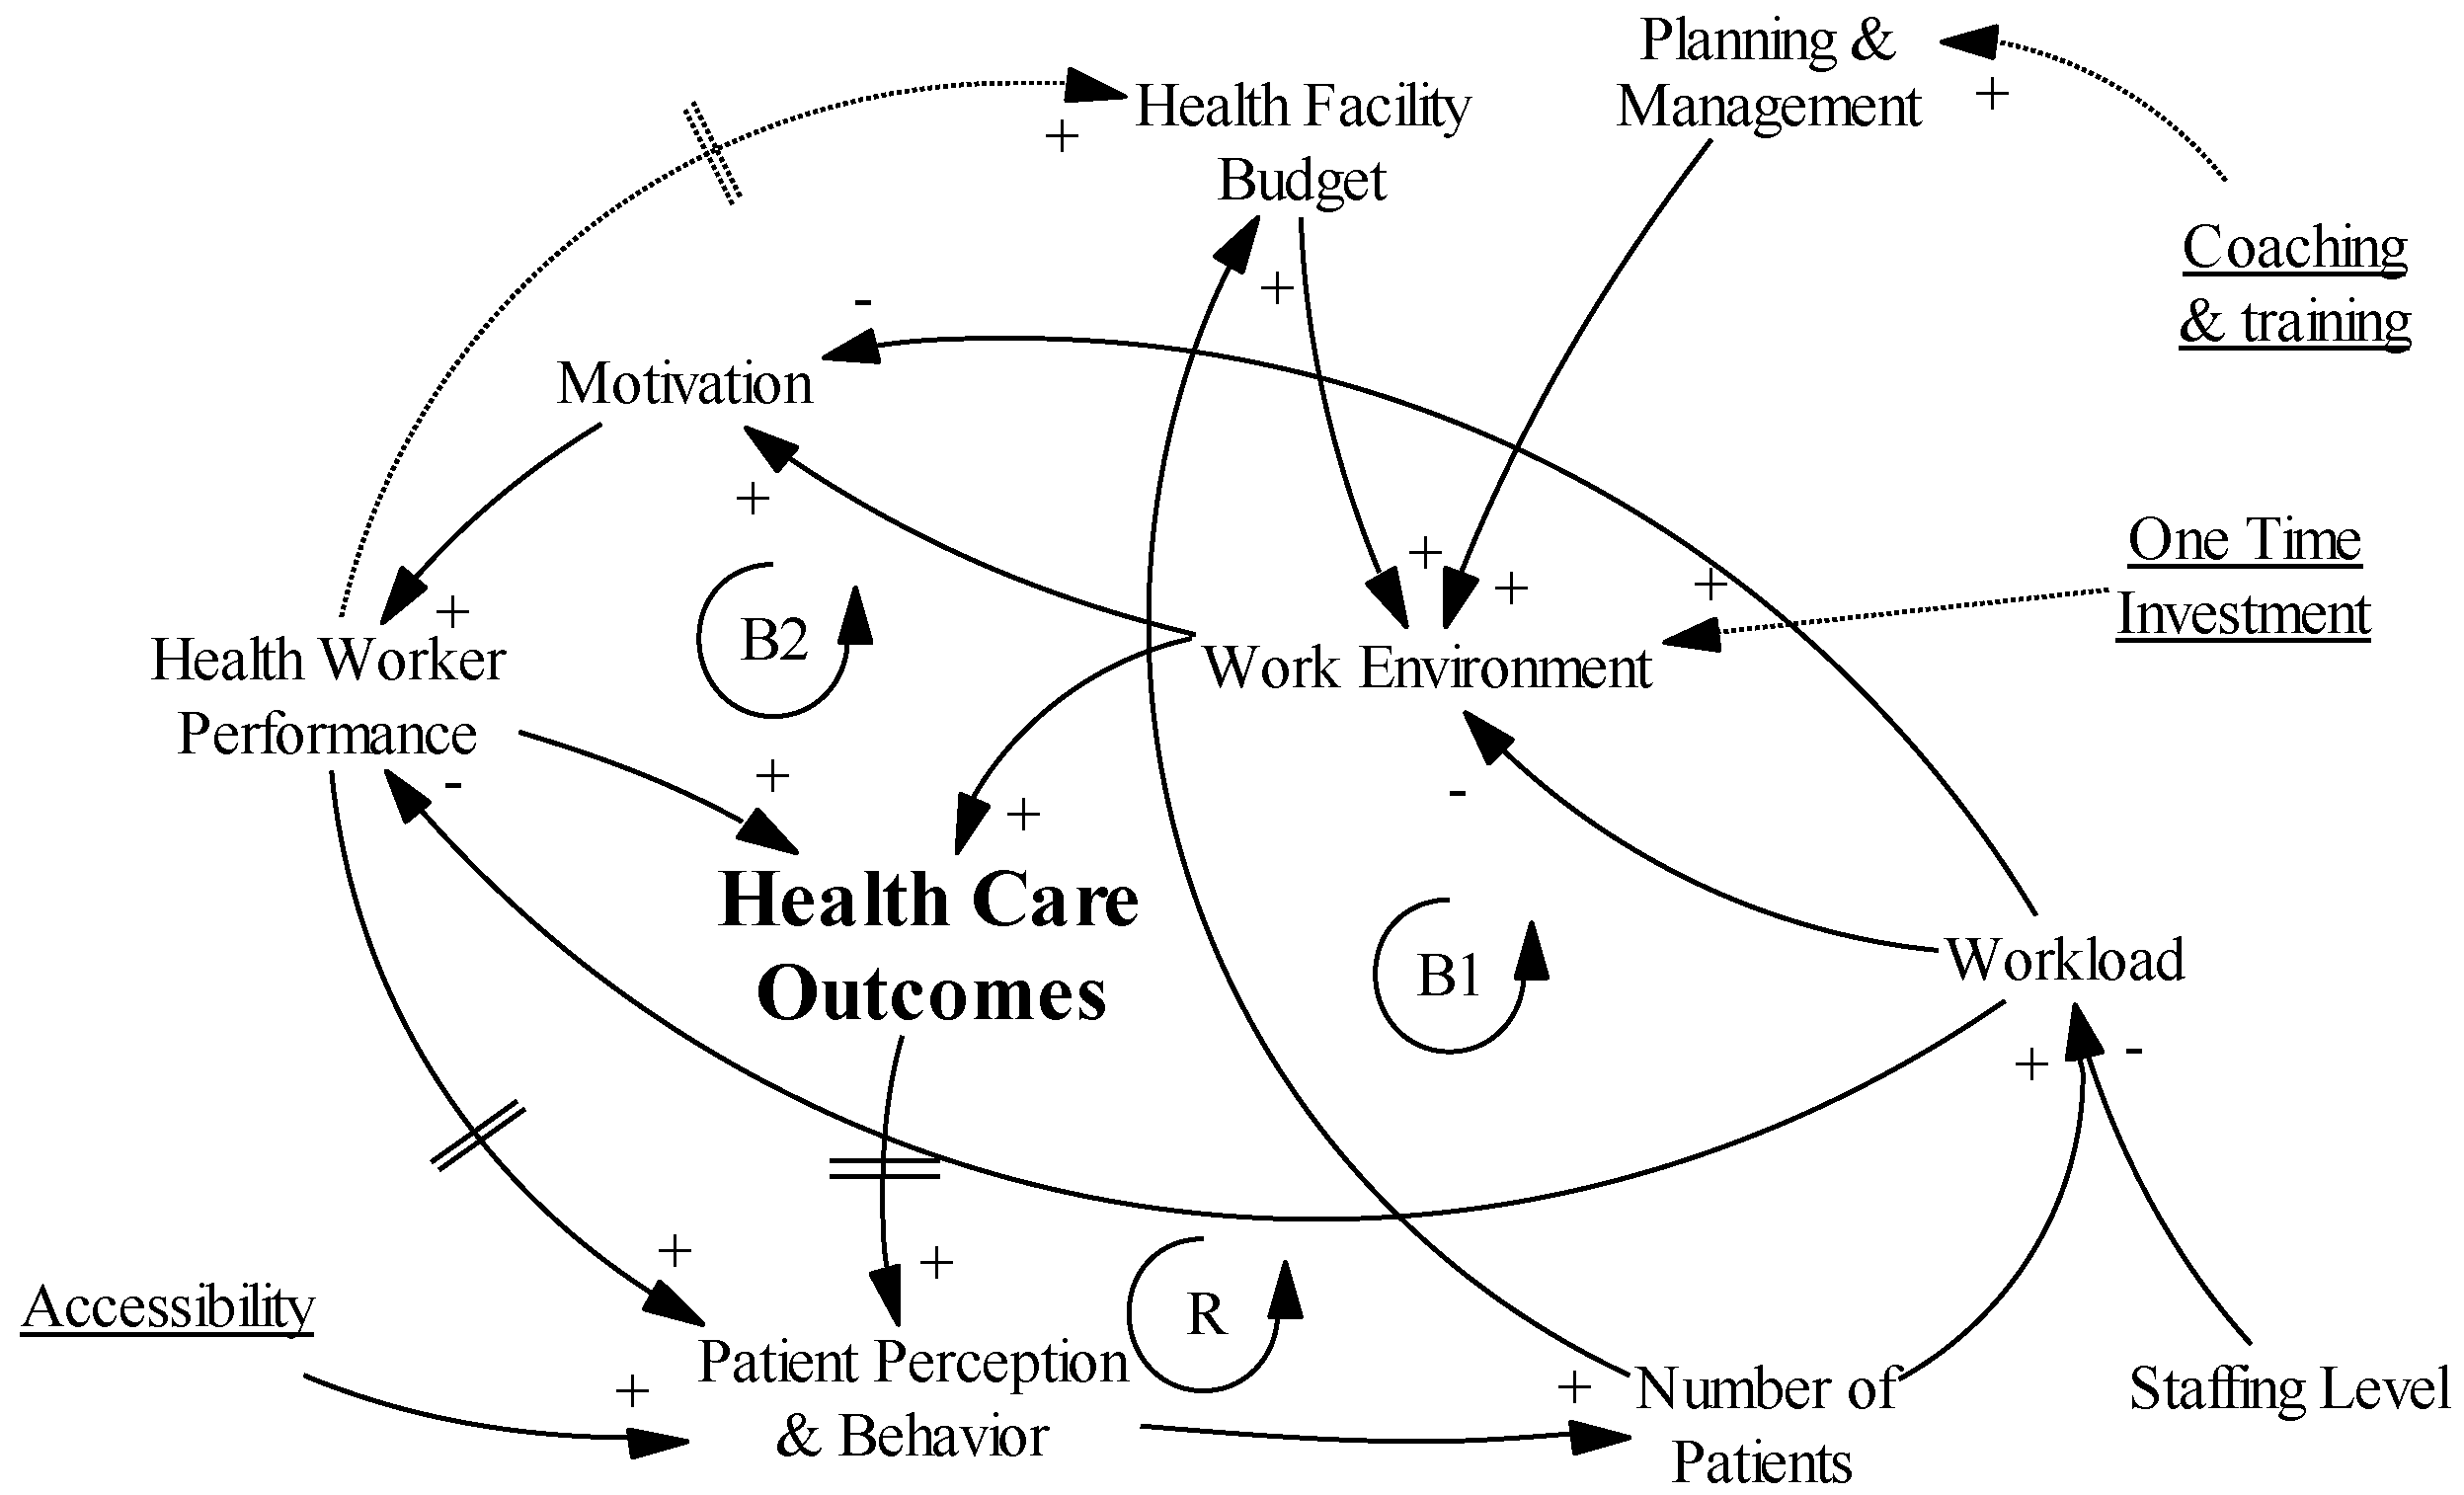
3.9.2. Hypothesis 2: “Growth and Underinvestment”
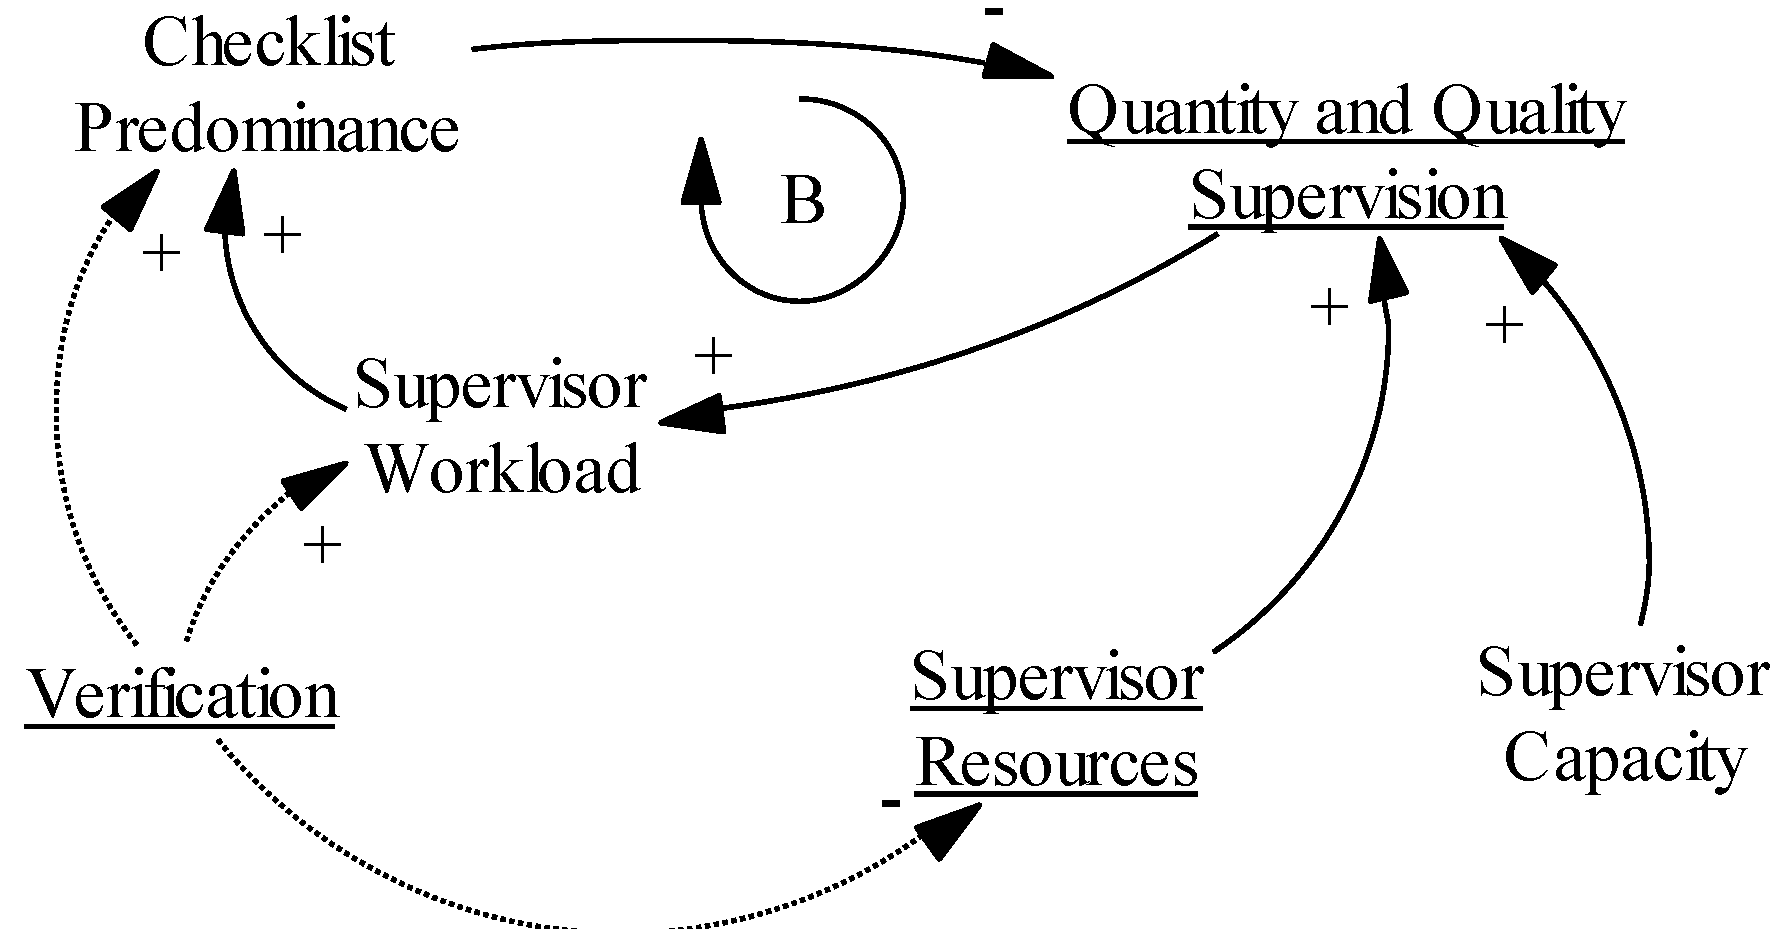
3.9.3. Hypothesis 3: “the Supervision Conundrum”
4. Discussion
5. Conclusions
Supplementary Materials
Acknowledgments
Author Contributions
Conflicts of Interest
References
- World Health Organization. Universal Health Coverage: Supporting Country Needs; World Health Organization (WHO): Geneva, Switzerland, 2013. [Google Scholar]
- Gerrits, L.; Verweij, S. Taking stock of complexity in evaluation: A discussion of three recent publications. Evaluation 2015, 21, 481–491. [Google Scholar] [CrossRef]
- Mustafa, F.A. Notes on the use of randomised controlled trials to evaluate complex interventions: Community treatment orders as an illustrative case. J. Eval. Clin. Pract. 2017, 23, 185–192. [Google Scholar] [CrossRef] [PubMed]
- Sanson-Fisher, R.W.; Bonevski, B.; Green, L.W.; D’Este, C. Limitations of the randomized controlled trial in evaluating population-based health interventions. Am. J. Prev. Med. 2007, 33, 155–161. [Google Scholar] [CrossRef] [PubMed]
- Craig, P.; Dieppe, P.; Macintyre, S.; Michie, S.; Nazareth, I.; Petticrew, M. Developing and evaluating complex interventions: The new medical research council guidance. BMJ 2008, 337, a1655. [Google Scholar] [CrossRef] [PubMed] [Green Version]
- Rogers, P.J. Using programme theory to evaluate complicated and complex aspects of interventions. Evaluation 2008, 14, 29–48. [Google Scholar] [CrossRef]
- Pawson, R. The Science of Evaluation: A Realist Manifesto; Sage Publications: London, UK, 2013. [Google Scholar]
- Pawson, R.; Tilley, N. Realistic Evaluation; Sage: London, UK, 1997. [Google Scholar]
- Van Belle, S.; Marchal, B.; Dubourg, D.; Kegels, G. How to develop a theory-driven evaluation design? Lessons learned from an adolescent sexual and reproductive health programme in West Africa. BMC Public Health 2010, 10, 741. [Google Scholar] [CrossRef] [PubMed]
- Chen, H.T. Theory-Driven Evaluations; Sage: London, UK, 1990. [Google Scholar]
- De Savigny, D.; Taghreed, A. Systems Thinking for Health Systems Strengthening; Alliance for Health Policy and Systems Research; WHO: Geneva, Switzerland, 2009. [Google Scholar]
- Adam, T.; de Savigny, D. Systems thinking for strengthening health systems in LMICs: Need for a paradigm shift. Health Policy Plan. 2012, 27, iv1–iv3. [Google Scholar] [CrossRef] [PubMed]
- Chen, H.T. Theory-driven evaluation: Conceptual framework, application and advancement. In Evaluation von Programmen und Projekten für eine Demokratische Kultur; Strobl, R., Lobermeier, O., Eds.; Springer Fachmedien: Wiesbaden, Germany, 2012; pp. 17–40. [Google Scholar]
- Chibanda, D.; Verhey, R.; Munetsi, E.; Cowan, F.M.; Lund, C. Using a theory driven approach to develop and evaluate a complex mental health intervention: The friendship bench project in Zimbabwe. Int. J. Ment. Health Syst. 2016, 10, 16. [Google Scholar] [CrossRef] [PubMed] [Green Version]
- Nayiga, S.; DiLiberto, D.; Taaka, L.; Nabirye, C.; Haaland, A.; Staedke, S.G.; Chandler, C.I. Strengthening patient-centred communication in rural Ugandan health centres: A theory-driven evaluation within a cluster randomized trial. Evaluation 2014, 20, 471–491. [Google Scholar] [CrossRef] [PubMed]
- Fujita, N. Beyond Logframe; Using Systems Concepts in Evaluation; Foundation for Advanced Studies on International Development: Tokyo, Japan, 2010. [Google Scholar]
- Rogers, P.J.; Williams, B.; FASID. Using systems concepts in evaluation—A dialogue with Patricia Rogers and Bob Williams. In Beyond Logframe; Using Systems Concepts in Evaluation; Fujita, N., Ed.; Foundation for Advanced Studies on International Development: Tokyo, Japan, 2010; pp. 55–74. [Google Scholar]
- Williams, B. Systems thinking and capacity development in the international arena. In Beyond Logframe; Using Systems Concepts in Evaluation; Fujita, N., Ed.; Foundation for Advanced Studies on International Development: Tokyo, Japan, 2010; pp. 35–54. [Google Scholar]
- Forrester, J.W. Industrial Dynamics; MIT Press: Cambridge, MA, USA, 1961. [Google Scholar]
- Senge, P.M. The Fifth Discipline: The Art and Practice of the Learning Organization; Doubleday/Currency: New York, NY, USA, 1990. [Google Scholar]
- Rwashana, A.S.; Nakubulwa, S.; Nakakeeto-Kijjambu, M.; Adam, T. Advancing the application of systems thinking in health: Understanding the dynamics of neonatal mortality in Uganda. Health Res. Policy Syst. 2014, 12, 36. [Google Scholar] [CrossRef] [PubMed]
- Van Wietmarschen, H.A.; Wortelboer, H.M.; van der Greef, J. Grip on health: A complex systems approach to transform health care. J. Eval. Clin. Pract. 2016. [Google Scholar] [CrossRef] [PubMed]
- Sarriot, E.; Morrow, M.; Langston, A.; Weiss, J.; Landegger, J.; Tsuma, L. A causal loop analysis of the sustainability of integrated community case management in Rwanda. Soc. Sci. Med. 2015, 131, 147–155. [Google Scholar] [CrossRef] [PubMed]
- Deconinck, H. Understanding Pathways of Integrating Severe Acute Malnutrition Interventions into National Health Systems in Low-Income Countries: Applying Systems Thinking to Study the Complexity of Health Systems. PhD Thesis, Université Catholique de Louvain, Louvain-la-Neuve, Belgium, 2017. [Google Scholar]
- Lane, D.C. The emergence and use of diagramming in system dynamics: A critical account. Syst. Res. Behav. Sci. 2008, 25, 3–23. [Google Scholar] [CrossRef]
- Doyle, J.K.; Ford, D.N. Mental models concepts for system dynamics research. Syst. Dyn. Rev. 1998, 14, 3–29. [Google Scholar] [CrossRef]
- Renmans, D.; Holvoet, N.; Criel, B.; Meessen, B. Performance-based financing: The same is different. Health Policy Plan. 2017, 32, 860–868. [Google Scholar] [CrossRef] [PubMed]
- Basinga, P.; Gertler, P.J.; Binagwaho, A.; Soucat, A.L.B.; Sturdy, J.; Vermeersch, C.M.J. Effect on maternal and child health services in Rwanda of payment to primary health-care providers for performance: An impact evaluation. Lancet 2011, 377, 1421–1428. [Google Scholar] [CrossRef]
- Witter, S.; Fretheim, A.; Kessy, F.L.; Lindahl, A.K. Paying for performance to improve the delivery of health interventions in low- and middle-income countries. Cochrane Database Syst. Rev. 2012, 2, Cd007899. [Google Scholar]
- Renmans, D.; Holvoet, N.; Orach, C.G.; Criel, B. Opening the ‘black box’ of performance-based financing in low- and lower middle-income countries: A review of the literature. Health Policy Plan. 2016, 31, 1297–1309. [Google Scholar] [CrossRef] [PubMed]
- Macq, J.; Chiem, J.-C. Looking at the effects of performance-based financing through a complex adaptive systems lens. Bull. World Health Organ. 2011, 89, 699–700. [Google Scholar] [CrossRef] [PubMed]
- Marchal, B.; Dedzo, M.; Kegels, G. A realist evaluation of the management of a well-performing regional hospital in Ghana. BMC Health Serv. Res. 2010, 10, 24. [Google Scholar] [CrossRef] [PubMed]
- Republic of Uganda. Millennium Development Goals Report for Uganda 2015; Special theme: Results, reflections and the way forward; Ministry of Finance, Planning and Economic Development: Kampala, Uganda, 2015.
- Ssennyonjo, A. RBF in Uganda: Ready for take-off this time? In Health Financing in Africa: Le blog; Available online: http://www.healthfinancingafrica.org/home/rbf-in-uganda-ready-for-take-off-this-time (accessed on 3 October 2015).
- Ministry of Health; Health Systems 20/20; Makerere University School of Public Health. Uganda Health System Assessment 2011; Health Systems 20/20 project; Abt Associates Inc.: Kampala, Uganda; Bethesda, MD, USA, 2012.
- World Health Organization. World Health Statistics 2016: Monitoring Health for the SDGs, Sustainable Development Goals; 9241565268; WHO: Geneva, Switzerland, 2016. [Google Scholar]
- Boulenger, D.; Criel, B. The relationship between faith-based health care organisations and the public sector in sub-Saharan Africa: The case of contracting experiences in Cameroon, Tanzania, Chad and Uganda. Stud. Health Serv. Organ. Policy 2012, 29, 232. [Google Scholar]
- Olivier, J.; Tsimpo, C.; Gemignani, R.; Shojo, M.; Coulombe, H.; Dimmock, F.; Nguyen, M.C.; Hines, H.; Mills, E.J.; Dieleman, J.L.; et al. Understanding the roles of faith-based health-care providers in Africa: Review of the evidence with a focus on magnitude, reach, cost, and satisfaction. Lancet 2015, 386, 1765–1775. [Google Scholar] [CrossRef]
- Dambisya, Y.M.; Manenzhe, M.; Kibwika-Muyinda, A.B. Faith-Based Health Services as an Alternative to Privatization? A Ugandan Case Study; Occasional Paper; Municipal Services Project: Belville, South Africa, 2014. [Google Scholar]
- Uganda Bureau of Statistics. The National Population and Housing Census 2014—Main Report; Ugandan Ministry of Health: Kampala, Uganda, 2016.
- Donaldson, S.I. Theory-driven program evaluation in the new millennium. In Evaluating Social Programs and Problems: Visions for the New Millennium; Donaldson, S.I., Scriven, M., Eds.; Erlbaum: Mahwah, NJ, USA, 2003; pp. 109–141. [Google Scholar]
- Das, A.; Gopalan, S.S.; Chandramohan, D. Effect of pay for performance to improve quality of maternal and child care in low- and middle-income countries: A systematic review. BMC Public Health 2016, 16, 321. [Google Scholar] [CrossRef] [PubMed]
- Gergen, J.; Josephson, E.; Coe, M.; Ski, S.; Madhavan, S.; Bauhoff, S. Quality of care in performance-based financing: How it is incorporated in 32 programs across 28 countries. Glob. Health Sci. Pract. 2017, 5, 90–107. [Google Scholar] [CrossRef] [PubMed]
- Maestad, O.; Torsvik, G.; Aakvik, A. Overworked? On the relationship between workload and health worker performance. J. Health Econ. 2010, 29, 686–698. [Google Scholar] [CrossRef] [PubMed]
- Gildemyn, M. Towards an Understanding of Civil Society Organisations’ Involvement in Monitoring and Evaluation: Unpacking the Accountability and Feedback Function of M&E; IOB Discussion Paper; IOB: Antwerp, Belgium, 2011. [Google Scholar]
- Zakumumpa, H.; Taiwo, M.O.; Muganzi, A.; Ssengooba, F. Human resources for health strategies adopted by providers in resource-limited settings to sustain long-term delivery of art: A mixed-methods study from Uganda. Hum. Res. Health 2016, 14, 63. [Google Scholar] [CrossRef] [PubMed]
- Ugandan Ministry of Health. Human Resources for Health Information System: National District Health Staff Records. Available online: http://hris.health.go.ug/ (accessed on 25 October 2016).
- Meessen, B.; Soucat, A.L.B.; Sekabaraga, C. Performance-based financing: Just a donor fad or a catalyst towards comprehensive health-care reform? Bull. World Health Organ. 2011, 89, 153–156. [Google Scholar] [CrossRef] [PubMed]
- Bhatnagar, A.; George, A.S. Motivating health workers up to a limit: Partial effects of performance-based financing on working environments in Nigeria. Health Policy Plan. 2016, 31, 868–877. [Google Scholar] [CrossRef] [PubMed]
- Kim, D.H. Systems Archetypes I: Diagnosing Systemic Issues and Designing High-Leverage Interventions; 1883823005; Pegasus Communications: Waltham, MA, USA, 1992. [Google Scholar]
- Ogundeji, Y.K.; Jackson, C.; Sheldon, T.; Olubajo, O.; Ihebuzor, N. Pay for performance in Nigeria: The influence of context and implementation on results. Health Policy Plan. 2016, 31, 955–963. [Google Scholar] [CrossRef] [PubMed]
- Shen, G.C.; Nguyen, H.T.H.; Das, A.; Sachingongu, N.; Chansa, C.; Qamruddin, J.; Friedman, J. Incentives to change: Effects of performance-based financing on health workers in Zambia. Hum. Res. Health 2017, 15, 20. [Google Scholar] [CrossRef] [PubMed]
- Lannes, L. Improving health worker performance: The patient-perspective from a PBF program in Rwanda. Soc. Sci. Med. 2015, 138, 1–11. [Google Scholar] [CrossRef] [PubMed] [Green Version]
- Anselmi, L.; Binyaruka, P.; Borghi, J. Understanding causal pathways within health systems policy evaluation through mediation analysis: An application to payment for performance (P4P) in Tanzania. Implement. Sci. 2017, 12, 10. [Google Scholar] [CrossRef] [PubMed]
- Bertone, M.P.; Meessen, B. Studying the link between institutions and health system performance: A framework and an illustration with the analysis of two performance-based financing schemes in Burundi. Health Policy Plan. 2013, 28, 847–857. [Google Scholar] [CrossRef] [PubMed]
- Ngo, D.K.; Sherry, T.B.; Bauhoff, S. Health system changes under pay-for-performance: The effects of Rwanda’s national programme on facility inputs. Health Policy Plan. 2017, 32, 11–20. [Google Scholar] [CrossRef] [PubMed]
- Kalk, A.; Paul, F.A.; Grabosch, E. Paying for performance’ in Rwanda: Does it pay off? Trop. Med. Int. Health 2010, 15, 182–190. [Google Scholar] [CrossRef] [PubMed]
- Ssengooba, F.; McPake, B.; Palmer, N. Why performance-based contracting failed in Uganda—An “open-box” evaluation of a complex health system intervention. Soc. Sci. Med. 2012, 75, 377–383. [Google Scholar] [CrossRef] [PubMed]
- Khim, K.; Annear, P.L. Strengthening district health service management and delivery through internal contracting: Lessons from pilot projects in Cambodia. Soc. Sci. Med. 2013, 96, 241–249. [Google Scholar] [CrossRef] [PubMed]
- Matsuoka, S.; Obara, H.; Nagai, M.; Murakami, H.; Chan Lon, R. Performance-based financing with gavi health system strengthening funding in rural Cambodia: A brief assessment of the impact. Health Policy Plan. 2014, 29, 456–465. [Google Scholar] [CrossRef] [PubMed]
- Antony, M.; Bertone, M.P.; Barthes, O. Exploring implementation practices in results-based financing: The case of the verification in Benin. BMC Health Serv. Res. 2017, 17, 204. [Google Scholar] [CrossRef] [PubMed]
- Janssen, W.; Ngirabega Jde, D.; Matungwa, M.; Van Bastelaere, S. Improving quality through performance-based financing in district hospitals in Rwanda between 2006 and 2010: A 5-year experience. Trop. Doct. 2015, 45, 27–35. [Google Scholar] [CrossRef] [PubMed]
- Mayumana, I.; Borghi, J.; Anselmi, L.; Mamdani, M.; Lange, S. Effects of payment for performance on accountability mechanisms: Evidence from Pwani, Tanzania. Soc. Sci. Med. 2017, 179, 61–73. [Google Scholar] [CrossRef] [PubMed]
- Chimhutu, V.; Lindkvist, I.; Lange, S. When incentives work too well: Locally implemented pay for performance (P4P) and adverse sanctions towards home birth in Tanzania—A qualitative study. BMC Health Serv. Res. 2014, 14, 23. [Google Scholar] [CrossRef] [PubMed] [Green Version]
- Fox, S.; Witter, S.; Wylde, E.; Mafuta, E.; Lievens, T. Paying health workers for performance in a fragmented, fragile state: Reflections from Katanga province, democratic republic of Congo. Health Policy Plan. 2014, 29, 96–105. [Google Scholar] [CrossRef] [PubMed]
- Dieleman, M.; Cuong, P.V.; Anh, L.V.; Martineau, T. Identifying factors for job motivation of rural health workers in North Vietnam. Hum. Res. Health 2003, 1, 10. [Google Scholar] [CrossRef] [PubMed]
- Bertone, M.P.; Lagarde, M.; Witter, S. Performance-based financing in the context of the complex remuneration of health workers: Findings from a mixed-method study in rural Sierra Leone. BMC Health Serv. Res. 2016, 16, 286. [Google Scholar] [CrossRef] [PubMed]
- Colenbrander, S.; Birungi, C.; Mbonye, A.K. Consensus and contention in the priority setting process: Examining the health sector in Uganda. Health Policy Plan. 2015, 30, 555–565. [Google Scholar] [CrossRef] [PubMed]
- Franco, L.M.; Bennett, S.; Kanfer, R. Health sector reform and public sector health worker motivation: A conceptual framework. Soc. Sci. Med. 2002, 54, 1255–1266. [Google Scholar] [CrossRef]
- Mathauer, I.; Imhoff, I. Health worker motivation in Africa: The role of non-financial incentives and human resource management tools. Hum. Res. Health 2006, 4, 24. [Google Scholar] [CrossRef] [PubMed]
- Hanson, K.; Jack, W. Incentives could induce Ethiopian doctors and nurses to work in rural settings. Health Affairs (Proj. Hope) 2010, 29, 1452–1460. [Google Scholar] [CrossRef] [PubMed]
- Yé, M.; Aninanya, G.A.; Sie, A.; Kakoko, D.C.; Chatio, S.; Kagone, M.; Prytherch, H.; Loukanova, S.; Williams, J.E.; Sauerborn, R. Establishing sustainable performance-based incentive schemes: Views of rural health workers from qualitative research in three sub-Saharan African countries. Rural Remote Health 2014, 14, 2681. [Google Scholar] [PubMed]
- Pirkle, C.M.; Dumont, A.; Zunzunegui, M.-V. Medical recordkeeping, essential but overlooked aspect of quality of care in resource-limited settings. Int. J. Qual. Health Care 2012, 24, 564–567. [Google Scholar] [CrossRef] [PubMed]
- Wong, R.; Bradley, E.H. Developing patient registration and medical records management system in Ethiopia. Int. J. Qual. Health Care 2009, 21, 253–258. [Google Scholar] [CrossRef] [PubMed]
- Hernandez, A.; Hurtig, A.-K.; Dahlblom, K.; San Sebastian, M. More than a checklist: A realist evaluation of supervision of mid-level health workers in rural Guatemala. BMC Health Serv. Res. 2014, 14, 112. [Google Scholar] [CrossRef] [PubMed]
- Bosch-Capblanch, X.; Garner, P. Primary health care supervision in developing countries. Trop. Med. Int. Health 2008, 13, 369–383. [Google Scholar] [CrossRef] [PubMed]
- Rujumba, J.; Tumwine, J.K.; Tylleskär, T.; Neema, S.; Heggenhougen, H.K. Listening to health workers: Lessons from eastern Uganda for strengthening the programme for the prevention of mother-to-child transmission of HIV. BMC Health Serv. Res. 2012, 12, 3. [Google Scholar] [CrossRef] [PubMed] [Green Version]
- Ossai, E.N.; Uzochukwu, B.S. Providers’ perception of quality of care and constraints to delivery of quality maternal health services in primary health centers of Enugu state, Nigeria. Int. J. Trop. Dis. Health 2015, 8, 13–24. [Google Scholar] [CrossRef]
- Chodzaza, E.; Bultemeier, K. Service providers’ perception of the quality of emergency obsteric care provided and factors identified which affect the provision of quality care. Malawi Med. J. 2010, 22, 104–111. [Google Scholar] [PubMed]
- Graner, S.; Mogren, I.; Duong, L.Q.; Krantz, G.; Klingberg-Allvin, M. Maternal health care professionals’ perspectives on the provision and use of antenatal and delivery care: A qualitative descriptive study in rural Vietnam. BMC Public Health 2010, 10, 608. [Google Scholar] [CrossRef] [PubMed]


| Kasese District | Kyenjojo District |
|---|---|
|
|
|
|
|
|
|
|
| Sex, n (%) | Ref. (%) # | |
| Male | 13 (43) | 36 |
| Female | 17 (57) | 65 |
| Cadre, n (%) | ||
| Clinical Officer | 7 (23) | 16 |
| Nursing Officer | 6 (20) | 20 |
| Nurse | 10 (33) | 38 |
| Midwife | 5 (17) | 24 |
| Records Assistant | 2 (7) | n/a |
| Facility | Respondents, n | |
| Kyenjojo District | 10 | |
| Kyakatara * | 2 | |
| Kyembogo * | 3 | |
| Mabira * | 1 | |
| Rwibale * | 2 | |
| St.-Adolf * | 2 | |
| Kasese District | 20 | |
| Buhaghura | 2 | |
| Kanamba | 2 | |
| Kasanga * | 1 | |
| Kitabu * | 3 | |
| Kinyamaseke | 0 | |
| Kyanya | 0 | |
| Kyarhumba * | 2 | |
| Maliba | 1 | |
| Musyenene | 1 | |
| Nyabugando | 3 | |
| Rwesande | 3 | |
| St.-Paul | 2 | |
| BTC | 4 |
| Ministry of Health | 4 |
| Medical bureaus (UCMB & UPMB) | 6 |
| District Health Office | 2 |
| TOTAL | 16 |
© 2017 by the authors. Licensee MDPI, Basel, Switzerland. This article is an open access article distributed under the terms and conditions of the Creative Commons Attribution (CC BY) license (http://creativecommons.org/licenses/by/4.0/).
Share and Cite
Renmans, D.; Holvoet, N.; Criel, B. Combining Theory-Driven Evaluation and Causal Loop Diagramming for Opening the ‘Black Box’ of an Intervention in the Health Sector: A Case of Performance-Based Financing in Western Uganda. Int. J. Environ. Res. Public Health 2017, 14, 1007. https://doi.org/10.3390/ijerph14091007
Renmans D, Holvoet N, Criel B. Combining Theory-Driven Evaluation and Causal Loop Diagramming for Opening the ‘Black Box’ of an Intervention in the Health Sector: A Case of Performance-Based Financing in Western Uganda. International Journal of Environmental Research and Public Health. 2017; 14(9):1007. https://doi.org/10.3390/ijerph14091007
Chicago/Turabian StyleRenmans, Dimitri, Nathalie Holvoet, and Bart Criel. 2017. "Combining Theory-Driven Evaluation and Causal Loop Diagramming for Opening the ‘Black Box’ of an Intervention in the Health Sector: A Case of Performance-Based Financing in Western Uganda" International Journal of Environmental Research and Public Health 14, no. 9: 1007. https://doi.org/10.3390/ijerph14091007