The Association between Air Pollution and Population Health Risk for Respiratory Infection: A Case Study of Shenzhen, China


Abstract
:1. Introduction
2. Data and Methods
2.1. Air Pollutuion Data
2.2. Hospital Admission Data
2.3. Statistical Analysis Model for Time Series Study
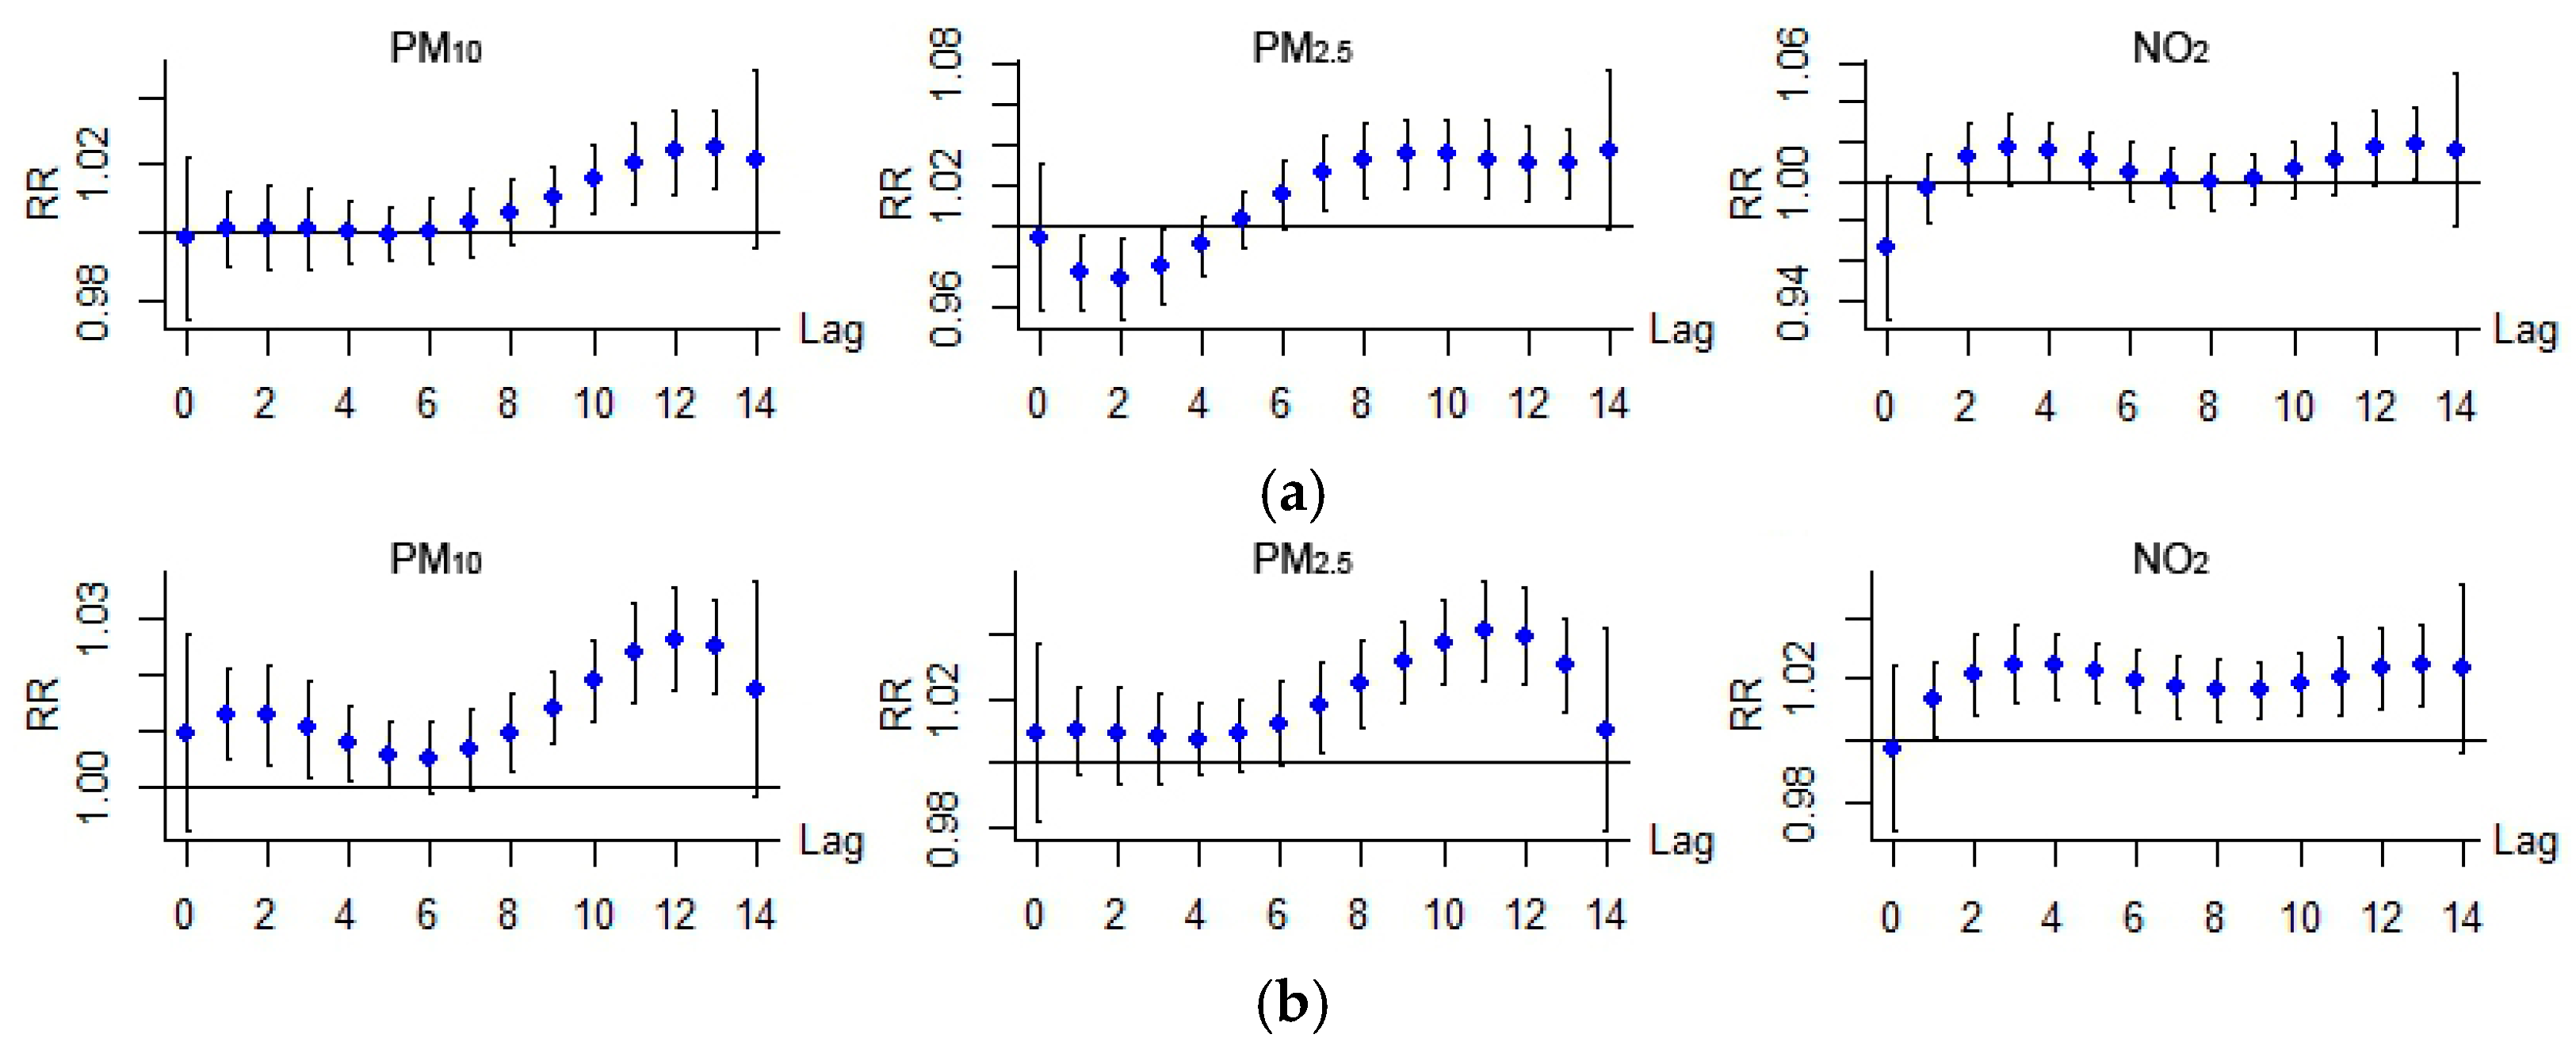
3. Results and Discussion
3.1. Statistical and General Analysis
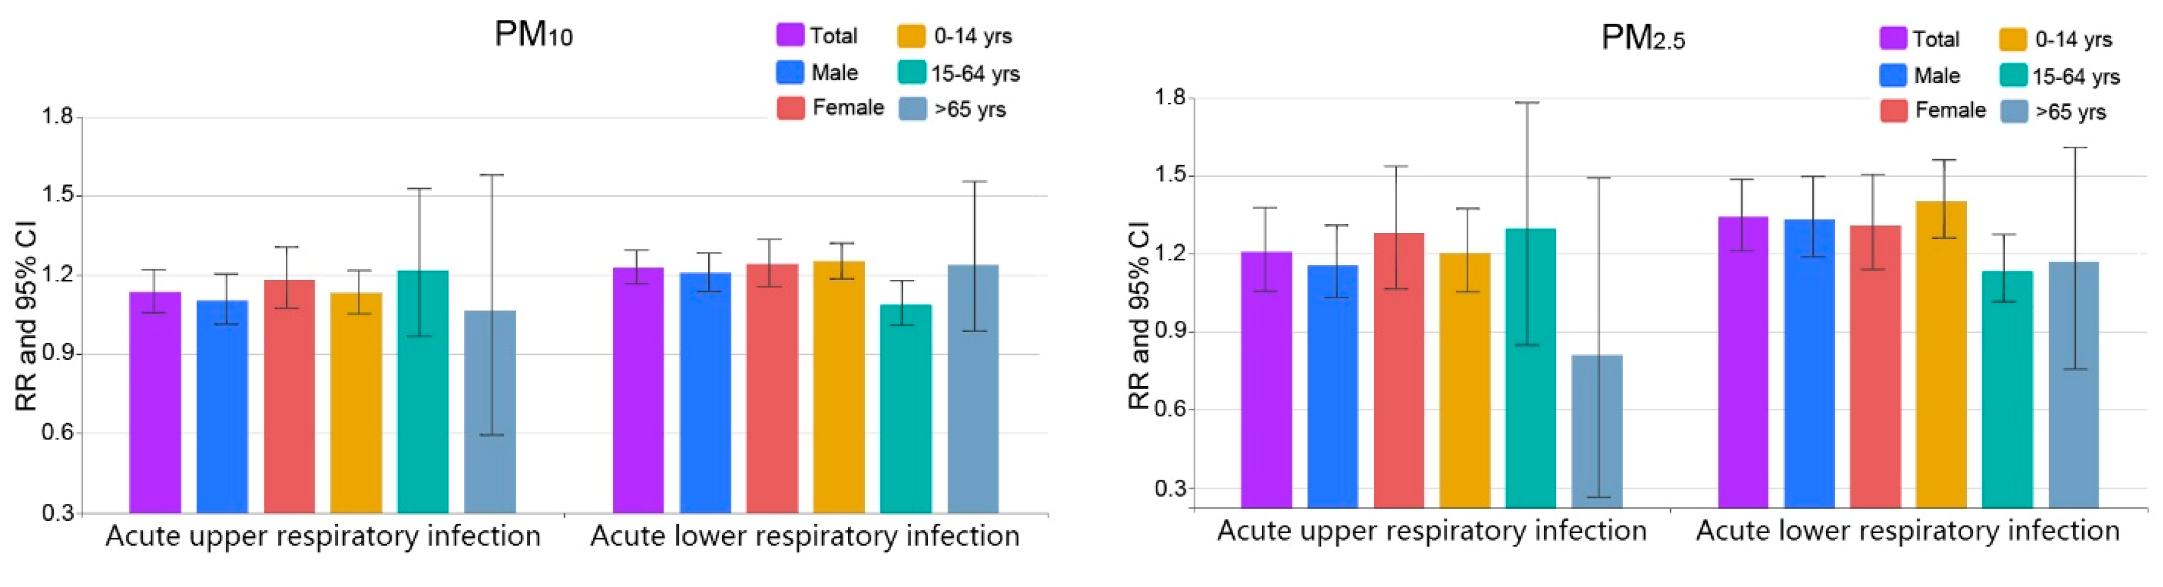
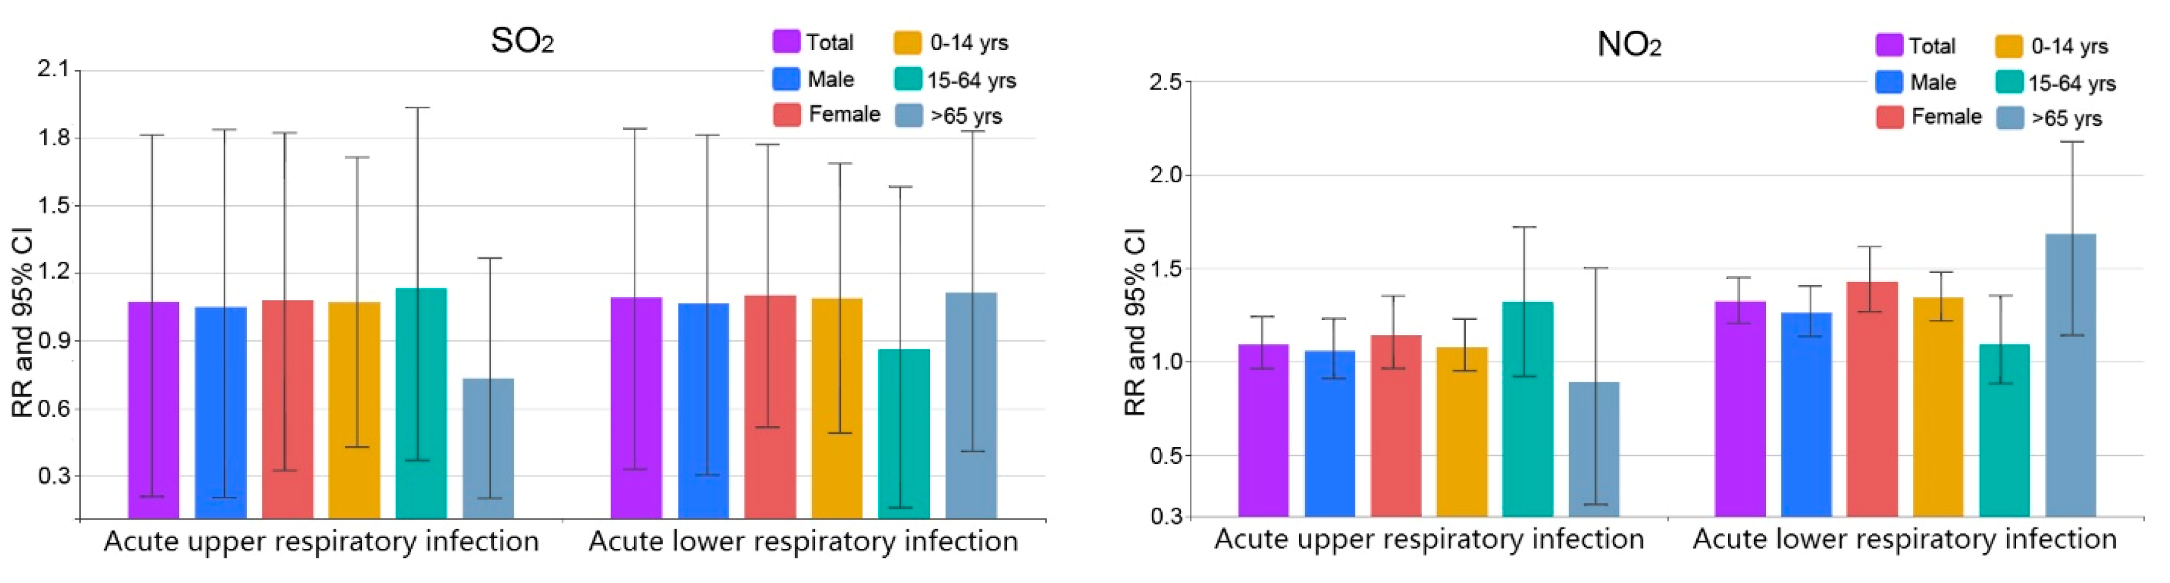
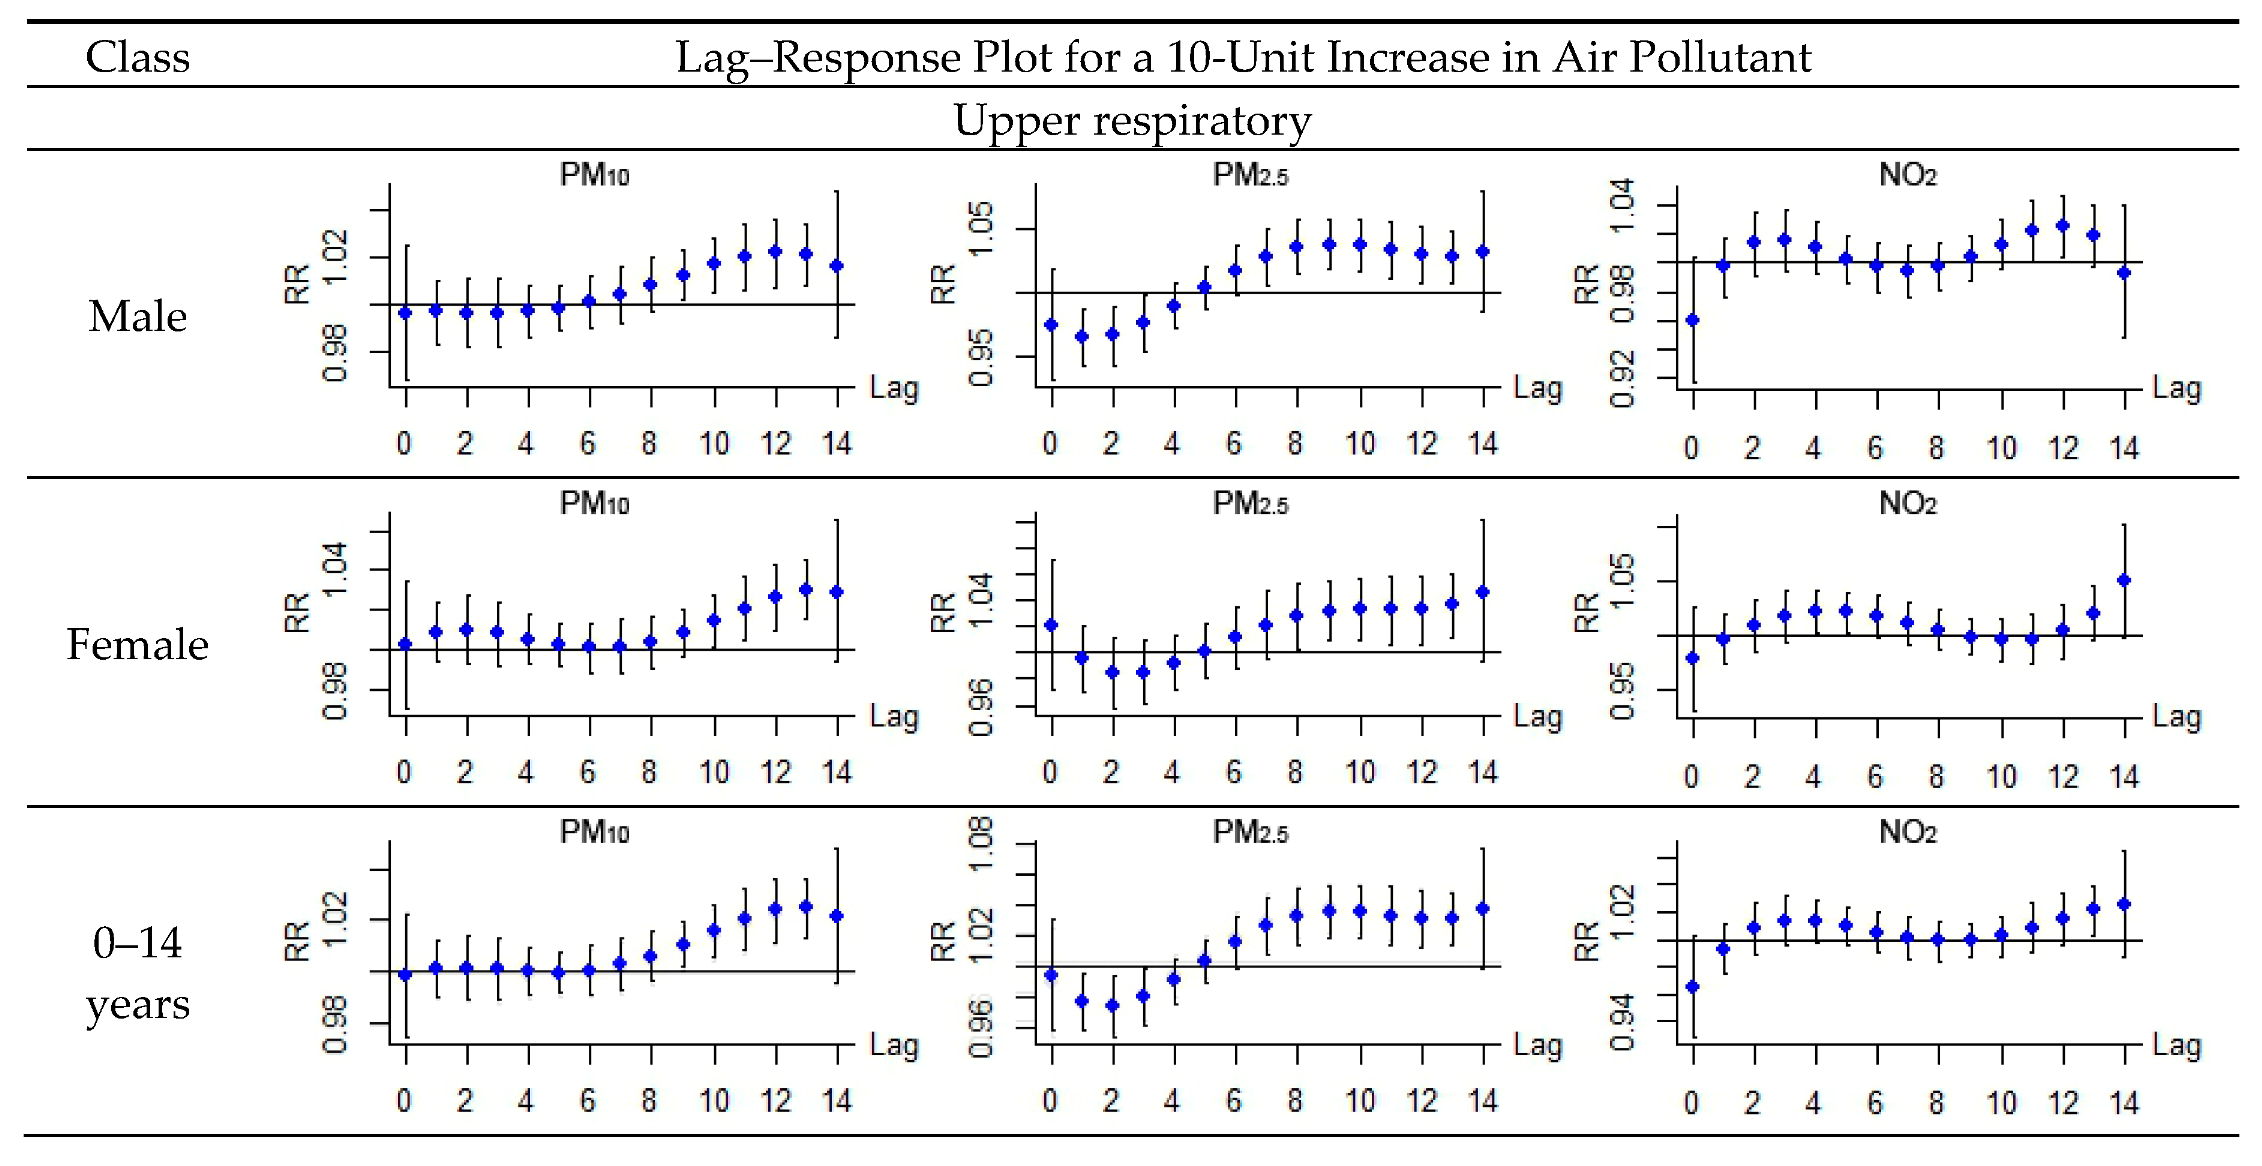
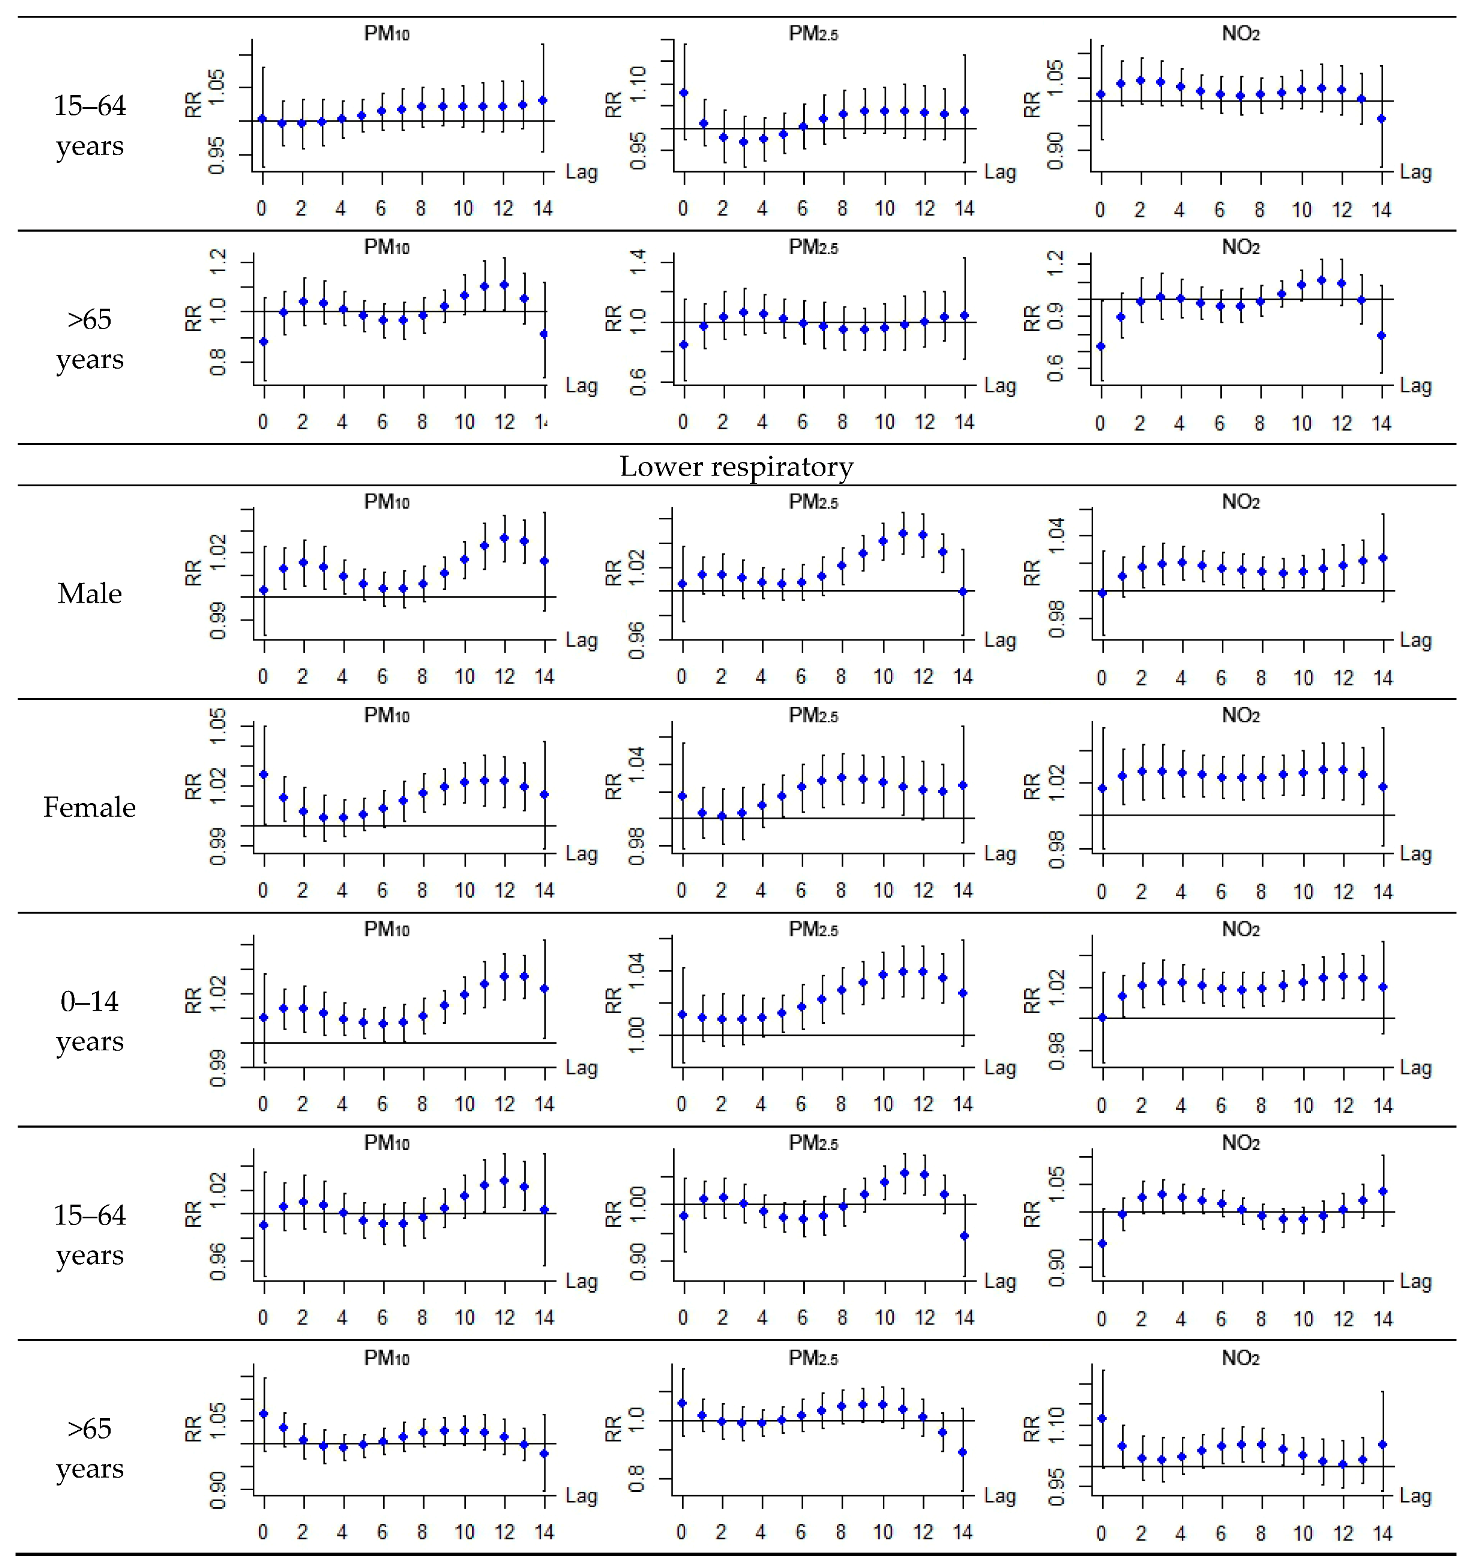
3.2. Comparison among Different Groups
3.3. Discussion
4. Conclusions
Acknowledgments
Author Contributions
Conflicts of Interest
References
- Shang, Y.; Sun, Z.; Cao, J.; Wang, X.; Zhong, L.; Bi, X. Systematic review of Chinese studies of short-term exposure to air pollution and daily mortality. Environ. Int. 2013, 54, 100–111. [Google Scholar] [CrossRef] [PubMed]
- Tang, D.; Li, T.; Chow, J.; Kulkarni, S.U.; Watson, J.G.; Ho, S.S.H. Air pollution effects on fetal and child development: A cohort comparison in China. Environ. Pollut. 2014, 185, 90–96. [Google Scholar] [CrossRef] [PubMed]
- Zhang, L.; Chen, X.; Xue, X.; Sun, M.; Han, B.; Li, C. Long-term exposure to high particulate matter pollution and cardiovascular mortality: A 12-year cohort study in four cities in northern China. Environ. Int. 2014, 62, 41–47. [Google Scholar] [CrossRef] [PubMed]
- Zhou, M.; Liu, Y.; Wang, L.; Kuang, X.; Xu, X.; Kan, H. Particulate air pollution and mortality in a cohort of Chinese men. Environ. Pollut. 2014, 186, 1–6. [Google Scholar] [CrossRef] [PubMed]
- Goldberg, M.S.; Burnett, R.T.; Stieb, D.M.; Brophy, J.M.; Daskalopoulou, S.S.; Valois, M.F. Associations between ambient air pollution and daily mortality among elderly persons in Montreal, Quebec. Sci. Total Environ. 2013, 463, 931–942. [Google Scholar] [CrossRef] [PubMed]
- Mahiyuddin, W.R.W.; Sahani, M.; Aripin, R.; Latif, M.T.; Thuan-Quoc, T.; Wong, C.M. Short-term effects of daily air pollution on mortality. Atmos. Environ. 2013, 65, 69–79. [Google Scholar] [CrossRef]
- Burnett, R.T.; Pope, C.A.; Ezzati, M.; Olives, C.; Lim, S.S.; Mehta, S. An integrated risk function for estimating the global burden of disease attributable to ambient fine particulate matter exposure. Environ. Health Perspect. 2014, 122, 397–403. [Google Scholar] [CrossRef] [PubMed]
- Brunekreef, B.; Holgate, S.T. Air pollution and health. Lancet 2002, 360, 1233–1242. [Google Scholar] [CrossRef]
- WHO Regional Office for Europe. Review of Evidence on Health Aspects of Air Pollution—REVIHAAP Project; WHO Regional Office for Europe: Copenhagen, Denmark, 2013; pp. 38–41. [Google Scholar]
- Chang, G.; Pan, X.; Xie, X.; Gao, Y. Time-series analysis on the relationship between air pollution and daily mortality in Beijing. J. Hyg. Res. 2003, 32, 565–568. (In Chinese) [Google Scholar]
- Guo, Y.; Jia, Y.; Pan, X.; Liu, L.; Wichmann, H.E. The association between fine particulate air pollution and hospital emergency room visits for cardiovascular diseases in Beijing, China. Sci. Total Environ. 2009, 407, 4826–4830. [Google Scholar] [CrossRef] [PubMed]
- Venners, S.A.; Wang, B.; Xu, Z.; Schlatter, Y.; Wang, L.; Xu, X. Particulate matter, sulfur dioxide, and daily mortality in Chongqing, China. Environ. Health Perspect. 2003, 111, 562–567. [Google Scholar] [CrossRef] [PubMed]
- Chen, G.; Song, G.; Jiang, L.; Zhang, Y.; Zhao, N.; Chen, B.; Kan, H. Short-term effects of ambient gaseous pollutants and particylate matter on daily mortality in Shanghai, China. J. Occup. Health 2008, 50, 41–47. [Google Scholar] [CrossRef] [PubMed]
- Cao, J.; Li, W.; Tan, J.; Song, W.; Xu, X.; Jiang, C.; Chen, G.; Chen, R.; Ma, W.; Chen, B.; et al. Association of ambient air pollution with hospital outpatient and emergency roomvisits in Shanghai, China. Sci. Total Environ. 2009, 407, 5531–5536. [Google Scholar] [CrossRef] [PubMed]
- Huang, W.; Cao, J.; Tao, Y.; Dai, L.; Lu, S.; Hou, B. Seasonal variation of chemical species associated with short-term mortality effects of PM2.5 in Xi’an, a central city in China. Am. J. Epidemiol. 2012, 175, 556–566. [Google Scholar] [CrossRef] [PubMed]
- Qian, Z.; He, Q.; Lin, H.; Kong, L.; Liao, D.; Dan, J. Association of daily cause-specific mortality with ambient particle air pollution in Wuhan, China. Environ. Res. 2007, 105, 380–389. [Google Scholar] [CrossRef] [PubMed]
- Qian, Z.; He, Q.; Lin, H.M.; Kong, L.; Liao, D.; Yang, N. Short-term effects of gaseous pollutants on cause-specific mortality in Wuhan, China. J. Air Waste Manag. Assoc. 2007, 57, 785–793. [Google Scholar] [PubMed]
- Hagler, G.S.W.; Bergin, M.H.; Salmon, L.G.; Yu, J.Z.; Wan, E.C.H.; Zheng, M.; Zeng, L.M.; Kiang, C.S.; Zhang, Y.H.; Lau, A.K.H. Source areas and chemical composition of fine particulate matter in the Pearl River Delta region of China. Atmos. Environ. 2006, 40, 3802–3815. [Google Scholar] [CrossRef]
- Jahnet, H.J.; Schneider, A.; Breitner, S.; Eißner, R.; Wendisch, M.; Krämer, A. Particulate matter pollution in the megacities of the Pearl River Delta, China—A systematic literature review and health risk assessment. Int. J. Hyg. Environ. Health 2011, 214, 281–295. [Google Scholar] [CrossRef] [PubMed]
- Cui, H.Y.; Chen, W.H.; Dai, W.; Liu, H.; Wang, X.M.; He, K. Source apportionment of PM2.5 in Guangzhou combining observation data analysis and chemical transport model simulation. Atmos. Environ. 2015, 116, 262–271. [Google Scholar] [CrossRef]
- Richter, A.; Burrows, J.P.; Nuess, H.; Granier, C.; Niemeier, U. Increase in tropospheric nitrogen dioxide over China observed from space. Nature 2005, 437, 129–132. [Google Scholar] [CrossRef] [PubMed]
- Zhang, Q.; Streets, D.G.; He, K.B.; Wang, Y.X.; Richter, A.; Burrows, J.P.; Uno, I.; Jang, C.J.; Chen, D.; Yao, Z.L.; et al. NOx emission trends for China, 1995–2004: The view from the ground and the view from space. J. Geophys. Res. Atmos. 2007, 112, 35–47. [Google Scholar] [CrossRef]
- Tao, Y.B.; Huang, W.; Huang, X.L.; Zhong, L.J.; Lu, S.E.; Li, Y.; Dai, L.Z.; Zhang, Y.H.; Zhu, T. Estimated acute effects of ambient ozone and nitrogen dioxide on mortality in the Pearl River Delta of southern China. Environ. Health Perspect. 2012, 120, 393–398. [Google Scholar] [CrossRef] [PubMed]
- Wang, T.; Cheung, V.T.F.; Lam, K.S.; Kok, G.L.; Harris, J.M. The characteristics of ozone and related compounds in the boundary layer of the South China coast: Temporal and vertical variations during autumn season. Atmos. Environ. 2001, 35, 2735–2746. [Google Scholar] [CrossRef]
- Liu, H.J.; Zhang, X.; Zhang, L.W.; Wang, X.M. Changing trends in meteorological elements and reference evapotranspiration in a mega city: A case study in Shenzhen City, China. Adv. Meteorol. 2015, 1–11. [Google Scholar] [CrossRef]
- Zhang, F.; Liu, X.; Zhou, L.; Yu, Y.; Lu, J.; Wang, W.; Krafft, T. Spatiotemporal patterns of particulate matter (PM) and associations between PM and mortality in Shenzhen, China. BMC Public Health 2016, 16, 215. [Google Scholar] [CrossRef] [PubMed]
- Ministry of Environmental Protection of the People’s Republic of China (MEP). Ambient Air Quality Standards (On Trial). In National Environmental Protection Standards of the People’s Republic of China; GB3095; Ministry of Environmental Protection of the People’s Republic of China (MEP): Beijing, China, 2012. [Google Scholar]
- Xia, X.; Qi, Q.; Liang, H.; Zhang, A.; Jiang, L.; Ye, Y.; Liu, C.; Huang, Y. Pattern of spatial distribution and temporal variation of atmospheric pollutants during 2013 in Shenzhen, China. ISPRS Int. J. Geo-Inf. 2017, 6, 2. [Google Scholar] [CrossRef]
- Shrestha, S.L. Time series modelling of respiratory hospital admissions and geometrically weighted distributed lag effects from ambient particulate air pollution within Kathmandu Valley, Nepal. Environ. Model. Assess. 2007, 12, 239–251. [Google Scholar] [CrossRef]
- Armstrong, B. Models for the relationship between ambient temperature and daily mortality. Epidemiology 2006, 17, 624–631. [Google Scholar] [CrossRef] [PubMed]
- Gasparrini, A.; Armstrong, B.; Kenward, M.G. Distributed lag non-linear models. Stat. Med. 2010, 29, 2224–2234. [Google Scholar] [CrossRef] [PubMed]
- Gasparrini, A. Modeling exposure-lag-response associations with distributed lag non-linear models. Stat. Med. 2014, 33, 881–899. [Google Scholar] [CrossRef] [PubMed]
- Atkinson, R.W.; Anderson, H.R.; Sunyer, J.; Ayres, J.; Baccini, M.; Vonk, J.M.; Boumghar, A.; Forastiere, F.; Forsberg, B.; Touloumi, G.; et al. Acute effects of particulate air pollution on respiratory admissions: Results from APHEA 2 project. Air pollution and health: A European approach. Am. J. Respir. Crit. Care Med. 2001, 164, 1860–1866. [Google Scholar] [CrossRef] [PubMed]
- Tao, Y.; Mi, S.; Zhou, S.; Wang, S.; Xie, X. Air pollution and hospital admissions for respiratory diseases in Lanzhou, China. Environ. Pollut. 2014, 85, 196–201. [Google Scholar] [CrossRef] [PubMed]
- Francesca, D.; Roger, D.; Michelle, L.; Luu, P.; Aidan, M.; Scott, L.; Jonathan, M. Fine Particulate Air Pollution and Hospital Admission for Cardiovascular and respiratory diseases. NIH Public Access. 2006, 295, 1127–1134. [Google Scholar]
- Song, C.; Pei, T.; Yao, L. Analysis of the characteristics and evolution modes of PM2.5 pollution episodes in Beijing, China during 2013. Int. J. Environ. Res. Public Health 2015, 12, 1099–1111. [Google Scholar] [CrossRef] [PubMed]
- Hu, J.L.; Wang, Y.G.; Ying, Q.; Zhang, H.L. Spatial and temporal variability of PM2.5 and PM10 over the North China Plain and the Yangtze River Delta, China. Atmos. Environ. 2014, 95, 598–609. [Google Scholar] [CrossRef]
- Yao, L.; Lu, N. Spatiotemporal distribution and short-term trends of particulate matter concentration over China, 2006–2010. Environ. Sci. Pollut. Res. 2014, 21, 9665–9675. [Google Scholar] [CrossRef] [PubMed]
- Samoli, E.; Analitis, A.; Touloumi, G.; Schwartz, J.; Anderson, H.R.; Sunyer, J.; Bisanti, L.; Zmirou, D.; Vonk, J.M.; Pekkanen, J.; et al. Estimating the exposure-response relationships between particulate matter and mortality within the APHEA multicity project. Environ. Health Perspect. 2005, 113, 88–95. [Google Scholar] [CrossRef] [PubMed] [Green Version]
- Li, N.; Peng, X.; Zhang, B. Relationship between air pollutant and daily hospital visits for respiratory diseases in Guangzhou: A time-series study. J. Environ. Health 2009, 26, 1077–1080. (In Chinese) [Google Scholar]
- Wang, Y.; Zhang, Y.; Li, X. The effect of air pollution on hospital visits for respiratory symptoms in urban areas of Jinan, China. Environ. Sci. 2008, 28, 571–576. (In Chinese) [Google Scholar]
- Wong, T.W.; Lau, T.; Yu, T. Air pollution and hospital admissions for respiratory and cardiovascular diseases in Hong Kong. Occup. Environ. Med. 1999, 56, 679–683. [Google Scholar] [CrossRef] [PubMed]
- Moolgavkar, S.H.; Luebeck, E.G.; Anderson, E.L. Air pollution and hospital admissions for respiratory causes in Minneapolis-St. Paul and Birmingham. Epidemiology 1997, 8, 364–370. [Google Scholar] [CrossRef] [PubMed]
- Schwartz, J. Air pollution and hospital admissions for respiratory disease. Epidemiology 1996, 7, 20–28. [Google Scholar] [CrossRef] [PubMed]
- Wordley, J.; Walters, S.; Ayres, J.G. Short term variations in hospital admissions and mortality and particulate air pollution. Occup. Environ. Med. 1997, 54, 108–116. [Google Scholar] [CrossRef] [PubMed]
- Sarnat, J.A.; Brown, K.W.; Schwartz, J.; Coull, B.A.; Koutrakis, P. Ambient gas concentrations and personal particulate matter exposures: Implications for studying the health effects of particles. Epidemiology 2005, 16, 385–395. [Google Scholar] [CrossRef] [PubMed]


| Item | Amount | Mean ± SD | Min | P (25) | Median | P (75) | Max |
|---|---|---|---|---|---|---|---|
| Hospital admission | |||||||
| Acute upper respiratory | 11,994 | 34 ± 9 | 12 | 28 | 33 | 40 | 63 |
| Male | 7193 | 20 ± 6 | 6 | 16 | 20 | 24 | 39 |
| Female | 4801 | 14 ± 5 | 2 | 10 | 13 | 16 | 30 |
| 0–14 years | 10,633 | 30 ± 8 | 8 | 25 | 29 | 35 | 55 |
| 15–64 years | 1204 | 3 ± 2 | 0 | 2 | 3 | 4 | 15 |
| >65 years | 157 | 0 ± 1 | 0 | 0 | 0 | 1 | 4 |
| Acute lower respiratory | 23,283 | 66 ± 12 | 29 | 57 | 66 | 74 | 102 |
| Male | 14,447 | 41 ± 8 | 16 | 35 | 41 | 46 | 66 |
| Female | 8836 | 25 ± 6 | 9 | 21 | 25 | 29 | 49 |
| 0–14 years | 19,391 | 55 ± 11 | 27 | 46 | 55 | 62 | 88 |
| 15–64 years | 2995 | 8 ± 4 | 0 | 6 | 8 | 11 | 21 |
| >65 years | 897 | 3 ± 2 | 0 | 1 | 2 | 3 | 10 |
| Item | Mean ± SD | Min | P (25) | Median | P (75) | Max |
|---|---|---|---|---|---|---|
| Air pollutant | ||||||
| SO2 (μg/m3) | 13 ± 5.5 | 5.0 | 8.1 | 10.5 | 14.2 | 53.4 |
| NO2 (μg/m3) | 39 ± 16.4 | 14.8 | 29.8 | 37.6 | 49.0 | 104.8 |
| PM10 (μg/m3) | 62 ± 34.8 | 10.3 | 35.4 | 50.3 | 80.7 | 184.8 |
| PM2.5 (μg/m3) | 43 ± 24.6 | 8.3 | 21.3 | 34.9 | 54.7 | 135.8 |
| Meteorological factors | ||||||
| Temperature (°C) | 23.5 ± 4.9 | 9.8 | 19.8 | 24.6 | 27.7 | 31.2 |
| Pressure (hPa) | 1004.9 ± 6.1 | 986.8 | 1000.2 | 1004.6 | 1010.1 | 1019.2 |
| Relative humidity (%) | 75.5 ± 14.8 | 24 | 68 | 78 | 87 | 100 |
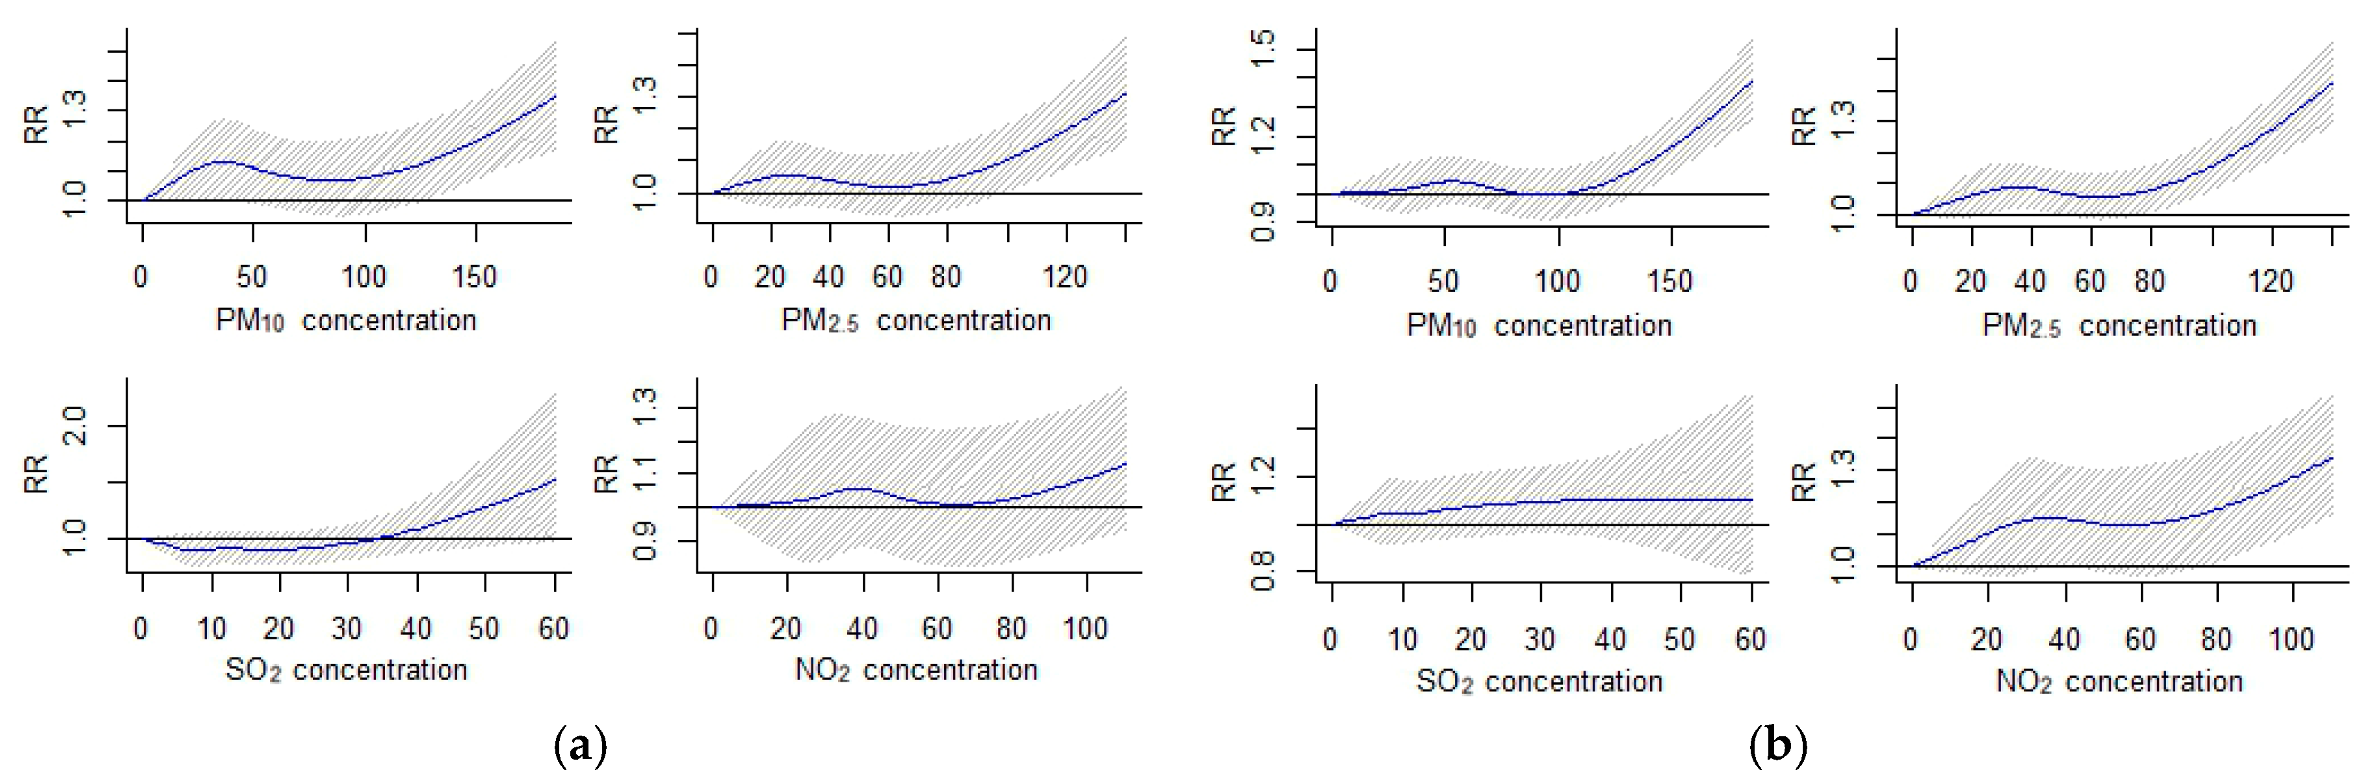
| Pollutant | Threshold | Upper Respiratory | Lower Respiratory |
|---|---|---|---|
| PM10 | 100 (μg/m3) | 13.5 (5.6, 22.0) * | 22.8 (16.5, 29.3) * |
| PM2.5 | 80 (μg/m3) | 20.6 (5.6, 37.7) * | 34.1 (21.0, 48.6) * |
| SO2 | 30 (μg/m3) | 7.4 (−79, 81.3) | 9.2 (−66.9, 84.1) |
| NO2 | 60 (μg/m3) | 9.2 (−3.8, 24) | 32.1 (20.5, 44.9) * |
| R2 | NO2 | PM10 | PM2.5 |
|---|---|---|---|
| SO2 | 0.46 | 0.68 | 0.66 |
| NO2 | 0.57 | 0.45 | |
| PM10 | 0.92 |
| Pollutant | Adjustment | Upper Respiratory | Lower Respiratory |
|---|---|---|---|
| SO2 | none | 7.4 (−79, 81.3) | 9.2 (−66.9, 84.1) |
| NO2 | 7.2 (−67, 81.4) | 7.9 (−51.3, 67.1) | |
| PM10 | 8.6 (−53.3, 70.5) | 10.3 (−48.1, 68.7) | |
| PM2.5 | 6.9 (−60.5, 74.3) | 8.7 (−41.1, 58.5) | |
| NO2 | none | 9.2 (−3.8, 24) | 32.1 (20.5, 44.9) * |
| SO2 | 7.3 (−2.2, 26.7) | 10.5 (−3.3, 23.2) | |
| PM10 | 8.6 (−1.8, 18.9) | 25.1 (18.8, 31.4) * | |
| PM2.5 | 8.9 (−1.5, 19.2) | 27.3 (19.2, 35.4) * | |
| PM10 | none | 13.5 (5.6, 22.0) * | 22.8 (16.5, 29.3) * |
| SO2 | 7.3 (−2.2, 26.7) | 10.5 (−3.3, 23.2) | |
| NO2 | 10.3 (1.2, 19.7) * | 15.3 (8.2, 22.9) * | |
| PM2.5 | none | 20.6 (5.6, 37.7) * | 34.1 (21.0, 48.6) * |
| SO2 | 7.3 (−2.2, 26.7) | 10.5 (−3.3, 23.2) | |
| NO2 | 10.3 (1.2, 19.7) * | 15.3 (8.2, 22.9) * |
| Infection | Group | PM10 | PM2.5 | SO2 | NO2 |
|---|---|---|---|---|---|
| Upper respiratory | Male | 10.3 (1.2, 20.3) * | 15.6 (1.3, 30.1) * | 5.2 (−79.5, 83.6) | 5.7 (−9.2, 23.0) |
| Female | 18.3 (7.3, 30.5) * | 27.9 (6.5, 53.6) * | 8.1 (−67.5, 82.2) | 14.1 (−3.7, 35.1) | |
| 0–14 years | 13.1 (5.2, 21.6) * | 20.2 (5.3, 37.3) * | 7.1 (−57.0, 71.3) | 8.0 (−5.0, 22.8) | |
| 15–64 years | 21.5 (−3.4, 52.7) | 29.6 (−15.2, 78.1) | 13.1 (−62.9, 93.3) | 31.9 (−7.9, 71.9) | |
| >65 years | 6.5 (−40.8, 55.9) | −19.1 (−73.8, 49.1) | −26.4 (−79.7, 26.7) | −10.7 (−76.5, 49.9) | |
| Lower respiratory | Male | 20.8 (13.7, 28.2) * | 33.2 (18.7, 49.7) * | 6.7 (−69.5, 81.3) | 26.1 (13.4, 40.3) * |
| Female | 24.2 (15.6, 33.4) * | 31.0 (13.9, 50.5) * | 10.3 (−48.3, 77.0) | 42.9 (26.6, 61.3) * | |
| 0–14 years | 25.1 (18.5, 32.0) * | 40.2 (26.0, 56.1) * | 9.1 (−50.8, 68.6) | 34.2 (7.3, 30.5) * | |
| 15–64 years | 8.6 (1.5, 17.6) * | 13.4 (0.6, 26.2) * | −13.7 (−83.9, 58.3) | 9.2 (−11.8, 35.2) | |
| >65 years | 23.7 (−1.4, 55.4) | 16.9 (−24.5, 60.9) | 11.4 (−58.9, 83.0) | 68.1 (14.1, 147.6) * |
| Pollutant | Threshold | Days over Threshold | Daily Limit | Days over Limit |
|---|---|---|---|---|
| PM10 | 100 (μg/m3) | 63 | 150 (μg/m3) | 13 |
| PM2.5 | 80 (μg/m3) | 31 | 75 (μg/m3) | 44 |
| SO2 | 30 (μg/m3) | 5 | 150 (μg/m3) | 0 |
| NO2 | 60 (μg/m3) | 48 | 80 (μg/m3) | 6 |
© 2017 by the authors. Licensee MDPI, Basel, Switzerland. This article is an open access article distributed under the terms and conditions of the Creative Commons Attribution (CC BY) license (http://creativecommons.org/licenses/by/4.0/).
Share and Cite
Xia, X.; Zhang, A.; Liang, S.; Qi, Q.; Jiang, L.; Ye, Y. The Association between Air Pollution and Population Health Risk for Respiratory Infection: A Case Study of Shenzhen, China. Int. J. Environ. Res. Public Health 2017, 14, 950. https://doi.org/10.3390/ijerph14090950
Xia X, Zhang A, Liang S, Qi Q, Jiang L, Ye Y. The Association between Air Pollution and Population Health Risk for Respiratory Infection: A Case Study of Shenzhen, China. International Journal of Environmental Research and Public Health. 2017; 14(9):950. https://doi.org/10.3390/ijerph14090950
Chicago/Turabian StyleXia, Xiaolin, An Zhang, Shi Liang, Qingwen Qi, Lili Jiang, and Yanjun Ye. 2017. "The Association between Air Pollution and Population Health Risk for Respiratory Infection: A Case Study of Shenzhen, China" International Journal of Environmental Research and Public Health 14, no. 9: 950. https://doi.org/10.3390/ijerph14090950