Association between Blood Pressure and Birth Weight among Rural South African Children: Ellisras Longitudinal Study

 ,
, 
Abstract
:1. Introduction
2. Methods
2.1. Anthropometry
2.2. Blood Pressure
2.3. Ethical Considerations
2.4. Quality Control
2.5. Statistical Analysis
3. Results
4. Discussion
5. Conclusions
Acknowledgments
Author Contributions
Conflicts of Interest
References
- Maffeis, C.; Pietrobelli, A.; Grezzani, A.; Provera, S.; Tato, L. Waist circumference and cardiovascular risk factors in pre-pubertal children. Obes. Res. 2001, 9, 179–187. [Google Scholar] [CrossRef] [PubMed]
- Kemper, H.C.G. Amsterdam Growth and Health Longitudinal Study: A 23 Year Follow up from Teenagers to Adult about Lifestyle and Health; Karger Press: New York, NY, USA, 2004; pp. 1–20. [Google Scholar]
- Moore, V.M.; Cockington, R.A.; Ryan, P.; Robinson, J.S. The relationship between birth weight and blood pressure amplifies from childhood to adulthood. J. Hypertens. 1999, 17, 883–888. [Google Scholar] [CrossRef] [PubMed]
- Ezzati, M.; Lopez, A.D.; Rodgers, A.; Murray, C.J. Comparative Quantification of Health Risks: Global and Regional Burden of Disease Attributable to Selected Major Risk Factors; World Health Organization: Geneva, Switzerland, 2004. [Google Scholar]
- Maggio, A.B.R.; Aggoun, Y.; Marchand, L.M.; Martin, X.E.; Herrmann, F.; Beghetti, M.; Farpour-Lambert, N.J. Associations among obesity, blood pressure, and left ventricular mass. J. Pediatr. 2008, 152, 489–493. [Google Scholar] [CrossRef] [PubMed]
- Yiu, V.; Buka, S.; Zurakowski, D.; McCormick, M.; Brenner, B.; Jabs, K. Relationship between birth weight and blood pressure in childhood. Am. J. Kidney Dis. 1999, 33, 253–260. [Google Scholar] [CrossRef]
- Barker, D.J.P. Birth weight and hypertension. J. Hypertens. 2006, 48, 357–358. [Google Scholar] [CrossRef] [PubMed]
- Monyeki, K.D.; Kemper, H.C.G.; Makgae, P.J. Relationship between fat patterns, physical fitness and blood pressure of rural South African children: Ellisras longitudinal growth and health study. J. Hum. Hypertens. 2008, 22, 311–319. [Google Scholar] [CrossRef] [PubMed]
- Suzuki, T.; Minami, J.; Ohrui, M.; Ishimitsu, T.; Matsuoka, H. Relationship between birth weight and cardiovascular risk factors in Japanese young adults. Am. J. Hypertens. 2000, 13, 907–913. [Google Scholar] [CrossRef]
- Pearce, M.S.; O’sullivan, J.J. Relationship between birth weight and blood pressure variability in children. J. Hypertens. 2003, 17, 677–680. [Google Scholar] [CrossRef] [PubMed]
- Huxley, R.R.; Shiell, A.W.; Law, C.M. The role of size at birth and postnatal catch-up growth in determining systolic blood pressure: A systematic review of the literature. J. Hypertens. 2000, 18, 815–831. [Google Scholar] [CrossRef] [PubMed]
- National High Blood Pressure Education Program (NHBPEP) Working Group on High Blood Pressure in Children and Adolescents. The fourth report on the diagnosis, evaluation, and treatment of high blood pressure in children and adolescents. Pediatrics 2004, 114, 555–576. [Google Scholar]
- Hemachandra, A.H.; Howards, P.P.; Furth, S.L.; Klebabnoff, M.A. Birth weight, postnatal growth, and risk for high blood pressure at 7 years of age: Results from the Collaborative Perinatal Project. Pediatrics 2007, 119, 1264–1270. [Google Scholar] [CrossRef] [PubMed]
- Beltfort, M.B.; Rifas-Shiman, S.L.; Rich-Edwards, J.; Kleinman, K.P.; Gillman, M.W. Size at birth, infant growth, and blood pressure at three years of age. J. Pediatr. 2007, 151, 670–674. [Google Scholar] [CrossRef] [PubMed]
- Monyeki, K.D.; de Ridder, J.H.; Steyn, N.P.; Toriola, A.L.; Kemper, H.C.G.; van Lenthe, F.J.; Twisk, J.W.R.; Nthangeni, M.E. Stability of somatotypes in 4 to 10 year-old rural South African girls. Ann. Hum. Biol. 2002, 29, 37–49. [Google Scholar] [CrossRef] [PubMed]
- Norton, K.; Olds, T. Anthropometrica; University of New South Wales Press: Sydney, Australia, 1996; pp. 396–410. [Google Scholar]
- World Health Organization (WHO). Aspects of Low Birth Weight; Report of the Expect Committee of Maternal Child Health; WHO Technical Report; WHO: Geneva, Switzerland, 1961; pp. 3–16. [Google Scholar]
- Craig, E.; Bland, R.; Ndirangu, J.; Reilly, J.J. Use of mid-upper arm circumference for determining overweight and overfatness in children and adolescents. Arch. Dis. Child. 2014, 99, 763–766. [Google Scholar] [CrossRef] [PubMed] [Green Version]
- Twisk, J.W.; Kemper, H.C.; van Mechelen, W.; Post, G.B. Tracking of risk factors for coronary heart disease over a 14-year period: A comparison between lifestyle and biologic risk factors with data from the Amsterdam Growth and Health Study. Am. J. Epidemiol. 1997, 145, 888–898. [Google Scholar] [CrossRef] [PubMed]
- Frisancho, A.R. Anthropometric Standards for the Assessment of Growth and Nutritional Status; The University of Michigan Press: Ann Arbor, MI, USA, 1990. [Google Scholar]
- Gibson, R.S. Principles of Nutritional Assessment; Oxford University Press: Oxford, UK, 1990. [Google Scholar]
- Schisterman, E.F.; Faraggi, D.; Reiser, B.; Trevisan, M. Statistical inference for the area under the receiver operating characteristic curve in the presence of random measurement error. Am. J. Epidemiol. 2001, 154, 174–179. [Google Scholar] [CrossRef] [PubMed]
- Zhou, X.H.; Obuchowski, N.A.; McClish, D.K. Statistical Methods in Diagnostic Medicine; Wiley-Interscience: New York, NY, USA, 2002. [Google Scholar]
- Huxley, R.; Neil, A.; Collins, R. Unravelling the fetal origins hypothesis: Is there really an inverse association between birthweight and subsequent blood pressure? Lancet 2002, 360, 659–665. [Google Scholar] [CrossRef]
- Davies, A.A.; Smith, G.D.; May, M.T.; Ben-Shlomo, Y. Association between birth weight and blood pressure is robust, amplifies with age, and may be underestimated. J. Hypertens. 2006, 48, 431–436. [Google Scholar] [CrossRef] [PubMed]
- Laughlin, M.H.; Newcomer, S.C.; Bender, S.B. Importance of hemodynamic forces as signals for exercise-induced changes in endothelial cell phenotype. J. Appl. Physiol. 2008, 104, 588–600. [Google Scholar] [CrossRef] [PubMed]
- Valero De Bernabé, J.; Soriano, T.; Albaladejo, R.; Juarranz, M.; Calle, M.E.; Martínez, D.; Domínguez-Rojas, V. Risk factors for low birth weight: A review. Eur. J. Obstet. Gynaecol. Reprod. Biol. 2004, 10, 3–15. [Google Scholar] [CrossRef] [PubMed]
- Longo-Mbenza, B.; Lukoki Luila, E.; M’Buyamba-Kabangu, J.R. Nutritional status, socio-economic status, heart rate, and blood pressure in African school children and adolescents. Int. J. Cardiol. 2007, 121, 171–177. [Google Scholar] [CrossRef] [PubMed]
- Silva, K.S.; Silva, R.C.R.; Duarte, M.F.S.; Lopes, A.S.; Silva, F.M. Undernutriton and obesity associated with high blood pressure in children and adolescent from Joao Pessoa, Paraiba, Brazil. Pediatr. Cardiol. 2009, 30, 248–255. [Google Scholar] [CrossRef] [PubMed]
- Sawaya, A.L.; Sesso, R.; de Menezes Toledo Florencio, T.M.; Fernandes, M.T.B.; Martins, P.A. Association between chronic undernutrion and hypertesnion. Matern. Child. Nutr. 2005, 1, 155–163. [Google Scholar] [CrossRef] [PubMed]
- Kingdom, J.C.P.; McQueen, J.; Connell, J.M.C.; Whittle, M.L. Fetal Angiotensins II levels and vascular (type1) angiotensin receptors in pregnancies complicated by uternine growth retardation. Br. J. Obstet. Gynaecol. 1993, 100, 293–476. [Google Scholar] [CrossRef]
- Hrafnkelsson, H.; Magnusson, K.T.; Sigurdsson, E.L.; Johannsson, E. Association of BMI and fasting insulin with cardiovascular disease risk factors in seven-year-old Icelandic children. Scand. J. Prim. Health Care 2009, 27, 186–191. [Google Scholar] [CrossRef] [PubMed]
- Gracia-Marco, L.; Moreno, L.A.; Ruiz, J.R.; Ortega, F.B.; de Moraes, A.C.; Gottrand, F.; Roccaldo, R.; Marcos, A.; Gómez-Martínez, S.; Dallongeville, J.; et al. Body composition indices and single and clustered cardiovascular disease risk factors in adolescents: Providing clinical-based cut-points. Prog. Cardiovasc. Dis. 2016, 58, 555–564. [Google Scholar] [CrossRef] [PubMed] [Green Version]
- Mirzaei, M.; Taylor, R.; Morrell, S.; Leeder, S.R. Predictors of blood pressure in a cohort of school-aged children. Eur. J. Cardiovasc. Prev. Rehabil. 2007, 14, 624–629. [Google Scholar] [CrossRef] [PubMed]
- Moselakgomo, V.K.; Toriola, A.L.; Shaw, B.S.; Goon, D.T.; Akinyemi, O. Body mass index, overweight, and blood pressure among adolescent schoolchildren in Limpopo province, South Africa. Rev. Paul. Pediatr. 2012, 30, 562–569. [Google Scholar] [CrossRef]
- Klöting, N.; Blüher, M. Adipocyte dysfunction, inflammation and metabolic syndrome. Rev. Endocr. Metab. Disord. 2014, 15, 277–287. [Google Scholar] [CrossRef] [PubMed]
- Steinthorsdottir, S.D.; Eliasdottir, S.B.; Indridason, O.S.; Palsson, R.; Edvardsson, V.O. The relationship between birth weight and blood pressure in childhood: A population-based study. Am. J. Hypertens. 2013, 26, 76–82. [Google Scholar] [CrossRef] [PubMed]

| Variables | 5–7 Years | 8–10 Years | 11–15 Years | |||
|---|---|---|---|---|---|---|
| Mean (SD) | Mean (SD) | Mean (SD) | ||||
| Males (N = 38) | Females (N = 27) | Males (N = 138) | Females (N = 117) | Males (N = 102) | Females (N = 76) | |
| Birth Information | ||||||
| Length (cm) | 49.11 (5.32) | 47.94 (3.97) | 50.20 (5.78) | 50.13 (7.08) | 49.56 (5.45) | 50.30 (5.58) |
| Head circumference (cm) | 34.40 (3.00) | 37.00 (10.62) | 34.64 (5.52) | 35.21 (4.40) | 34.23 (5.85) | 34.85 (9.26) |
| Birth weight (kg) | 3.13 (0.44) | 3.17 (0.44) | 3.18 (0.55) | 3.15 (0.61) | 3.23 (0.61) | 3.15 (0.47) |
| Gestational age | 38.00 (1.39) | 37.77 (1.52) | 37.42 (3.80) | 37.10 (4.17) | 37.20 (4.17) | 38.08 (1.38) |
| Blood Pressure | ||||||
| Systolic mmHg | 98.37 (10.06) | 99.90 (9.35) | 99.13 (11.10) | 100.97 (11.6) | 98.69 (11.06) | 99.26 (10.49) |
| Diastolic mmHg | 64.29 (7.85) | 66.55 (7.28) | 66.02 (8.10) | 67.34 (8.27) | 66.39 (8.49) | 66.11 (9.08) |
| mean mmHg | 75.65 (7.37) | 77.67 (6.91) | 77.06 (8.88) | 78.55 (8.22) | 77.16 (8.41) | 77.16 (8.70) |
| Absolute Body Size | ||||||
| Body weight (kg) | 20.89 (2.18) | 21.07 (3.62) | 25.75 (3.63) | 25.36 (4.08) | 32.08 (5.07) * | 34.17 (6.51) * |
| Height (cm) | 122.64 (5.34) | 23.24 (6.42) | 133.46 (7.11) | 33.51 (6.55) | 145.08 (6.74) * | 148.05 (6.59) * |
| Triceps (mm) | 6.99 (1.32) | 6.77 (1.20) | 9.12 (3.19) | 8.80 (2.63) | 6.16 (1.09) | 6.13 (1.30) |
| Biceps (mm) | 4.00 (0.00) | 4.00 (0.00) | 6.17 (1.93) | 6.16 (1.82) | 3.39 (0.40) | 3.38 (0.45) |
| Suprailiac (mm) | 4.21 (0.91) | 4.21 (0.77) | 5.76 (2.12) | 5.93 (4.91) | 4.04 (0.96) | 4.00 (0.78) |
| Subscapular (mm) | 5.43 (0.84) | 5.50 (0.65) | 7.18 (2.34) | 7.22 (2.15) | 5.22 (0.84) | 5.22 (0.77) |
| Sum4sf (mm) | 20.63 (2.31) | 20.48 (1.94) | 28.23 (8.74) | 28.12 (9.25) | 18.81 (2.50) | 18.72 (2.66) |
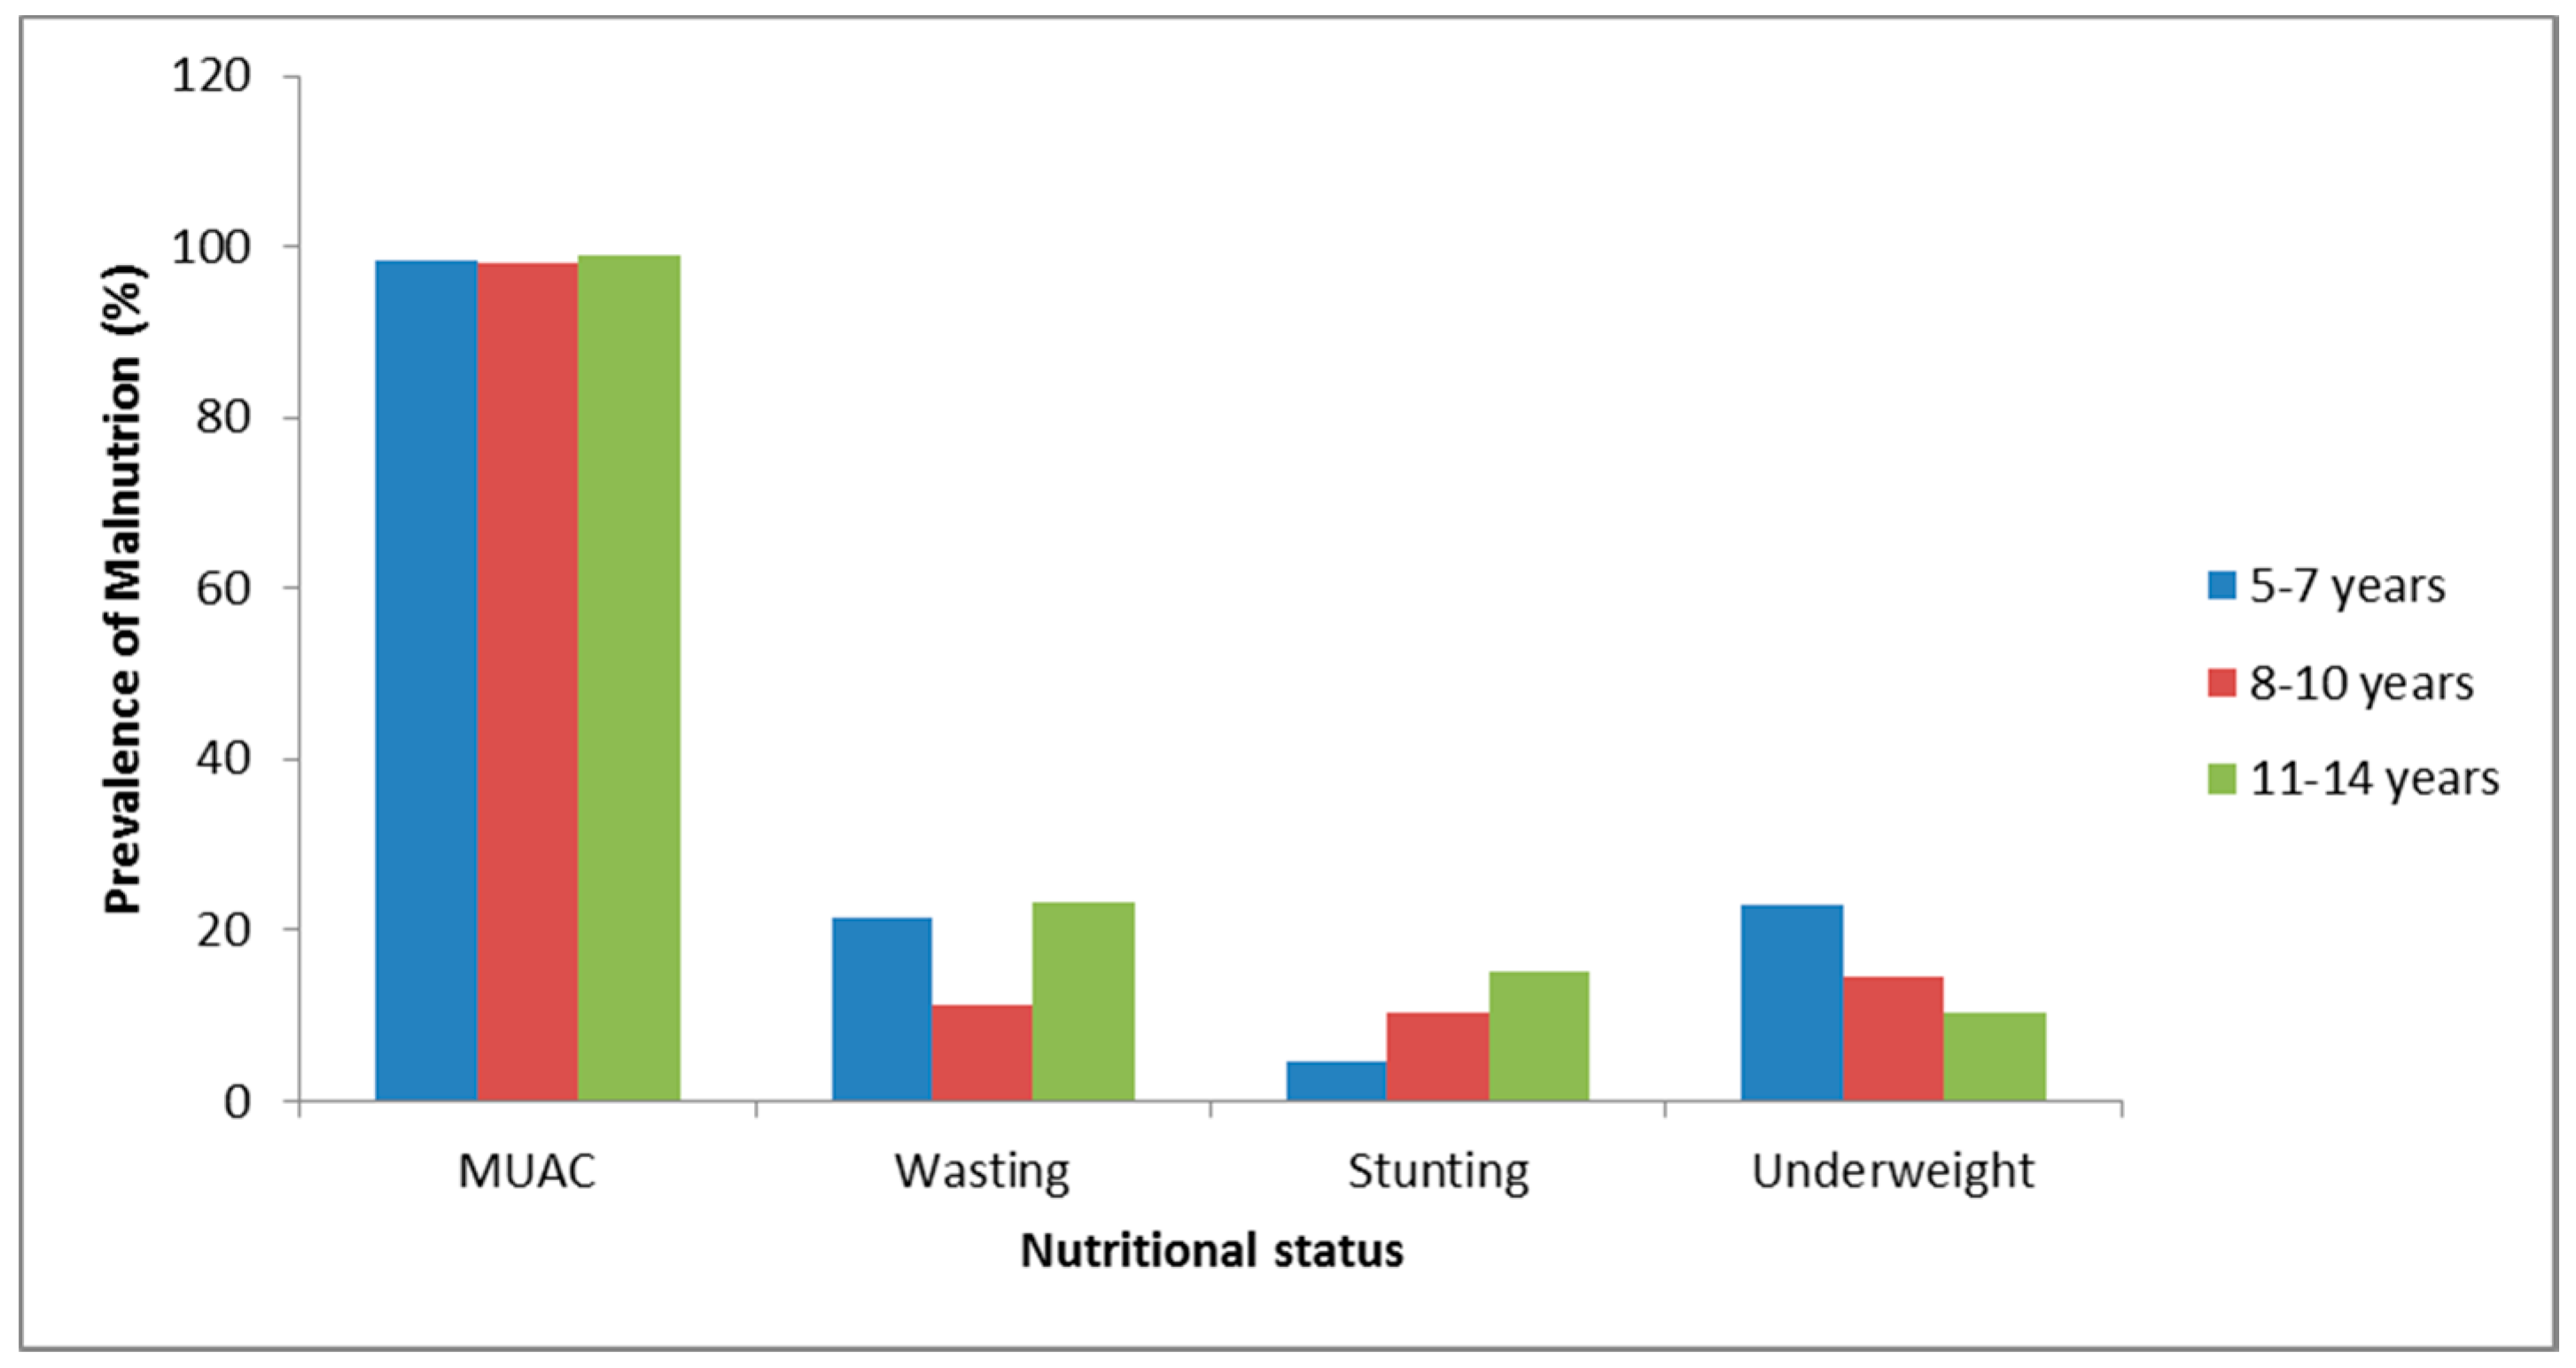
| Underweight (WAZ) | −0.84 (0.57) | −0.58 (0.90) | −0.90 (0.49) | −0.93 (0.47) | −1.02 (0.52) | −1.07 (0.62) |
| Stunting (HAZ) | −0.11 (0.98) * | 1.90 (1.18) * | −0.38 (0.95) | −0.29 (0.78) | −0.65 (0.99) | −0.45 (0.90) |
| Wasting (WHZ) | −1.14 (0.39) | −1.07 (0.85) | −1.05 (0.42) | −1.03 (0.45) | −0.97 (0.35) | −0.99 (0.64) |
| MUAC | 15.78 (1.03) | 15.61 (1.43) | 16.85 (1.20) | 16.90 (1.43) | 18.31 (1.69) | 19.05 (2.28) |
| Variables | Mean Blood Pressure | |||||
|---|---|---|---|---|---|---|
| Non-Adjusted | Adjusted for Age and Sex | |||||
| β | p-Value | 95% CI | β | p-Value | 95% CI | |
| Birth weight (kg) | −0.43 | 0.44 | −1.55–0.69 | −0.56 | 0.29 | 53.95–63.33 |
| Head circumference (cm) | 0.01 | 0.75 | −0.08–0.11 | 0.04 | 0.34 | −0.05–0.14 |
| Gestational age | −0.02 | 0.84 | −0.23–0.18 | −0.02 | 0.82 | −0.23–0.18 |
| Sum4sf (mm) | 0.26 | 0.00 | 0.15–0.36 | 0.18 | 0.03 | 0.01–0.22 |
| Underweight (WAZ) | −0.01 | 0.99 | −1.38–1.37 | 0.14 | 0.83 | −1.26–1.55 |
| Stunting (HAZ) | −0.13 | 0.71 | −0.84–0.57 | −0.10 | 0.80 | −0.88–0.68 |
| Wasting (WHZ) | −0.94 | 0.24 | −2.49–0.62 | −1.05 | 0.19 | −0.27–0.61 |
| MUAC | 0.26 | 0.19 | −0.13–0.65 | 0.11 | 0.65 | −0.37–0.59 |
| Systolic BP | ||||||
| Birth weight (kg) | 0.28 | 0.74 | −1.34–1.94 | 0.07 | 0.93 | −1.49–1.63 |
| Head circumference (cm) | −0.03 | 0.70 | −0.18–0.12 | 0.01 | 0.91 | −0.13–0.15 |
| Gestational age | −0.11 | 0.44 | −0.38–0.16 | −0.12 | 0.41 | −0.39–0.16 |
| Sum4sf (mm) | 0.35 | 0.00 | 0.20–0.51 | 0.18 | 0.03 | 0.02–0.34 |
| Underweight (WAZ) | −0.54 | 0.54 | −2.30–1.21 | −0.32 | 0.73 | −2.12–1.49 |
| Stunting (HAZ) | −0.18 | 0.70 | −1.08–0.73 | −0.12 | 0.81 | −1.11–0.86 |
| Wasting (WHZ) | −1.56 | 0.13 | −3.55–0.44 | −1.62 | 0.11 | −3.61–0.38 |
| MUAC | 0.25 | 0.34 | −0.27–0.77 | 0.12 | 0.72 | −0.52–0.76 |
| Diastolic BP | ||||||
| Birth weight (kg) | −0.79 | 0.17 | −1.90–0.33 | −0.87 | 0.11 | −1.93–0.20 |
| Head circumference (cm) | 0.04 | 0.45 | −0.06–0.14 | 0.06 | 0.19 | −0.03–0.16 |
| Gestational age | 0.02 | 0.83 | −0.19–0.23 | 0.02 | 0.84 | −0.19–0.23 |
| Sum4sf (mm) | 0.21 | 0.00 | 0.10–0.31 | 0.09 | 0.12 | −0.02–0.19 |
| Underweight (WAZ) | −0.42 | 0.54 | −1.75–0.91 | −0.12 | 0.86 | −1.49–1.25 |
| Stunting (HAZ) | 0.04 | 0.91 | −0.65–0.73 | 0.15 | 0.69 | −0.60–0.90 |
| Wasting (WHZ) | −1.24 | 0.11 | −2.76–0.28 | −1.29 | 0.09 | −2.81–0.23 |
| MUAC | 0.26 | 0.19 | −0.13–0.66 | 0.11 | 0.67 | −0.38–0.74 |
| Variables | Unadjusted | Adjusted for Age and Sex | ||||
|---|---|---|---|---|---|---|
| OR | p-Value | 95% CI | OR | p-Value | 95% CI | |
| High Systolic BP | ||||||
| Low birth weight | 1.34 | 0.516 | 0.56–3.22 | 1.31 | 0.553 | 0.54–3.16 |
| Wasting (WHZ) | 0.22 | 0.044 | 0.05–0.96 | 0.22 | 0.048 | 0.05–0.10 |
| Stunting (HAZ) | 0.74 | 0.633 | 0.22–2.54 | 0.85 | 0.800 | 0.24–2.10 |
| Underweight (WAZ) | 2.23 | 0.068 | 0.94–5.27 | 2.21 | 0.074 | 0.93–5.27 |
| High Diastolic BP | ||||||
| Low birth weight | 1.03 | 0.949 | 0.46–2.31 | 0.96 | 0.913 | 0.42–2.17 |
| Wasting | 0.69 | 0.362 | 0.31–1.53 | 0.66 | 0.326 | 0.29–1.50 |
| Stunting | 1.57 | 0.289 | 0.68–3.59 | 1.78 | 0.188 | 0.76–4.18 |
| Underweight | 3.20 | 0.001 | 1.62–6.32 | 3.10 | 0.001 | 1.56–6.19 |
| Hypertension | ||||||
| Low birth weight | 1.07 | 0.914 | 0.30–3.90 | 1.03 | 0.968 | 0.28–3.78 |
| Wasting (WHZ) | 0.00 | 0.997 | - | 0.00 | 0.996 | - |
| Stunting (HAZ) | 0.56 | 0.577 | 0.07–4.37 | 0.63 | 0.665 | 0.08–5.05 |
| Underweight (WAZ) | 5.13 | 0.001 | 1.89–13.92 | 5.26 | 0.001 | 1.93–14.34 |
© 2017 by the authors. Licensee MDPI, Basel, Switzerland. This article is an open access article distributed under the terms and conditions of the Creative Commons Attribution (CC BY) license (http://creativecommons.org/licenses/by/4.0/).
Share and Cite
Monyeki, K.; Kemper, H.; Mogale, A.; Hay, L.; Sekgala, M.; Mashiane, T.; Monyeki, S.; Sebati, B. Association between Blood Pressure and Birth Weight among Rural South African Children: Ellisras Longitudinal Study. Int. J. Environ. Res. Public Health 2017, 14, 974. https://doi.org/10.3390/ijerph14090974
Monyeki K, Kemper H, Mogale A, Hay L, Sekgala M, Mashiane T, Monyeki S, Sebati B. Association between Blood Pressure and Birth Weight among Rural South African Children: Ellisras Longitudinal Study. International Journal of Environmental Research and Public Health. 2017; 14(9):974. https://doi.org/10.3390/ijerph14090974
Chicago/Turabian StyleMonyeki, Kotsedi, Han Kemper, Alfred Mogale, Leon Hay, Machoene Sekgala, Tshephang Mashiane, Suzan Monyeki, and Betty Sebati. 2017. "Association between Blood Pressure and Birth Weight among Rural South African Children: Ellisras Longitudinal Study" International Journal of Environmental Research and Public Health 14, no. 9: 974. https://doi.org/10.3390/ijerph14090974