Article

Groundwater Pollution Sources Apportionment in the Ghaen Plain, Iran

by
Mohammad Reza Vesali Naseh
1,
Roohollah Noori
2,*,
Ronny Berndtsson
3,
Jan Adamowski
4 and
Elaheh Sadatipour
2
1
Department of Civil Engineering, Faculty of Engineering, Arak University, Arak 38156-879, Iran
2
Department of Environmental Engineering, Graduate Faculty of Environment, University of Tehran, 14155-6135 Tehran, Iran
3
Department of Water Resources Engineering & Center for Middle Eastern Studies, Lund University, Box 118, SE-221 00 Lund, Sweden
4
Department of Bioresource Engineering, Faculty of Agricultural and Environmental Sciences, McGill University, Montréal, QC H3A 0G4, Canada
*
Author to whom correspondence should be addressed.
Int. J. Environ. Res. Public Health 2018, 15(1), 172; https://doi.org/10.3390/ijerph15010172
Submission received: 16 November 2017 / Revised: 8 January 2018 / Accepted: 13 January 2018 / Published: 22 January 2018

Abstract

:
Although Iran’s Ghaen Plain provides saffron to much of the world, no regional groundwater quality (GQ) assessment has yet been undertaken. Given the region’s potential for saltwater intrusion and heavy metal contamination, it is important to assess the GQ and determine its main probable source of pollution (MPSP). Such knowledge would allow for informed mitigation or elimination of the potential adverse health effects of this groundwater through its use as drinking water, or indirectly as a result of the consumption of groundwater-irrigated crops. Total dissolved solids, sodium, and chloride in the water of the majority of 16 wells sampled within the region exceeded World Health Organization and Iranian permissible standards for drinking water. The groundwater proved to only be suitable for irrigating salt tolerant crops under good drainage conditions. Due to the precipitation of calcium carbonate in the water supply facilities, the water from all wells was deemed unsuitable for industrial purposes. Heavy metal pollution and contamination indices showed no groundwater contamination. Analysis of ionic ratios and the application of principal components analysis indicated the MPSP to be saltwater intrusion, with the geology subtending the plain, and to a lesser extent, anthropogenic activities. Reducing groundwater withdrawals, particularly those for agricultural production by using high performance irrigation methods could reduce saltwater intrusion and improve GQ in the Ghaen Plain.

1. Introduction

In arid and semiarid parts of the world, groundwater is often the only source of water available for agricultural, industrial, and drinking purposes. The deterioration of groundwater quality (GQ) in the saffron-producing Ghaen Plain (South Khorasan Province, Iran) is largely attributable to pollution arising from saltwater intrusion, use of chemical fertilizers, and the disposal of municipal sewage. The Ghaen Plain is situated northeast of the central Dasht-e Lut desert, where the moderate resolution imaging spectroradiometer (MODIS) on NASA’s Aqua satellite detected a maximum land surface temperature of 70.7 °C, making the desert the hottest place on Earth. Shallow saltwater table aquifers beneath the Ghaen Plain have rendered the groundwater unsuitable for drinking and irrigation; notwithstanding, its continued use has led to decreasing groundwater levels, raising the risk of saltwater intrusion from the Dasht-e Lut desert. Uncontrolled use of chemical fertilizers for agricultural purposes and infiltration of municipal wastewaters into groundwater due to a lack of sewage systems may have further reduced its GQ and made it potentially hazardous to drink or use in the irrigation of agricultural crops. The Ghaen Plain may also be affected by heavy metals, which could result in significant ecological problems and bio-accumulation through the food chain. These elements are highly toxic, even at low levels, and as they are non-degradable, they have a lengthy residence time in the environment [1,2,3,4]. Accordingly, determining the main probable source of pollution (MPSP) in the Ghaen Plain is important to anticipate the potential health effects on the region’s inhabitants arising from drinking and irrigating with this groundwater.
Ionic ratios and statistical analyses, particularly principal components factor analysis (PCFA), have been used in several studies to determine the MPSP of water resource systems or individual water bodies [5,6,7,8,9,10,11,12,13]. While some studies have determined the MPSP of groundwater using only ionic ratios [14,15,16,17,18,19,20,21], given the large margins of error for both ionic ratio and PCFA methods’, it is more accurate to apply both methods simultaneously to determine MPSP. If both methods concur, findings are deemed more reliable for planning and management strategies targeted at protecting the GQ. Accordingly, some studies have applied both methods in determining the MPSP of groundwater [22,23,24].
Although the Ghaen Plain plays a vital role in providing saffron to the world, neither an assessment of its GQ, nor an evaluation of the potential hazard of saltwater intrusion and heavy metals have been made for the region. Therefore, the main objectives of this study were to: (i) Conduct a field study of the physiochemical parameters of groundwater (PCPs) in the Ghaen Plain; (ii) Compare observations with permissible levels; (iii) Evaluate heavy metal pollution in groundwater by means of the heavy metal pollution index (HPI) and the contamination index (Cd); and, (iv) Identify groundwater MPSP through the application of ion ratios and PCFA.

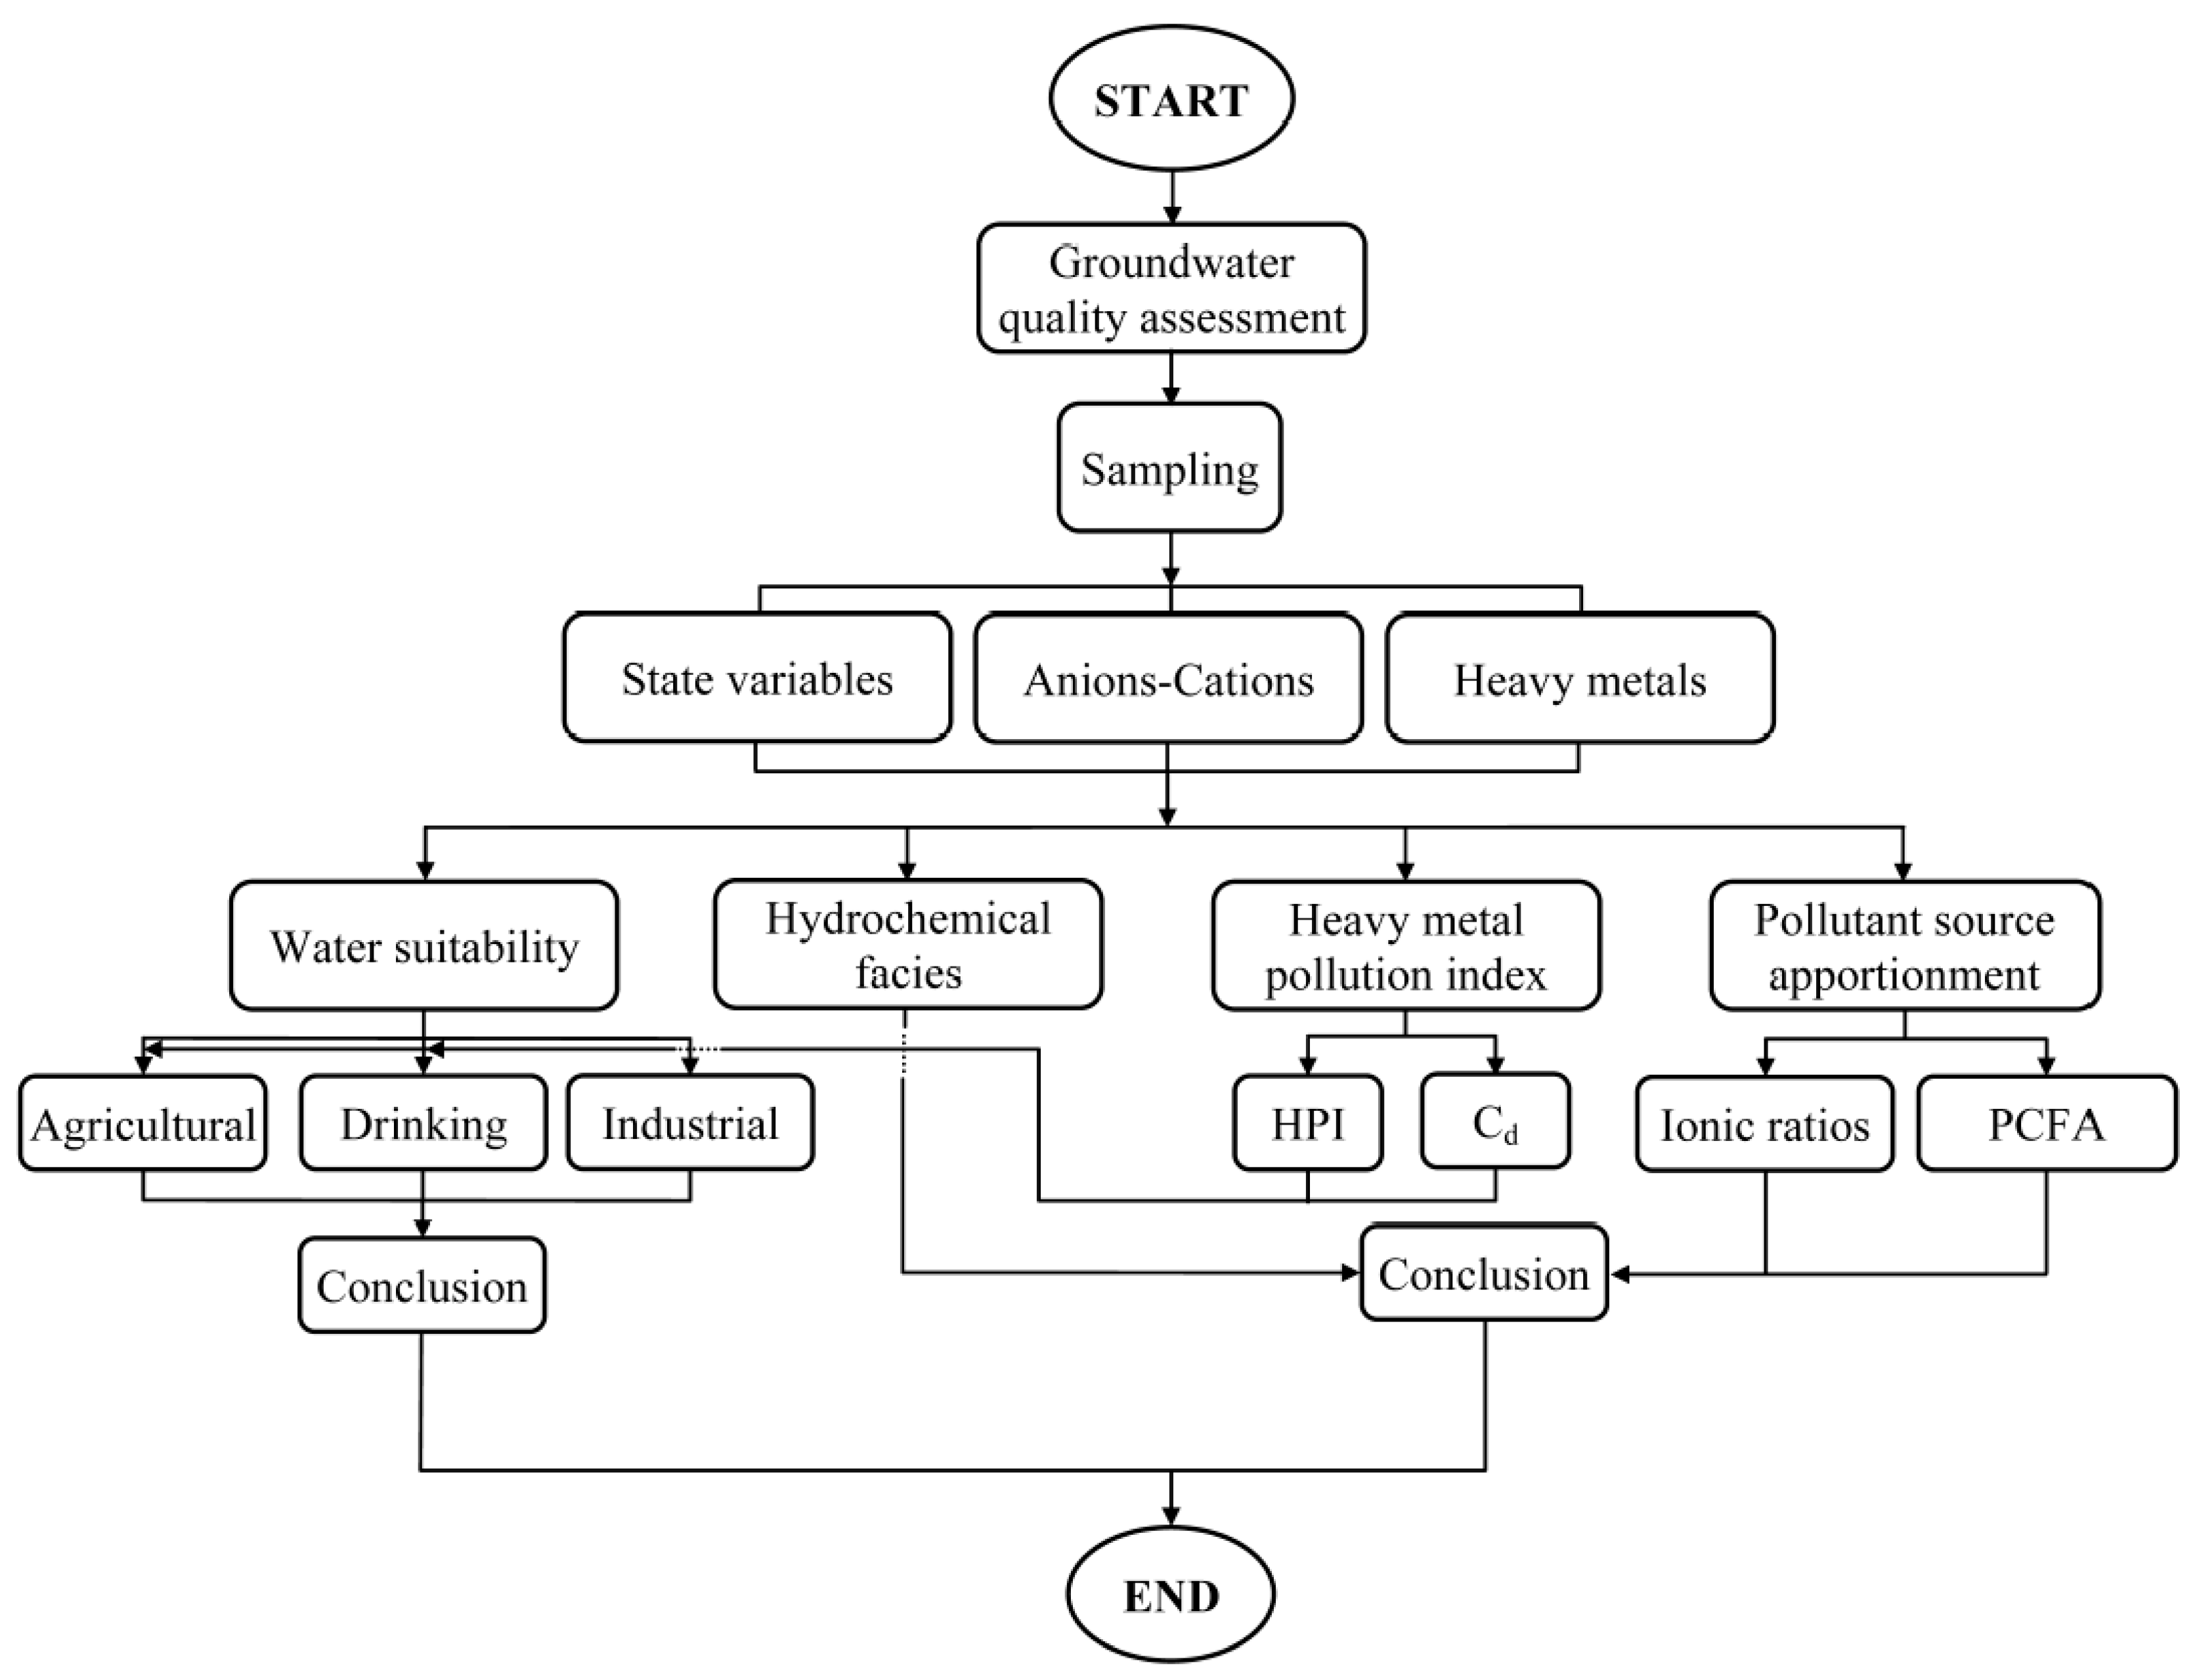
2. Materials and Methods

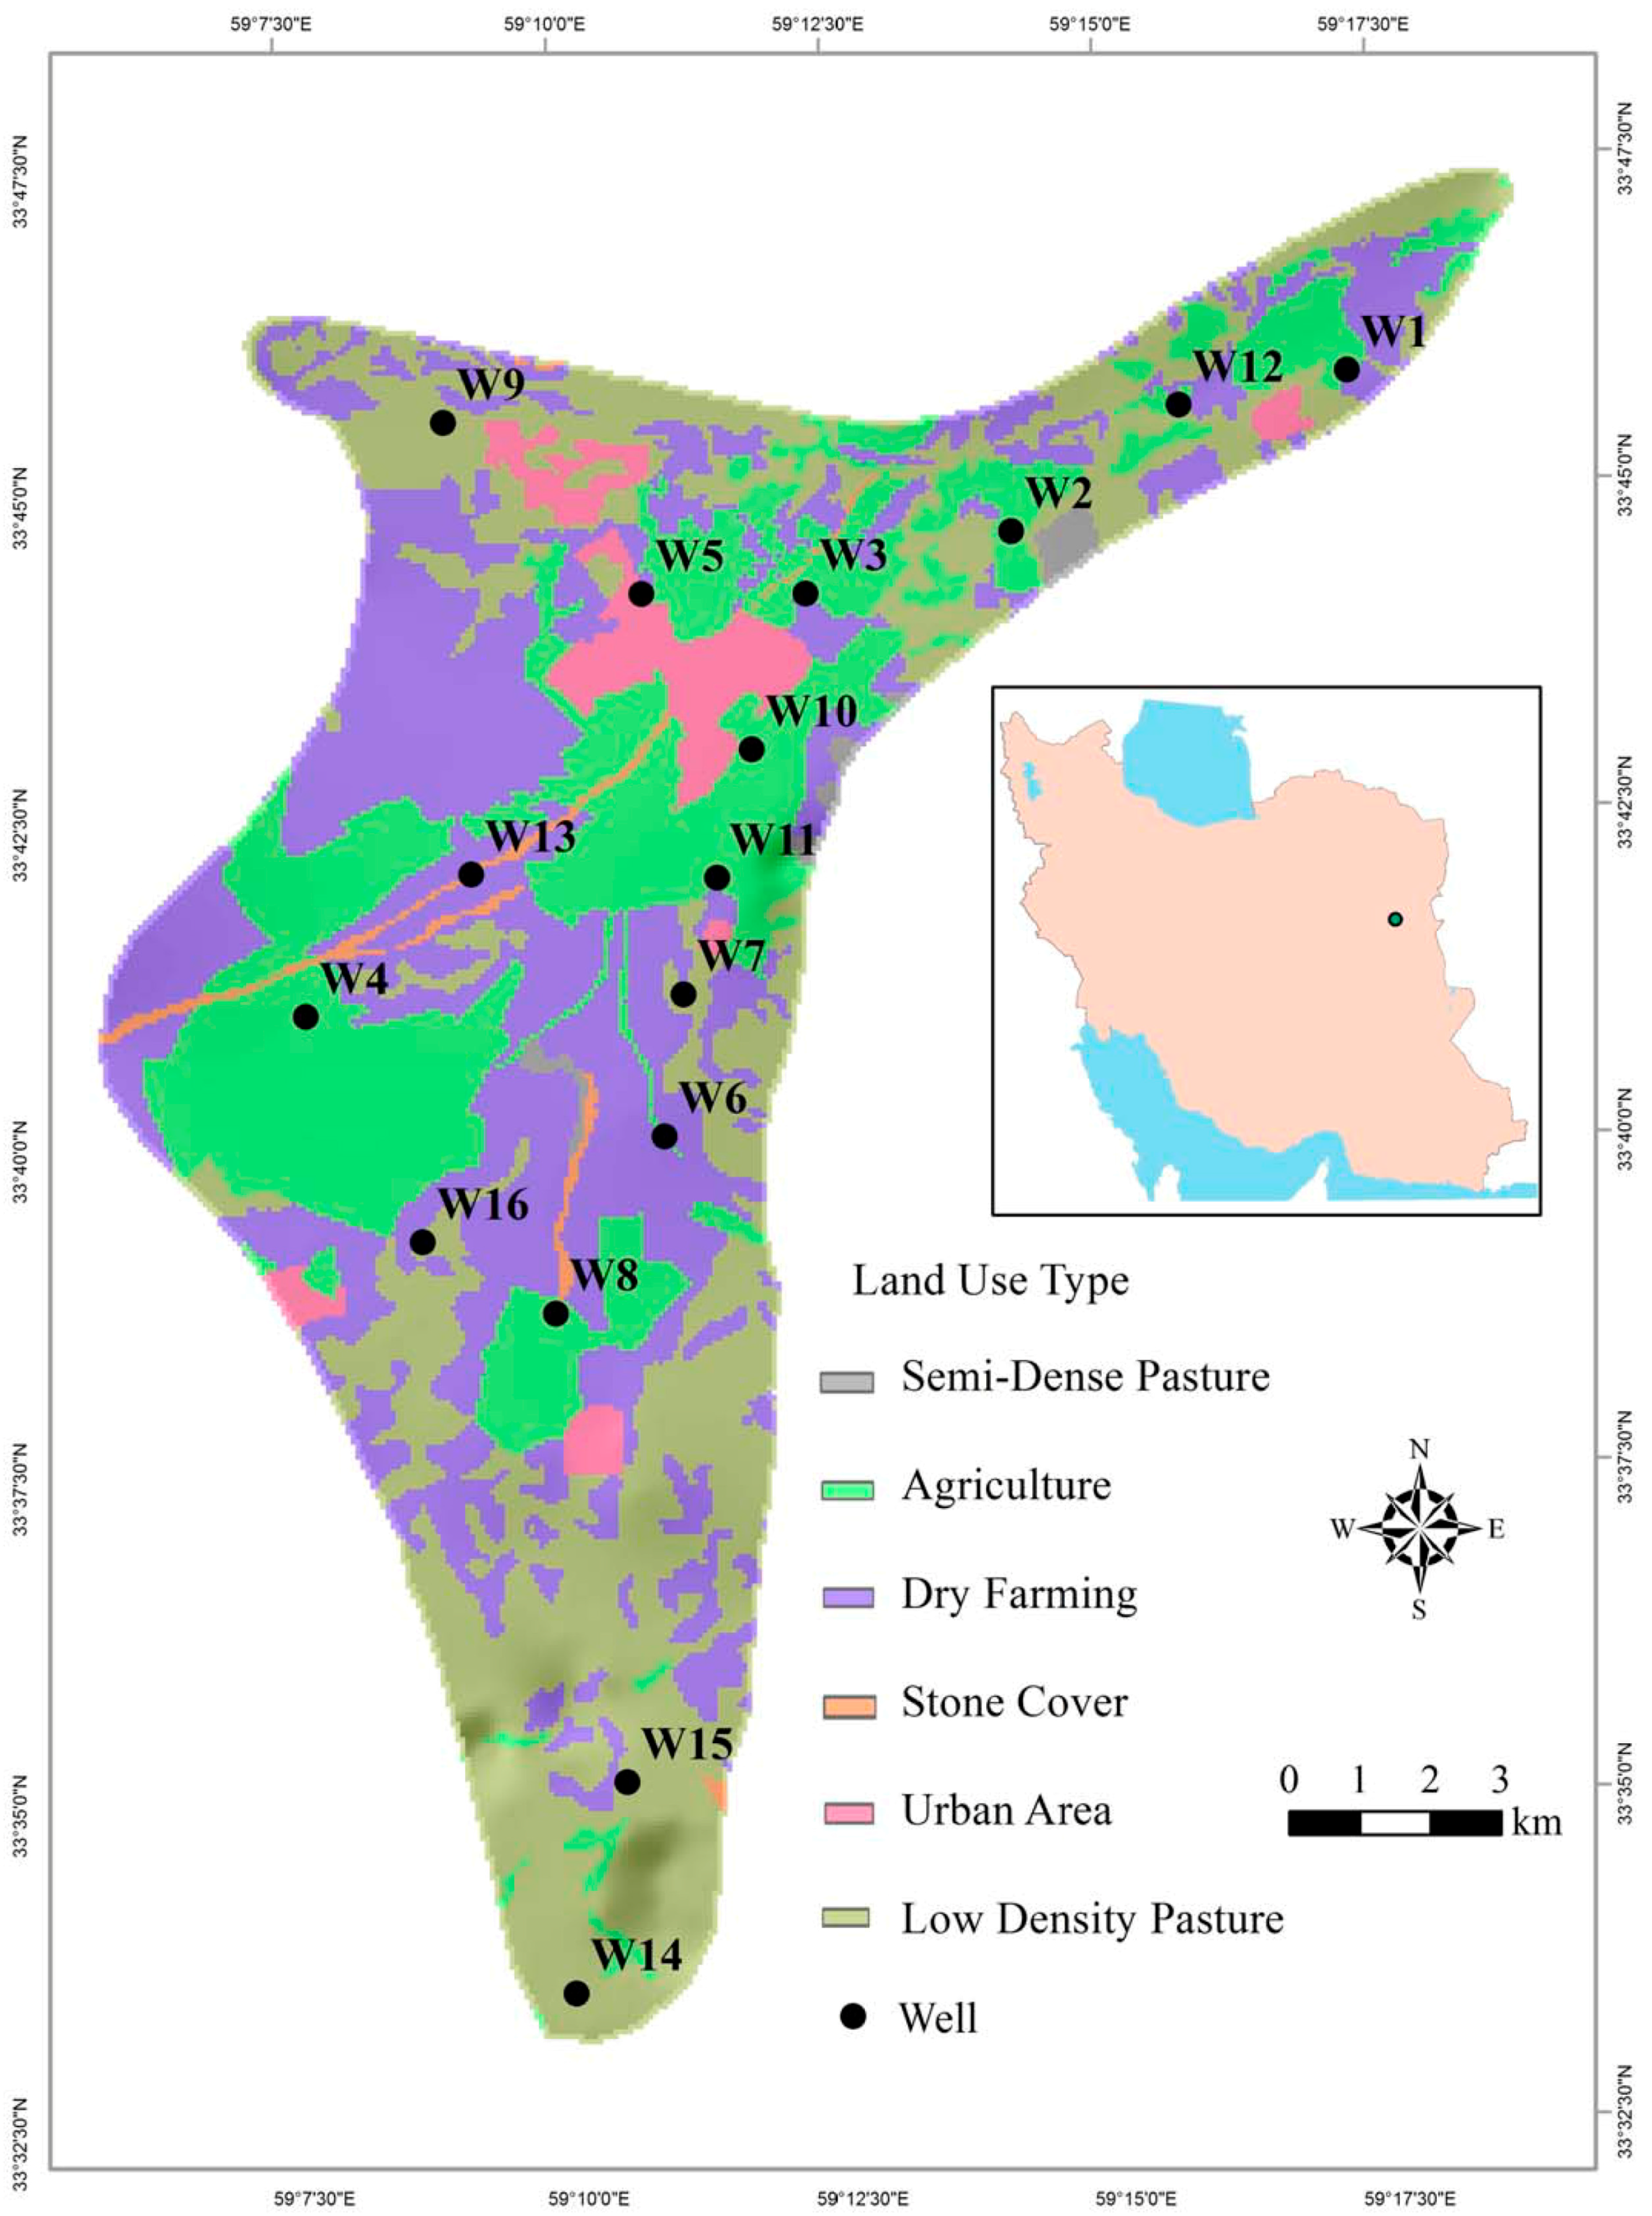
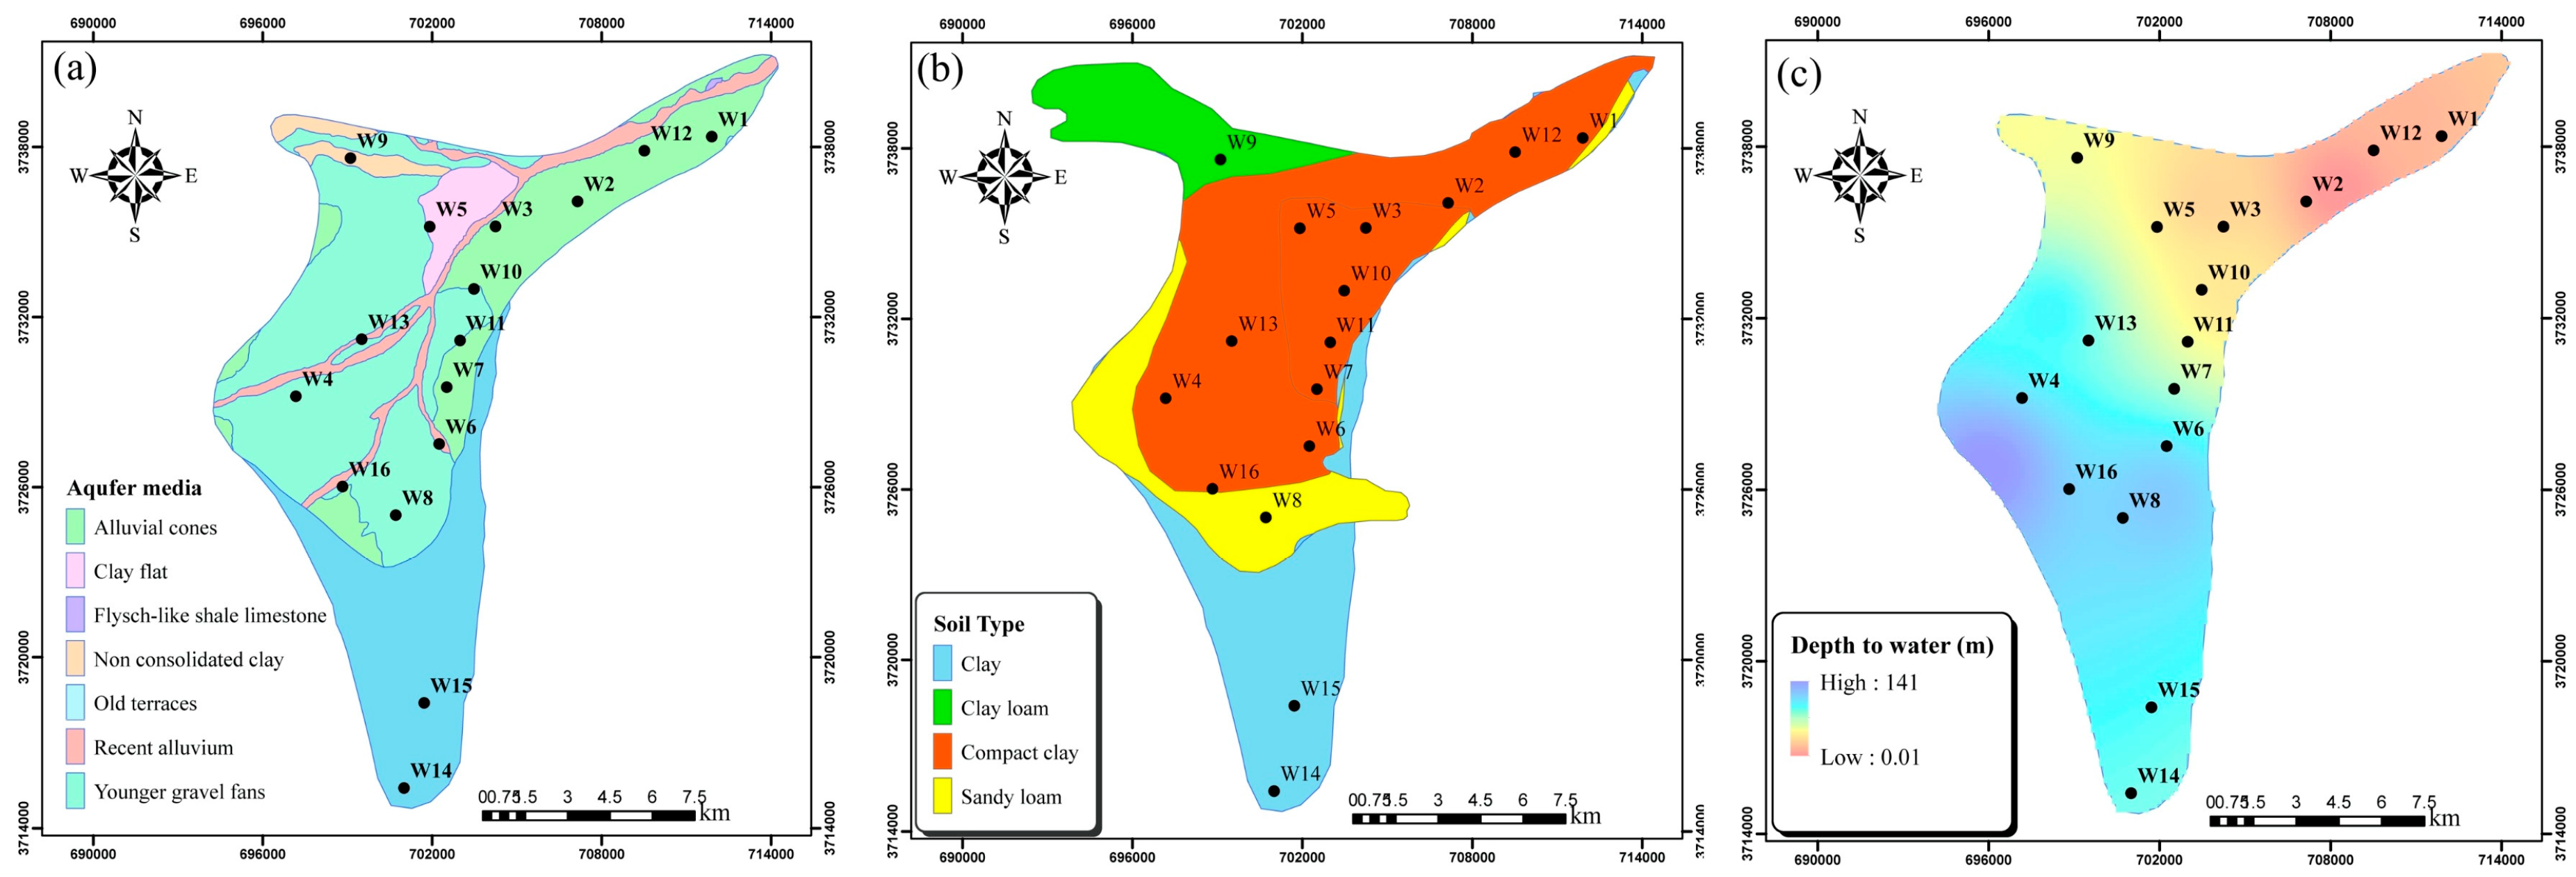
2.1. Study Area and Data Collection

Steps involved in the evaluation of GQ in the Ghaen Plain are shown in Figure 1.
The Ghaen Plain is located between 58°34′ and 59°11′ E longitude and between 33°03′ and 33°26′ N latitude (Figure 2). A high rate of evaporation (≈3100 mm year−1), low precipitation (≈160 mm year−1), lack of perennial rivers and increased demand for domestic consumption and irrigation have caused the groundwater supply to be severely stressed in recent decades.
The Ghaen aquifer consists mainly of sand mixed with silt and clay, and lesser amounts of glacial deposits, shales, and igneous rocks (Figure 3a). Soils in most parts of the plain are sandy loams, clay and compact clays, and there are some smaller patches of clay loam (Figure 3b). Depth to groundwater in the Ghaen Plain varies from 0 to 140 m and over most of its extent exceeds 30 m (Figure 3c). Since the soil and aquifer consist mainly of fine-grained alluvial deposits and the groundwater in most parts of the plain (except the northeast) is generally deep, it is likely not very exposed to contamination from anthropogenic activities.
Following the guidelines of the Standard Methods for the Examination of Water and Wastewater [25], different groundwater samples (metal vs. non-metal analyses) were collected in different numbers at 16 different Ghaen Plain well locations over the 2015 summer season (Figure 2). Water samples were collected in two-liter plastic (non-metals) or glass (metals) vessels. Necessary preservatives were added to samples, and they were placed into a cooler with ice for immediate delivery to the laboratory. Details on holding times and preservations for water samples are given in Table 1. Twenty eight PCPs including: state variables {pH, electrical conductivity (EC), total dissolved solids (TDS), total hardness (TH), total phosphorous (TP), total nitrogen (TN), ammonia (NH3), and alkalinity (Alk)}; anions and cations {bicarbonate (HCO3), sulfate (SO42−), chloride (Cl), orthophosphate (PO43−), nitrate (NO3), nitrite (NO2), fluoride (F), calcium (Ca2+), magnesium (Mg2+), sodium (Na+), potassium (K+), and silicon (Si4+)}; and heavy metals {boron (B), copper (Cu), chromium (Cr), manganese (Mn), zinc (Zn), iron (Fe), lead (Pb), and cadmium (Cd)} were analyzed for each sample.
Before sampling, well pumps worked for at least one hour and sampling vessels were rinsed three times with the pumped water, to guarantee representative groundwater samples. The EC, pH, and TDS were analyzed in-situ using a Hach pH meter, whereas other parameters were analyzed in the laboratory. Heavy metals, anions-cations, and TDS-TH were determined by inductively coupled plasma optical emission spectrometry (ICP-OES), ion chromatography (IC), and spectrophotometer DR4000, respectively. A blank sample was tested for each well to determine the accuracy of analyses. Laboratory instrument replicates were used to determine precision for the instruments. Finally, a relative error less than ±5% was achieved for all PCPs analyzed.

2.2. Heavy Metal Pollution Indices

The HPI proposed by Mohan et al. [26] and the Cd developed by Backman et al. [27] are useful tools for assessing water quality and can provide practical information for relevant decisions related to the health risks of water pollution. The HPI, calculated according to Equation (1), determines the general status of water quality regarding heavy metals, based on the weighted arithmetic quality mean method:
HPI = i = 1 n W i Q i / i = 1 n W i
where, Wi (unit weightage) is calculated as inversely proportional to the standard permissible value of the corresponding parameter [28], n is the number of parameters, and Qi is the sub-index of ith parameter, calculated for each parameter:
Q i = i = 1 n { [ | M i I i | / ( S i I i ) ] × 100 }
where Mi is the measured ith parameter, Ii and Si are the highest desirable and the standard permissible values of the ith parameter, respectively. The suggested critical value of HPI is 100 [28]. In the present study, Fe, Cd, Cr, Cu, Mn, Pb, and Zn were considered in calculating the HPI.
The Cd denotes the collective contamination effects of several heavy metals [27]:
C d = i = 1 n [ ( C A i / C N i ) 1 ]
where C A i and C N i represent the analytical value and upper permissible concentration of the ith component, respectively. Note that C N i is equal to Si in the HPI formula. Based on the Cd index, values less than 1, 1 to 3, and more than 3 indicate low, medium, and high levels of heavy metal contamination, respectively.

2.3. Principal Components Factor Analysis (PCFA)

PCFA can be used to identify MPSP in water resource systems [29,30]. To determine the MPSP in the Ghaen aquifer, the 28 PCPs measured in the wells were used as primary variables for application of the PCFA (X1, X2, …, X28). Thereafter, these primary variables were transferred to 28 independent principal components (PCs) (ξ1, ξ2, …, ξ28). By using PCFA, each PC was expressed as a linear combination of the 28 PCPs [31]:
ξ i = ψ i 1 X 1 + ψ i 2 X 2 + + ψ i 28 X 28
where, ψ i 1 are eigenvectors extracted from the eigenvalue problem [32]:
| Γ δ I | = 0
where, I = unit matrix, Г = correlation matrix among 28 PCPs, and δ = eigenvalues [33]. Eigenvectors corresponding to the eigenvalues can be calculated by applying Equation (5). Since this transformation is orthogonal from X to ξ, Equation (4) can be rewritten as [34]:
X i = ψ 1 i ξ 1 + ψ 2 i ξ 2 + + ψ 28 i ξ 28
Since the few first PCs represent most of the variance of the input variables, only the first k PCs are used [35]. Given this assumption, Equation (6) can be expressed as:
X i = δ 1 ψ 1 i Θ 1 + δ 2 ψ 2 i Θ 2 + + δ k ψ k i Θ k + l i
where, l is a linear combination of Θk+1 to Θ28 PCs, and Θk is the principal factors calculated as Θ k = ξ k / δ k .
The PCFA model without rotation is expressed as [34]:
X i = β i 1 Θ 1 + β i 2 Θ 2 + + β i k Θ k + l i
where βij can be calculated as β i j = δ j ψ j i .
The final step in the application of PCFA is the implementation of a VARIMAX rotation on the eigenvectors matrix [36,37]:
Θ = X G ( G G ) 1
where Θ is the rotated factor matrix, X is the main data matrix which contains mean and variance equal to zero and one, respectively, and G is the matrix of factor loadings ( ϑ i k ). Finally, Equation (9) can be rewritten as:
Θ i = ϑ 1 i X 1 + ϑ 2 i X 2 + + ϑ k i X k + l i
One can now extract the rotated principal factors (RPFs) from the primary data for determination of MPSP in each water body system [34].

3. Results and Discussion

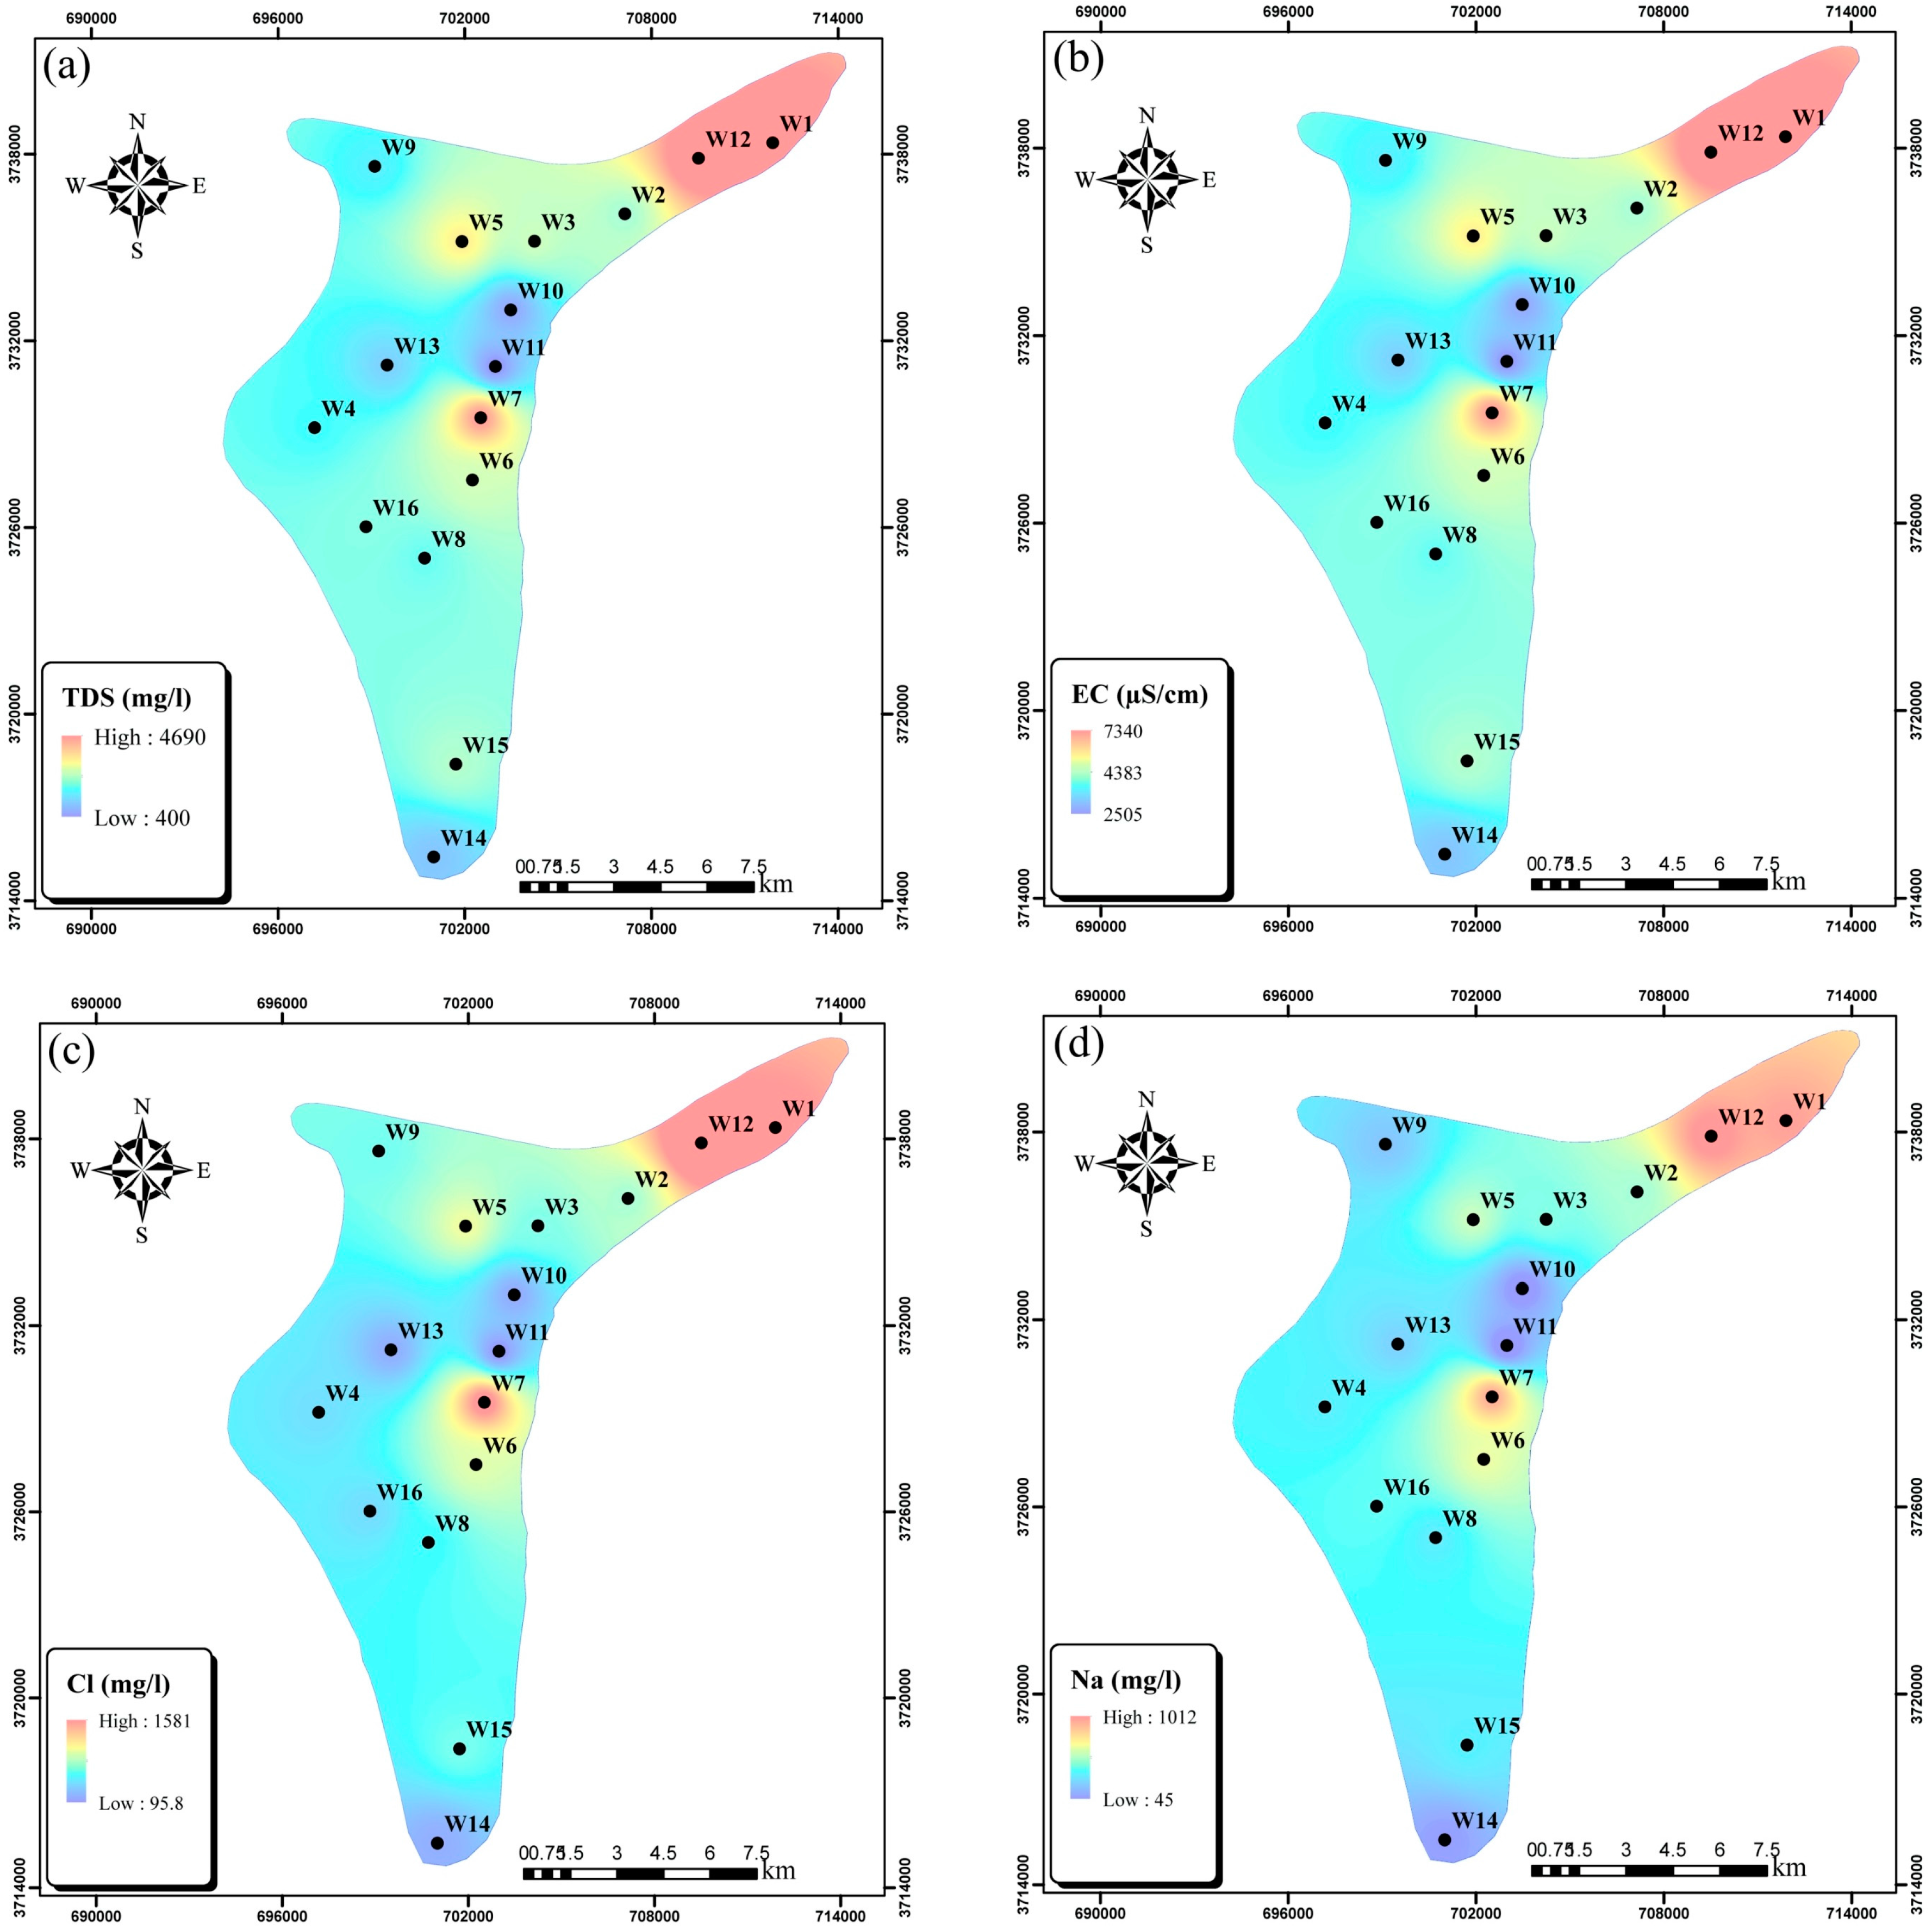
3.1. Sampling Results

The PCPs measured at sampling wells along with their main statistical indices are presented in Table S1 of the electronic supplementary material (ESM) and Table 1, respectively. The goodness-of-fit of the collected data to a log-normal distribution was tested using Kolmogorov-Smirnov statistics, which determined that all the measured data were log-normally distributed with a 95% confidence level. The measured PCPs (Table S1) indicate that the main concerns regarding water quality in the Ghaen aquifer are high levels of EC, TDS, Na+, and Cl. Their large spatial variation in the aquifer is shown in Figure 4a–d, respectively. Maximum contaminant concentrations can be seen in the northeastern part of the plain.

3.2. Groundwater Quality Assessment

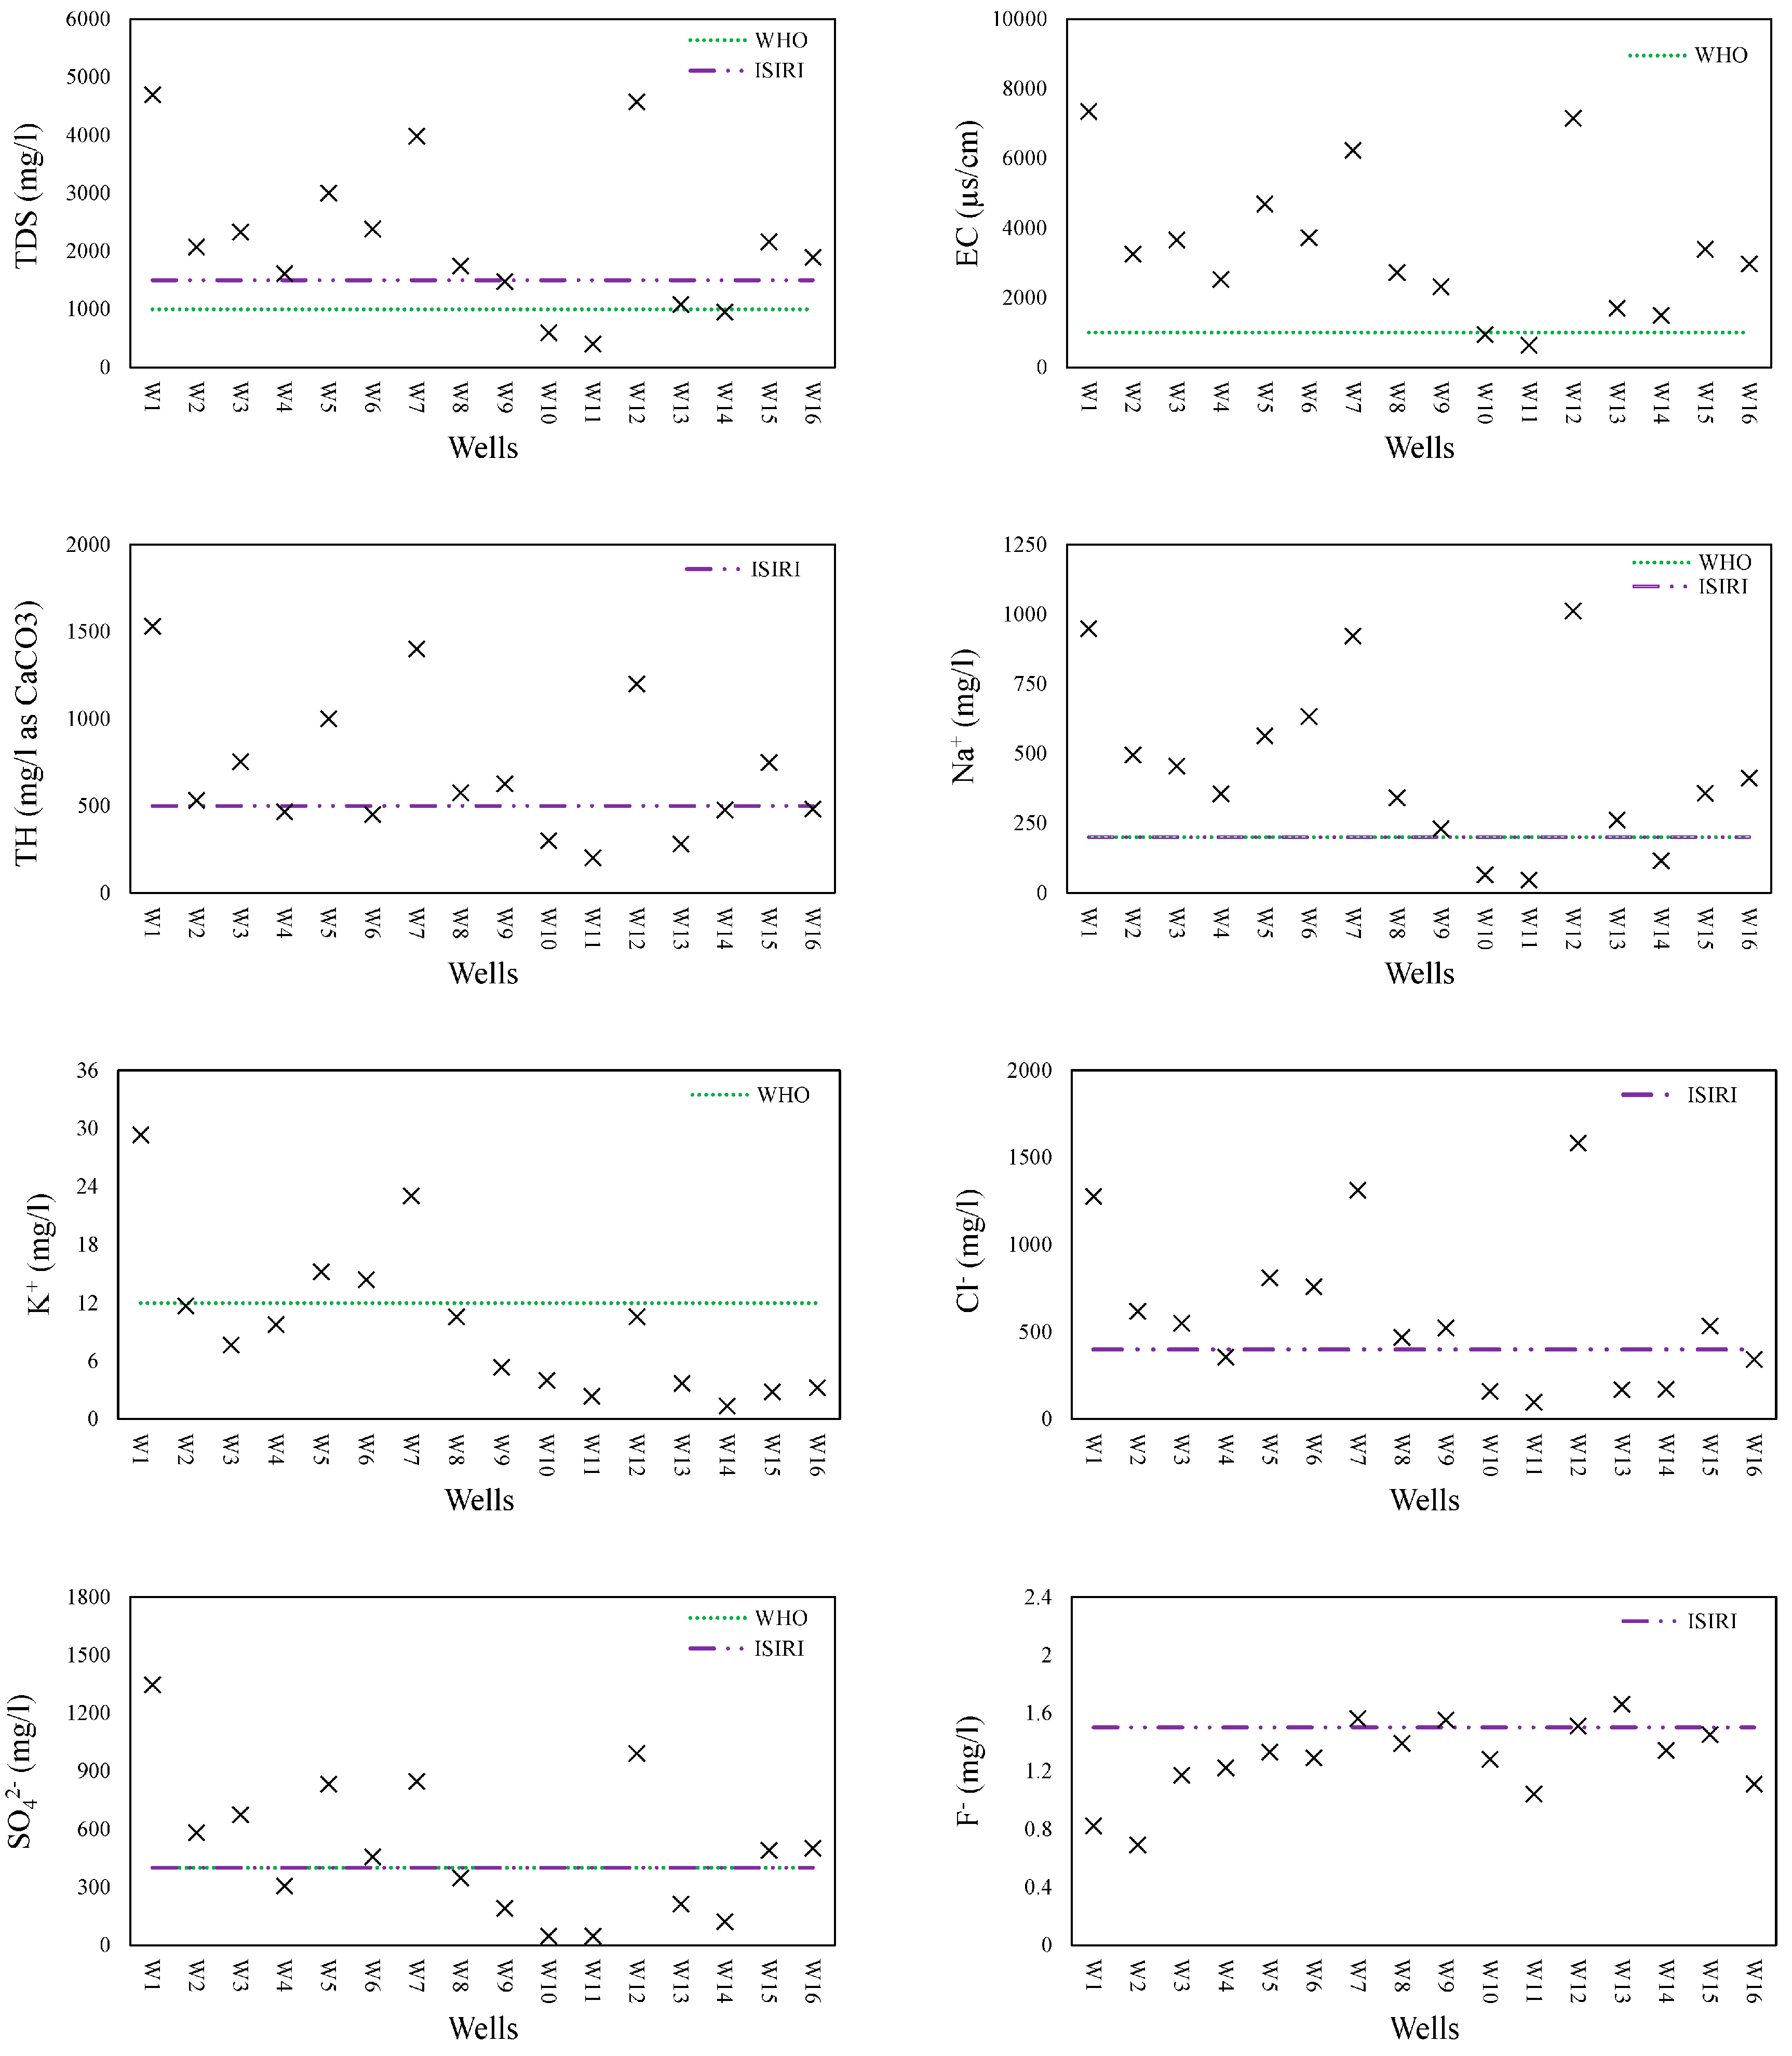
3.2.1. Drinking Water Suitability

All PCPs were compared with Iranian standards for drinking water (ISIRI) and those of the World Health Organization (WHO) to ascertain the suitability of GQ in the study area for drinking purposes. While most of the PCPs measured (Table S1) were within permissible limits for drinking water, those that were not are illustrated in Figure 5.
Although all wells had high concentrations of Mg+2, there is no ISIRI- or WHO-recommended limit for Mg2+ (Table S1). However, some studies indicate that long term exposure to Mg2+ may result in cardiovascular and oncological diseases [38,39,40]. Measured TDS values varied from 400 to 4690 mg L−1 with an average of 2183 mg L−1, thereby exceeding, in most cases, the ISIRI and WHO maximum permissible levels of 1500 and 1000 mg L−1, respectively (Figure 5). The TH in the groundwater samples varied between 201 and 1532 mg L−1 as calcium carbonate. Based on the Todd [41] classification, all groundwater samples could be classified as very hard water. Only seven wells had a TH lower than the permissible limit determined by ISIRI (Figure 5). The Cl concentrations were between 95.9 and 1581 mg L−1, with most groundwater samples exceeding ISIRI’s 400 mg L−1 permissible limit (Figure 5). There were few health-related concerns regarding K+ and F in the groundwater because concentrations in most wells were below permissible WHO and SIRI limits. However, Well 1 had a K+ concentration about 2.5 times higher than permissible levels (Figure 5).
The high concentrations of some PCPs, such as Mg2+, Cl, and TH, and their potential human health effects [42,43], indicate that additional research should be carried out to properly investigate the relationship between exposure to these PCPs and cardiovascular and oncological diseases among the Ghaen Plain’s inhabitants.

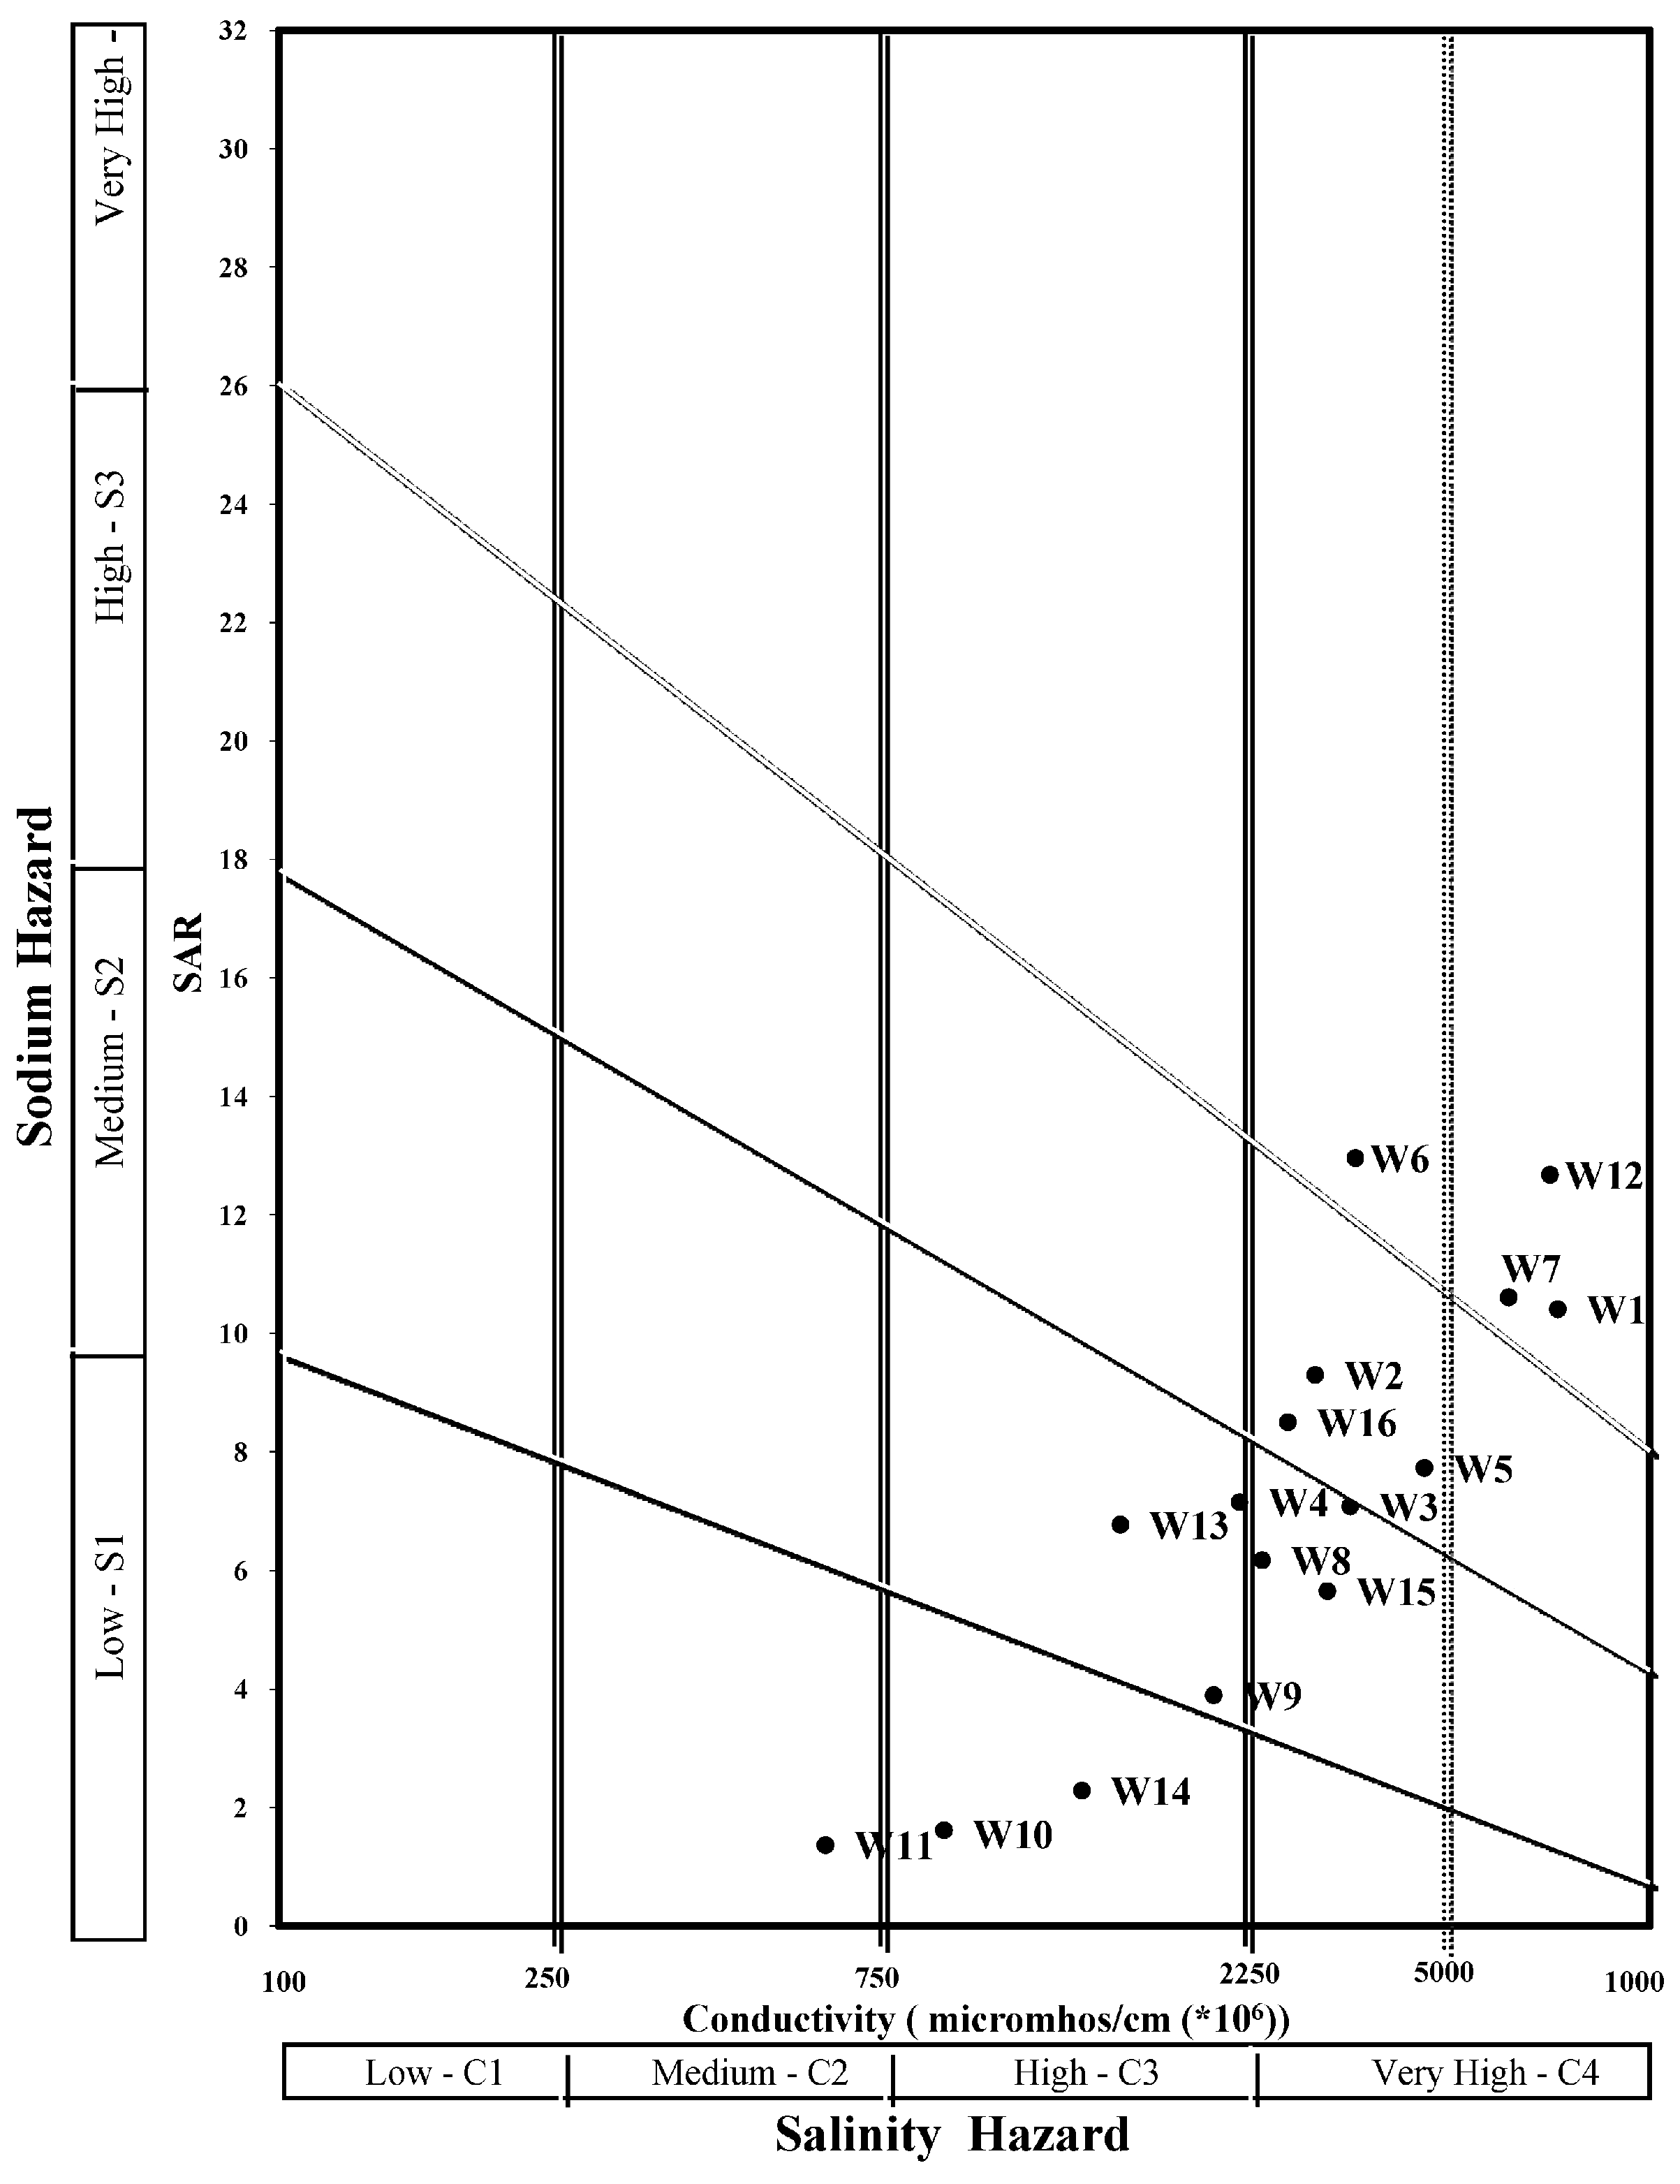
3.2.2. Agricultural Water Suitability

Sodium adsorption ratio (SAR), EC, residual sodium carbonate (RSC), and B are the main factors that determine the suitability of water for agricultural purposes. The Wilcox diagram [44], based on SAR and EC, classifies the suitability of water for agricultural purposes in four classes, from excellent (C1–S1) to unsuitable (C4–S4). As illustrated in Figure 6, most groundwater samples fell into the C4–S2 and C4–S3 classes. This indicates very high salinity and medium to very highly sodic water, which would restrict its use for irrigation. Salt tolerant crops under good drainage conditions could be irrigated with this kind of water. Agricultural productivity is directly affected by water salinity and necessary management strategies should be applied if agricultural managers aim to enhance saffron production in the Ghaen Plain.
The RSC, as proposed by Eaton [45], is related to the presence of high concentrations of bicarbonates that precipitate Ca2+ and Mg2+ from water, cause an increase of Na+ in the water in the form of sodium carbonate, and may affect crop yields. Considering that RSC <1.25 meq L−1, 1.25 ≤ RSC ≤2.50 meq L−1, and RSC > 2.50 meq L−1 are considered safe, marginal, or unsuitable for irrigation, respectively, the fact that all well water RSCs values were below 1.25 indicates that the groundwater was safe for irrigation based on this index (Table S1). Since these results contradict the results obtained through the Wilcox diagram, it is important to note that the Wilcox classification is prioritized in making a decision regarding water suitability for irrigation.
Although B is toxic for crops at high concentrations, it is responsible for the transfer of nutrients and water in plants and crop yields are highly affected when soils are B deficient. McCarthy and Ellery [46] suggested limits of B in water for agricultural purposes (Table 2). Based on this classification, B concentrations in all samples were lower than the suggested limit for irrigation of semi-sensitive crops and, accordingly, there is no toxic effect of B in the groundwater of the study area.

3.2.3. Industrial Water Suitability

To determine the suitability of the groundwater for industrial purposes, the saturation index proposed by Rhades and Bernstein [47] was used. For water samples, the saturation index is calculated as the difference between measured pH (pHw) and calculated pH (pHcal):
Saturation   Index = ( pH w pH cal )
pH cal = 1.776 log ( Ca 2 + ) log ( Alk )
where, Ca2+ is the molar concentration of Ca2+, and Alk is the equivalent concentration of carbonate and bicarbonate. Positive values of the saturation index (Table S1) indicating precipitation of calcium carbonate, tagged water from all wells as being unsuitable for industrial applications. While no major industries currently draw upon Ghaen Plain groundwater, should this occur, the water would have to be pretreated before use.

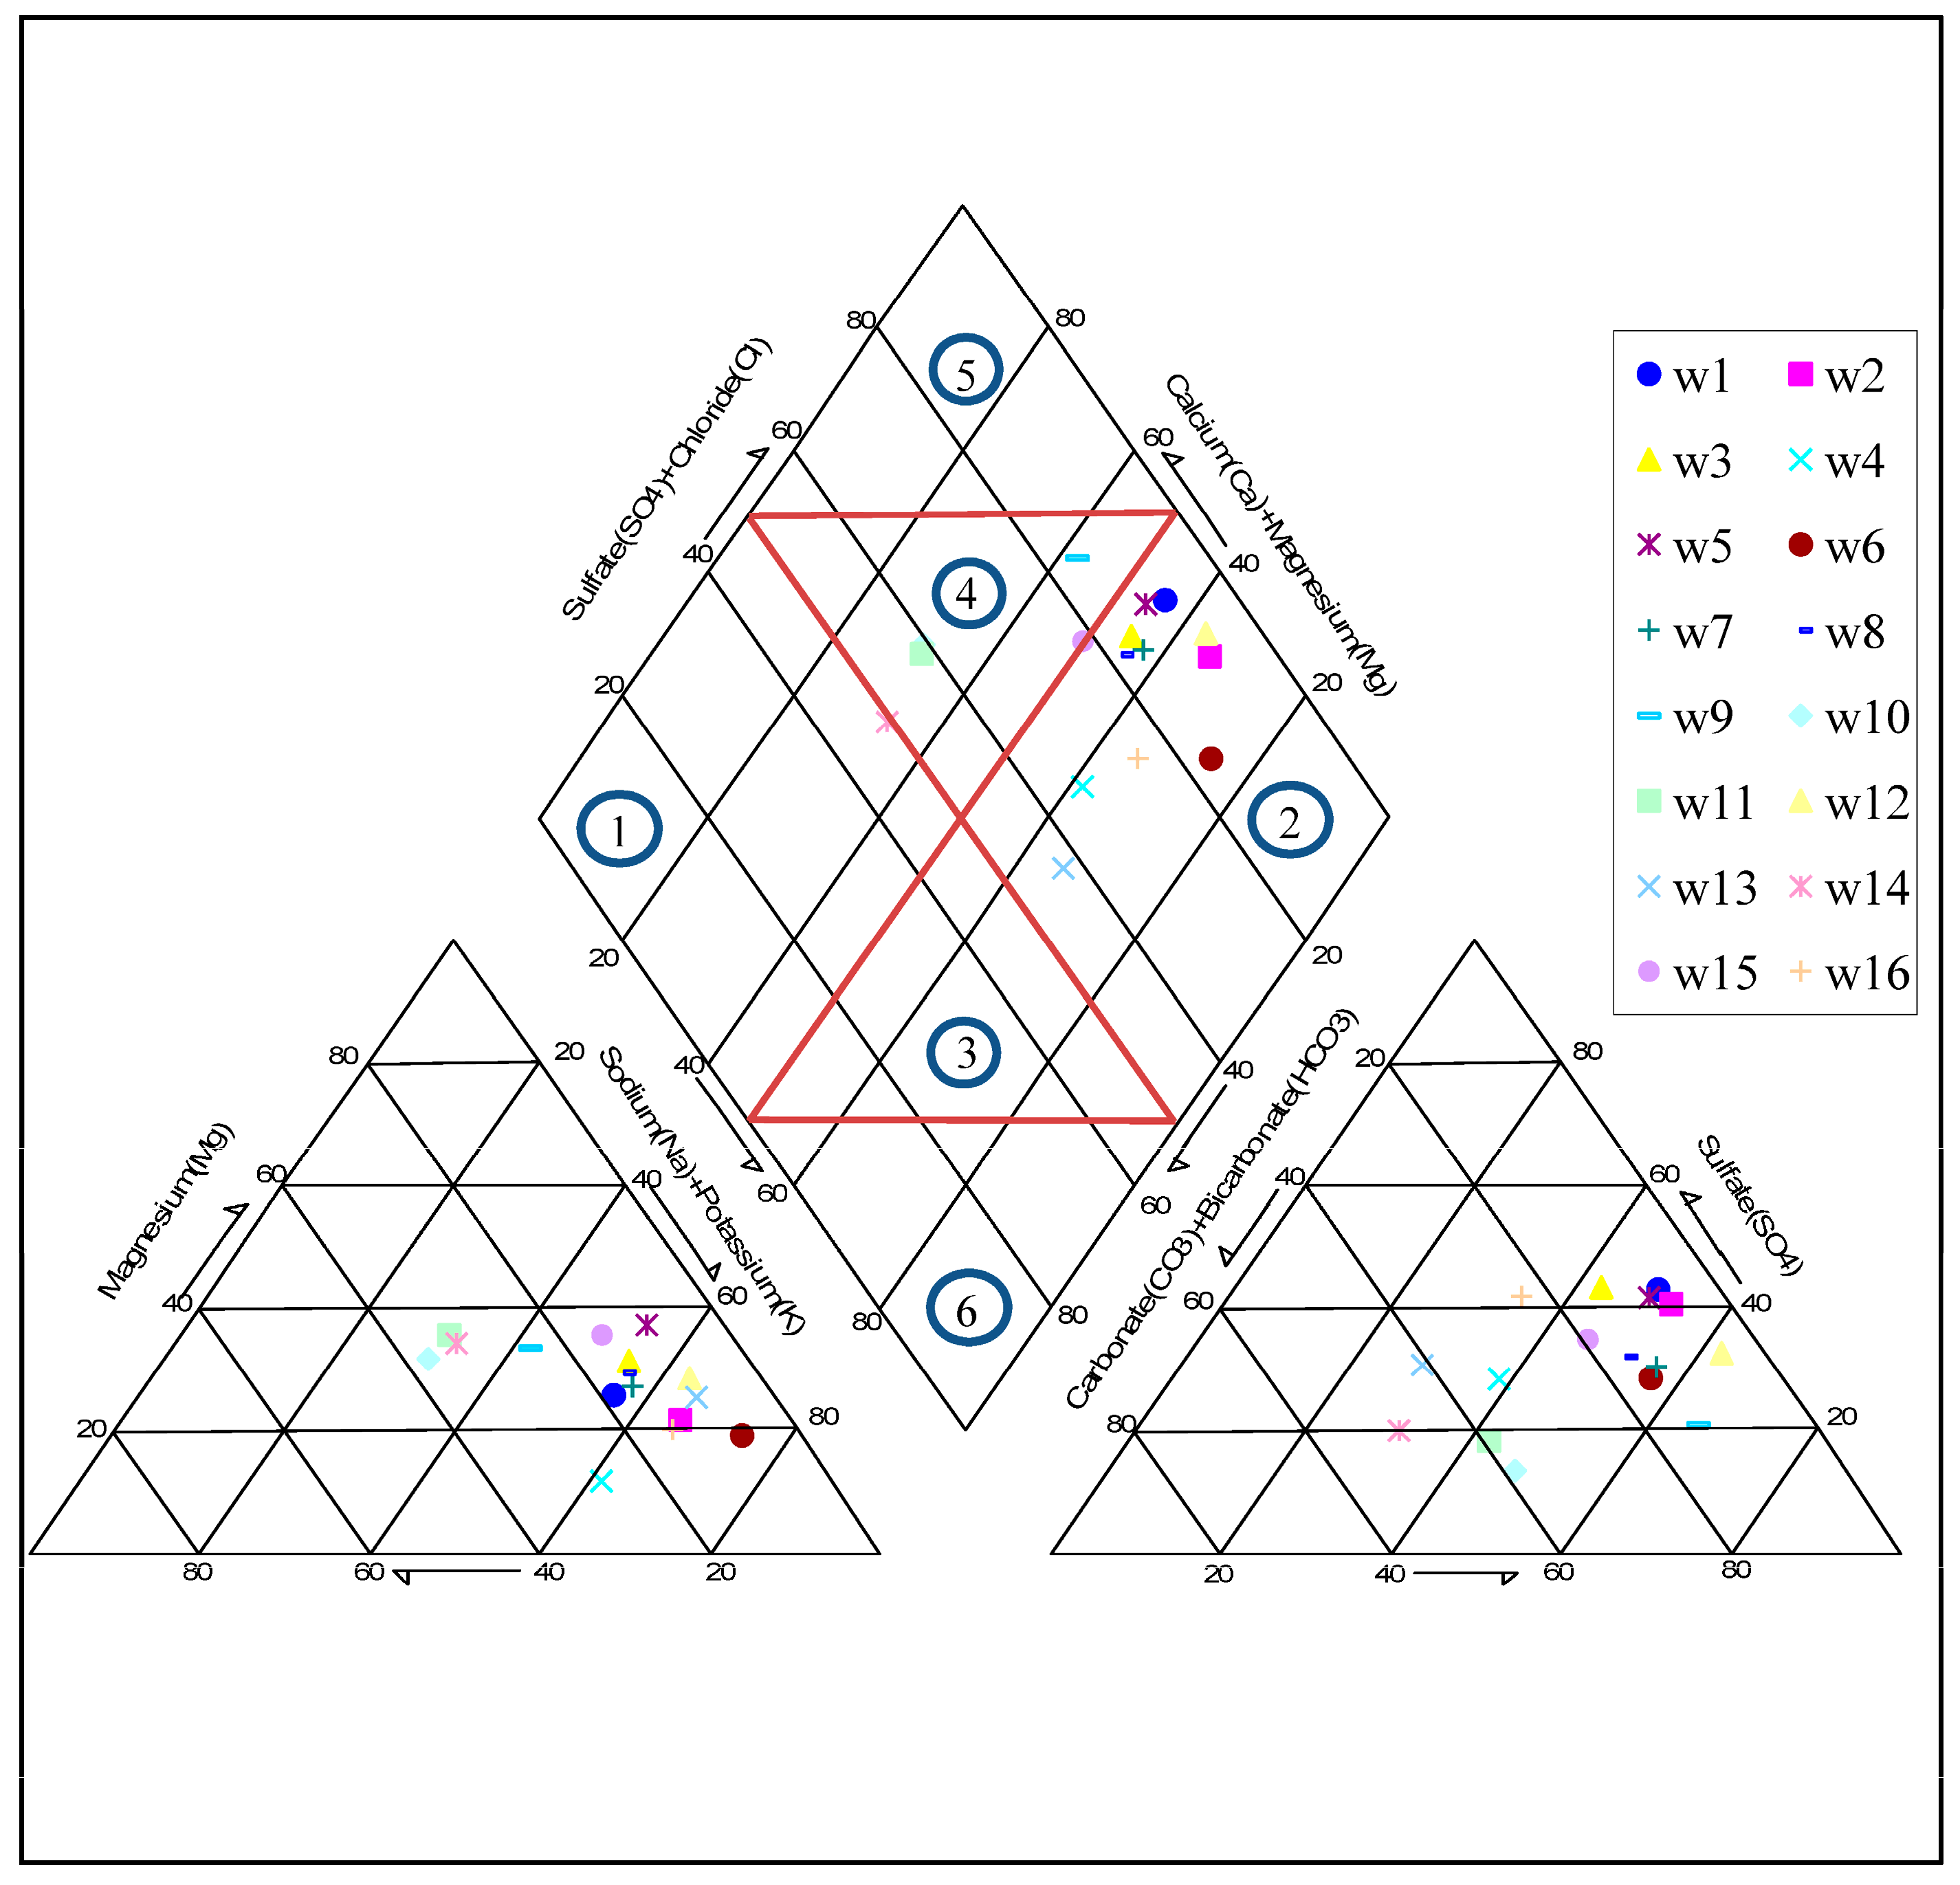
3.3. Hydrochemical Facies

Consisting of two triangular and one diamond-shaped field, the Piper diagram [48] is widely used to represent the hydrochemical facies of groundwater. Accordingly, a Piper diagram was plotted to identify the water type and hydrochemical regime of groundwater in the Ghaen Plain (Figure 7). For most samples, Na+ and Cl were the predominant cation and anion, respectively. The diamond-shaped part of the diagram is divided into six classes: (1) CaHCO3 type; (2) NaCl type; (3) mixed CaNaHCO3; (4) mixed CaMgCl; (5) CaCl type; and, (6) NaHCO3 type. The most dominant class in the groundwater of the Ghaen Plain was the NaCl type, while the next most important was the mixed CaMgCl type. These findings may reflect saltwater intrusion.

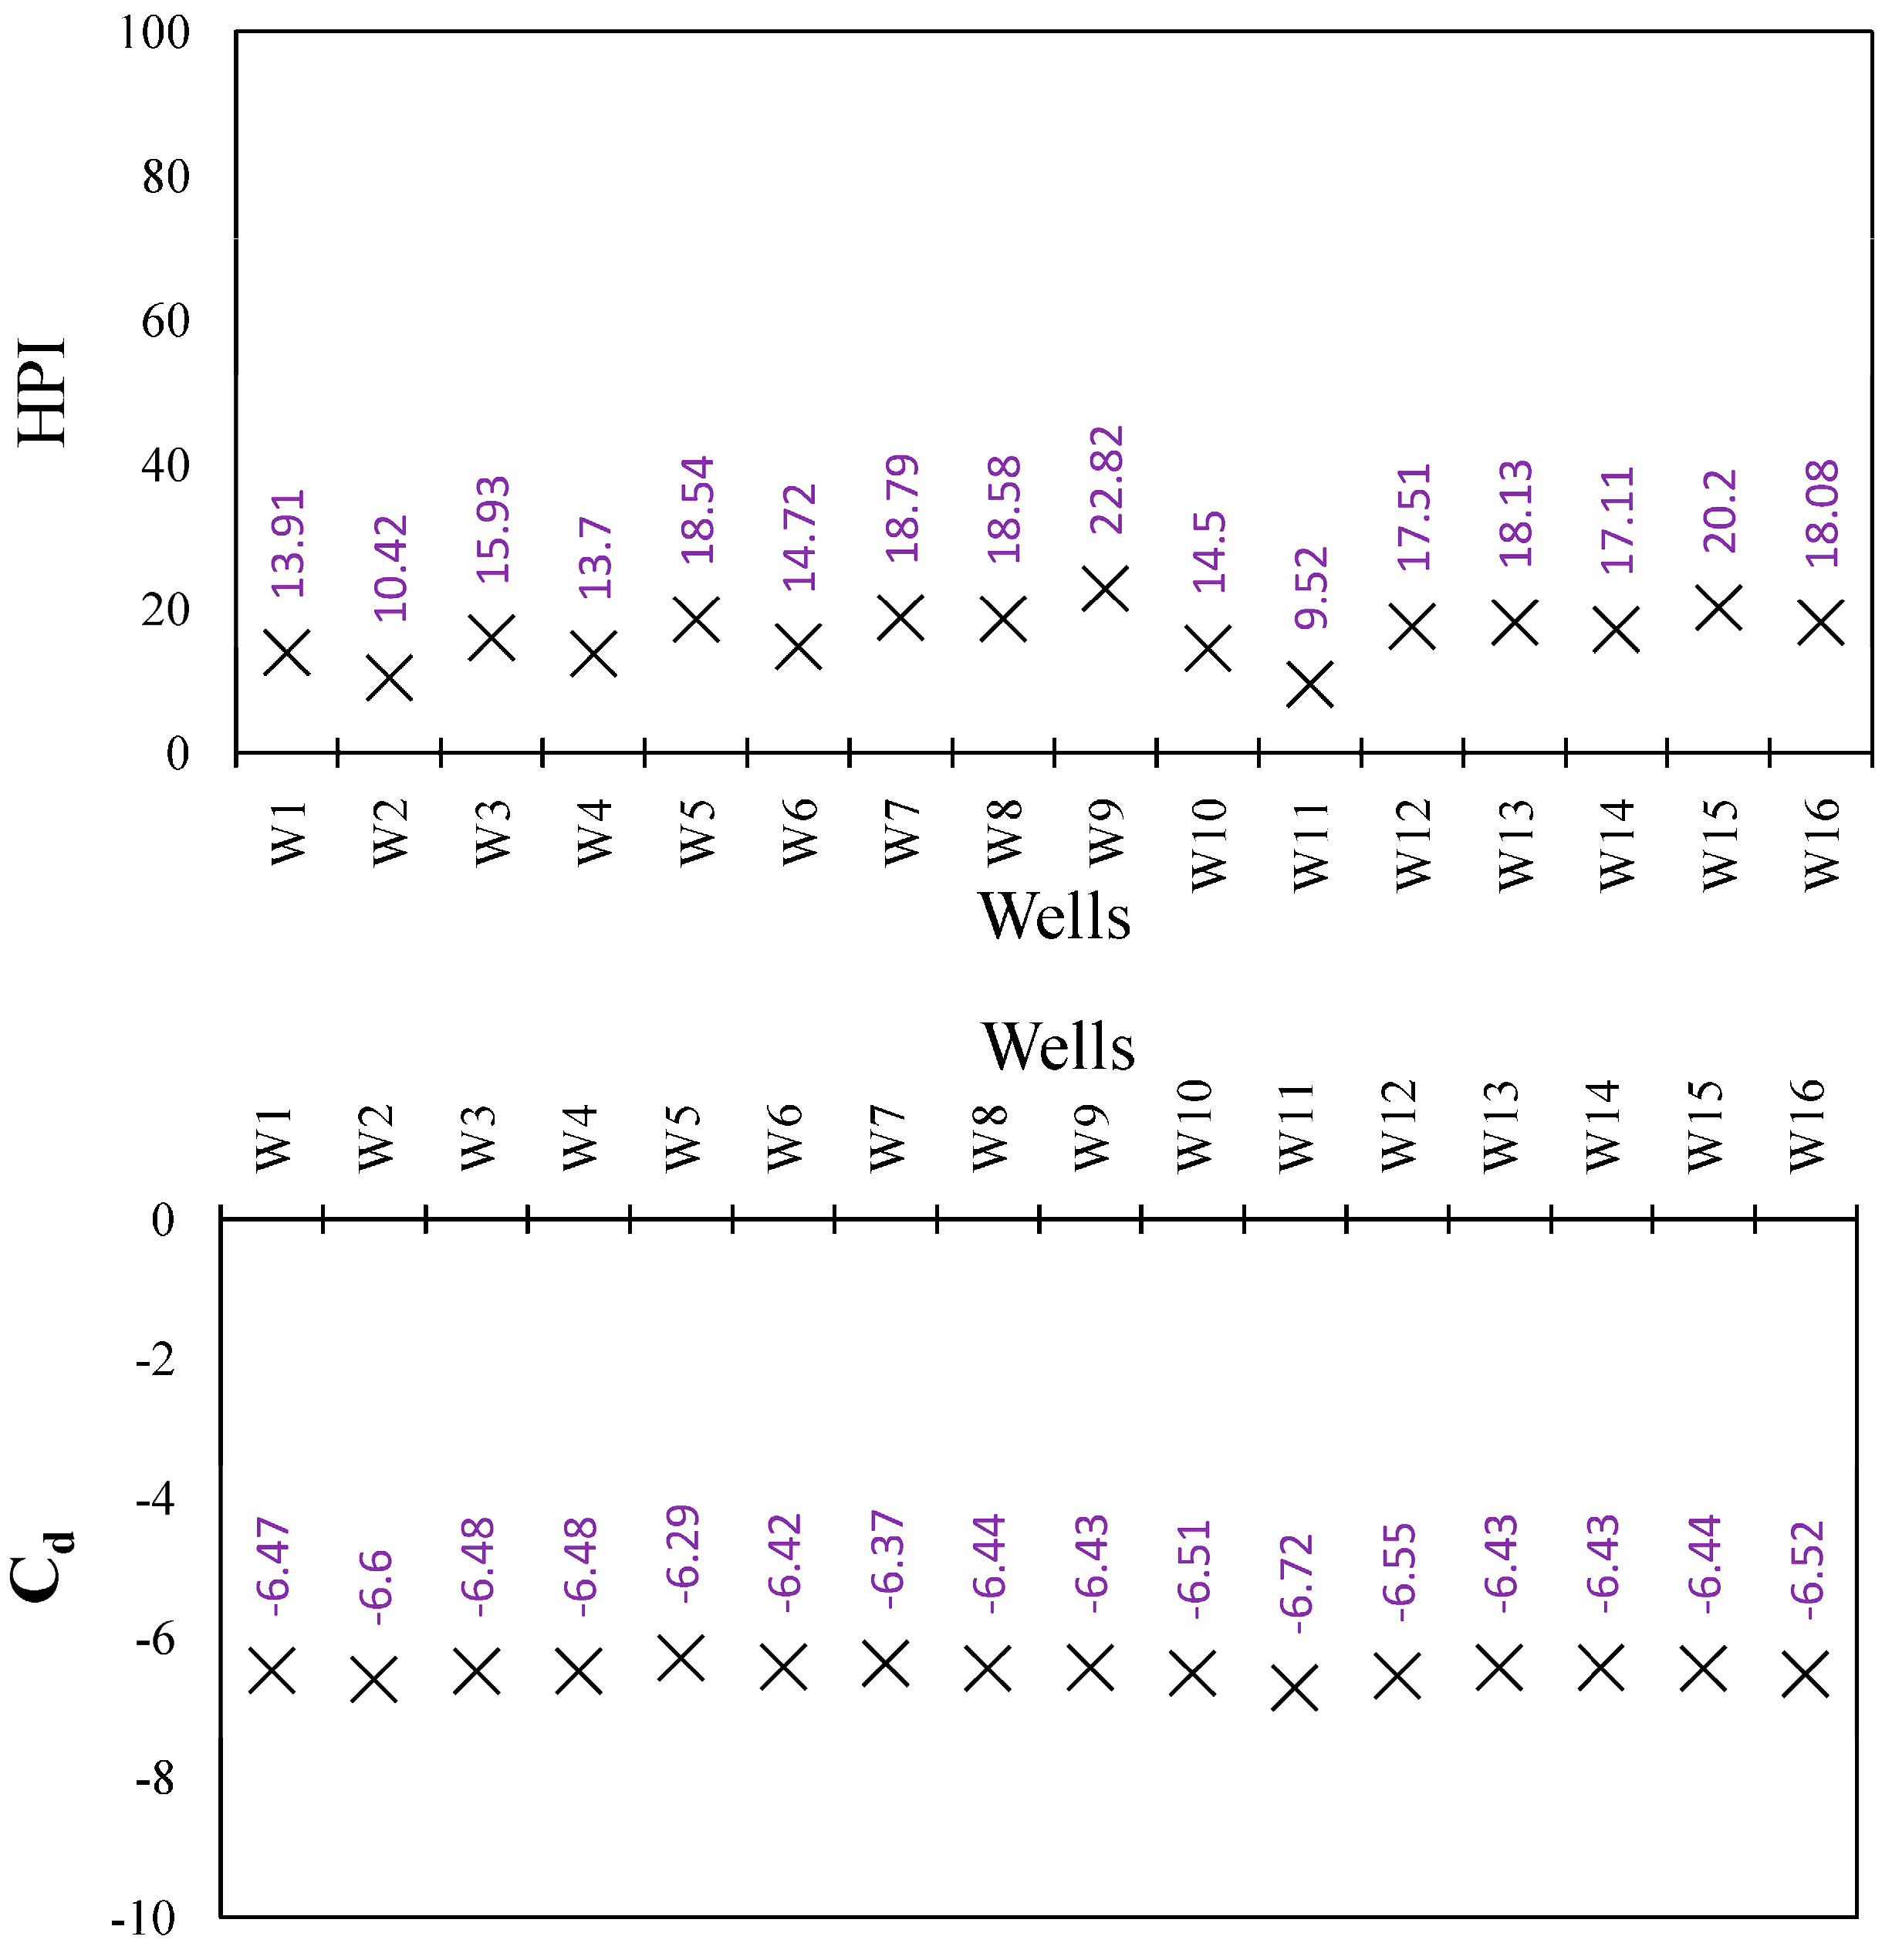
3.4. HPI and Cd Results

Compared in Table S1, measured levels and ISIRI/WHO permissible limits of Fe, Zn, Mn, B, Cr, Cu, Pb, and Cd, show all heavy metals to be below permissible limits, indicating that there is no concern regarding heavy metal contamination of the groundwater. All HPI values were below the critical value (100) and all Cd values were below 1 (Figure 8), indicating a low level of heavy metal contamination. Therefore, there is no concern regarding heavy metal pollution for drinking water or agricultural purposes.

3.5. The MPSP

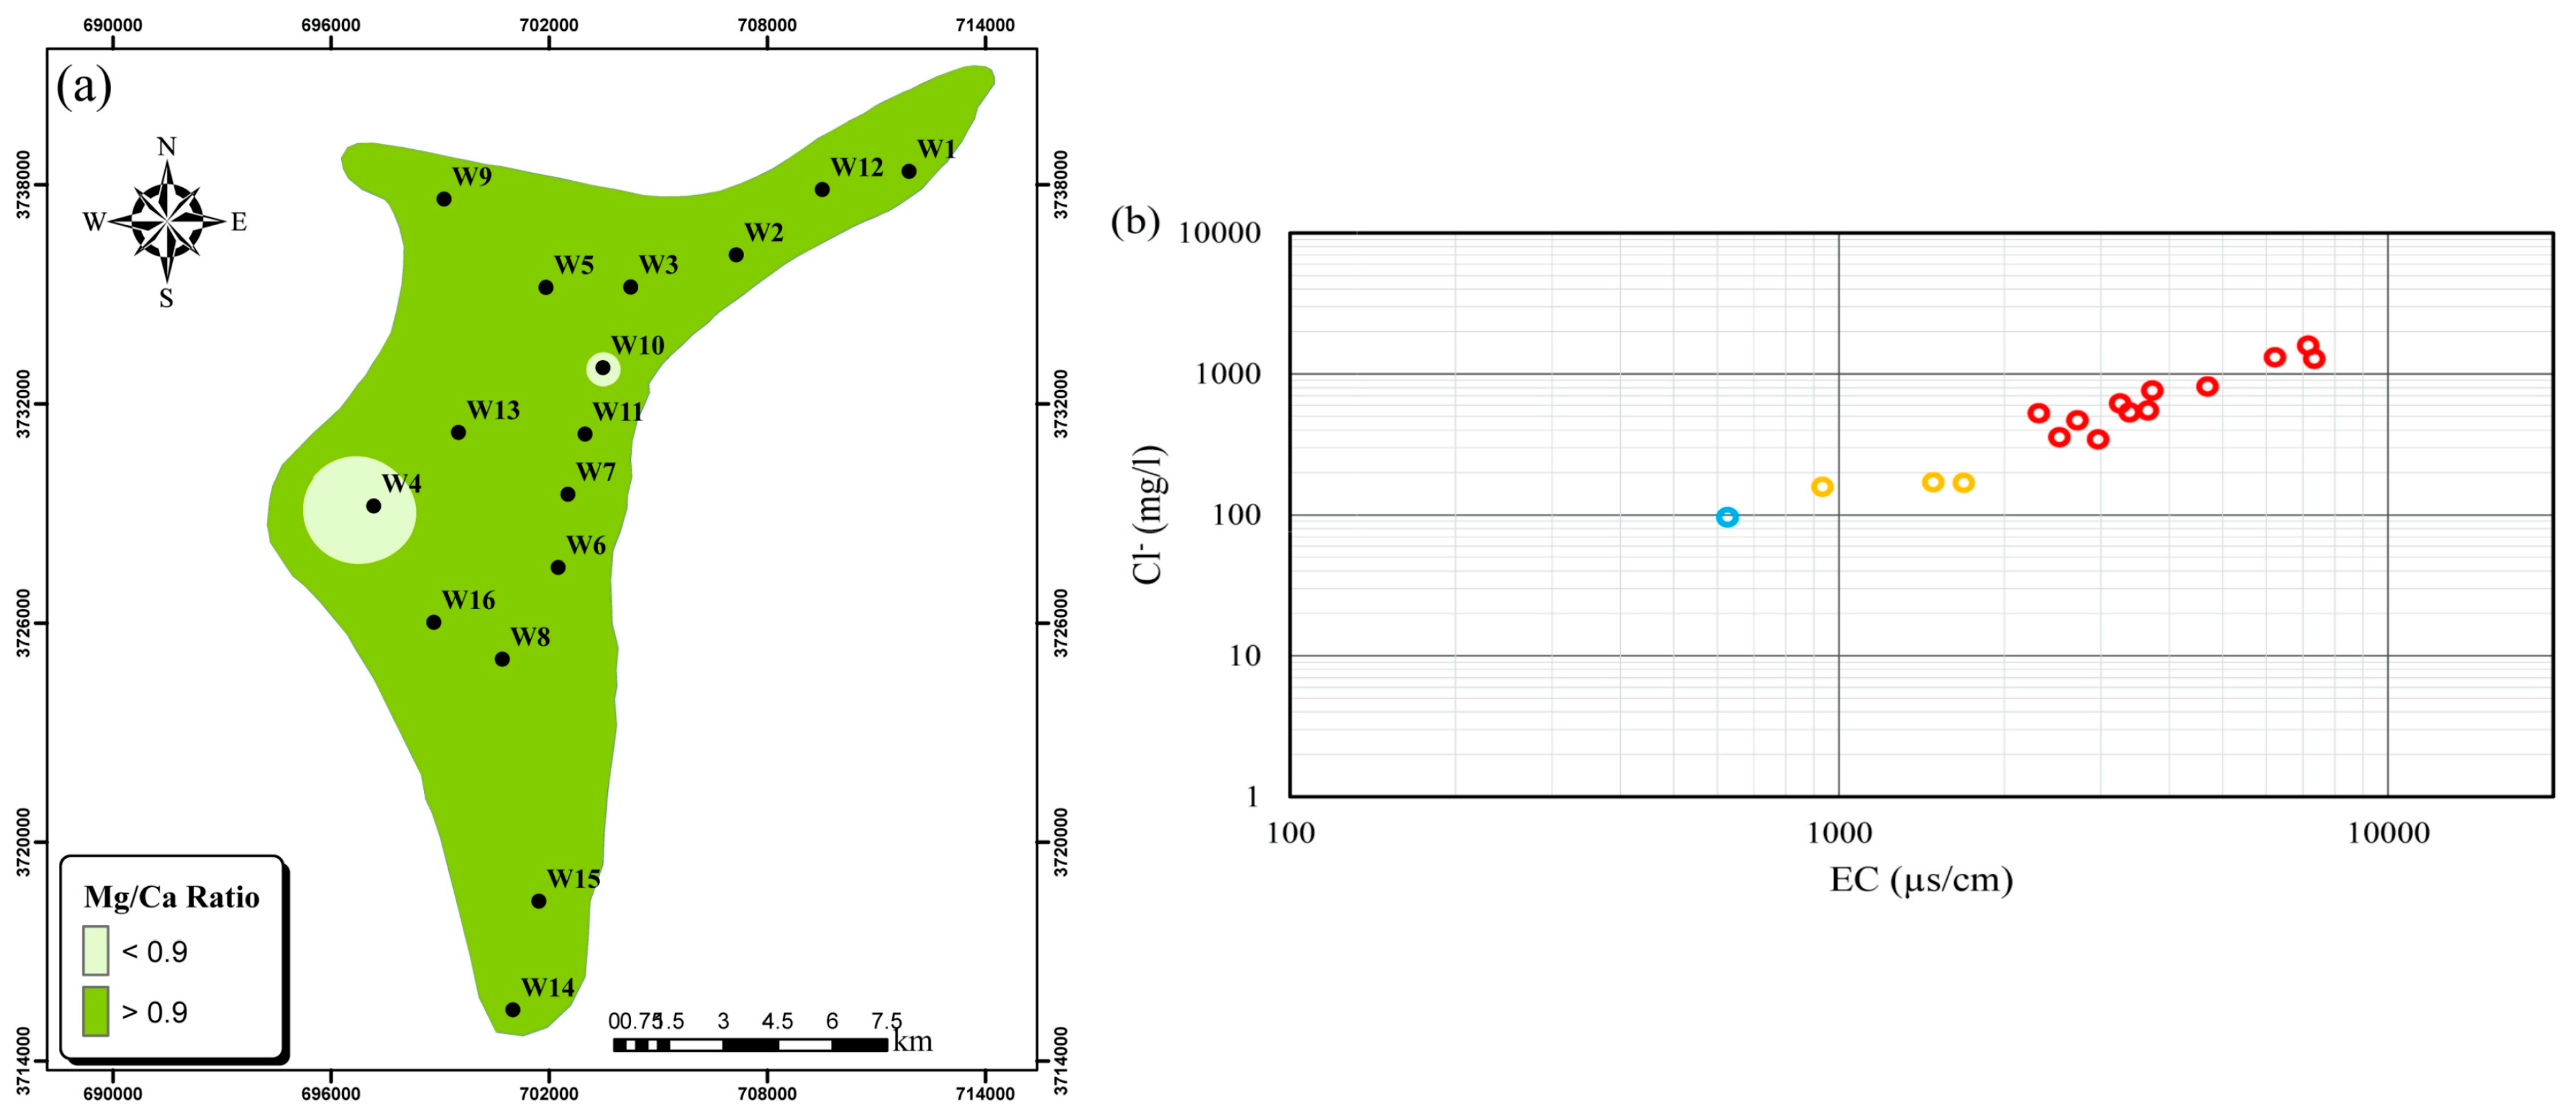
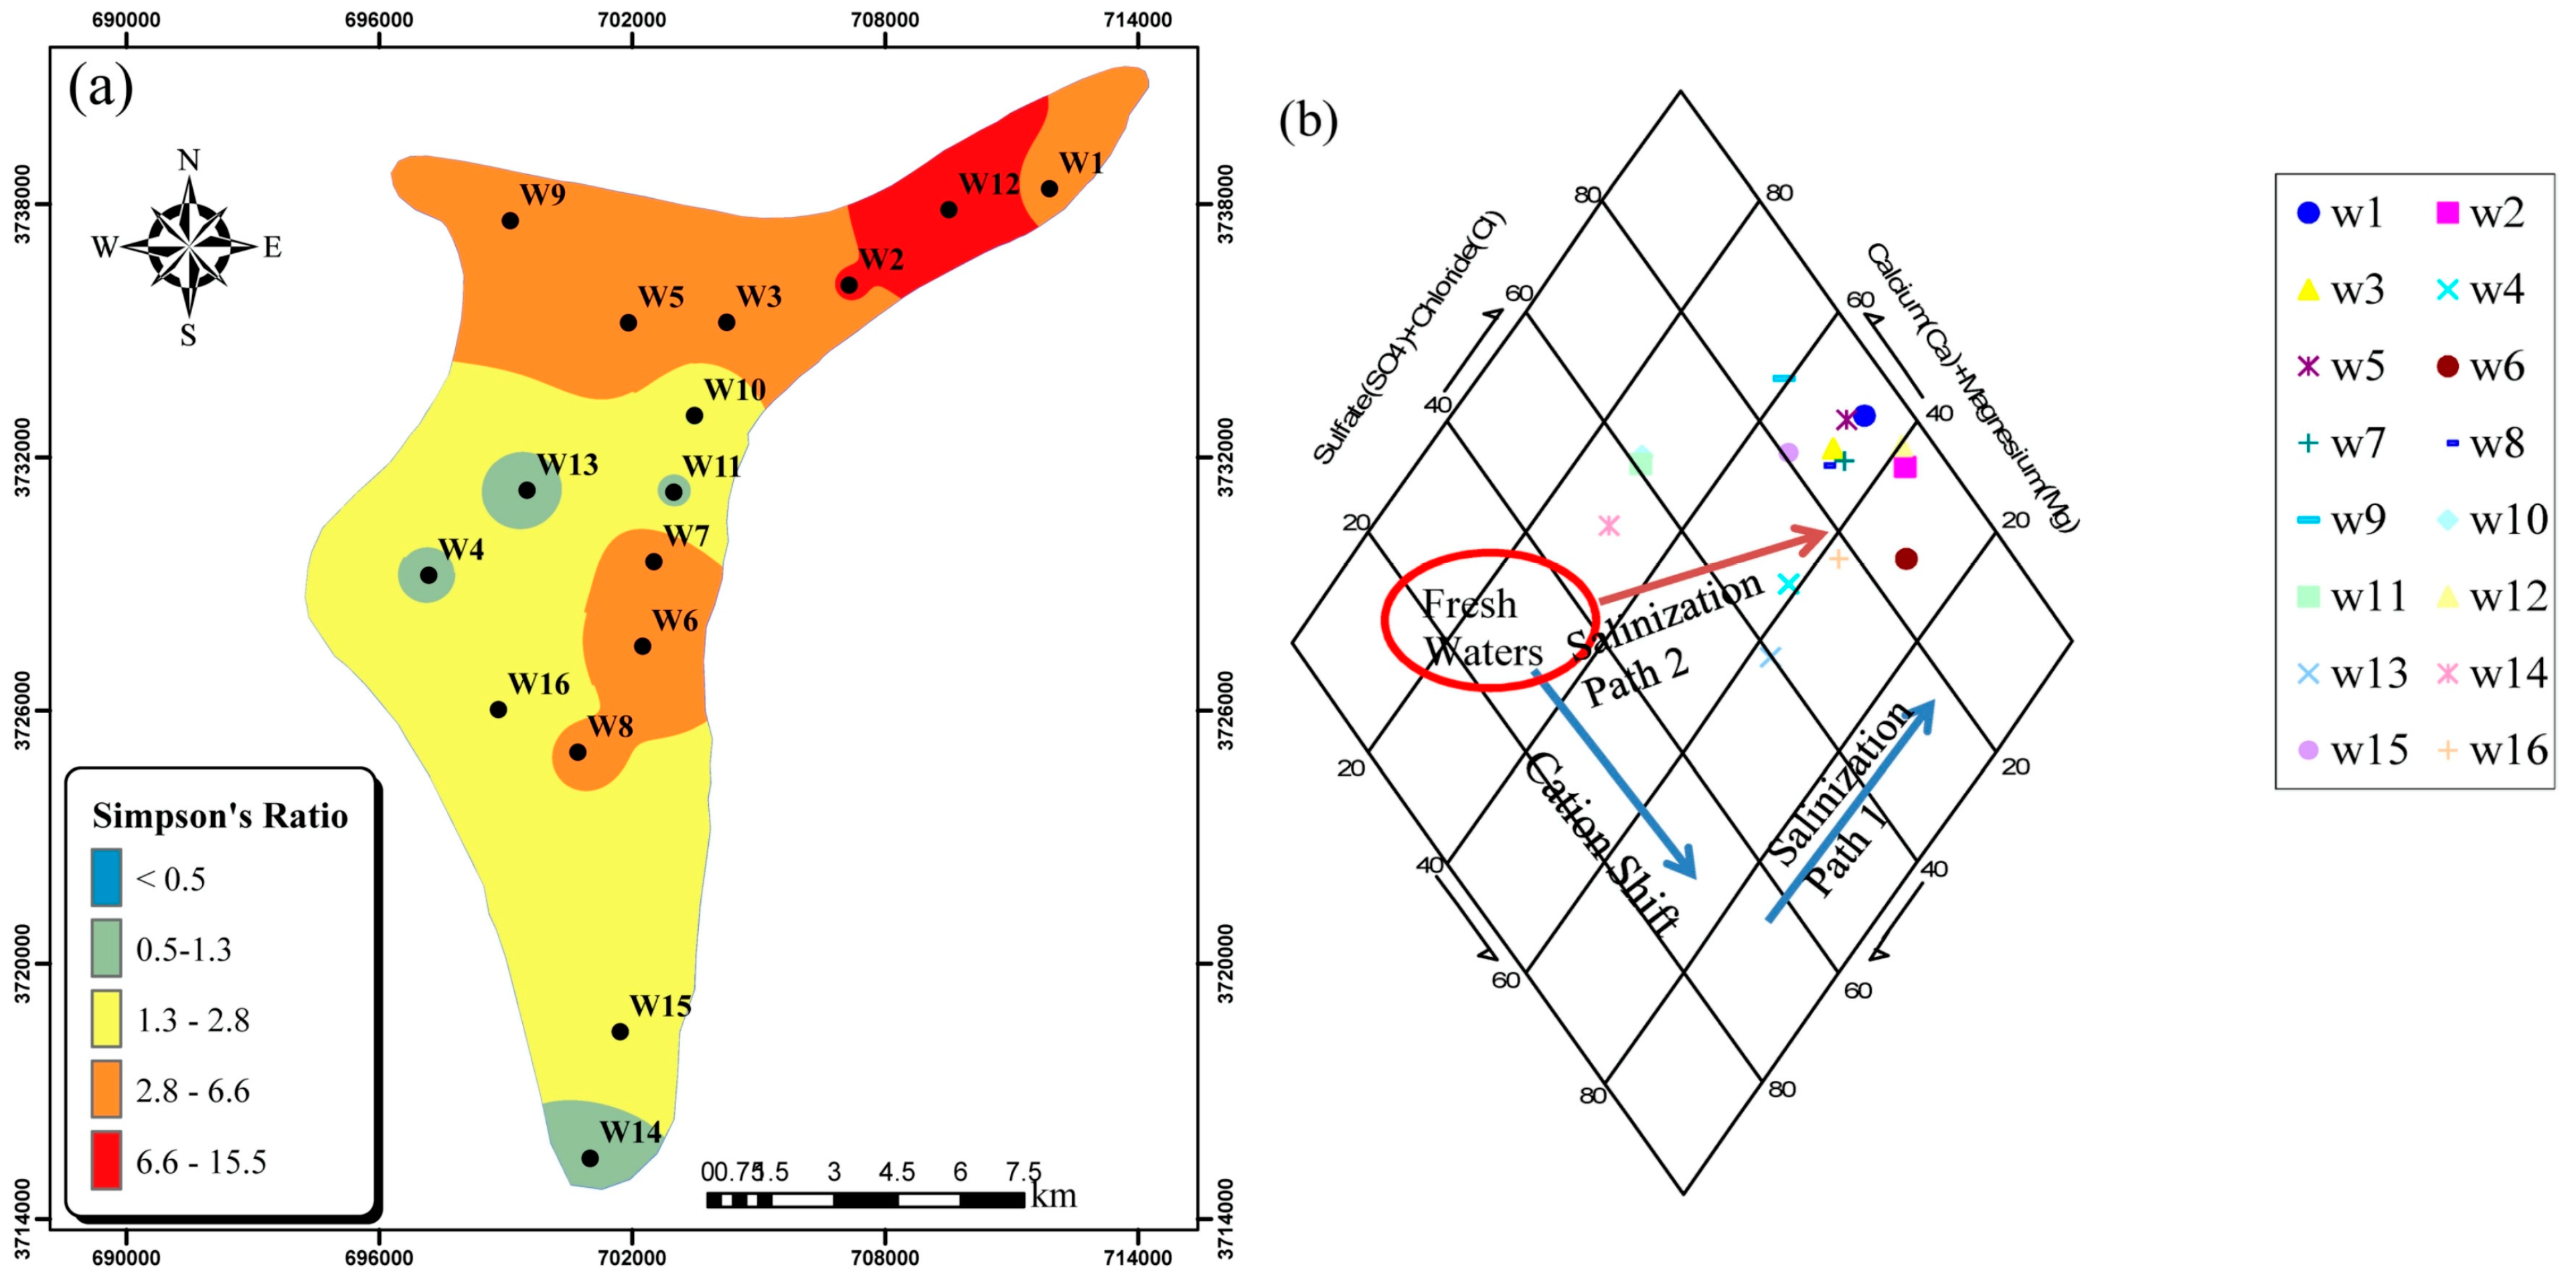
3.5.1. Identifying the MPSP by Ionic Ratios

• Mg+2/Ca+2 Ratio
The cations Ca+2 and Mg+2, belonging to the most abundant of the alkaline-earth metals, are major constituents of most freshwater systems. Although Ca+2 concentrations in all groundwater samples were below the permissible 300 mg L−1, all wells had high Mg2+ concentrations (Table S1). As it has been suggested that a Mg+2/Ca+2 ratio exceeding 0.9 indicates saltwater intrusion [49,50], and that this ratio value was exceeded in 14 of 16 wells, saltwater intrusion may pose an important threat to groundwater in the Ghaen Plain. The spatial distribution of the Mg+2/Ca+2 ratio in the Ghaen aquifer (Figure 9a) reveals that most parts of the study area, especially the northeast, may be exposed to saltwater intrusion.
• Cl/EC Ratio
The Cl/EC ratio has been suggested as a good indicator of saltwater intrusion by the Washington State Department of Ecology [51]. A graphical approach plotting Cl vs. EC (Figure 9b) shows three zones: normal, mixed, and saltwater intrusion. The Cl and EC in most groundwater samples exceeded 200 mg L−1 and 1000 µs cm−1, respectively (red circles) and are most likely influenced by saltwater intrusion [51]. Samples W10, W13, and W14 are characterized by Cl levels between 100 and 200 mg L−1 and EC between 600 and 2000 µs cm−1 (yellow circles), which represent a mixing of freshwater and saltwater [51]. Sample W11, characterized by Cl and EC lower than 100 mg L−1 and 600 µs cm−1, respectively, represents normal freshwater (blue circle) [51]. Therefore, it can be concluded that saltwater intrusion may pose a major threat to groundwater in the Ghaen Plain.
• Simpson’s Ratio (Cl/HCO3 + CO3−2)
Simpson’s ratio can also be used to determine the extent of saltwater intrusion in groundwater [16,41]. On the basis of this ratio, groundwater is classified into five classes: good quality (<0.5), slightly contaminated (0.5 to 1.3), moderately contaminated (1.3 to 2.8), contaminated to a major extent (2.8 to 6.6), and highly contaminated (6.6 to 15.5) [41,52]. The distribution of the Simpson’s ratio over the study area shows the northeastern portions of the study area to be contaminated to a major extent or highly contaminated (Figure 10a). This again indicates the influence of saltwater intrusion into the Ghaen aquifer.
• Piper Diagram
The diamond shape of the Piper diagram can serve to determine the possibility of saltwater intrusion in groundwater. Allen and Suchy [14] suggested that two paths shown in the diamond shape of the Piper diagram (Figure 10b) indicate salinization of groundwater by saltwater intrusion. Figure 10b clearly shows that most groundwater samples in the study are exposed to saltwater intrusion.

3.5.2. Identifying the MPSP by PCFA

PCFA was applied to determine MPSP for the Ghaen aquifer. The correlation matrix Г was calculated with eigenvalues, along with eigenvectors corresponding to the calculated RPFs obtained by considering the VARIMAX rotation. Table 3 shows the corresponding eigenvalues and percentage of variance explained by each RPF obtained by the application of PCFA. Given the few first eigenvalues greater importance, PCFA results were considered for only the first 6 of 28 RPFs exceeding one. About 86% of the variance in data were explained by the first six RPFs (Table 4). Factor loadings that exceeded 0.90 were considered significant for the selected RPFs. Only the first three RPFs had factor loadings greater than 0.9 (Table 4).
The EC, TDS, TH, Mg2+, Na+, SO42−, and Cl were the PCPs with greatest influence on the first factor (Table 4). The EC is related to the ionic content of the samples, which in turn, is a function of TDS concentration. The TDS, EC, and major ions in Ghaen Plain groundwater most likely originated from saltwater intrusion and the study area’s geologic structure [53]. Moreover, Cl can originate from either natural or anthropogenic sources [54]. First factor results indicate that both Cl and other major ions should have the same origin (natural source). Chloride is among the main PCPs related to salinization; its levels exceeding 100 mg L−1 indicate saltwater intrusion [55]. This ion in conjunction with Na+ composes sodium chloride. The issue of high saltwater content has been reported by regional drinking water authorities in recent years. The presence of Mg2+ in conjunction with SO42− makes up magnesium sulphate, which has medical implications when found in drinking water. By considering these findings and the ionic ratios, all PCPs can be concluded to indicate saltwater intrusion into the Ghaen aquifer, aided by the region’s geologic structure.
The second factor was mostly strongly influenced by PO43−, NO3, and TP levels (Table 4). As these parameters are characteristic of eutrophication in surface waters, they most probably relate to contamination from agricultural activities and pit latrines used for disposal of wastewater in the study area. Generally, overuse of manure and fertilizers on agricultural lands, absence of wastewater collection systems, and the use of pit latrines introduces a high volume of nutrient loading into the aquifer.
The third factor is highly influenced by Alk and HCO3 (Table 4), which originate from the CO2 gas fraction of the atmosphere, or the atmospheric gases present in the soil in the unsaturated zone [49]. In the study area, Alk and HCO3 likely originate from silicate weathering from the surface soils due to the high alkalinity in the plain and groundwater salinization from saltwater intrusion. Therefore, similar to the ionic ratio results, the PCFA analysis suggests that saltwater intrusion, and the plain’s geologic structure, can be considered as the MPSP for the aquifer.

4. Conclusions

In the present study, the GQ of the Ghaen Plain was investigated by analyzing the PCPs and heavy metal concentrations in 16 wells. High levels of TDS, Cl, Na+, and Mg2+ in the groundwater revealed some problematic issues for its use as drinking or irrigation water. Saltwater intrusion and the geology underlying the study area are the main sources of these problems. All heavy metal levels in the groundwater were within the ISIRI and WHO permissible levels for drinking water and these results are supported by the measured HPI and Cd values. High levels of EC, which resulted in classification of most well water samples as very high saline and medium to very high in sodium indicate that the groundwater is suitable only for irrigation of salt tolerant crops under good drainage conditions. Due to the positive saturation index, which indicates precipitation of calcium carbonate in water supply facilities, the water from all wells was deemed unsuitable for industrial purposes. The Mg+2/Ca+2 ratio, Simpson ratio, Cl vs. EC diagram, Piper diagram, and PCFA showed that saltwater intrusion can be considered an MPSP in the Ghaen aquifer. The PCFA results showed that there were three MPSPs in the study area: saltwater intrusion, geology underlying the Ghaen aquifer, and anthropogenic sources, such as agriculture and wastewater disposal through septic wells.
Since more than 90% of Iran’s water consumption supports agricultural activities, and the Ghaen aquifer’s main MSPS is saltwater intrusion, the use of high performance irrigation methods may be the best alternative to reducing groundwater withdrawals for agricultural purposes and improving groundwater quality in the Ghaen Plain. Based on the geological properties and the area of the plain, a higher number of sampling points might better delineate these MPSPs. It should be noted that the authors are familiar with the study area’s characteristics, such as geological structure, land use, pollution sources, and constraints for accessing some of the wells. In this regard, the sampling points were selected in a representative manner as regards changes in the water quality status in the aquifer.

Supplementary Materials

The following are available online at https://www.mdpi.com/1660-4601/15/1/172/s1, Table S1: Physiochemical parameters at sampling sites {in mg L−1, except for pH (standard unit), EC (µs cm−1), and heavy metals (µg L−1)}.

Acknowledgments

This research was funded by the Center for Middle Eastern Studies, Lund University. The authors also gratefully acknowledge the South Khorasan Regional Water Authority, Iran, for cooperation in data preparation.

Author Contributions

Roohollah Noori planned the research with Mohammad Reza Vesali Naseh. They performed the analysis, and wrote the paper with the Ronny Berndtsson, Jan Adamowski, and Elaheh Sadatipour. Ronny Berndtsson and Jan Adamowski also provided advice, and helped to revise the paper.

Conflicts of Interest

The authors declare no conflict of interest.

References

  1. Haloi, N.; Sarma, H.P. Heavy metal contaminations in the groundwater of Brahmaputra flood plain: An assessment of water quality in Barpeta District, Assam (India). Environ. Monit. Assess. 2012, 184, 6229–6237. [Google Scholar] [CrossRef] [PubMed]
  2. Pourang, N.; Noori, A.S. Heavy metals contamination in soil, surface water and groundwater of an agricultural area adjacent to Tehran oil refinery, Iran. Int. J. Environ. Res. 2014, 8, 871–886. [Google Scholar] [CrossRef]
  3. Sobhan Ardakani, S. Assessment of levels and health risk of heavy metals (Pb, Cd, Cr, and Cu) in commercial hen’s eggs from the city of Hamedan. Pollution 2017, 3, 669–677. [Google Scholar] [CrossRef]
  4. Aliyu, T.; Balogun, O.; Namani, C.; Olatinwo, L.; Aliyu, A. Assessment of the presence of metals and quality of water used for irrigation in Kwara State, Nigeria. Pollution 2017, 3, 461–470. [Google Scholar] [CrossRef]
  5. Vidal, M.; Lopez, A.; Santoalla, M.C.; Valles, V. Factor analysis for the study of water resources contamination due to the use of livestock slurries as fertilizer. Agric. Water Manag. 2000, 45, 1–15. [Google Scholar] [CrossRef]
  6. Singh, K.P.; Malik, A.; Sinha, S. Water quality assessment and apportionment of pollution sources of Gomti river (India) using multivariate statistical techniques—A case study. Anal. Chim. Acta 2005, 538, 355–374. [Google Scholar] [CrossRef]
  7. Singh, K.P.; Malik, A.; Sinha, S.; Singh, V.K.; Murthy, R.C. Estimation of source of heavy metal contamination in sediments of Gomti River (India) using principal component analysis. Water Air Soil Pollut. 2005, 166, 321–341. [Google Scholar] [CrossRef]
  8. Shrestha, S.; Kazama, F.; Nakamura, T. Use of principal component analysis, factor analysis and discriminant analysis to evaluate spatial and temporal variations in water quality of the Mekong River. J. Hydroinform. 2008, 10, 43–56. [Google Scholar] [CrossRef]
  9. Bhuyan, M.; Bakar, M. Assessment of water quality in Halda River (the Major carp breeding ground) of Bangladesh. Pollution 2017, 3, 429–441. [Google Scholar] [CrossRef]
  10. Tariq, S.R.; Shaheen, N.; Khalique, A.; Shah, M.H. Distribution, correlation, and source apportionment of selected metals in tannery effluents, related soils, and groundwater—A case study from Multan, Pakistan. Environ. Monit. Assess. 2010, 166, 303–312. [Google Scholar] [CrossRef] [PubMed]
  11. Yang, L.; Mei, K.; Liu, X.; Wu, L.; Zhang, M.; Xu, J.; Wang, F. Spatial distribution and source apportionment of water pollution in different administrative zones of Wen-Rui-Tang (WRT) river watershed, China. Environ. Sci. Pollut. Res. 2013, 20, 5341–5352. [Google Scholar] [CrossRef] [PubMed]
  12. Bhutiani, R.; Kulkarni, D.B.; Khanna, D.R.; Gautam, A. Water quality, pollution source apportionment and health risk assessment of heavy metals in groundwater of an industrial area in North India. Exp. Health 2016, 8, 3–18. [Google Scholar] [CrossRef]
  13. Guo, X.; Zuo, R.; Shan, D.; Cao, Y.; Wang, J.; Teng, Y.; Fu, Q.; Zheng, B. Source apportionment of pollution in groundwater source area using factor analysis and positive matrix factorization methods. Hum. Ecol. Risk Assess. 2017, 23. [Google Scholar] [CrossRef]
  14. Allen, D.M.; Suchy, M.S. Geochemical evolution of groundwater on Saturna Island, British Columbia. Can. J. Earth Sci. 2001, 38, 1059–1080. [Google Scholar] [CrossRef]
  15. Ghabayen, S.M.; McKee, M.; Kemblowski, M. Ionic and isotopic ratios for identification of salinity sources and missing data in the Gaza aquifer. J. Hydrol. 2006, 318, 360–373. [Google Scholar] [CrossRef]
  16. El-Moujabber, M.; Samra, B.B.; Darwish, T.; Atallah, T. Comparison of different indicators for groundwater contamination by seawater intrusion on the Lebanese coast. Water Resour. Manag. 2006, 20, 161–180. [Google Scholar] [CrossRef]
  17. Lee, J.Y.; Song, S.H. Groundwater chemistry and ionic ratios in a western coastal aquifer of Buan, Korea: Implication for seawater intrusion. Geosci. J. 2007, 11, 259–270. [Google Scholar] [CrossRef]
  18. Krishnaraj, S.; Murugesan, V.; Vijayaraghavan, K.; Sabarathinam, C.; Paluchamy, A.; Ramachandran, M. Use of hydrochemistry and stable isotopes as tools for groundwater evolution and contamination investigations. Geosciences 2011, 1, 16–25. [Google Scholar] [CrossRef]
  19. Mongelli, G.; Monni, S.; Oggiano, G.; Paternoster, M.; Sinisi, R. Tracing groundwater salinization processes in coastal aquifers: A hydrogeochemical and isotopic approach in the Na-Cl brackish waters of northwestern Sardinia, Italy. Hydrol. Earth Syst. Sci. 2013, 17, 2917–2928. [Google Scholar] [CrossRef]
  20. Raju, N.J.; Reddy, K.; Muniratnam, P.; Gossel, W.; Wycisk, P. Managed aquifer recharge (MAR) by the construction of subsurface dams in the semi-arid regions: A case study of the Kalangi river basin, Andhra Pradesh. J. Geol. Soc. India 2013, 82, 657–665. [Google Scholar] [CrossRef]
  21. Abdalla, F. Ionic ratios as tracers to assess seawater intrusion and to identify salinity sources in Jazan coastal aquifer, Saudi Arabia. Arab. J. Geosci. 2016, 9, 40. [Google Scholar] [CrossRef]
  22. Batayneh, A.; Zaman, H.; Zumlot, T.; Ghrefat, H.; Mogren, S.; Nazzal, Y.; Elawadi, E.; Qaisy, S.; Bahkaly, I.; Al-Taani, A. Hydrochemical facies and ionic ratios of the coastal groundwater aquifer of Saudi Gulf of Aqaba: Implication for seawater intrusion. J. Coast. Res. 2013, 30, 75–87. [Google Scholar] [CrossRef]
  23. Li, W.; Wang, M.Y.; Liu, L.Y.; Yan, Y. Assessment of long-term evolution of groundwater hydrochemical characteristics using multiple approaches: A case study in Cangzhou, northern China. Water 2015, 7, 1109–1128. [Google Scholar] [CrossRef]
  24. Souid, F.; Agoubi, B.; Hamdi, M.; Telahigue, F.; Kharroubi, A. Groundwater chemical and fecal contamination assessment of the Jerba unconfined aquifer, southeast of Tunisia. Arab. J. Geosci. 2017, 10, 231. [Google Scholar] [CrossRef]
  25. APHA; AWWA; WEF. Standard Methods for the Examination of Water and Wastewater; American Public Health Association: Washington, DC, USA, 2005. [Google Scholar]
  26. Mohan, S.V.; Nithila, P.; Reddy, S.J. Estimation of heavy metals in drinking water and development of heavy metal pollution index. J. Environ. Sci. Health Part A 1996, 31, 283–289. [Google Scholar] [CrossRef]
  27. Backman, B.; Bodiš, D.; Lahermo, P.; Rapant, S.; Tarvainen, T. Application of a groundwater contamination index in Finland and Slovakia. Environ. Geol. 1998, 36, 55–64. [Google Scholar] [CrossRef]
  28. Prasad, B.; Bose, J. Evaluation of the heavy metal pollution index for surface and spring water near a limestone mining area of the lower Himalayas. Environ. Geol. 2001, 41, 183–188. [Google Scholar] [CrossRef]
  29. Tariq, S.R.; Shah, M.H.; Shaheen, N.; Khalique, A.; Manzoor, S.; Jaffar, M. Multivariate analysis of selected metals in tannery effluents and related soil. J. Hazard. Mater. 2005, 122, 17–22. [Google Scholar] [CrossRef] [PubMed]
  30. Rafique, N.; Tariq, S.R. Distribution and source apportionment studies of heavy metals in soil of cotton/wheat fields. Environ. Monit. Assess. 2016, 188, 309. [Google Scholar] [CrossRef] [PubMed]
  31. Noori, R.; Karbassi, A.; Khakpour, A.; Shahbazbegian, M.; Badam, H.M.K.; Vesali-Naseh, M. Chemometric analysis of surface water quality data: Case study of the Gorganrud river basin, Iran. Environ. Model. Assess. 2012, 17, 411–420. [Google Scholar] [CrossRef]
  32. Noori, R.; Sabahi, M.S.; Karbassi, A.R.; Baghvand, A.; Zadeh, H.T. Multivariate statistical analysis of surface water quality based on correlations and variations in the data set. Desalination 2010, 260, 129–136. [Google Scholar] [CrossRef]
  33. Singh, P.K.; Kumar, V.; Purohit, R.C.; Kothari, M.; Dashora, P.K. Application of principal component analysis in grouping geomorphic parameters for hydrologic modeling. Water Resour. Manag. 2009, 23, 325–339. [Google Scholar] [CrossRef]
  34. Manly, B.F.J. Multivariate Statistical Methods, a Primer; Chapman & Hall: London, UK, 2004. [Google Scholar]
  35. Shrestha, S.; Kazama, F. Assessment of surface water quality using multivariate statistical techniques: A case study of the Fuji river basin, Japan. Environ. Model. Softw. 2007, 22, 464–475. [Google Scholar] [CrossRef]
  36. Ouyang, Y. Evaluation of river water quality monitoring stations by principal component analysis. Water Res. 2005, 39, 2621–2635. [Google Scholar] [CrossRef] [PubMed]
  37. Noori, R.; Khakpour, A.; Omidvar, B.; Farokhnia, A. Comparison of ANN and principal component analysis-multivariate linear regression models for predicting the river flow based on developed discrepancy ratio statistic. Expert Syst. Appl. 2010, 37, 856–862. [Google Scholar] [CrossRef]
  38. Kousa, A.; Havulinna, A.S.; Moltchanova, E.; Taskinen, O.; Nikkarinen, M.; Karvonen, J.; Karvonen, M. Calcium: Magnesium ratio in local groundwater and incidence of acute myocardial infarction among males in rural Finland. Environ. Health Perspect. 2006, 114, 730–734. [Google Scholar] [CrossRef] [PubMed]
  39. Rapant, S.; Fajčíková, K.; Cvečková, V.; Ďurža, A.; Stehlíková, B.; Sedláková, D.; Ženišová, Z. Chemical composition of groundwater and relative mortality for cardiovascular diseases in the Slovak Republic. Environ. Geochem. Health 2015, 37, 745–756. [Google Scholar] [CrossRef] [PubMed]
  40. Rapant, S.; Cvečková, V.; Fajčíková, K.; Dietzová, Z.; Stehlíková, B. Chemical composition of groundwater/drinking water and oncological disease mortality in Slovak Republic. Environ. Geochem. Health 2017, 39, 191–208. [Google Scholar] [CrossRef] [PubMed]
  41. Todd, D.K. Ground Water Hydrology; John Wiley and Sons. Inc.: Hoboken, NJ, USA, 1959; pp. 277–294. [Google Scholar]
  42. Yang, C.Y.; Chiu, H.F.; Cheng, M.F.; Tsai, S.S.; Hung, C.F.; Lin, M.C. Esophageal cancer mortality and total hardness levels in Taiwan’s drinking water. Environ. Res. 1999, 81, 302–308. [Google Scholar] [CrossRef] [PubMed]
  43. Rapant, S.; Cvečková, V.; Fajčíková, K.; Sedláková, D.; Stehlíková, B. Impact of calcium and magnesium in groundwater and drinking water on the health of inhabitants of the Slovak Republic. Int. J. Environ. Res. Public Health 2017, 14, 278. [Google Scholar] [CrossRef] [PubMed]
  44. Wilcox, L. Classification and Use of Irrigation Waters; Department of Agriculture: Washington, DC, USA, 1955.
  45. Eaton, F.M. Significance of carbonates in irrigation waters. Soil Sci. 1950, 69, 123–134. [Google Scholar] [CrossRef]
  46. McCarthy, T.S.; Ellery, W.N. The effect of vegetation on soil and ground water chemistry and hydrology of islands in the seasonal swamps of the Okavango Fan, Botswana. J. Hydrol. 1994, 154, 169–193. [Google Scholar] [CrossRef]
  47. Rhades, J.D.; Berstein, L. Chemical Physical and Biological Characteristics of Irrigation and Soil Water. In Water and Water Pollution; Ciaccio, L.L., Ed.; Marcel Dekker Inc.: New York, NY, USA, 1971. [Google Scholar]
  48. Piper, A.M. A graphic procedure in the geochemical interpretation of water-analyses. Eos Trans. Am. Geophys. Union 1944, 25, 914–928. [Google Scholar] [CrossRef]
  49. Hem, J.D. Study and Interpretation of the Chemical Characteristics of Natural Water; USGS Water Supply Paper 1473; USGS: Reston, VA, USA, 1970; 363p.
  50. Gill, D.; Rosenthal, E. Hydrochem—A fortran IV program for processing analytical hydrochemical data. Comput. Geosci. 1975, 1, 83–96. [Google Scholar] [CrossRef]
  51. WSDE—Washington State Department of Ecology; Water Resource Inventory Area 06 Islands. Seawater Intrusion Topic Paper. 2005. Available online: https://fortress.wa.gov/ecy/publications/documents/1203271.pdf (accessed on 14 March 2017).
  52. Korfali, S.I.; Jurdi, M. Deterioration of coastal water aquifers: Causes and impacts. Eur. Water 2010, 29, 3–10. [Google Scholar]
  53. Ghahremanzadeh, H.; Noori, R.; Baghvand, A.; Nasrabadi, T. Evaluating the main sources of groundwater pollution in the southern Tehran aquifer using principal component factor analysis. Environ. Geochem. Health 2017, 1–12. [Google Scholar] [CrossRef] [PubMed]
  54. Appelo, C.A.J.; Postma, D. Geochemistry, Groundwater and Pollution; CRC Press: Amsterdam, The Netherlands, 2004. [Google Scholar]
  55. Lyles, J.R. Is Seawater Intrusion Affecting Ground Water on Lopez Island, Washington? (No. 057–00); US Geological Survey: Reston, VA, USA, 2000.
Figure 1. Steps taken in this study to evaluate groundwater quality in the Ghaen Plain.
Ijerph 15 00172 g001
Figure 2. Location of wells sampled on the Ghaen Plain.
Ijerph 15 00172 g002
Figure 3. (a) Aquifer media; (b) soil type; and, (c) depth to water in the Ghaen Plain.
Ijerph 15 00172 g003
Figure 4. Spatial distribution of (a) total dissolved solids (TDS); (b) EC; (c) chloride (Cl); and, (d) sodium (Na+) in the aquifer.
Ijerph 15 00172 g004
Figure 5. Groundwater quality parameters beyond the permissible limits suggested by the Iranian standard for drinking water (ISIRI) and World Health Organization (WHO).
Ijerph 15 00172 g005
Figure 6. Wilcox diagram for classification of irrigation water in the Ghaen Plain.
Ijerph 15 00172 g006
Figure 7. Piper diagram for identification of water type and hydrochemical facies of the Ghaen Plain groundwater.
Ijerph 15 00172 g007
Figure 8. Heavy metal pollution index (HPI) and contamination index (Cd) for each well in the plain.
Ijerph 15 00172 g008
Figure 9. Spatial distribution of (a) magnesium (Mg+2)/calcium (Ca+2) ratio and (b) Cl vs. EC diagram in the plain.
Ijerph 15 00172 g009
Figure 10. Saltwater intrusion based on (a) Simpson’s ratios and (b) Piper diagram for the aquifer.
Ijerph 15 00172 g010
Table 1. Summary statistics for groundwater in the Ghaen Plain.
ParametersUnitMeanMedianSD *MinimumMaximumPreservationHolding Time
pHStandard7.497.50.327.098.11-ISM
ECµs cm−13416310820406277340-ISM
TDSmg L−12183198113044004690-ISM
TH (as CaCO3)mg L−16885533982011532Cool, 4 °C 24 h
Alk (as CaCO3)mg L−1274281104124480Cool, 4 °C 24 h
Ca2+mg L−1112.496.366.635.5292.0Cool, 4 °C 24 h
Mg2+mg L−199.579.166.124.0210.0Cool, 4 °C 24 h
Na+mg L−1450.6384.4302.745.01012.0Cool, 4 °C 24 h
K+mg L−19.78.77.91.329.3Cool, 4 °C 24 h
Si4+mg L−12.32.50.81.03.9Cool, 4 °C 24 h
HCO3mg L−1335.0336.8126.7152.5585.1Cool, 4 °C 24 h
SO42−mg L−1498.5471.8367.145.31345.0Cool, 4 °C 24 h
Clmg L−1607.5528.6445.195.91581.0Cool, 4 °C 24 h
PO43−mg L−10.130.10.040.070.22Cool, 4 °C 24 h
NO3mg L−116.8815.75.617.1128.9Cool, 4 °C and pH below 2 by H2SO472 h
NO2mg L−10.020.010.010.0090.039Cool, 4 °C 24 h
NH3mg L−10.030.010.010.0130.055Cool, 4 °C 24 h
Fmg L−11.281.30.270.691.66None required96 h
Bmg L−12.071.71.050.564.34Cool, 4 °C 24 h
TPmg L−10.170.20.050.0870.26Cool, 4 °C and pH below 2 by H2SO472 h
TNmg L−11.010.90.350.551.66Cool, 4 °C and pH below 2 by HNO372 h
Feµg L−1102.589.040.241.8187.6Cool, 4 °C and pH below 2 by HNO396 h
Znµg L−127.8924.110.4315.955.1Cool, 4 °C and pH below 2 by HNO396 h
Mnµg L−119.5420.16.909.1233.9Cool, 4 °C and pH below 2 by HNO396 h
Crµg L−12.242.20.681.233.67Cool, 4 °C 24 h
Cuµg L−123.9721.311.1911.549.3Cool, 4 °C and pH below 2 by HNO396 h
Pbµg L−15.545.52.572.0910.4Cool, 4 °C and pH below 2 by HNO396 h
Cdµg L−11.091.10.240.671.55Cool, 4 °C and pH below 2 by HNO396 h
* Standard Deviation (SD); In situ measurement (ISM); In a cooler with temperature of ~4 °C.
Table 2. Permissible limits of Boron in irrigation water for crops [46].
Boron ClassRange (mg L−1)
Semi-Sensitive CropsSemi-Tolerant CropsTolerant Crops
Excellent<0.33<0.67<1
Good0.33–0.670.67–1.331–2
Permissible0.67–11.33–22–3
Doubtful1–1.252–2.53–3.75
Unsuitable>1.25>2.5>3.75
Table 3. Characteristics of the calculated rotated principal factors.
RPFsEigenvaluePVE * by Each RPF PCVE by Each RPF
RPF 19.3633.433.4
RPF 25.1218.451.8
RPF 33.9013.965.7
RPF 42.177.773.4
RPF 51.906.880.2
RPF 61.625.886.0
* % of Variance Explained (PVE); % of Cumulative Variance Explained (PCVE).
Table 4. Principal components factor analysis (PCFA) loadings matrix.
ParameterRPF 1 RPF 2 RPF 3
pH
EC0.98
TDS0.95
TH (as CaCO3)0.95
Alk (as CaCO3) 0.94
Ca2+
Mg2+0.92
Na+0.95
K+
Si4+
HCO3 0.94
SO42−0.96
Cl0.96
PO43− 0.91
NO3 0.90
NO2
NH3
F
B
TP 0.91
TN
Fe
Zn
Mn
Cr
Cu
Pb
Cd

