The Vulnerability of People to Damaging Hydrogeological Events in the Calabria Region (Southern Italy)

 ,
,  and
and
Abstract
1. Introduction
- The innovative approach, based on the classification of damage to people into three severity levels, and their comparative analysis aiming to identify the phenomena and circumstances causing either the maximum damage (fatalities) or no damage (involved people). In fact, literature largely only focuses on fatalities; however, the analysis of data on involved people is an innovative element introduced in Aceto et al. [7] and is improved upon in this paper.
- The identification of victim profiles in terms of age, gender, and severity of suffered damage.
- The analysis of people-phenomena interaction in the regional circumstances, in terms of damaging phenomena and peoples’ behavior during DHEs, with an overview of more dangerous and/or frequent circumstances in which people were affected.
- The repeatability of the methodological approach in other regions.
- The public availability of the database PEOPLE (The Database PEOPLE 2 is available on Mendely, http://dx.doi.org/10.17632/99knpdb6yp.1.), representing a resource to other scientists working on the same topic in other geographical frameworks.
2. Literature on Flood and Landslide Fatalities
2.1. Flood Fatalities
2.2. Landslide Fatalities
2.3. Secondary Phenomena
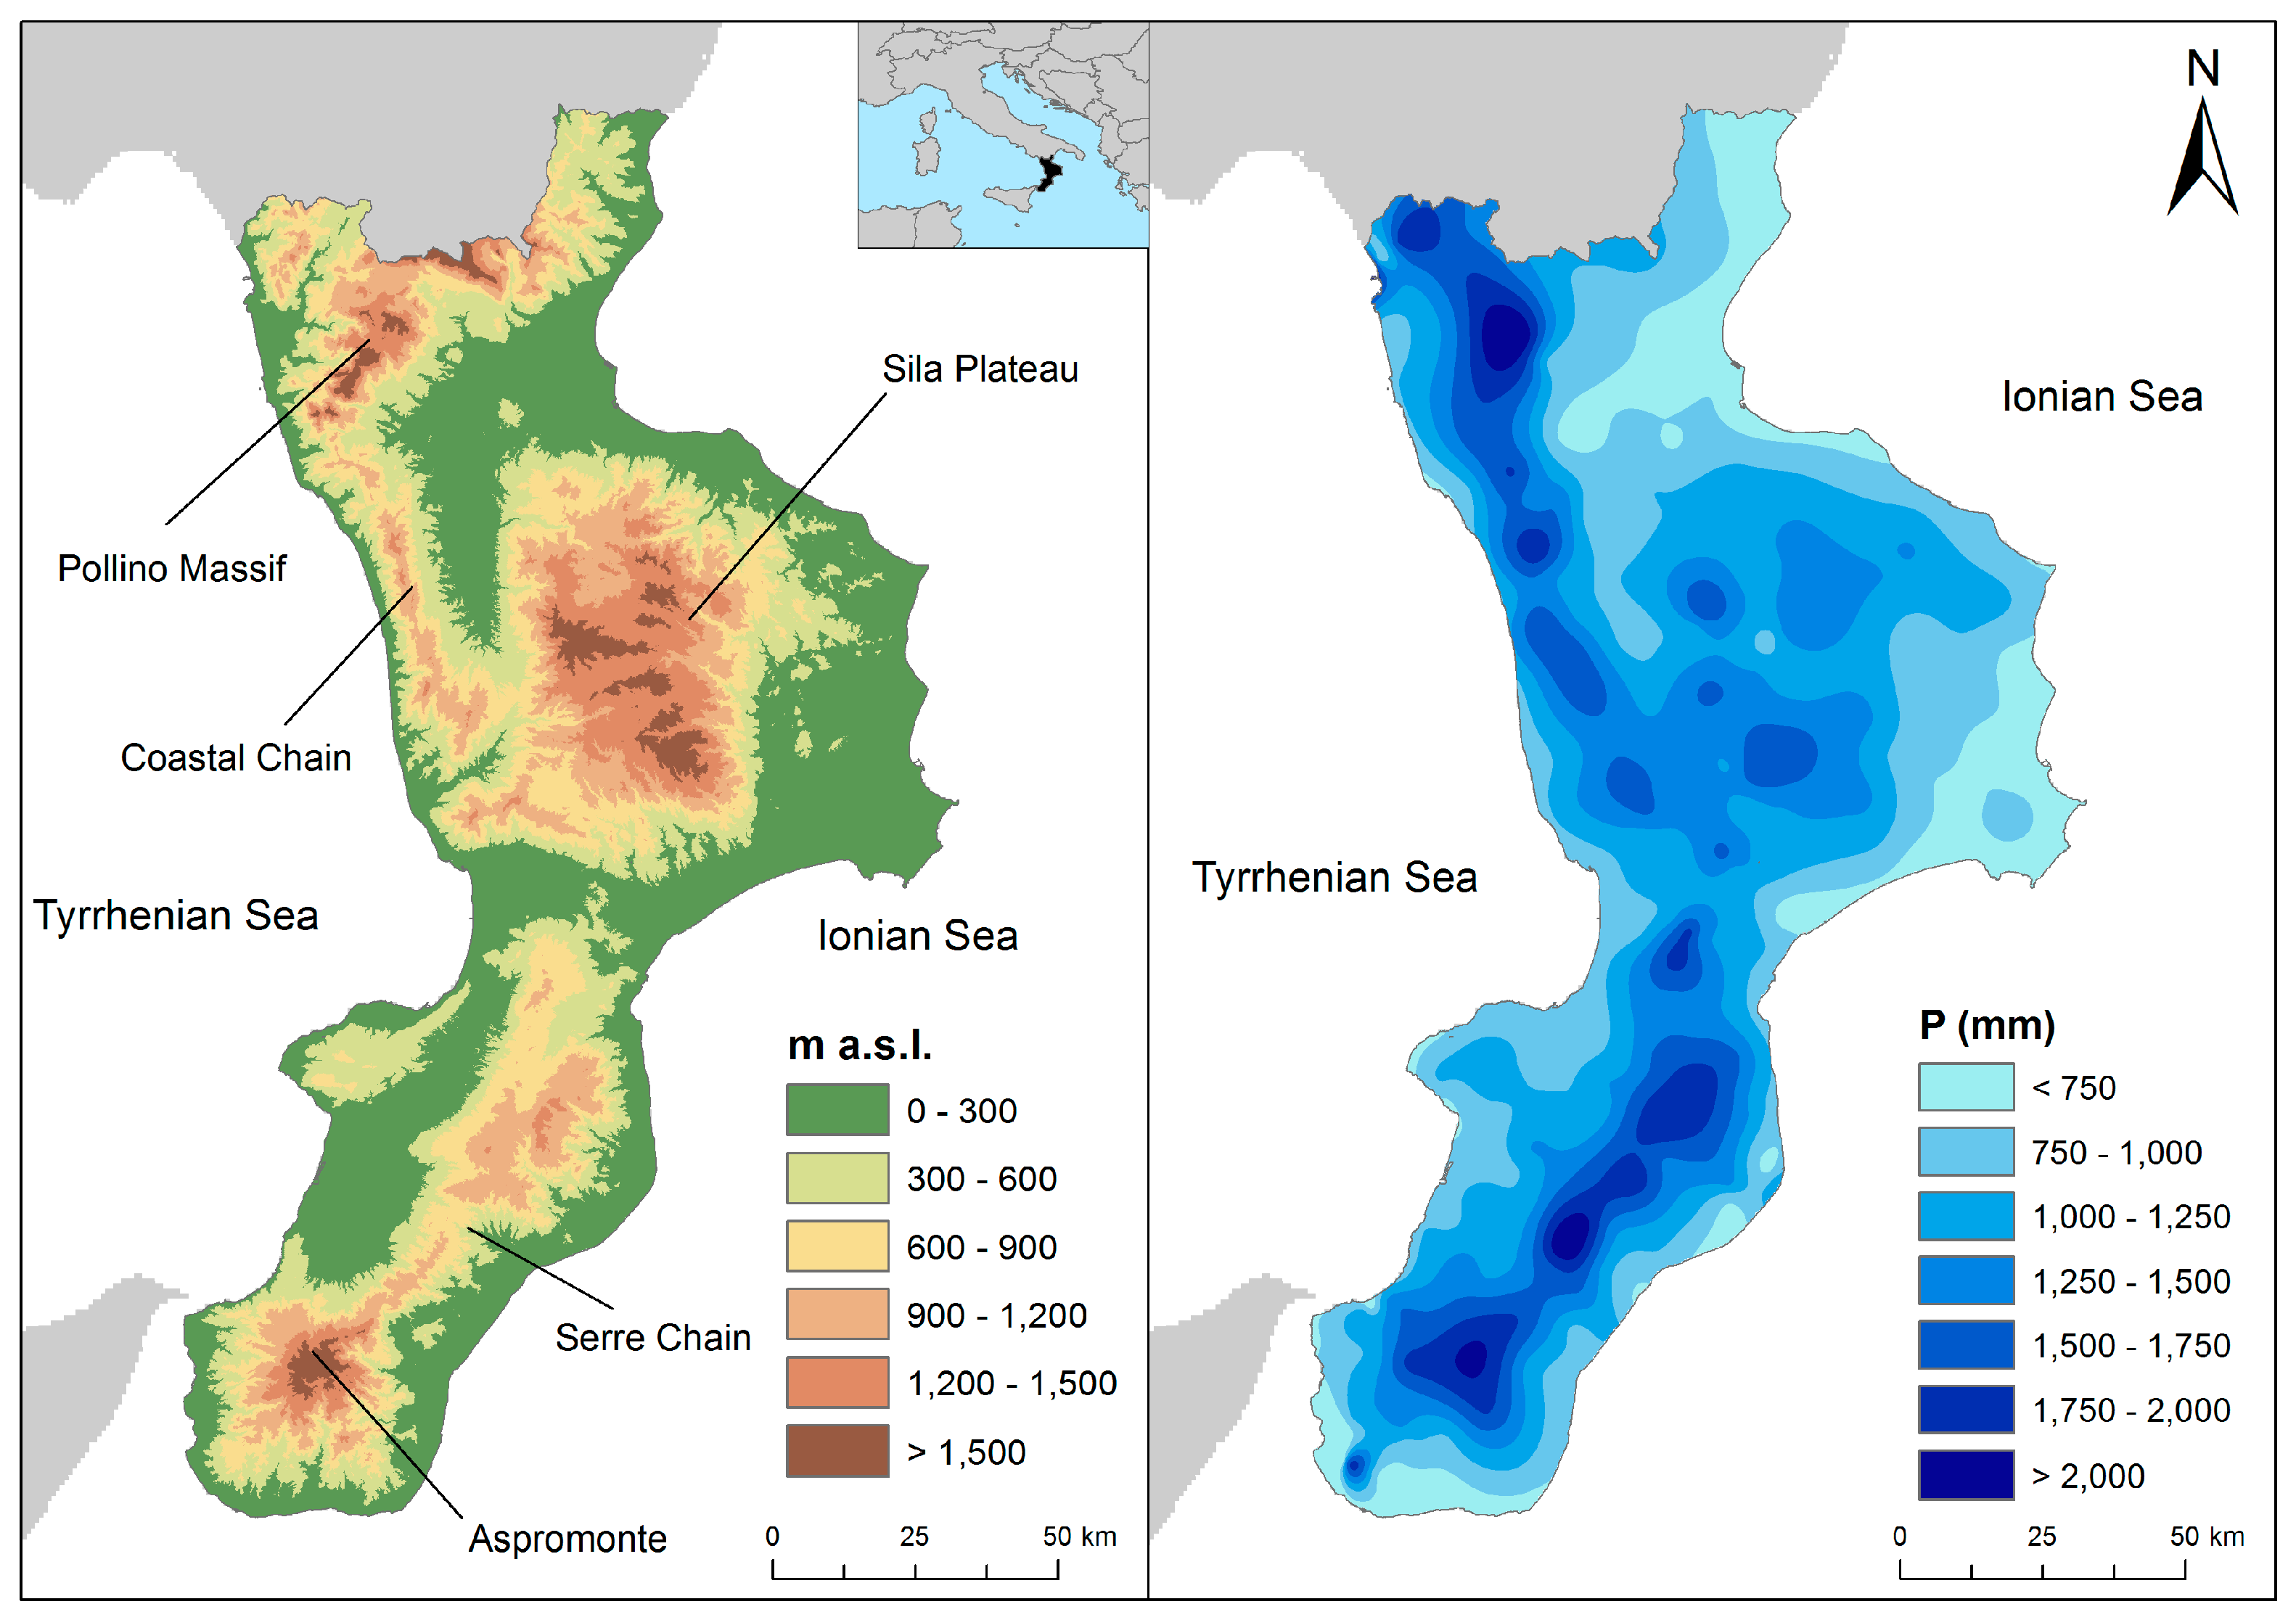
3. The Study Area
4. Materials and Methods
4.1. PEOPLE Database
4.1.1. The “Event Identification”
- (a)
- Time of the event: This contains the year (YYYY), month (MM) and day (DD) in which the damaging event occurred, and the identification number of each record, ID, composed of the sequence of year (YYYY), month (MM), and day (DD) of the event and the progressive record number (##) (Table 3).
- (b)
- Type of phenomenon: In Calabria, the phenomena that harmed people during the study period are as follows: flood, urban flooding, landslide, rock fall, road collapse, windstorm, lightning, storm surge, and others (hail and thunderstorm). Urban flooding corresponds to pluvial or rainfall floods [5] that occur when heavy rainfall creates a flood event independent of an overflowing water body. This typically occurs in urban environments when the local drainage system is not capable of collecting and conveying surface runoff. The phenomenon classified as road collapse is the unexpected sinking of road caused by landslides, stream erosion or piping.
- (c)
- Victim identification: This reports the name, surname, gender and age of the victims. Name and surname, when available, allow the exact identification of the people affected, avoiding double counts that can occur in cases where only generic descriptions were available (e.g., “a man died”).
- (d)
- Damage severity: According to the severity of damage, persons are classified as follows: fatalities, injured, and involved people. The latter are people that were present at the place of the accident but survived without suffering physical damage. They may be: (a) those who displayed hazardous behavior; (b) those who were able to protect themselves; or (c) people who acted as nonprofessional rescuers. Especially in the case of severe events, newspapers do not report the exact number of involved people and often use collective measures (e.g., “tens of people”). We translated the colloquial “frequency words” [46] into numbers to obtain a rough assessment of the amount of people involved. We assumed some/a few people ≈ 4; several people ≈ 8; numerous/tens of people ≈ 10; many people ≈ 15; more than one hundred people ≈ 100.
4.1.2. The “Victim-Event Interaction”
- (a)
- Place where the damage occurred, sorted into five indoor and nine outdoor locations (Table 3).
- (b)
- Condition of people at the moment they were affected, classified into 12 types.
- (c)
- Activity carried out by victims at the moment of the event, summarized into 10 types.
- (d)
- Dynamic of people-event interaction, sorted into 18 types.
4.1.3. The “Effects on People”
- (a)
- Causes of death, sorted into 8 types.
- (b)
- Types of injuries, sorted into 15 types.
5. Data Presentation
5.1. Temporal Trend
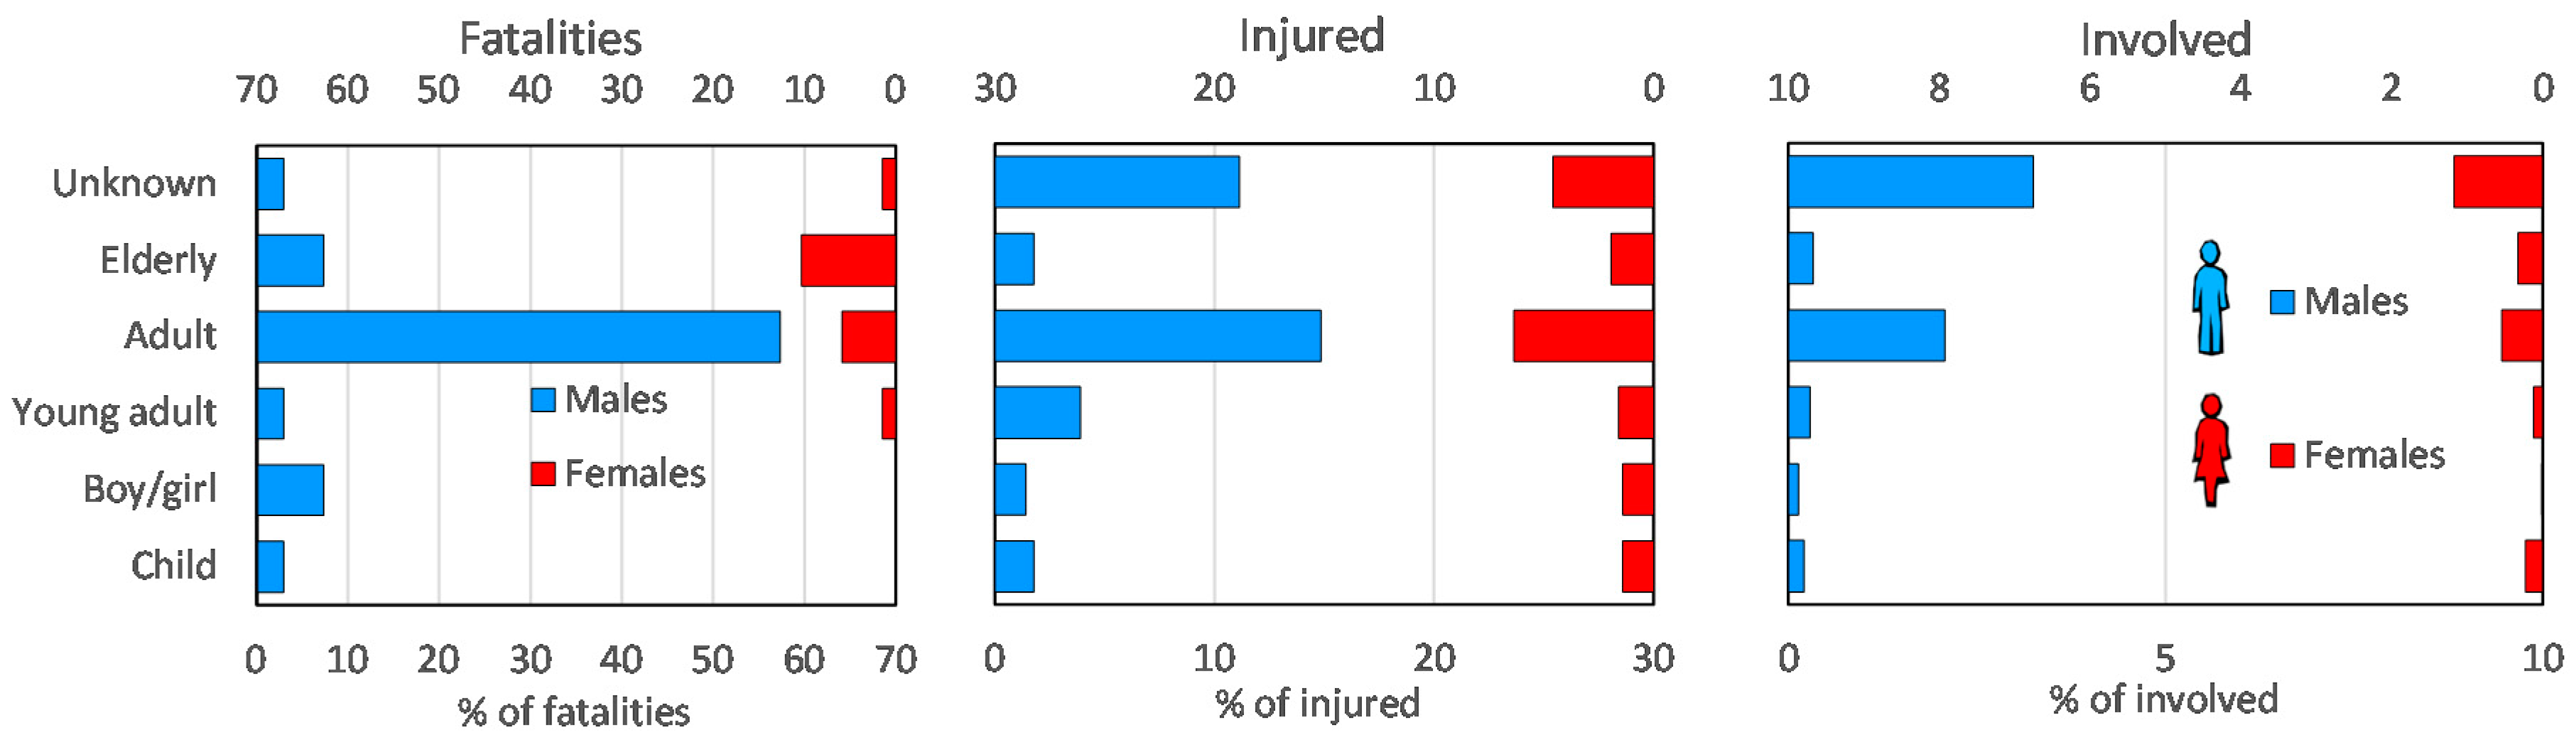
5.2. Age and Gender
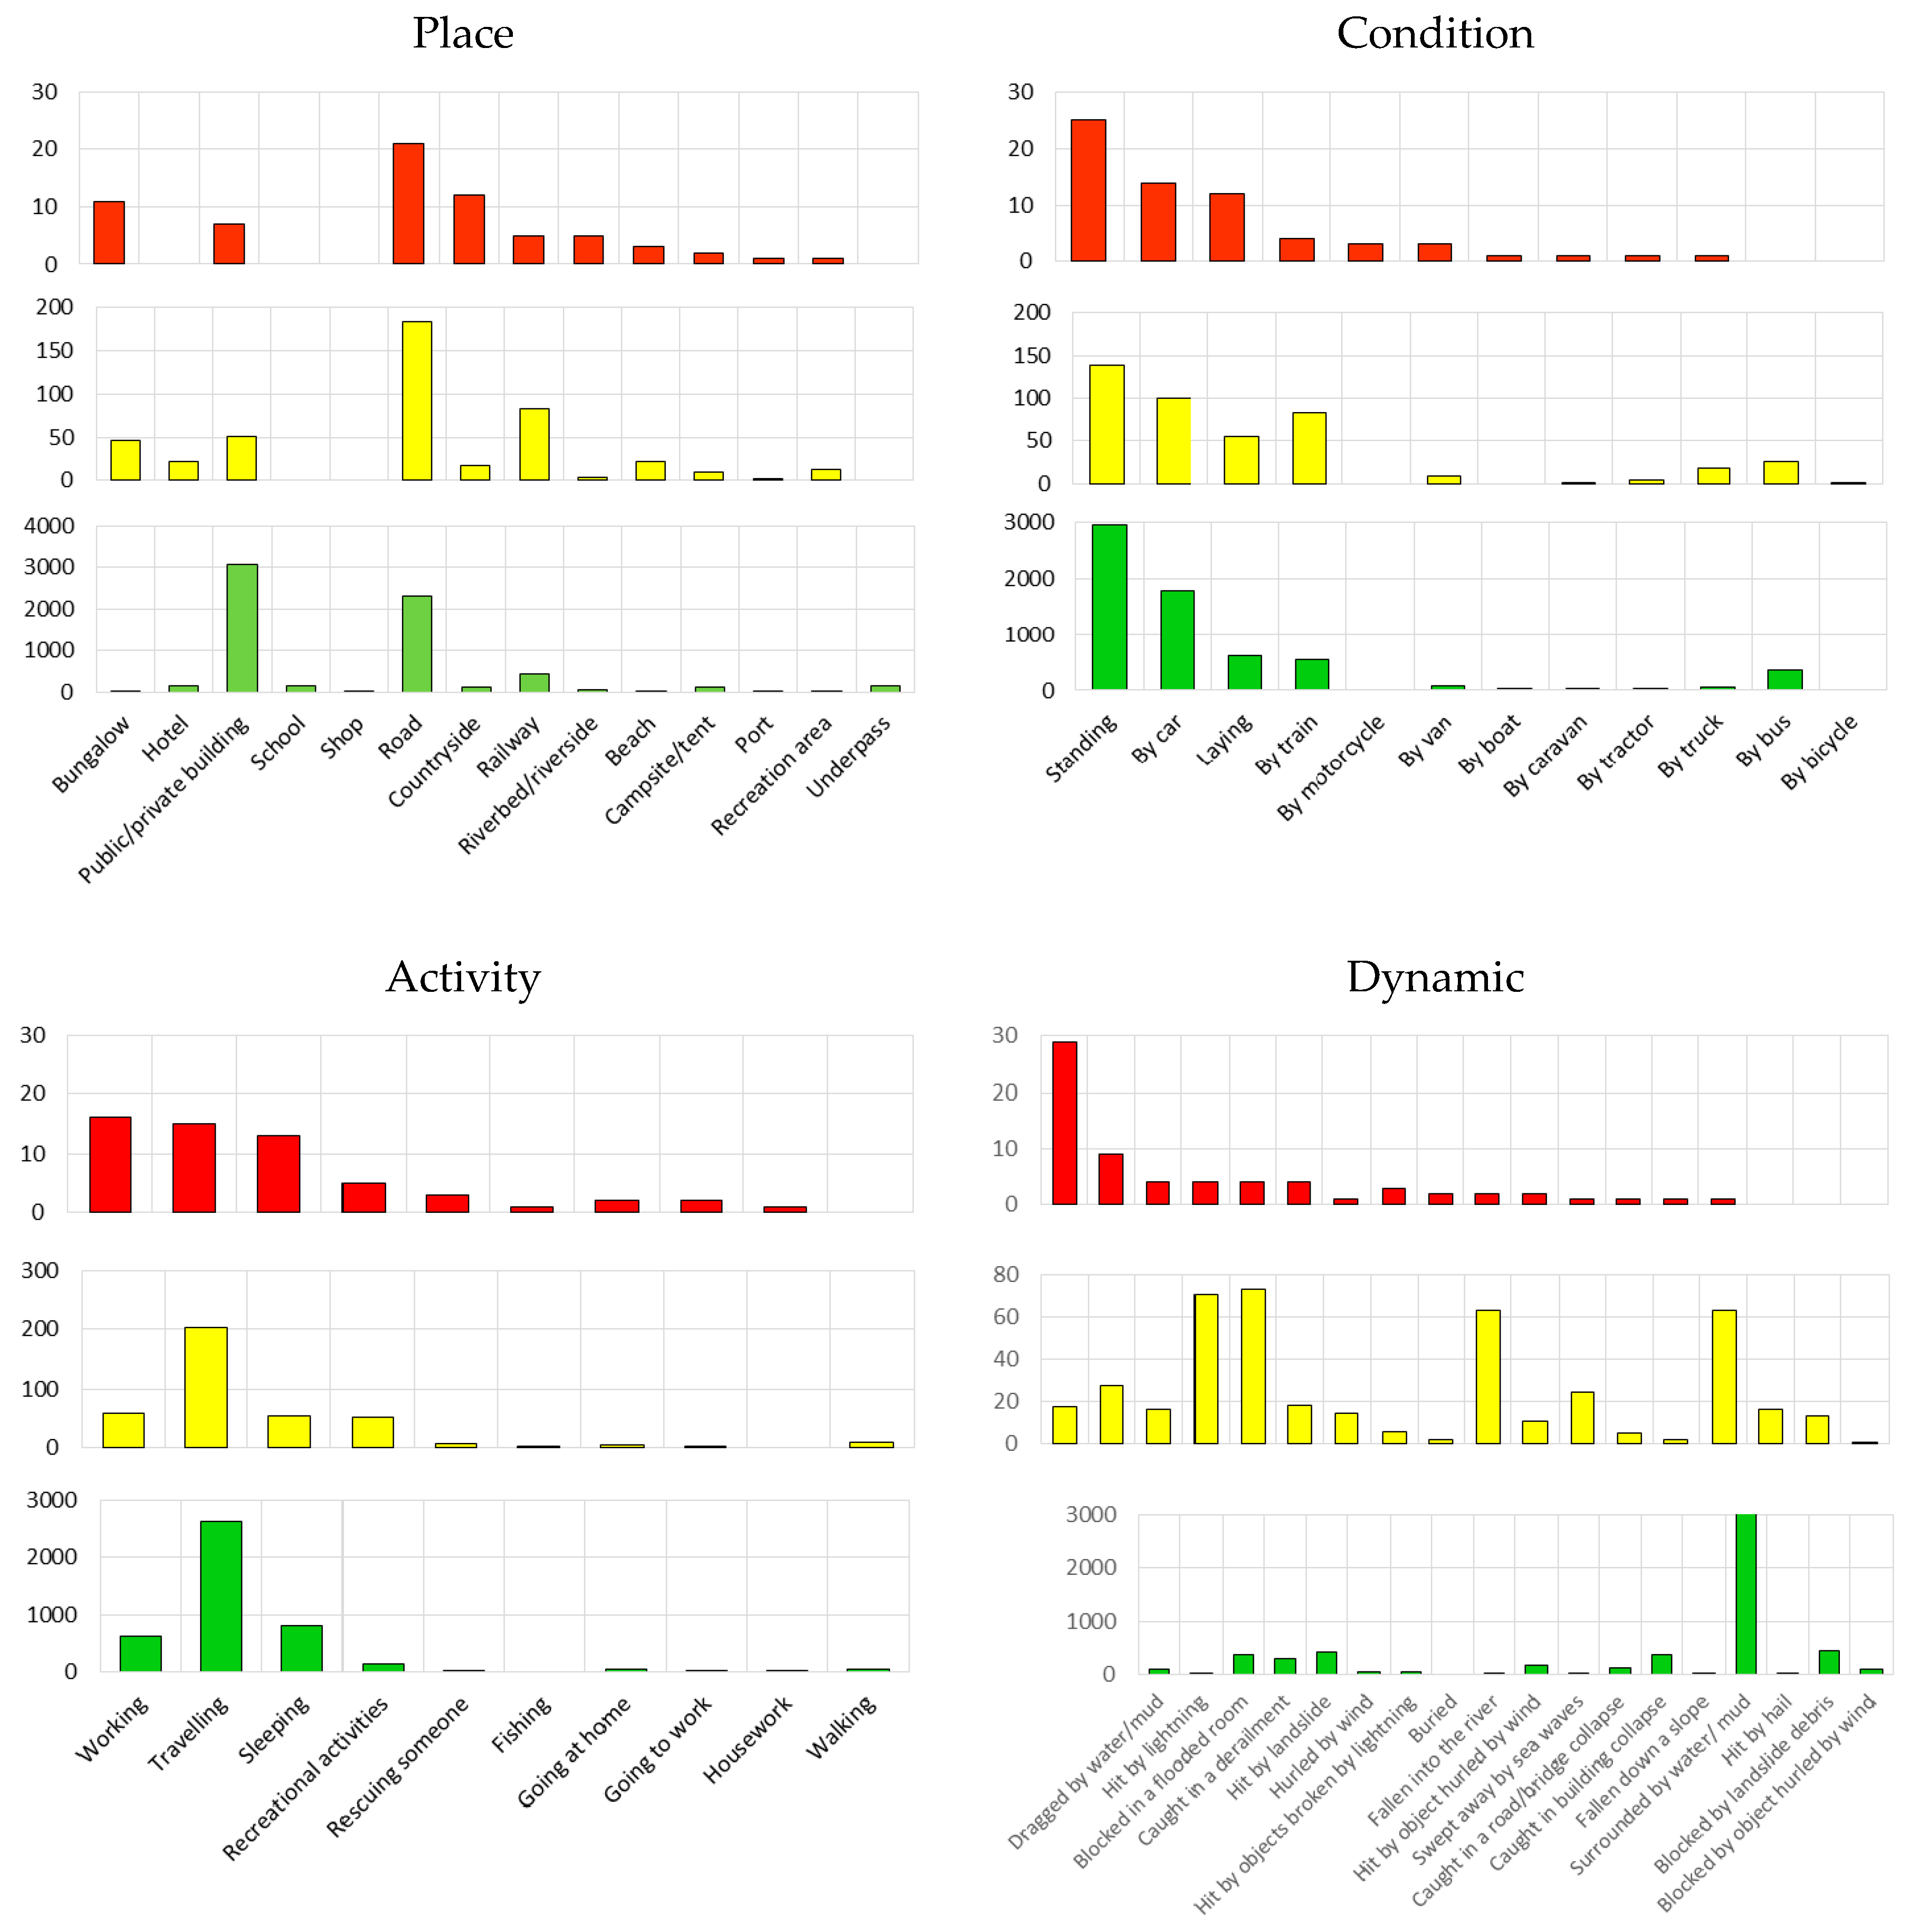
5.3. Place, Condition, Activity and Dynamic
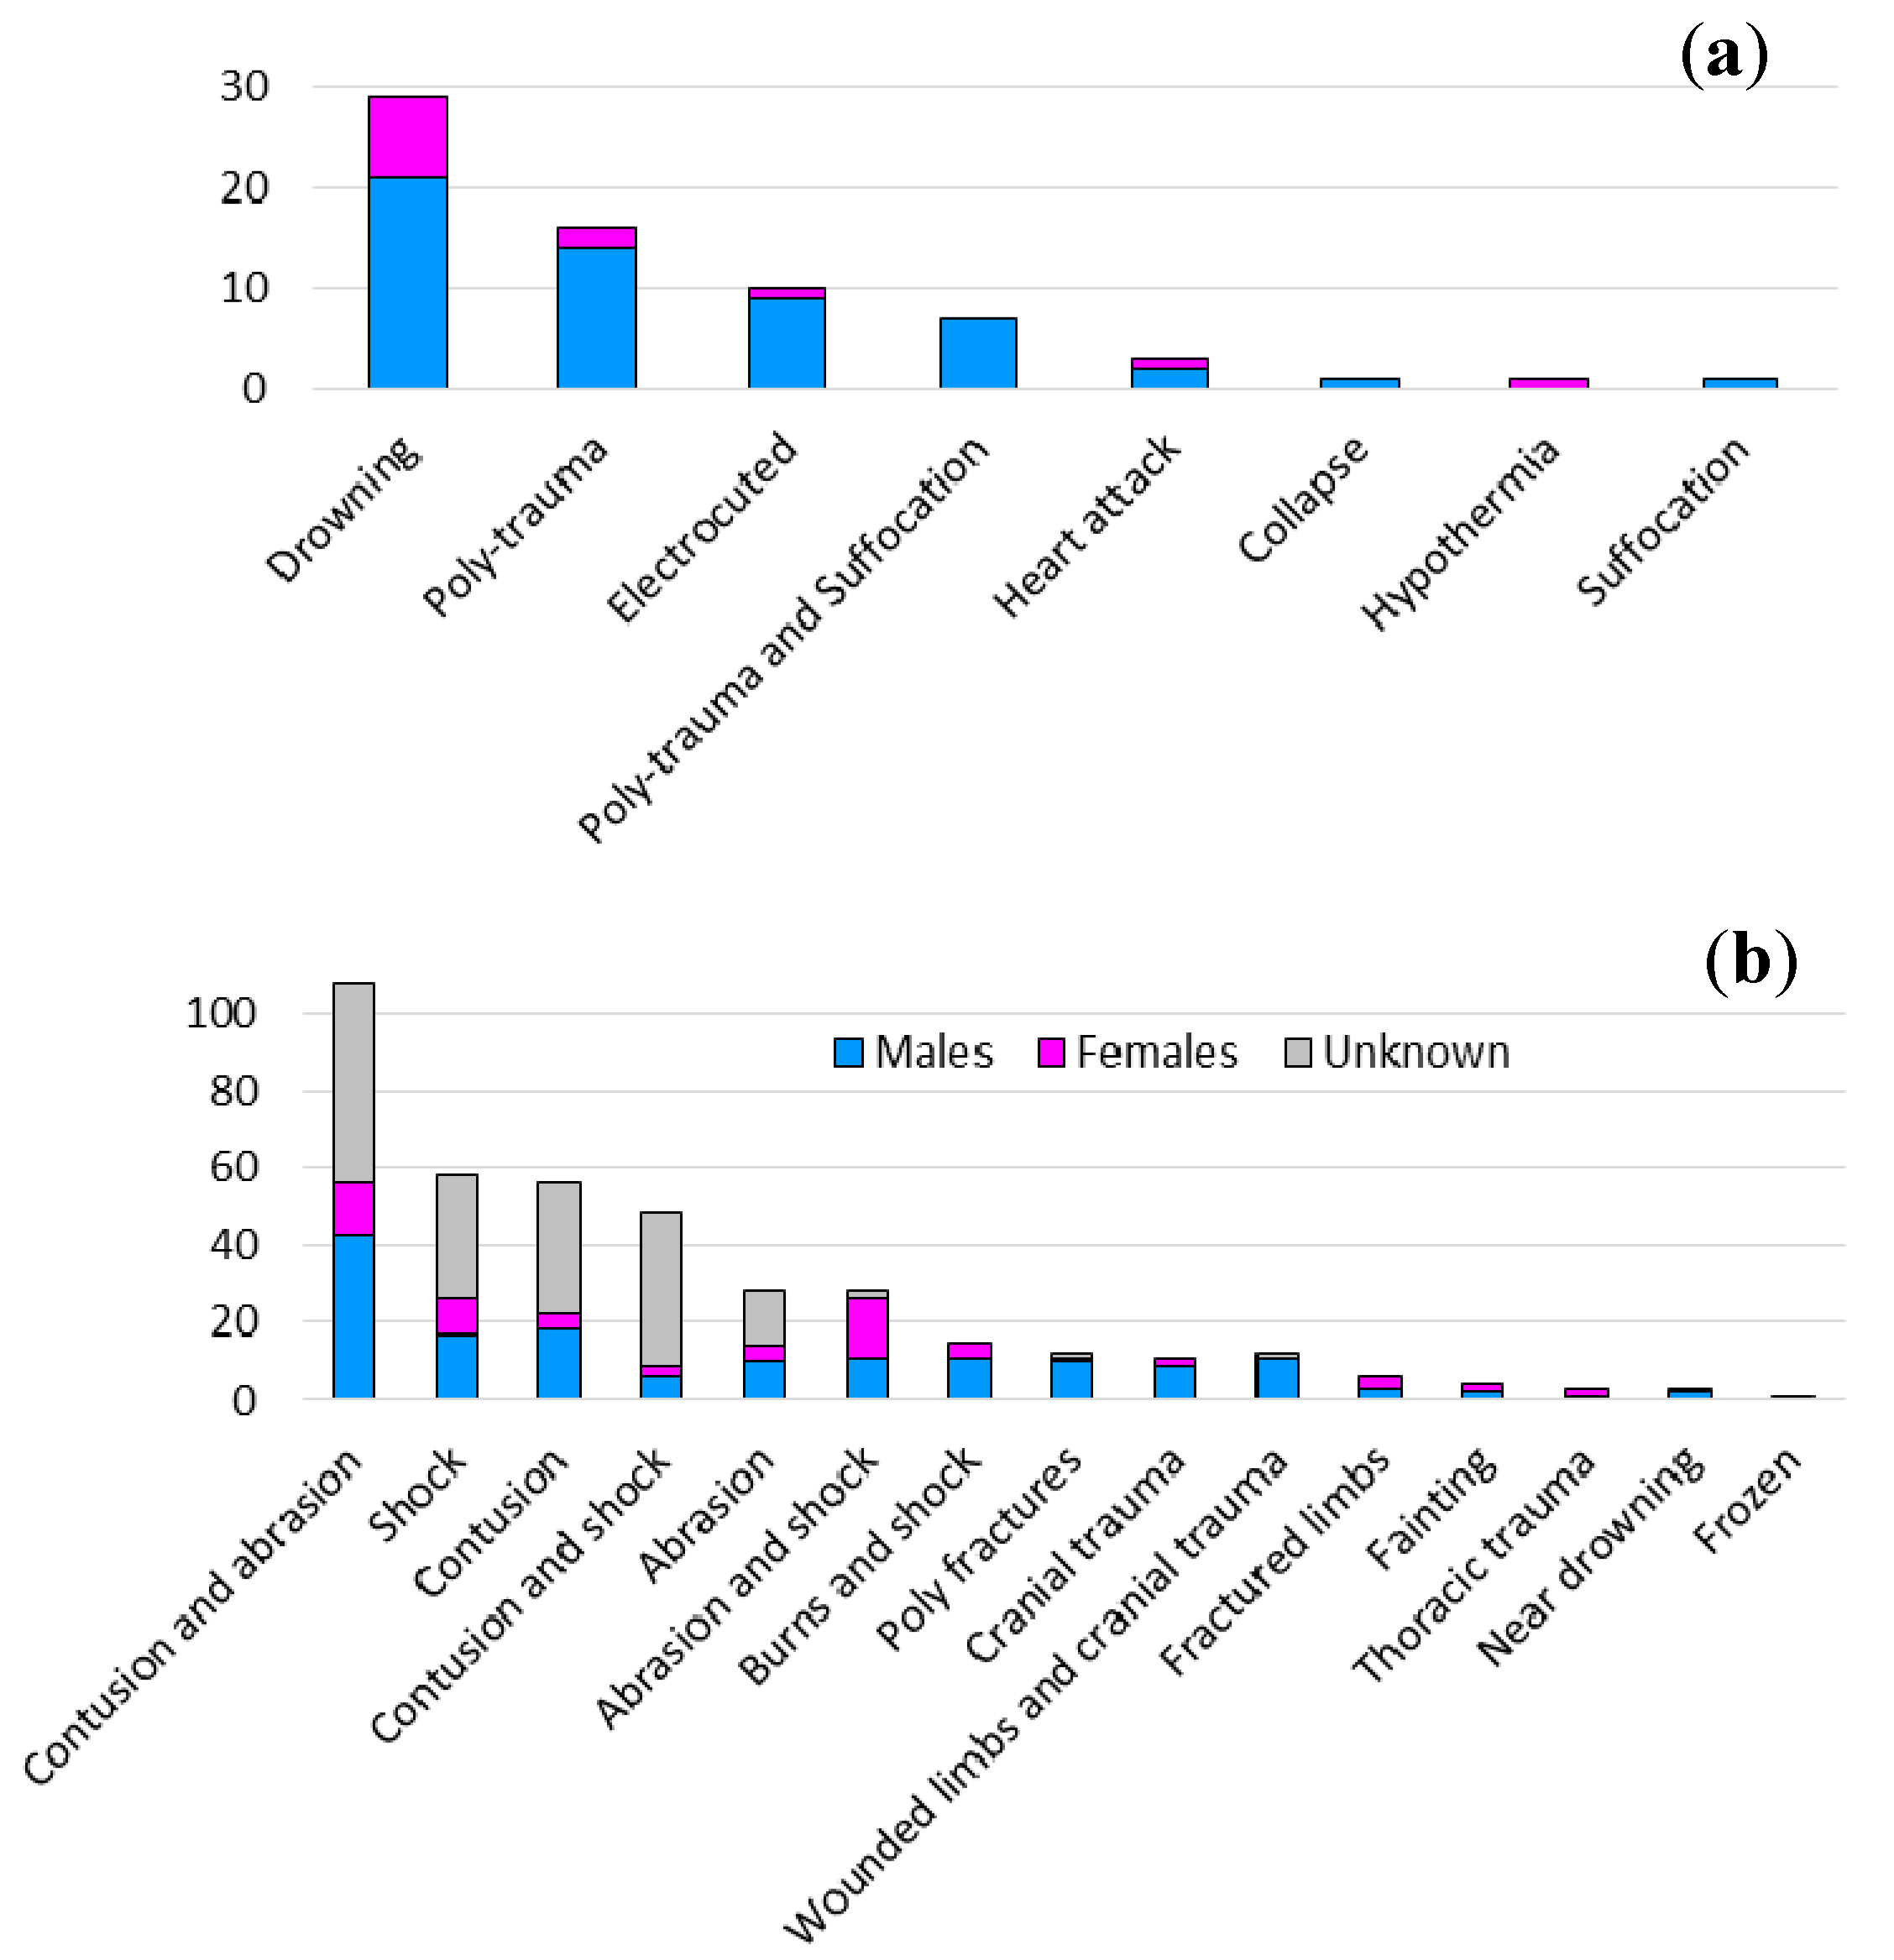
5.4. Causes of Death and Types of Injures
5.5. Hazardous and Protective Behaviors of People
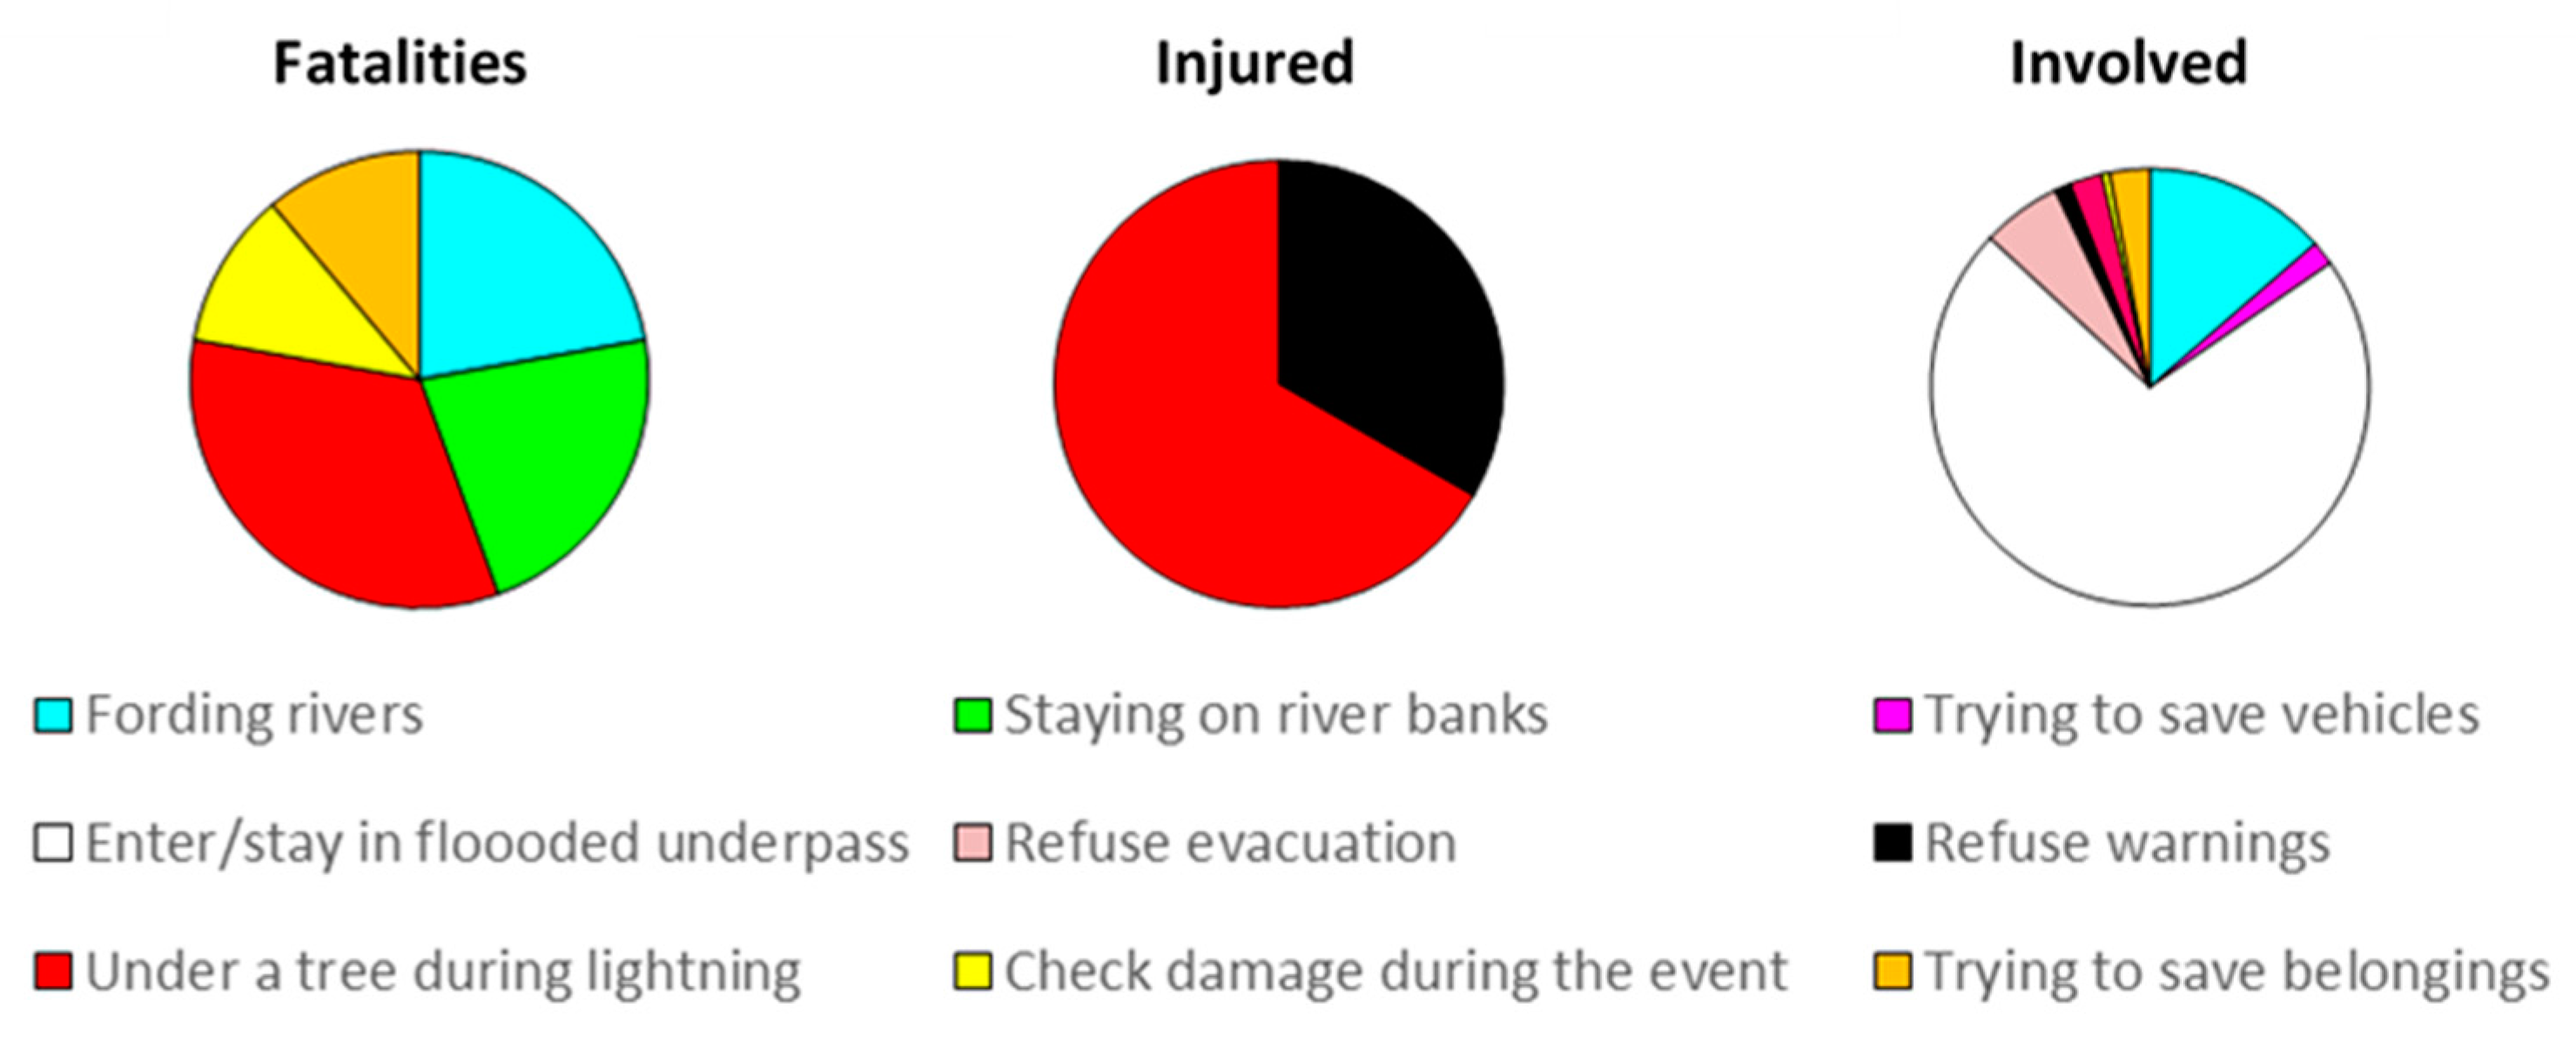
- (1)
- Fatalities: We found hazardous behavior for 13.24% of cases, concerning only males; the most frequent cases were being under a tree during lightning and fording or staying along rivers.
- (2)
- Injured: Only three cases were recorded, two males and a female. Nevertheless, this does not exclude hazardous behaviors not reported by our data sources.
- (3)
- Involved people: Hazardous behaviors were largely documented and performed more often by males than by females, even if, in this group of people, the gender is unknown in several cases. The most frequent circumstance was entering into a flooded underpass, which was detected in 121 cases, 19 involving males, three involving females, and the remaining 99 of unknown gender. Another frequent hazardous behavior was fording rivers, which was recorded in 23 cases, nine for males and six for females.
- (4)
- Fatalities: Protective behaviors were adopted by a relatively low number of persons; four males and one female died trying to save someone else, while another two males tried to save their lives climbing trees, and a female died trying to grab to her son.
- (5)
- Injured: Trying to save someone was detected for four males and one female, respectively. To get out of from cars/trains is quite frequent, carried out in 33 cases by males.
- (6)
- Involved: Even in this group, the group of people that tried to save someone else included 35 males and one female. The most diffuse behavior in this group was climbing on the roof/upper floor, which was recorded in more than one thousand cases at a similar percentage by males and females.
- (7)
- Fatalities: Lightning/staying under a tree during lightning was the reported behavior of three of the 10 lightning fatalities during the study period. Harmful behaviors were evident for floods and resulted in four fatalities. Two persons died fording a river, and two died staying on the riverbed. Behaviors regarding the concern of people for their properties caused two fatalities during storm surge.
- (8)
- Injured: A few people were injured showed hazardous behaviors, one in the case of a windstorm and two in the case of lightning.
- (9)
- Involved: In this group, the behaviors were mainly related to floods; in 23 cases fording rivers and in 121 entering flooded underpasses. Two of these persons were homeless sleeping in the underpass. It must be noted that, for landslides, the only hazardous behavior was to refuse evacuation, which was recorded for 10 involved persons.
- (10)
- Fatalities: An attempt to rescue someone was recorded during flood, urban flooding, landslide, windstorm and storm surge. Flood caused four fatalities. Further protective behaviors were detected in flood fatalities, such as climbing on the car roof, grabbing on to someone, and climbing trees, even if these behaviors did not save their lives.
- (11)
- Injured: The majority of injured people that exhibited a protective behavior get out from car/train hit by a landslide (33 cases).
- (12)
- Involved people: The largest number involved people climbing on a roof/upper floor in the case of floods. During landslides, cases of protective behaviors were more numerous and differentiated than for every other phenomena, including moving to a safer place (514 cases), escaping from cars/train (65), driving to avoid danger (29) and escaping from buildings (24).
6. Discussion
- (1)
- Phenomena: The majority of people were affected by floods and landslides, and secondarily by other damaging phenomena. Floods were more dangerous than landslides, causing the largest percentage of fatalities and injured, while urban flooding affected several people but killed only one person. This finding cannot be compared to international inventories, because they generally focus on a single type of phenomenon (floods or landslides). Nevertheless, a comparison to the national catalogue of flood and landslide fatalities in Italy from 1960 to 2014 [25] found that, at the national scale, landslides killed more people than did floods, while, in Calabria, the opposite was true. Nevertheless, the most dangerous phenomenon, even if less common, was lightning, as it affected a small number of people but caused a relatively high number of fatalities and injured.
- (2)
- Age. The average age decreased from fatalities to injured to involved people, suggesting that the greater mental readiness and higher physical ability of young adults and adults may increase their chances of avoiding harmful events, while middle-aged and senior people injured themselves falling due to water and mud, or suffered panic attacks when water or mud rapidly moved into their home or car.
- (3)
- Gender. Our results are in accordance with those of other authors (Table 1), who detected a greater exposition/vulnerability of males who were more numerous in all three severity levels. The ratios of male/female are 4.4 for fatalities, 2.0 for injured, and 2.6 for involved people. Adult females are numerous in all three groups, but, among fatalities, the elderly female class shows a slight vulnerability. Males are more vulnerable than females in the case of landslides, lightning and road collapse.
- (4)
- Hazardous/protective behaviors. Individuals who faced an unexpected landslide did not show any clear hazardous behaviors and instead adopted self-protective actions (mainly escaping very quickly), thus reducing the potential landslide impact. For floods, this result was the opposite; several clear and identified careless and negligent actions were detected.
7. Conclusions
Author Contributions
Conflicts of Interest
Appendix A

| Fatalities | ||||||||||||||
| Type of Phenomenon | Total Fatalities | 0–10 Y | 11–18 Y | 19–25 Y | 26–65 Y | >65 Y | Unknown | |||||||
| # | % | # | % | # | % | # | % | # | % | # | % | # | % | |
| Flood | 26 | 37.14 | - | - | 1 | 1.43 | 3 | 4.29 | 15 | 21.43 | 6 | 8.57 | 1 | 1.43 |
| Urban flooding | 1 | 1.43 | - | - | - | - | - | - | - | - | 1 | 1.43 | - | - |
| Landslide | 15 | 21.43 | 2 | 2.86 | - | - | - | - | 12 | 17.14 | 1 | 1.43 | - | - |
| Rock fall | 1 | 1.43 | - | - | - | - | - | - | 1 | 1.43 | - | - | - | - |
| Road collapse | 1 | 1.43 | - | - | - | - | - | - | 1 | 1.43 | - | - | - | - |
| Windstorm | 9 | 15.71 | - | - | - | - | - | - | 6 | 8.57 | 3 | 4.29 | - | - |
| Lightning | 10 | 14.29 | - | - | 4 | 5.71 | - | - | 5 | 7.14 | - | - | 1 | 1.43 |
| Storm surge | 5 | 7.14 | - | - | - | - | - | - | 3 | 4.29 | 1 | 1.43 | 1 | 1.43 |
| Others (hail, thunderstorm) | - | - | - | - | - | - | - | - | - | - | - | - | - | - |
| Injured | ||||||||||||||
| Type of Phenomenon | Total Injured | 0–10 Y | 11–18 Y | 19–25 Y | 26–65 Y | >65 Y | Unknown | |||||||
| # | % | # | % | # | % | # | % | # | % | # | % | # | % | |
| Flood | 194 | 34.28 | 5 | 0.88 | 7 | 1.24 | 10 | 1.77 | 39 | 6.89 | 13 | 2.30 | 120 | 21.20 |
| Urban flooding | 12 | 2.12 | - | - | - | - | 1 | 0.18 | 2 | 0.35 | 4 | 0.71 | 5 | 0.88 |
| Landslide | 178 | 31.63 | 3 | 0.53 | 1 | 0.18 | 9 | 1.59 | 44 | 7.77 | 8 | 1.41 | 113 | 19.96 |
| Rock fall | 5 | 0.88 | - | - | 1 | 0.18 | - | - | 1 | 0.18 | - | - | 3 | 0.53 |
| Road collapse | 16 | 2.83 | - | - | - | - | 1 | 0.18 | 9 | 1.59 | 1 | 0.18 | 5 | 0.88 |
| Windstorm | 93 | 16.43 | 4 | 0.71 | - | - | 10 | 1.77 | 26 | 4.59 | 5 | 0.88 | 48 | 8.48 |
| Lightning | 32 | 5.65 | 3 | 0.53 | 6 | 1.06 | 2 | 0.35 | 11 | 1.94 | - | - | 10 | 1.77 |
| Storm surge | 18 | 3.18 | 5 | 0.88 | 1 | 0.18 | 1 | 0.18 | 2 | 0.35 | - | - | 9 | 1.59 |
| Others (hail, thunderstorm) | 18 | 3.00 | - | - | - | - | - | - | 3 | 0.53 | 2 | 0.35 | 13 | 2.30 |
| Involved | ||||||||||||||
| Type of Phenomenon | Total Involved | 0–10 Y | 11–18 Y | 19–25 Y | 26–65 Y | >65 Y | Unknown | |||||||
| # | % | # | % | # | % | # | % | # | % | # | % | # | % | |
| Flood | 2084 | 31.33 | 26 | 0.39 | 76 | 1.14 | 14 | 0.21 | 100 | 1.50 | 35 | 0.53 | 1833 | 27.56 |
| Urban flooding | 1961 | 29.48 | 249 | 3.74 | 123 | 1.85 | 5 | 0.08 | 39 | 0.59 | 47 | 0.71 | 1498 | 22.52 |
| Landslide | 1949 | 29.30 | 46 | 0.69 | 58 | 0.87 | 7 | 0.11 | 58 | 0.87 | 11 | 0.17 | 1769 | 26.59 |
| Rock fall | 49 | 0.74 | - | - | - | - | 1 | 0.02 | 2 | 0.03 | 1 | 0.02 | 45 | 0.68 |
| Road collapse | 95 | 1.43 | 4 | 0.06 | 10 | 0.15 | 4 | 0.06 | 2 | 0.03 | - | - | 75 | 1.13 |
| Windstorm | 259 | 3.86 | 7 | 0.11 | 4 | 0.06 | - | - | 32 | 0.48 | 5 | 0.08 | 211 | 3.17 |
| Lightning | 44 | 0.66 | - | - | - | - | 1 | 0.02 | - | - | - | - | 43 | 0.65 |
| Storm surge | 92 | 1.38 | 2 | 0.03 | 3 | 0.05 | 1 | 0.02 | 13 | 0.20 | 8 | 0.12 | 65 | 0.98 |
| Others (hail, thunderstorm) | 121 | 1.82 | 4 | 0.06 | - | - | 1 | 0.02 | - | - | 2 | 0.03 | 114 | 1.71 |
| Place | Total People | Fatalities | Injured | Involved | ||||
|---|---|---|---|---|---|---|---|---|
| # | % | # | % | # | % | # | % | |
| Bungalow | 70 | 0.96 | 11 | 16.18 | 46 | 8.13 | 13 | 0.32 |
| Hotel | 162 | 2.22 | - | - | 21 | 3.71 | 141 | 2.12 |
| Public/private building | 3128 | 42.92 | 7 | 10.29 | 51 | 9.01 | 3070 | 46.14 |
| School | 160 | 2.20 | - | - | - | - | 160 | 2.40 |
| Shop | 20 | 0.27 | - | - | - | - | 20 | 0.30 |
| Road | 2520 | 34.58 | 21 | 30.88 | 183 | 32.33 | 2308 | 34.69 |
| Countryside | 150 | 2.06 | 12 | 17.65 | 17 | 3.00 | 129 | 1.82 |
| Railway | 527 | 7.23 | 5 | 7.35 | 83 | 14.66 | 439 | 6.60 |
| Riverbed/riverside | 49 | 0.67 | 5 | 7.35 | 4 | 0.71 | 40 | 0.60 |
| Beach | 49 | 0.67 | 3 | 4.41 | 21 | 3.71 | 25 | 0.38 |
| Campsite/tent | 136 | 1.87 | 2 | 2.94 | 9 | 1.59 | 125 | 1.88 |
| Port | 7 | 0.10 | 1 | 1.47 | 2 | 0.35 | 4 | 0.06 |
| Recreation area | 17 | 0.23 | 1 | 1.47 | 12 | 2,12 | 4 | 0.06 |
| Underpass | 137 | 1.88 | - | - | - | - | 137 | 2.06 |
| Not reported | 156 | 2.14 | - | - | 117 | 20.67 | 39 | 0.59 |
| Condition | ||||||||
| Standing | 3119 | 42.80 | 25 | 36.76 | 138 | 24.38 | 2956 | 44.42 |
| By car | 1892 | 25.96 | 14 | 20.59 | 99 | 17.49 | 1779 | 26.74 |
| Laying | 685 | 9.40 | 12 | 17.65 | 55 | 9.72 | 618 | 9.29 |
| By train | 626 | 8.59 | 4 | 5.88 | 83 | 14.66 | 539 | 8.10 |
| By motorcycle | 3 | 0.04 | 3 | 4.41 | - | - | - | - |
| By van | 98 | 1.34 | 3 | 4.41 | 9 | 1.59 | 86 | 1.29 |
| By boat | 11 | 0.15 | 1 | 1.47 | - | - | 10 | 0.15 |
| By caravan | 8 | 0.11 | 1 | 1.47 | 1 | 0.18 | 6 | 0.09 |
| By tractor | 14 | 0.19 | 1 | 1.47 | 4 | 0.71 | 9 | 0.14 |
| By truck | 82 | 1.13 | 1 | 1.47 | 18 | 3.18 | 63 | 0.95 |
| By bus | 390 | 5.35 | - | - | 26 | 4.59 | 364 | 5.47 |
| By bicycle | 1 | 0.01 | - | - | 1 | 0.18 | - | - |
| Not reported | 359 | 4.93 | 3 | 4.41 | 132 | 23.32 | 224 | 3.37 |
| Activity | ||||||||
| Working | 707 | 9.70 | 16 | 23.53 | 59 | 10.42 | 632 | 9.50 |
| Travelling | 2848 | 39.08 | 15 | 22.06 | 202 | 35.69 | 2631 | 39.54 |
| Sleeping | 882 | 12.10 | 13 | 19.12 | 54 | 9.54 | 815 | 12.25 |
| Recreational activities | 208 | 2.85 | 5 | 7.35 | 52 | 9.19 | 151 | 2.27 |
| Rescuing someone | 20 | 0.27 | 3 | 4.41 | 7 | 1.24 | 10 | 0.15 |
| Fishing | 2 | 0.03 | 1 | 1.47 | 1 | 0.18 | - | - |
| Going at home | 54 | 0.74 | 2 | 2.94 | 6 | 1.06 | 46 | 0.69 |
| Going to work | 7 | 0.10 | 2 | 2.94 | 3 | 0.53 | 2 | 0.03 |
| Housework | 2 | 0.03 | 1 | 1.47 | 0 | 0.00 | 1 | 0.02 |
| Walking | 64 | 0.88 | - | - | 10 | 1.77 | 54 | 0.81 |
| Not reported | 2494 | 34.22 | 10 | 14.71 | 172 | 30.39 | 2312 | 34.75 |
| Dynamic | ||||||||
| Dragged by water/mud | 143 | 1.96 | 29 | 42.65 | 17 | 3.00 | 97 | 1.46 |
| Hit by lightning | 46 | 0.63 | 9 | 13.24 | 27 | 4.77 | 10 | 0.15 |
| Blocked in a flooded room | 393 | 5.39 | 4 | 5.88 | 16 | 2.83 | 373 | 5.61 |
| Caught in a derailment | 361 | 4.95 | 4 | 5.88 | 71 | 12.54 | 286 | 4.30 |
| Hit by landslide | 484 | 6.64 | 4 | 5.88 | 73 | 12.90 | 407 | 6.12 |
| Hurled by wind | 55 | 0.75 | 4 | 5.88 | 18 | 3.18 | 33 | 0.50 |
| Hit by objects broken by lightning | 60 | 0.82 | 1 | 1.47 | 14 | 2.47 | 45 | 0.68 |
| Buried | 9 | 0.12 | 3 | 4.41 | 6 | 1.06 | 0 | 0.00 |
| Fallen into the river | 10 | 0.14 | 2 | 2.94 | 2 | 0.35 | 6 | 0.09 |
| Hit by object hurled by wind | 231 | 3.17 | 2 | 2.94 | 63 | 11.13 | 166 | 2.49 |
| Swept away by sea waves | 26 | 0.36 | 2 | 2.94 | 10 | 1.77 | 14 | 0.21 |
| Caught in a road/bridge collapse | 142 | 1.95 | 1 | 1.47 | 24 | 4.24 | 117 | 1.76 |
| Caught in building collapse | 372 | 5.10 | 1 | 1.47 | 5 | 0.88 | 366 | 5.50 |
| Fallen down a slope | 4 | 0.05 | 1 | 1.47 | 2 | 0.35 | 1 | 0.02 |
| Surrounded by water/ mud | 4224 | 57.96 | 1 | 1.47 | 63 | 11.13 | 4160 | 62.52 |
| Hit by hail | 25 | 0.34 | - | - | 16 | 2.83 | 9 | 0.14 |
| Blocked by landslide debris | 460 | 6.31 | - | - | 13 | 2.30 | 447 | 6.72 |
| Blocked by object hurled by wind | 79 | 1.08 | - | - | 1 | 0.18 | 78 | 1.17 |
| Not reported | 164 | 2.25 | - | - | 125 | 22.08 | 39 | 0.59 |
| Cause of Death | Total | Males | Females | Unknown | ||||
| # | % | # | % | # | % | # | % | |
| Drowning | 29 | 42.65 | 21 | 30.88 | 8 | 11.76 | - | - |
| Poly-trauma | 16 | 23.53 | 14 | 20.59 | 2 | 2.94 | - | - |
| Electrocuted | 10 | 14.71 | 9 | 13.24 | 1 | 1.47 | - | - |
| Poly-trauma and Suffocation | 7 | 10.29 | 7 | 10.29 | - | - | - | - |
| Heart attack | 3 | 4.41 | 2 | 2.94 | 1 | 1.47 | - | - |
| Collapse | 1 | 1.47 | 1 | 1.47 | - | - | - | - |
| Hypothermia | 1 | 1.47 | 0 | 0.00 | 1 | 1.47 | - | - |
| Suffocation | 1 | 1.47 | 1 | 1.47 | - | - | - | - |
| Unknown | - | - | - | - | - | - | - | - |
| Type of Injury | Total | Males | Females | Unknown | ||||
| Contusion and abrasion | 108 | 19.08 | 43 | 7.60 | 13 | 2.30 | 52 | 9.19 |
| Shock | 58 | 10.25 | 17 | 3.00 | 9 | 1.59 | 32 | 5.65 |
| Contusion | 56 | 9.89 | 18 | 3.18 | 4 | 0.71 | 34 | 6.01 |
| Contusion and shock | 49 | 8.66 | 6 | 1.06 | 3 | 0.53 | 40 | 7.07 |
| Abrasion | 28 | 4.95 | 10 | 1.77 | 4 | 0.71 | 14 | 2.47 |
| Abrasion and shock | 28 | 4.95 | 11 | 1.94 | 15 | 2.65 | 2 | 0.35 |
| Burns and shock | 15 | 2.65 | 11 | 1.94 | 4 | 0.71 | - | - |
| Poly fractures | 12 | 2.12 | 10 | 1.77 | 1 | 0.18 | 1 | 0.18 |
| Cranial trauma | 11 | 1.94 | 9 | 1.59 | 2 | 0.35 | - | - |
| Wounded limbs and cranial trauma | 12 | 2.12 | 11 | 1.94 | - | - | 1 | 0.18 |
| Fractured limbs | 6 | 1.06 | 3 | 0.53 | 3 | 0.53 | - | - |
| Fainting | 4 | 0.71 | 2 | 0.35 | 2 | 0.35 | - | - |
| Thoracic trauma | 3 | 0.53 | 1 | 0.18 | 2 | 0.35 | - | - |
| Near drowning | 3 | 0.53 | 2 | 0.35 | 1 | 0.18 | - | - |
| Frozen | 1 | 0.18 | 1 | 0.18 | - | - | - | - |
| Unknown | 172 | 30.39 | 1 | 0.18 | - | - | - | - |
| Phenomenon | Hazardous Behavior | Fatalities | Injured | Involved |
|---|---|---|---|---|
| # | # | # | ||
| Flood | Fording rivers | 2 | 23 | |
| Staying on river banks | 2 | |||
| Trying to save vehicles | 3 | |||
| Enter/stay in floooded underpass | 121 | |||
| Landslide | Refuse evacuation | 10 | ||
| Windstorm | Refuse warnings | 1 | 2 | |
| Lightning | Under a tree during lightning | 3 | 2 | 4 |
| Storm surge | Check damage during the event | 1 | 1 | |
| Trying to save belongings | 1 | 5 | ||
| Total | 9 | 3 | 169 |
References
- Petrucci, O.; Polemio, M. The use of historical data for the characterisation of multiple damaging hydrogeological events. Nat. Hazards Earth Syst. Sci. 2003, 3, 17–30. [Google Scholar] [CrossRef]
- Caloiero, T.; Pasqua, A.A.; Petrucci, O. Damaging hydrogeological events: A procedure for the assessment of severity levels and an application to Calabria (Southern Italy). Water (Switzerland) 2014, 6, 3652–3670. [Google Scholar] [CrossRef]
- Aceto, L.; Caloiero, T.; Pasqua, A.A.; Petrucci, O. Analysis of damaging hydrogeological events in a Mediterranean region (Calabria). J. Hydrol. 2016, 541, 510–522. [Google Scholar] [CrossRef]
- Doocy, S.; Daniels, A.; Murray, S.; Kirsch, T.D. The Human Impact of Floods: A Historical Review of Events 1980–2009 and Systematic Literature Review. PLoS Curr. 2013. [Google Scholar] [CrossRef] [PubMed]
- Associated Programme on Flood Management. Selecting Measures and Designing Strategies for Integrated Flood Management; No. April; Associated Programme on Flood Management: Geneva, Switzerland, 2017. [Google Scholar]
- Kirschbaum, D.B.; Adler, R.; Hong, Y.; Hill, S.; Lerner-Lam, A. A global landslide catalog for hazard applications: Method, results, and limitations. Nat. Hazards 2010, 52, 561–575. [Google Scholar] [CrossRef]
- Aceto, L.; Pasqua, A.A.; Petrucci, O. Effects of damaging hydrogeological events on people throughout 15 years in a Mediterranean region. Adv. Geosci. 2017, 44, 67–77. [Google Scholar] [CrossRef]
- Petrucci, O.; Llasat, M.C. Impact of Disasters in Mediterranean Regions: An Overview in the Framework of the HYMEX Project. In Landslide Science and Practice; Springer: Berlin/Heidelberg, Germany, 2013; Volume 7. [Google Scholar]
- Alderman, K.; Turner, L.R.; Tong, S. Floods and human health: A systematic review. Environ. Int. 2012, 47, 37–47. [Google Scholar] [CrossRef] [PubMed]
- Ahern, M.; Kovats, R.S.; Wilkinson, P.; Few, R.; Matthies, F. Global health impacts of floods: Epidemiologic evidence. Epidemiol. Rev. 2005, 27, 36–46. [Google Scholar] [CrossRef] [PubMed]
- Onuma, H.; Shin, K.J.; Managi, S. Reduction of future disaster damages by learning from disaster experiences. Nat. Hazards 2017, 87, 1435–1452. [Google Scholar] [CrossRef]
- Badoux, A.; Andres, N.; Techel, F.; Hegg, C. Natural hazard fatalities in Switzerland from 1946 to 2015. Nat. Hazards Earth Syst. Sci. 2016, 16, 2747–2768. [Google Scholar] [CrossRef]
- Haynes, K.; Coates, L.; Dimer de Oliveira, F.; Gissing, A.; Bird, D.; van den Honert, R.; Radford, D.; D’Arcy, R.; Smith, C. An Analysis of Human Fatalities from Floods in Australia 1900–2015; Bushfire Cooperative Research Centre (Bushfire CRC): Melbourne, Australia, 2016. [Google Scholar]
- Diakakis, M.; Deligiannakis, G. Flood fatalities in Greece: 1970–2010. J. Flood Risk Manag. 2017, 10, 115–123. [Google Scholar] [CrossRef]
- Jonkman, S.N.; Kelman, I. An analysis of the causes and circumstances of flood disaster deaths. Disasters 2005, 29, 75–97. [Google Scholar] [CrossRef] [PubMed]
- Doocy, S.; Daniels, A.; Murray, S.; Kirsch, T.D. The Human Impact: A Historical Review of Events and Systematic Literature Review. PLOS Curr. Disasters 2013, 1, 1–32. [Google Scholar]
- Hajat, S.; Ebi, K.L.; Kovats, R.S.; Menne, B.; Edwards, S.; Haines, A. The human health consequences of flooding in Europe: A review. Extrem. Weather Events Public Health Responses 2005, 4, 185–196. [Google Scholar] [CrossRef]
- Coates, L. Flood fatalities in Australia, 1788–1996. Aust. Geogr. 1999, 30, 391–408. [Google Scholar] [CrossRef]
- Pereira, S.; Zêzere, J.L.; Quaresma, I.; Santos, P.P.; Santos, M. Mortality Patterns of Hydro-Geomorphologic Disasters. Risk Anal. 2016, 36, 1188–1210. [Google Scholar] [CrossRef] [PubMed]
- Salvati, P.; Petrucci, O.; Rossi, M.; Bianchi, C.; Pasqua, A.A.; Guzzetti, F. Science of the Total Environment Gender, age and circumstances analysis of flood and landslide fatalities in Italy. Sci. Total Environ. 2018, 610–611, 867–879. [Google Scholar] [CrossRef] [PubMed]
- Ashley, S.T.; Ashley, W.S. Flood fatalities in the United States. J. Appl. Meteorol. Climatol. 2008, 47, 805–818. [Google Scholar] [CrossRef]
- Fitzgerald, G.; Du, W.; Jamal, A.; Clark, M.; Hou, X.Y. Flood fatalities in contemporary Australia (1997–2008): Disaster medicine. EMA Emerg. Med. Australas. 2010, 22, 180–186. [Google Scholar] [CrossRef] [PubMed]
- Lee, K.E.; Myung, H.N.; Na, W.; Jang, J.Y. Socio-demographic characteristics and leading causes of death among the casualties of meteorological events compared with all-cause deaths in Korea, 2000–2011. J. Prev. Med. Public Health 2013, 46, 261–270. [Google Scholar] [CrossRef] [PubMed]
- Sharif, H.O.; Jackson, T.L.; Hossain, M.M.; Zane, D. Analysis of Flood Fatalities in Texas. Nat. Hazards Rev. 2014, 16. [Google Scholar] [CrossRef]
- Jonkman, S. Drowning; World Health Organization: Geneva, Switzerland, 2014. [Google Scholar]
- Peden, A.E.; Franklin, R.C.; Leggat, P.A. Fatal river drowning: The identification of research gaps through a systematic literature review. Inj. Prev. 2016, 22, 202–209. [Google Scholar] [CrossRef] [PubMed]
- Petley, D. Global patterns of loss of life from landslides. Geology 2012, 40, 927–930. [Google Scholar] [CrossRef]
- Evans, S.G. Fatal landslides and landslide risk in Canada. In Landslide Risk Assessment; ICE Virtual Library: London, UK, 1997; pp. 1–7. [Google Scholar]
- Wen, B.P.; Han, Z.Y.; Wang, A.J.; Wang, E.Z.; Zhang, J.M. Recent landslide disasters in China and lessons learned for landslide risk management. In Landslide Risk Assessment; Taylor and Francis Group: London, UK, 2005; pp. 427–434. [Google Scholar]
- Petley, D.N.; Hearn, G.J.; Hart, A.; Rosser, N.J.; Dunning, S.A.; Oven, K.; Mitchell, W.A. Trends in landslide occurrence in Nepal. Nat. Hazards 2007, 43, 23–44. [Google Scholar] [CrossRef]
- Dowling, C.A.; Santi, P.M. Debris flows and their toll on human life: A global analysis of debris-flow fatalities from 1950 to 2011. Nat. Hazards 2014, 71, 203–227. [Google Scholar] [CrossRef]
- Sepúlveda, S.A.; Petley, D.N. Regional trends and controlling factors of fatal landslides in Latin America and the Caribbean. Nat. Hazards Earth Syst. Sci. 2015, 15, 1821–1833. [Google Scholar] [CrossRef]
- Haque, U.; Blum, P.; da Silva, P.F.; Andersen, P.; Pilz, J.; Chalov, S.R.; Malet, J.P.; Auflič, M.J.; Andres, N.; Poyiadji, E.; et al. Fatal landslides in Europe. Landslides 2016, 13, 1545–1554. [Google Scholar] [CrossRef]
- Alcamo, J.; Olesen, J.E. Life in Europe Under Climate Change; Wiley-Blackwell: Chichester, UK, 2012. [Google Scholar]
- Barredo, J.I. No upward trend in normalised windstorm losses in Europe: 1970–2008. Nat. Hazards Earth Syst. Sci. 2010, 10, 97–104. [Google Scholar] [CrossRef]
- Changnon, S.A. Temporal and spatial distributions of wind storm damages in the United States. Clim. Chang. 2009, 94, 473–482. [Google Scholar] [CrossRef]
- Fengjin, X.; Ziniu, X. Characteristics of tropical cyclones in China and their impacts analysis. Nat. Hazards 2010, 54, 827–837. [Google Scholar] [CrossRef]
- Moore, T.W.; Dixon, R.W. Tropical cyclone-tornado casualties. Nat. Hazards 2012, 61, 621–634. [Google Scholar] [CrossRef]
- Holle, R.L. Annual Rates of Lightning Fatalities by Country. In Proceedings of the 20th International Lightning Detection Conference, Tucson, AZ, USA, 21–23 April 2008. [Google Scholar]
- Zhang, W.; Meng, Q.; Ma, M.; Zhang, Y. Lightning casualties and damages in China from 1997 to 2009. Nat. Hazards 2011, 57, 465–476. [Google Scholar] [CrossRef]
- Salerno, J.; Msalu, L.; Caro, T.; Borgerhoff Mulder, M. Risk of injury and death from lightning in Northern Malawi. Nat. Hazards 2012, 62, 853–862. [Google Scholar] [CrossRef]
- Monaco, C.; Tortorici, L. Active faulting in the Calabrian arc and eastern Sicily. J. Geodyn. 2000, 29, 407–424. [Google Scholar] [CrossRef]
- Petrucci, O.; Pasqua, A.A. Historical Climatology of Storm Events in the Mediterranean: A Case Study of Damaging Hydrological Events in Calabria, Southern Italy. In Storminess and Environmental Change; Springer: Dordrecht, The Netherlands, 2014; pp. 249–268. [Google Scholar]
- Raška, P.; Zábranský, V.; Dubišar, J.; Kadlec, A.; Hrbáčová, A.; Strnad, T. Documentary proxies and interdisciplinary research on historic geomorphologic hazards: A discussion of the current state from a central European perspective. Nat. Hazards 2014, 70, 705–732. [Google Scholar] [CrossRef]
- McGhee, G.; Marland, G.R.; Atkinson, J. Grounded theory research: Literature reviewing and reflexivity. J. Adv. Nurs. 2007, 60, 334–342. [Google Scholar] [CrossRef] [PubMed]
- Blong, R. A review of damage intensity scales. Nat. Hazards 2003, 29, 57–76. [Google Scholar] [CrossRef]
- Ali, A.M.S. September 2004 flood event in southwestern Bangladesh: A study of its nature, causes, and human perception and adjustments to a new hazard. Nat. Hazards 2007, 40, 89–111. [Google Scholar] [CrossRef]
- Vinet, F.; Lumbroso, D.; Defossez, S.; Boissier, L. A comparative analysis of the loss of life during two recent floods in France: The sea surge caused by the storm Xynthia and the flash flood in Var. Nat. Hazards 2012, 61, 1179–1201. [Google Scholar] [CrossRef]


| Reference | Period | Country | Fatalities # | Male % | Female % 1 | Affected Age (Years) |
|---|---|---|---|---|---|---|
| [18] | 1788–1996 | Australia | 2213 | 80 | 20 | <21; >70 |
| [21] | 1959–2005 | USA | 4586 | Majority | Minority | 10–19; >60 |
| [22] | 1997–2008 | Australia | 73 | 71.2 | 28.8 | 10–29; >70 |
| [23] | 1990–2008 | South Korea | 966 | Majority | Minority | - |
| [16] | 1980–2009 | World | 539,811 | - | - | - |
| [24] | 1959–2008 | Texas | 286 | 62.9 | 37.1 | <30 |
| [25] | 1975–2002 | World | 175,864 | - | - | - |
| [13] | 1900–2015 | Australia | 1859 | 79 | 21 | Children; <29 |
| [19] | 1865–2010 | Portugal | 1012 | 57.3 | 25.3 | - |
| [14] | 1970–2010 | Greece | 151 | 62.9 | 31.1 | >35 |
| [12] | 1946–2015 | Switzerland | 124 | 75 | 25 | 0–9 |
| [26] | 2002–2012 | Australia | 129 | 64 | 36 | 55–64 |
| [20] | 1965–2014 | Italy | 771 | 57.6 | 42.4 | 20–89 |
| Reference | Period | Region/Country | Landslides # | Fatalities # |
|---|---|---|---|---|
| [28] | 1840–1996 | Canada | 84 | 545 |
| [29] | 2001–2004 | China | 400 | 3000 |
| [30] | 1978–2005 | Nepal | 397 | 2179 |
| [28] | 2004–2010 | World | 2620 | 32,322 |
| [31] | 1950–2011 | World | 213 | 77,779 |
| [32] | 2004–2013 | Latin America, Caribbean | 611 | 11,631 |
| [19] | 1865–2010 | Portugal | 281 | 236 |
| [33] | 1995–2014 | Europe | 476 | 1370 |
| [12] | 1946–2015 | Switzerland | - | - |
| [20] | 1965–2014 | Italy | 405 | 1292 |
| Event Identification | |||
| Time of the Event | Type of Phenomenon | Victim Identification | Damage Severity |
| Year (YYYY) Month (MM) Day (DD) ID (YYYY, MM, DD, #) | Flood Urban flooding Landslide Rock fall Road collapse Windstorm Lightning Storm surge Others (hail, thunderstorm) | Name Surname Gender Age | Fatalities Injured Involved people |
| Victim-Event Interaction | |||
| Place | Condition | Activity | Dynamic |
| Indoor Public/private building Bungalow School Hotel Shop Outdoor Road Railway Riverbed/riverside Campsite/tent Underpass Beach Countryside Port Recreation area | Standing Laying By bicycle By motorcycle By car By bus By van By boat By caravan By tractor By truck By train | Working Traveling Sleeping Recreational activities Rescuing someone Fishing Going at home Going to work Housework Walking | Dragged by water/mud Hit by lightning Blocked in a flooded room Caught in a derailment Hit by landslide Hurled by wind Hit by objects broken by lightning Buried Fallen into the river Hit by object hurled by wind Swept away by sea waves Caught in a road/bridge collapse Caught in building collapse Fallen down a slope Surrounded by water/mud Hit by hail Blocked by landslide debris Blocked by object hurled by wind |
| Effects on People | |||
| Causes of Death | Types of Injuries | ||
| Drowning Poly-trauma Electrocuted Poly-trauma and suffocation Heart attack Collapse Hypothermia Suffocation | Contusion and abrasion Shock Contusion Contusion and shock Abrasion Abrasion and shock Burns and shock Poly fractures Cranial trauma Wounded limbs and cranial trauma Fractured limbs Fainting Thoracic trauma Near drowning Frozen | ||
| Variable | Value | |||||
| #PEO | 7288 | |||||
| #EV | 740 | |||||
| Average #PEO per event | 9.85 | |||||
| Average #PEO per year | 196.97 | |||||
| Variable | Fatalities | Injured | Involved | |||
| # | % | # | % | # | % | |
| #PEO | 68 | 0.93 | 566 | 7.77 | 6654 | 91.30 |
| #EV | 44 | 5.95 | 153 | 20.68 | 631 | 85.27 |
| Average #PEO per event | 1.55 | 3.70 | 10.55 | |||
| Average #PEO per year | 1.84 | 15.30 | 179.84 | |||
| Gender | ||||||
| Known cases | 68 | 100 | 295 | 52.12 | 578 | 8.69 |
| Unknown cases | 0 | - | 271 | 47.88 | 6076 | 91.31 |
| Reliability | Very high | Low | Very low | |||
| Age | ||||||
| Known cases | 65 | 95.59 | 240 | 42.40 | 1001 | 15.04 |
| Unknown cases | 3 | 4.41 | 326 | 57.60 | 5653 | 84.96 |
| Reliability | Very high | Low | Very low | |||
| Place | ||||||
| Known cases | 68 | 100 | 449 | 79.33 | 6615 | 99.41 |
| Unknown cases | 0 | - | 117 | 20.67 | 39 | 0.59 |
| Reliability | Very high | High | Very high | |||
| Condition | ||||||
| Known cases | 65 | 95.59 | 434 | 76.68 | 6430 | 96.63 |
| Unknown cases | 3 | 4.41 | 132 | 23.32 | 224 | 3.37 |
| Reliability | Very high | Medium | Very high | |||
| Activity | ||||||
| Known cases | 58 | 85.29 | 394 | 69.61 | 4342 | 65.25 |
| Unknown cases | 10 | 14.71 | 172 | 30.39 | 2312 | 34.75 |
| Reliability | High | Medium | Medium | |||
| Dynamic | ||||||
| Known cases | 68 | 100 | 441 | 77.92 | 6615 | 99.41 |
| Unknown cases | 0 | - | 125 | 22.08 | 39 | 0.59 |
| Reliability | Very high | Medium | Very high | |||
| Variable Reliability | (% unknown cases) | |||||
| Very high | 0–5% | |||||
| High | 5.1–20% | |||||
| Medium | 20.1–40% | |||||
| Low | 40.1–60% | |||||
| Very low | >60% | |||||
| Variable | Fatalities | Injured | Involved | ||||||||||||||||||||
|---|---|---|---|---|---|---|---|---|---|---|---|---|---|---|---|---|---|---|---|---|---|---|---|
| 68 | 566 | 6654 | |||||||||||||||||||||
| Total Known | Males | Females | Total Known | Males | Females | Unknown | Total Known | Males | Females | Unknown | |||||||||||||
| # | % | # | % | # | % | # | % | # | % | # | % | # | % | # | % | # | % | # | % | # | % | ||
| Known age | 65 | 95.59 | 53 | 77.94 | 12 | 17.65 | 240 | 42.40 | 134 | 23.67 | 72 | 12.72 | 34 | 6.01 | 1001 | 15.04 | 202 | 3.04 | 82 | 1.23 | 717 | 10.78 | |
| Known gender | 68 | 100.00 | 55 | 80.88 | 13 | 19.12 | 295 | 52.12 | 197 | 34.81 | 98 | 17.31 | 271 | 47.88 | 578 | 8.69 | 418 | 6.28 | 160 | 2.40 | 6076 | 91.31 | |
| Average age | 46.90 | 42.86 | 64.08 | 37.87 | 38.18 | 37.31 | - | - | 34.80 | 34.73 | 37.55 | 17.67 | |||||||||||
| Years | |||||||||||||||||||||||
| Child | 0–10 | 2 | 2.94 | 2 | 2.94 | - | - | 20 | 3.53 | 10 | 1.77 | 8 | 1.41 | 2 | 0.35 | 338 | 5.08 | 14 | 0.21 | 15 | 0.23 | 309 | 4.64 |
| Boy/girl | 11–18 | 5 | 7.35 | 5 | 7.35 | - | - | 16 | 2.83 | 8 | 1.41 | 8 | 1.41 | - | - | 274 | 4.12 | 9 | 0.14 | 1 | 0.02 | 264 | 3.97 |
| Young adult | 19–25 | 3 | 4.41 | 2 | 2.94 | 1 | 1.47 | 34 | 6.01 | 22 | 3.89 | 9 | 1.59 | 3 | 0.53 | 34 | 0.51 | 19 | 0.29 | 8 | 0.12 | 7 | 0.11 |
| Adult | 26–65 | 43 | 63.24 | 39 | 57.35 | 4 | 5.88 | 137 | 24.20 | 84 | 14.84 | 36 | 6.36 | 17 | 3.00 | 246 | 3.70 | 138 | 2.07 | 36 | 0.54 | 72 | 1.08 |
| Elderly | >65 | 12 | 17.65 | 5 | 7.35 | 7 | 10.29 | 33 | 5.83 | 10 | 1.77 | 11 | 1.94 | 12 | 2.12 | 109 | 1.64 | 22 | 0.33 | 22 | 0.33 | 65 | 0.98 |
| Unknown | Unknown | 3 | 4.41 | 2 | 2.94 | 1 | 1.47 | 326 | 57.60 | 63 | 11.13 | 26 | 4.59 | 237 | 41.87 | 5653 | 84.96 | 216 | 3.25 | 78 | 1.17 | 5359 | 80.54 |
| Phenomenon | Total People | Fatalities | Injured | Involved | ||||||||||||||||||||
|---|---|---|---|---|---|---|---|---|---|---|---|---|---|---|---|---|---|---|---|---|---|---|---|---|
| # Fatalities | Males | Females | # Injured | Males | Females | Unknown | # Involved | Males | Females | Unknown | ||||||||||||||
| # | % | # | % | # | % | # | % | # | % | # | % | # | % | # | % | # | % | # | % | # | % | # | % | |
| Flood | 2304 | 31.61 | 26 | 38.24 | 17 | 25.00 | 9 | 13.24 | 194 | 34.28 | 48 | 8.48 | 42 | 7.42 | 104 | 18.37 | 2084 | 31.32 | 126 | 1.89 | 60 | 0.90 | 1898 | 28.52 |
| Urban flooding | 1974 | 27.09 | 1 | 1.47 | - | - | 1 | 1.47 | 12 | 2.12 | 3 | 0.53 | 3 | 0.53 | 6 | 1.06 | 1961 | 29.47 | 63 | 0.95 | 38 | 0.57 | 1860 | 27.95 |
| Landslide | 2142 | 29.39 | 15 | 22.06 | 15 | 22.06 | - | - | 178 | 31.45 | 64 | 11.31 | 26 | 4.59 | 88 | 15.55 | 1949 | 29.29 | 127 | 1.91 | 41 | 0.62 | 1781 | 26.77 |
| Rock fall | 55 | 0.75 | 1 | 1.47 | 1 | 1.47 | - | - | 5 | 0.88 | 2 | 0.35 | 1 | 0.18 | 2 | 0.35 | 49 | 0.74 | 11 | 0.17 | 4 | 0.06 | 34 | 0.51 |
| Road collapse | 112 | 1.54 | 1 | 1.47 | 1 | 1.47 | - | - | 16 | 2.83 | 16 | 2.83 | - | - | - | - | 95 | 1.43 | 19 | 0.29 | - | - | 76 | 1.14 |
| Windstorm | 361 | 4.95 | 9 | 13.24 | 7 | 10.29 | 2 | 2.94 | 93 | 16.43 | 31 | 5.48 | 11 | 1.94 | 51 | 9.01 | 259 | 3.89 | 40 | 0.60 | 6 | 0.09 | 213 | 3.20 |
| Lightning | 86 | 1.18 | 10 | 14.71 | 9 | 13.24 | 1 | 1.47 | 32 | 5.65 | 24 | 4.24 | 8 | 1.41 | - | - | 44 | 0.66 | 4 | 0.06 | 2 | 0.03 | 38 | 0.57 |
| Storm surge | 115 | 1.58 | 5 | 7.35 | 5 | 7.35 | - | - | 18 | 3.18 | 6 | 1.06 | 6 | 1.06 | 6 | 1.06 | 92 | 1.38 | 27 | 0.41 | 9 | 0.14 | 56 | 0.84 |
| Others (hail, thunderstorm) | 139 | 1.91 | - | - | - | - | - | - | 18 | 3.18 | 3 | 0.53 | 1 | 0.18 | 14 | 2.47 | 121 | 1.82 | 1 | 0.02 | - | - | 120 | 1.80 |
| Fatalities | |||||||||||||||||||||
| Total Fatalities | Flood | Urban Flooding | Landslide | Rock Fall | Road Collapse | Windstorm | Lightning | Storm Surge | Others (Hail, Thunderstorm) | ||||||||||||
| # | % | # | % | # | % | # | % | # | % | # | % | # | % | # | % | # | % | # | % | ||
| 18 | 26.47 | Indoor | Bungalow | 11 | 16.18 | 0 | - | 0 | - | 0 | - | 0 | - | 0 | - | 0 | - | 0 | - | 0 | - |
| Hotel | 0 | - | 0 | - | 0 | - | 0 | - | 0 | - | 0 | - | 0 | - | 0 | - | 0 | - | |||
| Public/private building | 0 | - | 1 | 1.47 | 1 | 1.47 | 0 | - | 0 | - | 2 | 2.94 | 2 | 2.94 | 1 | 1.47 | 0 | - | |||
| 50 | 73.53 | Outdoor | Road/Bridge/Street | 8 | 11.76 | 0 | - | 7 | 10.29 | 1 | 1.47 | 1 | 1.47 | 4 | 5.88 | 0 | - | 0 | - | 0 | - |
| Countryside | 2 | 2.94 | 0 | - | 2 | 2.94 | 0 | - | 0 | - | 1 | 1.47 | 7 | 10.29 | 0 | - | 0 | - | |||
| Railway | 0 | - | 0 | - | 4 | 5.88 | 0 | - | 0 | - | 1 | 1.47 | 0 | - | 0 | - | 0 | - | |||
| Riverbed/riverside | 4 | 5.88 | 0 | - | 1 | 1.47 | 0 | - | 0 | - | 0 | - | 0 | - | 0 | - | 0 | - | |||
| Beach | 0 | - | 0 | - | 0 | - | 0 | - | 0 | - | 0 | - | 0 | - | 3 | 4.41 | 0 | - | |||
| Campsite/tent | 1 | 1.47 | 0 | - | 0 | - | 0 | - | 0 | - | 1 | 1.47 | 0 | - | 0 | - | 0 | - | |||
| Port | 0 | - | 0 | - | 0 | - | 0 | - | 0 | - | 0 | - | 0 | - | 1 | 1.47 | 0 | - | |||
| Recreation area | 0 | - | 0 | - | 0 | - | 0 | - | 0 | - | 0 | - | 1 | 1.47 | 0 | - | 0 | - | |||
| Not reported | 0 | - | 0 | - | 0 | - | 0 | - | 0 | - | 0 | - | 0 | - | 0 | - | 0 | - | |||
| Injured | |||||||||||||||||||||
| Total Injured | Flood | Urban Flooding | Landslide | Rock Fall | Road Collapse | Windstorm | Lightning | Storm Surge | Others (Hail, Thunderstorm) | ||||||||||||
| # | % | # | % | # | % | # | % | # | % | # | % | # | % | # | % | # | % | # | % | ||
| 118 | 20.85 | Indoor | Bungalow | 46 | 8.13 | 0 | - | 0 | - | 0 | - | 0 | - | 0 | - | 0 | - | 0 | - | 0 | - |
| Hotel | 20 | 3.53 | 1 | 0.18 | 0 | - | 0 | - | 0 | - | 0 | - | 0 | - | 0 | - | 0 | - | |||
| Public/private building | 14 | 2.47 | 4 | 0.71 | 13 | 2.30 | 2 | 0.35 | 0 | - | 8 | 1.41 | 8 | 1.41 | 2 | 0.35 | 0 | - | |||
| 331 | 58.48 | Outdoor | Road/Bridge/Street | 15 | 2.65 | 6 | 1.06 | 79 | 13.96 | 2 | 0.35 | 15 | 2.65 | 53 | 9.36 | 4 | 0.71 | 4 | 0.71 | 5 | 0.88 |
| Countryside | 1 | 0.18 | 0 | - | 3 | 0.53 | 0 | - | 0 | - | 5 | 0.88 | 6 | 1.06 | 0 | - | 2 | 0.35 | |||
| Railway | 0 | - | 0 | - | 81 | 14.31 | 0 | - | 0 | - | 2 | 0.35 | 0 | - | 0 | - | 0 | - | |||
| Riverbed/riverside | 2 | 0.35 | 0 | - | 1 | 0.18 | 0 | - | 1 | 0.18 | 0 | - | 0 | - | 0 | - | 0 | - | |||
| Beach | 0 | - | 0 | - | 1 | 0.18 | 1 | 0.18 | 0 | - | 8 | 1.41 | 1 | 0.18 | 10 | 1.77 | 0 | - | |||
| Campsite/tent | 1 | 0.18 | 0 | - | 0 | - | 0 | - | 0 | - | 8 | 1.41 | 0 | - | 0 | - | 0 | - | |||
| Port | 0 | - | 0 | - | 0 | - | 0 | - | 0 | - | 0 | - | 0 | - | 2 | 0.35 | 0 | - | |||
| Recreation area | 0 | - | 0 | - | 0 | - | 0 | - | 0 | - | 0 | - | 12 | 2.12 | 0 | - | 0 | - | |||
| 117 | 20.67 | Not reported | 95 | 16.78 | 1 | 0.18 | 0 | - | 0 | - | 0 | - | 9 | 1.59 | 1 | 0.18 | 0 | - | 11 | 1.94 | |
| Involved | |||||||||||||||||||||
| Total Involved | Flood | Urban Flooding | Landslide | Rock Fall | Road Collapse | Windstorm | Lightning | Storm Surge | Others (Hail, Thunderstorm) | ||||||||||||
| # | % | # | % | # | % | # | % | # | % | # | % | # | % | # | % | # | % | # | % | ||
| 3404 | 51.16 | Indoor | Bungalow | 13 | 0.20 | 0 | - | 0 | - | 0 | - | 0 | - | 0 | - | 0 | - | 0 | - | 0 | - |
| Hotel | 140 | 2.10 | 0 | - | 1 | 0.02 | 0 | - | 0 | - | 0 | - | 0 | - | 0 | - | 0 | - | |||
| Public/private building | 1568 | 23.56 | 692 | 10.40 | 677 | 10.17 | 4 | 0.06 | 0 | - | 49 | 0.74 | 32 | 0.48 | 40 | 0.60 | 8 | 0.12 | |||
| School | 0 | - | 160 | 2.40 | 0 | - | 0 | - | 0 | - | 0 | - | 0 | - | 0 | - | 0 | - | |||
| Shop | 0 | - | 0 | - | 0 | - | 0 | - | 0 | - | 0 | - | 0 | - | 20 | 0.30 | 0 | - | |||
| 3211 | 48.26 | Outdoor | Road/Bridge/Street | 249 | 3.74 | 884 | 13.29 | 719 | 10.81 | 39 | 0.59 | 95 | 1.43 | 207 | 3.11 | 8 | 0.12 | 6 | 0.09 | 109 | 1.64 |
| Countryside | 20 | 0.30 | 0 | - | 93 | 1.40 | 0 | - | 0 | - | 2 | 0.03 | 2 | 0.03 | 0 | - | 4 | 0.06 | |||
| Railway | 0 | - | 0 | - | 438 | 6.58 | 0 | - | 0 | - | 1 | 0.02 | 0 | - | 0 | - | 0 | - | |||
| Riverbed/riverside | 37 | 0.56 | 0 | - | 3 | 0.05 | 0 | - | 0 | - | 0 | - | 0 | - | 0 | - | 0 | - | |||
| Beach | 0 | - | 0 | - | 0 | - | 6 | 0.09 | 0 | - | 0 | - | 0 | - | 19 | 0.29 | 0 | - | |||
| Campsite/tent | 25 | 0.38 | 100 | 1.50 | 0 | - | 0 | - | 0 | - | 0 | - | 0 | - | 0 | - | 0 | - | |||
| Port | 0 | - | 0 | - | 0 | - | 0 | - | 0 | - | 0 | - | 0 | - | 4 | 0.06 | 0 | - | |||
| Recreation area | 0 | - | 0 | - | 0 | - | 0 | - | 0 | - | 0 | - | 2 | 0.03 | 2 | 0.03 | 0 | - | |||
| Underpass/Tunnel | 0 | - | 121 | 1.82 | 16 | 0.24 | 0 | - | 0 | - | 0 | - | 0 | - | 0 | - | 0 | - | |||
| 39 | 0.59 | Not reported | 32 | 0.48 | 4 | 0.06 | 2 | 0.03 | 0 | - | 0 | - | 0 | - | 0 | - | 1 | 0.02 | 0 | - | |
| Cause of Death | Flood | Urban Flooding | Landslide | Rock Fall | Road Collapse | Windstorm | Lightning | Storm Surge | Others (Hail, Thunderstorm) | |||||||||
| # | % | # | % | # | % | # | % | # | % | # | % | # | % | # | % | # | % | |
| Total | 26 | 38.2 | 1 | 1.47 | 15 | 22.06 | 1 | 1.47 | 1 | 1.47 | 9 | 13.2 | 10 | 14.7 | 5 | 7.35 | 0 | 0 |
| Drowning | 24 | 35.29 | 0 | - | 1 | 1.47 | 0 | - | 0 | - | 0 | - | 0 | - | 4 | 5.88 | 0 | - |
| Poly-trauma | 0 | - | 0 | - | 6 | 8.82 | 1 | 1.47 | 1 | 1.47 | 8 | 11.76 | 0 | - | 0 | - | 0 | - |
| Electrocuted | 0 | - | 0 | - | 0 | - | 0 | - | 0 | - | 0 | - | 10 | 14.71 | 0 | - | 0 | - |
| Poly-trauma and Suffocation | 0 | - | 0 | - | 7 | 10.29 | 0 | - | 0 | - | 0 | - | 0 | - | 0 | - | 0 | - |
| Heart attack | 0 | - | 1 | 1.47 | 0 | - | 0 | - | 0 | - | 1 | 1.47 | 0 | - | 1 | 1.47 | 0 | - |
| Collapse | 1 | 1.47 | 0 | - | 0 | - | 0 | 0 | - | 0 | - | 0 | - | 0 | - | 0 | - | |
| Hypothermia | 1 | 1.47 | 0 | - | 0 | - | 0 | - | 0 | - | 0 | - | 0 | - | 0 | - | 0 | - |
| Suffocation | 0 | - | 0 | - | 1 | 1.47 | 0 | - | 0 | - | 0 | - | 0 | - | 0 | - | 0 | - |
| Unknown | 0 | - | 0 | - | 0 | - | 0 | - | 0 | - | 0 | - | 0 | - | 0 | - | 0 | - |
| Type of Injury | Flood | Urban Flooding | Landslide | Rock Fall | Road Collapse | Windstorm | Lightning | Storm Surge | Others (Hail, Thunderstorm) | |||||||||
| # | % | # | % | # | % | # | % | # | % | # | % | # | % | # | % | # | % | |
| Total | 194 | 34.3 | 12 | 2.12 | 178 | 31.45 | 5 | 0.88 | 16 | 2.83 | 93 | 16.4 | 32 | 5.65 | 18 | 3.18 | 18 | 3.18 |
| Contusion and abrasion | 5 | 0.88 | 0 | - | 45 | 7.95 | 0 | - | 1 | 0.18 | 49 | 8.66 | 0 | - | 7 | 1.24 | 1 | 0.18 |
| Shock | 14 | 2.47 | 9 | 1.59 | 22 | 3.89 | 0 | - | 0 | - | 0 | - | 13 | 2.30 | 0 | - | 0 | - |
| Contusion | 0 | - | 0 | - | 29 | 5.12 | 4 | 0.71 | 1 | 0.18 | 18 | 3.18 | 1 | 0.18 | 0 | - | 3 | 0.53 |
| Contusion and shock | 6 | 1.06 | 0 | - | 27 | 4.77 | 0 | - | 1 | 0.18 | 11 | 1.94 | 0 | - | 4 | 0.71 | 0 | - |
| Abrasion | 2 | 0.35 | 0 | - | 6 | 1.06 | 0 | - | 6 | 1.06 | 1 | 0.18 | 0 | - | 0 | - | 13 | 2.30 |
| Abrasion and shock | 1 | 0.18 | 1 | 0.18 | 22 | 3.89 | 0 | - | 3 | 0.53 | 0 | - | 0 | - | 1 | 0.18 | 0 | - |
| Burns and shock | 0 | - | 0 | - | 0 | - | 0 | - | 0 | - | 0 | - | 15 | 2.65 | 0 | - | 0 | - |
| Poly fractures | 2 | 0.35 | 1 | 0.18 | 7 | 1.24 | 0 | - | 0 | - | 2 | 0.35 | 0 | - | 0 | - | 0 | - |
| Cranial trauma | 0 | - | 1 | 0.18 | 2 | 0.35 | 0 | - | 1 | 0.18 | 7 | 1.24 | 0 | - | 0 | - | 0 | - |
| Wounded limbs and cranial trauma | 0 | - | 0 | - | 6 | 1.06 | 0 | - | 3 | 0.53 | 2 | 0.35 | 1 | 0.18 | 0 | - | 0 | - |
| Fractured limbs | 0 | - | 0 | - | 4 | 0.71 | 0 | - | 0 | - | 1 | 0.18 | 1 | 0.18 | 0 | - | 0 | - |
| Fainting | 1 | 0.18 | 0 | - | 0 | - | 0 | - | 0 | - | 1 | 0.18 | 0 | - | 2 | 0.35 | 0 | - |
| Thoracic trauma | 0 | - | 0 | - | 1 | 0.18 | 1 | 0.18 | 0 | - | 0 | - | 1 | 0.18 | 0 | - | 0 | - |
| Near drowning | 0 | - | 0 | - | 0 | - | 0 | - | 0 | - | 0 | - | 0 | - | 3 | 0.53 | 0 | - |
| Frozen | 0 | - | 0 | - | 0 | - | 0 | - | 0 | - | 0 | - | 0 | - | 0 | - | 1 | 0.18 |
| Unknown | 163 | 28.80 | 0 | - | 7 | 1.24 | 0 | - | 0 | - | 1 | 0.18 | 0 | - | 1 | 0.18 | 0 | - |
| Fatalities | Injured | Involved | ||||||||||||||||||||
| Hazardous Behavior | Total | Males | Females | Total | Males | Females | Unknown | Total | Males | Females | Unknown | |||||||||||
| # | % | # | % | # | % | # | % | # | % | # | % | # | % | # | % | # | % | # | % | # | % | |
| Under a tree during lightning | 3 | 4.41 | 3 | 4.41 | 0 | - | 2 | 0.35 | 1 | 0.18 | 1 | 0.18 | 0 | - | 4 | 0.06 | 3 | 0.05 | 1 | 0.02 | 0 | - |
| Fording rivers | 2 | 2.94 | 2 | 2.94 | 0 | - | 0 | - | 0 | - | 0 | - | 0 | - | 23 | 0.35 | 9 | 0.14 | 6 | 0.09 | 8 | 0.12 |
| Check damage during the event | 1 | 1.47 | 1 | 1.47 | 0 | - | 0 | - | 0 | - | 0 | - | 0 | - | 1 | 0.02 | 0 | - | 1 | 0.02 | 0 | - |
| Staying on river banks | 2 | 2.94 | 2 | 2.94 | 0 | - | 0 | - | 0 | - | 0 | - | 0 | - | 0 | - | 0 | - | 0 | - | 0 | - |
| Trying to save belongings | 1 | 1.47 | 1 | 1.47 | 0 | - | 0 | - | 0 | - | 0 | - | 0 | - | 5 | 0.08 | 4 | 0.06 | 1 | 0.02 | 0 | - |
| Refuse evacuation | 0 | - | 0 | - | 0 | - | 0 | - | 0 | - | 0 | - | 0 | - | 10 | 0.15 | 1 | 0.02 | 1 | 0.02 | 8 | 0.12 |
| Refuse warnings | 0 | - | 0 | - | 0 | - | 1 | 0.18 | 1 | 0.18 | 0 | - | 0 | - | 2 | 0.03 | 2 | 0.03 | 0 | - | 0 | - |
| Trying to save vehicles | 0 | - | 0 | - | 0 | - | 0 | - | 0 | - | 0 | - | 0 | - | 3 | 0.05 | 3 | 0.05 | 0 | - | 0 | - |
| Enter in a floooded underpass | 0 | - | 0 | - | 0 | - | 0 | - | 0 | - | 0 | - | 0 | - | 121 | 1.82 | 19 | 0.29 | 3 | 0.05 | 99 | 1.49 |
| Not reported | 59 | 86.76 | 46 | 67.65 | 13 | 19.12 | 563 | 99.47 | 195 | 34.45 | 97 | 17.14 | 271 | 47.88 | 6485 | 97.46 | 377 | 5.67 | 147 | 2.21 | 5961 | 89.59 |
| Protective Behavior | Total | Males | Females | Total | Males | Females | Unknown | Total | Males | Females | Unknown | |||||||||||
| Rescuing someone | 4 | 5.88 | 3 | 4.41 | 1 | 1.47 | 5 | 0.88 | 4 | 0.71 | 1 | 0.18 | 0 | - | 41 | 0.62 | 35 | 0.53 | 1 | 0.02 | 5 | 0.08 |
| Climbing trees | 2 | 2.94 | 2 | 2.94 | 0 | - | 3 | 0.53 | 2 | 0.35 | 1 | 0.18 | 0 | - | 0 | - | 0 | - | 0 | - | 0 | - |
| Grabbing on to someone/something | 2 | 2.94 | 1 | 1.47 | 1 | 1.47 | 5 | 0.88 | 3 | 0.53 | 2 | 0.35 | 0 | - | 6 | 0.09 | 5 | 0.08 | 1 | 0.02 | 0 | - |
| Getting on the car roof | 1 | 1.47 | 1 | 1.47 | 0 | - | 0 | - | 0 | - | 0 | - | 0 | - | 21 | 0.32 | 3 | 0.05 | 1 | 0.02 | 17 | 0.26 |
| Break strustures to allow flood streaming | 0 | - | 0 | - | 0 | - | 0 | - | 0 | - | 0 | - | 0 | - | 1 | 0.02 | 0 | - | 1 | 0.02 | 0 | - |
| Building a temporary dam | 0 | - | 0 | - | 0 | - | 0 | - | 0 | - | 0 | - | 0 | - | 36 | 0.54 | 4 | 0.06 | 2 | 0.03 | 30 | 0.45 |
| Driving to avoid danger | 0 | - | 0 | - | 0 | - | 5 | 0.88 | 2 | 0.35 | 1 | 0.18 | 2 | 0.35 | 45 | 0.68 | 23 | 0.35 | 0 | - | 22 | 0.33 |
| Getting on roof/upper floor | 0 | - | 0 | - | 0 | - | 10 | 1.77 | 3 | 0.53 | 3 | 0.53 | 4 | 0.71 | 1114 | 16.74 | 13 | 0.20 | 14 | 0.21 | 1087 | 16.34 |
| Getting out of buildings | 0 | - | 0 | - | 0 | - | 1 | 0.18 | 0 | - | 1 | 0.18 | 0 | - | 134 | 2.01 | 4 | 0.06 | 3 | 0.05 | 127 | 1.91 |
| Getting out of cars/train | 0 | - | 0 | - | 0 | - | 33 | 5.83 | 2 | 0.35 | 0 | - | 31 | 5.48 | 138 | 2.07 | 20 | 0.30 | 5 | 0.08 | 113 | 1.70 |
| Moving to safer place | 0 | - | 0 | - | 0 | - | 2 | 0.35 | 0 | - | 1 | 0.18 | 1 | 0.18 | 584 | 8.78 | 22 | 0.33 | 13 | 0.20 | 549 | 8.25 |
| Swimming/Swimming in flooded rooms | 0 | - | 0 | - | 0 | - | 6 | 1.06 | 4 | 0.71 | 2 | 0.35 | 0 | - | 10 | 0.15 | 6 | 0.09 | 2 | 0.03 | 2 | 0.03 |
| To use a track to save people | 0 | - | 0 | - | 0 | - | 0 | - | 0 | - | 0 | - | 0 | - | 8 | 0.12 | 4 | 0.06 | 0 | - | 4 | 0.06 |
| Not reported | 59 | 86.76 | 48 | 70.59 | 11 | 16.18 | 496 | 87.63 | 177 | 31.27 | 86 | 15.19 | 233 | 41.17 | 4516 | 67.87 | 279 | 4.19 | 117 | 1.76 | 4120 | 61.92 |
| Phenomenon | Protective Behavior | Fatalities | Injured | Involved | Total |
|---|---|---|---|---|---|
| # | # | # | # | ||
| Flood | Rescuing someone | 4 | 4 | 17 | 25 |
| Urban flooding | 7 | 7 | |||
| Landslide | 10 | 10 | |||
| Windstorm | 3 | 3 | |||
| Storm surge | 1 | 4 | 5 | ||
| Flood | Getting out of buildings | 1 | 39 | 40 | |
| Urban flooding | 49 | 49 | |||
| Landslide | 24 | 24 | |||
| Storm surge | 20 | 20 | |||
| Others | 2 | 2 | |||
| Flood | Getting out of cars/train | 22 | 22 | ||
| Urban flooding | 32 | 32 | |||
| Landslide | 33 | 65 | 98 | ||
| Road collapse | 17 | 17 | |||
| Storm surge | 2 | 2 | |||
| Landslide | Driving to avoid danger | 5 | 29 | 34 | |
| Rock fall | 7 | 7 | |||
| Road collapse | 6 | 6 | |||
| Windstorm | 1 | 1 | |||
| Lightning | 1 | 1 | |||
| Others | 1 | 1 | |||
| Flood | Moving to safer place | 1 | 45 | 46 | |
| Urban flooding | 2 | 2 | |||
| Landslide | 1 | 514 | 515 | ||
| Rock fall | 2 | 2 | |||
| Windstorm | 17 | 17 | |||
| Others | 4 | 4 | |||
| Flood | Getting on the car roof | 1 | 4 | 5 | |
| Urban flooding | 17 | 17 | |||
| Flood | Getting on roof/upper floor | 10 | 1036 | 1046 | |
| Urban flooding | 70 | 70 | |||
| Landslide | 8 | 8 | |||
| Flood | Grabbing on to someone/something | 2 | 2 | 4 | 8 |
| Landslide | 3 | 1 | 4 | ||
| Storm surge | 1 | 1 | |||
| Flood | To use a track to save people | 2 | 2 | ||
| Urban flooding | 5 | 5 | |||
| Storm surge | 1 | 1 | |||
| Flood | Climbing trees | 2 | 3 | 5 | |
| Flood | Break structures to allow flood streaming | 1 | 1 | ||
| Flood | Building a temporary dam | 25 | 25 | ||
| Urban flooding | 7 | 7 | |||
| Landslide | 4 | 4 | |||
| Flood | Swimming (in flooded rooms or grabbed to something) | 5 | 4 | 9 | |
| Urban flooding | 3 | 3 | |||
| Landslide | 1 | 3 | 4 | ||
| Total | 9 | 70 | 2138 | 2217 |
© 2017 by the authors. Licensee MDPI, Basel, Switzerland. This article is an open access article distributed under the terms and conditions of the Creative Commons Attribution (CC BY) license (http://creativecommons.org/licenses/by/4.0/).
Share and Cite
Petrucci, O.; Salvati, P.; Aceto, L.; Bianchi, C.; Pasqua, A.A.; Rossi, M.; Guzzetti, F. The Vulnerability of People to Damaging Hydrogeological Events in the Calabria Region (Southern Italy). Int. J. Environ. Res. Public Health 2018, 15, 48. https://doi.org/10.3390/ijerph15010048
Petrucci O, Salvati P, Aceto L, Bianchi C, Pasqua AA, Rossi M, Guzzetti F. The Vulnerability of People to Damaging Hydrogeological Events in the Calabria Region (Southern Italy). International Journal of Environmental Research and Public Health. 2018; 15(1):48. https://doi.org/10.3390/ijerph15010048
Chicago/Turabian StylePetrucci, Olga, Paola Salvati, Luigi Aceto, Cinzia Bianchi, Angela Aurora Pasqua, Mauro Rossi, and Fausto Guzzetti. 2018. "The Vulnerability of People to Damaging Hydrogeological Events in the Calabria Region (Southern Italy)" International Journal of Environmental Research and Public Health 15, no. 1: 48. https://doi.org/10.3390/ijerph15010048
APA StylePetrucci, O., Salvati, P., Aceto, L., Bianchi, C., Pasqua, A. A., Rossi, M., & Guzzetti, F. (2018). The Vulnerability of People to Damaging Hydrogeological Events in the Calabria Region (Southern Italy). International Journal of Environmental Research and Public Health, 15(1), 48. https://doi.org/10.3390/ijerph15010048