Influence Factors on Injury Severity of Traffic Accidents and Differences in Urban Functional Zones: The Empirical Analysis of Beijing


Abstract
:1. Introduction
2. Literature Review
2.1. Analysis of Traffic Accidents in Beijing
2.2. Influence Factors on Traffic Accidents
3. Data
4. Methods
4.1. Pearson’s Chi-Squared Test
4.2. Binary Logistic Regression Analysis
4.3. Classification and Regression Tree Analysis
5. Findings
5.1. Pearson’s Chi-Squared Test
5.1.1. Whole City
5.1.2. Zone 1–4
5.2. Binary Logistic Regression Analysis
5.2.1. Whole City
5.2.2. Zone 1–4
5.3. Classification and Regression Tree Analysis
5.3.1. Whole City
5.3.2. Zone 1
5.3.3. Zone 2
5.3.4. Zone 3
5.3.5. Zone 4
6. Discussion
6.1. Consistence Analysis of BLR and CART
6.2. Comparative Analysis of Influencing Factors
6.2.1. Accident Type
6.2.2. Time Interval
6.2.3. Cross-section Position
6.2.4. Physical Isolation Facility
6.2.5. Road Type
6.2.6. Signal Control Mode
6.2.7. Visibility
6.2.8. Lighting Condition
6.3. Comparative Analysis of Urban Functional Zone
6.3.1. Whole City
6.3.2. Zone 1
6.3.3. Zone 2
6.3.4. Zone 3
6.3.5. Zone 4
7. Conclusions
Author Contributions
Funding
Acknowledgments
Conflicts of Interest
References
- World Health Organization. Global Status Report on Road Safety; WHO Press: Geneva, Switzerland, 2015; p. 2. ISBN 9789241565066. [Google Scholar]
- National Bureau of Statistics. China Statistical Yearbook; 2016. Available online: http://www.stats.gov.cn/tjsj/ndsj/2016/indexch.htm (accessed on 15 June 2017).
- Beijing Municipal Bureau of Statistics, NBS Survey Office in Beijing. Beijing Statistical Yearbook. 2016. Available online: http://www.bjstats.gov.cn/nj/main/2016-tjnj/zk/indexeh.htm (accessed on 15 June 2017).
- Beijing Municipal Bureau of Statistics, NBS Survey Office in Beijing. Beijing Regional Statistical Yearbook. 2016. Available online: http://www.bjstats.gov.cn/nj/qxnj/2016/zk/indexch.htm (accessed on 15 June 2017).
- Yan, X.; Ma, M.; Huang, H.; Abdel-Aty, M.; Wu, C. Motor vehicle-bicycle crashes in Beijing: Irregular maneuvers, crash patterns, and injury severity. Accid. Anal. Prev. 2011, 43, 1751–1758. [Google Scholar] [CrossRef] [PubMed]
- Zhao, H.; Yang, G.; Zhu, F.; Jin, X.; Begeman, P.; Yin, Z.; Yang, K.; Wang, Z. An investigation on the head injuries of adult pedestrians by passenger cars in China. Traffic Inj. Prev. 2013, 14, 712–717. [Google Scholar] [CrossRef] [PubMed]
- Qiu, C.; Wang, C.; Fang, B.; Zuo, X. A multi-objective particle swarm optimization-based partial classification for accident severity analysis. Appl. Artif. Intell. 2014, 28, 555–576. [Google Scholar]
- Li, R.; Guo, M. Competing risks analysis on traffic accident duration time. J. Adv. Transp. 2015, 49, 402–415. [Google Scholar] [CrossRef]
- Yuan, Q.; Chen, H. Factor comparison of passenger-vehicle to vulnerable road user crashes in Beijing, China. Int. J. Crashworthiness 2017, 22, 260–270. [Google Scholar] [CrossRef]
- Šliupas, T. The impact of road parameters and the surrounding area on traffic accidents. Transport 2009, 24, 42–47. [Google Scholar] [CrossRef]
- Miškinis, P.; Valuntaite, V. Mathematical simulation of the correlation between the frequency of road traffic accidents and driving experience. Transport 2010, 25, 237–243. [Google Scholar] [CrossRef]
- Kunt, M.; Aghayan, I.; Noii, N. Prediction for traffic accident severity: Comparing the artificial neural network, genetic algorithm, combined genetic algorithm and pattern search methods. Transport 2011, 26, 353–366. [Google Scholar] [CrossRef]
- Beak, T.; Lim, J.; Park, B. Relations between operational method and traffic accident of circular intersection in Korea. KSCE J. Civ. Eng. 2015, 19, 1097–1107. [Google Scholar] [CrossRef]
- Ivan, K.; Haidu, I.; Benedek, J.; Ciobanu, S. Identification of traffic accident risk-prone areas under low lighting conditions. Nat. Hazards Earth Syst. Sci. 2015, 15, 191–197. [Google Scholar] [CrossRef]
- Lu, J.; Xing, Y.; Wang, C.; Cai, X. Risk factors affecting the severity of traffic accidents at Shanghai river-crossing tunnel. Traffic Inj. Prev. 2016, 17, 176–180. [Google Scholar] [CrossRef] [PubMed]
- Yip, T. Port traffic risks—A study of accidents in Hong Kong waters. Transp. Res. Part E 2008, 44, 921–931. [Google Scholar] [CrossRef]
- Chan, C.; Huang, B.; Yan, X.; Richards, S. Investigating effects of asphalt pavement conditions on traffic accidents in Tennessee based on the pavement management system (PMS). J. Adv. Transp. 2010, 44, 150–161. [Google Scholar] [CrossRef]
- Lee, J.; Chung, J.; Son, B. Analysis of traffic accident size for Korean highway using structural equation models. Accid. Anal. Prev. 2008, 40, 1955–1963. [Google Scholar] [CrossRef] [PubMed]
- Ferreira, S.; Couto, A. Traffic flow-accidents relationship for urban intersections on the basis of the translog function. Saf. Sci. 2013, 60, 115–122. [Google Scholar] [CrossRef]
- Hong, K.; Lee, K.; Jang, S. Incidence and related factors of traffic accidents among the older population in a rapidly aging society. Arch. Gerontol. Geriatr. 2015, 60, 471. [Google Scholar] [CrossRef] [PubMed]
- Bucchi, A.; Sangiorgi, C.; Vignali, V. Traffic psychology and driver behavior. In Proceedings of the 5th International Congress on Sustainability of Road Infrastructures, Rome, Italy, 29–31 October 2012; Elsevier Ltd.: Amsterdam, The Netherlands, 2012; Volume 53, pp. 973–980. [Google Scholar]
- Al-Ghamdi, A. Analysis of traffic accidents at urban intersections in Riyadh. Accid. Anal. Prev. 2003, 35, 717–724. [Google Scholar] [CrossRef]
- Kim, J.; Kim, S.; Ulfarsson, G.; Porrello, L. Bicyclist injury severities in bicycle-motor vehicle accidents. Accid. Anal. Prev. 2007, 39, 238–251. [Google Scholar] [CrossRef] [PubMed]
- Forester, J. The Bikeway Controversy // Bicycle Transportation: A Handbook for Cycling Transportation Engineers; MIT Press: Cambridge, MA, USA, 1994; pp. 127–144. ISBN 9780262560795. [Google Scholar]
- Moritz, W. Adult Bicyclists in the United States: Characteristics and Riding Experience in 1996. Transp. Res. Rec. J. Transp. Res. Board 1998, 1636, 1–7. [Google Scholar] [CrossRef]
- Rodgers, G. Bicyclist deaths and fatality risk patterns. Accid. Anal. Prev. 1995, 27, 215–223. [Google Scholar] [CrossRef]
- Osman, M.; Paleti, R.; Mishra, S.; Golias, M. Analysis of injury severity of large truck crashes in work zones. Accid. Anal. Prev. 2016, 97, 261–273. [Google Scholar] [CrossRef] [PubMed]
- Klop, J.; Khattak, A. Factors influencing bicycle crash severity on two-lane, undivided roadways in North Carolina. Transp. Res. Rec. 1999, 167, 78–85. [Google Scholar] [CrossRef]

| Zone | Traffic Accidents (unit) | Death Toll (unit) | Economic Loss (1000 yuan) |
|---|---|---|---|
| Zone 1: Dongcheng District Xicheng District | 146 | 25 | 80.8 |
| Zone 2: Chaoyang District Fengtai District Shijingshan District Haidian District | 857 | 296 | 644.0 |
| Zone 3: Fangshan District Tongzhou District Shunyi Distric Changping District Daxing Distric | 1318 | 457 | 991.0 |
| Zone 4: Huairou District Pinggu District Miyun District Yanqing District Mentougou District Yizhuang District | 294 | 137 | 339.5 |
| Variables | Definition | Mean Value | Standard Deviation |
|---|---|---|---|
| Severity | 1 = Death accident; 2 = Injury without death | 1.58 | 0.49 |
| Accident attribute | |||
| Accident type | 1 = 2 vehicles and above, without pedestrians or motor vehicles; 2 = 1 vehicle, without pedestrians or motor vehicles; 3 = 2 vehicles and above, with pedestrians or motor vehicles; 4 = 1 vehicle, with pedestrians or motor vehicles; 5 = Only pedestrians or motor vehicles | 2.79 | 1.45 |
| Time of occurrence | |||
| Day of the week | 1 = Monday; 2 = Tuesday; 3 = Wednesday; 4 = Thursday; 5 = Friday; 6 = Saturday; 7 = Sunday | 4.04 | 1.96 |
| Time interval | 1 = 0:00–6:00; 2 = 6:00–12:00; 3 = 12:00–18:00; 4 = 18:00–24:00 | 2.75 | 1.05 |
| Infrastructure | |||
| Cross-section position | 1 = Motorized Lane; 2 = Non-motorized Lane; 3 = Mixed Lane; 4 = Sidewalk; 5 = Pedestrian crossing; 6 = Emergency parking area; 7 = Others | 1.88 | 1.67 |
| Central isolation facility | 1 = Green area; 2 = Concrete retaining; 3 = Isolated piers (columns); 4 = Others | 3.13 | 1.18 |
| Physical isolation facility | 1 = No isolation; 2 = Central isolation; 3 = Isolation between motor and non-motor vehicle; 4 = Center of isolation and isolation between motor and non-motor vehicle | 1.71 | 0.73 |
| Pavement condition | 1 = Good condition; 2 = Under construction; 3 = Concave-convex; 4 = Collapse; 5 = Barricade | 1.03 | 0.26 |
| Pavement structure | 1 = Bitumen; 2 = Cement; 3 = Sand or stone; 4 = Soil road; 5 = Others | 1.03 | 0.24 |
| Intersections type | 1 = Intersection; 2 = General section; 3 = Others | 1.73 | 0.51 |
| Road line style | 1 = Straight; 2 = Curve | 1.04 | 0.20 |
| Road type | 1 = Highway; 2 = Urban Expressway; 3 = Urban trunk road; 4 = Other urban roads; 5 = High grade road; 6 = Others | 3.87 | 1.28 |
| Management status | |||
| Road safety attribute | 1 = Normal road; 2 = Section with lurking peril managed; 3 = Section with lurking peril being managed; 4 = Section with lurking peril but not managed; 5 = Others | 2.23 | 1.77 |
| Signal control mode | 1 = No signal; 2 = Other security facilities; 3 = Signal | 1.83 | 0.68 |
| Environment condition | |||
| Weather | 1 = Sunny; 2 = Cloudy; 3 = Rainy; 4 = Snowy; 5 = Foggy; 6 = Windy; 7 = Dust; 8 = Hailstones; 9 = Others | 1.22 | 0.64 |
| Visibility | 1 = Under 50m; 2 = 50–100 m; 3 = 100–200 m; 4 = More than 200m | 3.03 | 1.03 |
| Lighting condition | 1 = Daytime; 2 = Night with street lamp lighting; 3 = Night without street lamp lighting; 4 = Dawn; 5 = Dust | 1.72 | 0.91 |
| Road surface condition | 1 = Dry; 2 = Damp; 3 = Ponding; 4 = Overflowing; 5 = Ice and snow; 6 = Others | 1.15 | 0.73 |
| Zone | Severity | Accident Type | |||||
|---|---|---|---|---|---|---|---|
| Y = 1 | Y = 2 | X1 = 1 | X1 = 2 | X1 = 3 | X1 = 4 | X1 = 5 | |
| Whole city | 42.4% | 57.6% | 34.9% | 9.0% | 3.1% | 48.4% | 4.5% |
| Zone 1 | 28.1% | 71.9% | 23.1% | 5.8% | 2.1% | 60.3% | 8.7% |
| Zone 2 | 39.5% | 60.5% | 33.1% | 8.1% | 3.9% | 50.5% | 4.5% |
| Zone 3 | 43.9% | 56.1% | 36.4% | 9.2% | 3.1% | 46.5% | 4.9% |
| Zone 4 | 49.3% | 50.7% | 38.6% | 11.3% | 2.2% | 45.5% | 2.4% |
| Zone | Permanent Resident Population (Ten Thousand) | Permanent Resident Population per Square Kilometer | Car Ownership | Car Ownership per 1000 People |
|---|---|---|---|---|
| Whole city | 2170.5 | 1323 | 5,349,989 | 246.5 |
| Zone 1 | 220.3 | 23,845 | 933,336 | 423.7 |
| Zone 2 | 1062.5 | 8327 | 2,599,993 | 244.7 |
| Zone 3 | 696.9 | 1107 | 1,417,004 | 203.3 |
| Zone 4 | 190.8 | 218 | 399,656 | 209.4 |
| Variables | Whole City | Zone 1 | Zone 2 | Zone 3 | Zone 4 |
|---|---|---|---|---|---|
| Accident attribute | |||||
| Accident type | 0.000 | 0.000 | 0.000 | 0.000 | 0.000 |
| Time of occurrence | |||||
| Day of the week | - | - | - | - | - |
| Time interval | 0.000 | - | 0.037 | 0.003 | 0.019 |
| Infrastructure | |||||
| Cross-section position | 0.000 | 0.007 | 0.000 | - | 0.025 |
| Central isolation facility | - | - | - | 0.000 | - |
| Physical isolation facility | 0.030 | - | - | 0.006 | - |
| Pavement condition | 0.012 | 0.028 | - | - | - |
| Pavement structure | - | - | 0.031 | - | - |
| Intersections type | 0.012 | - | 0.031 | - | - |
| Road line style | 0.021 | - | - | 0.006 | - |
| Road type | 0.000 | 0.009 | - | 0.000 | 0.003 |
| Management status | |||||
| Road safety attribute | - | - | 0.037 | - | - |
| Signal control mode | 0.017 | - | - | 0.000 | - |
| Environment condition | |||||
| Weather | - | - | 0.013 | - | - |
| Visibility | 0.000 | - | 0.008 | 0.000 | - |
| Lighting condition | 0.000 | - | - | 0.000 | 0.014 |
| Road surface condition | - | - | - | - | - |
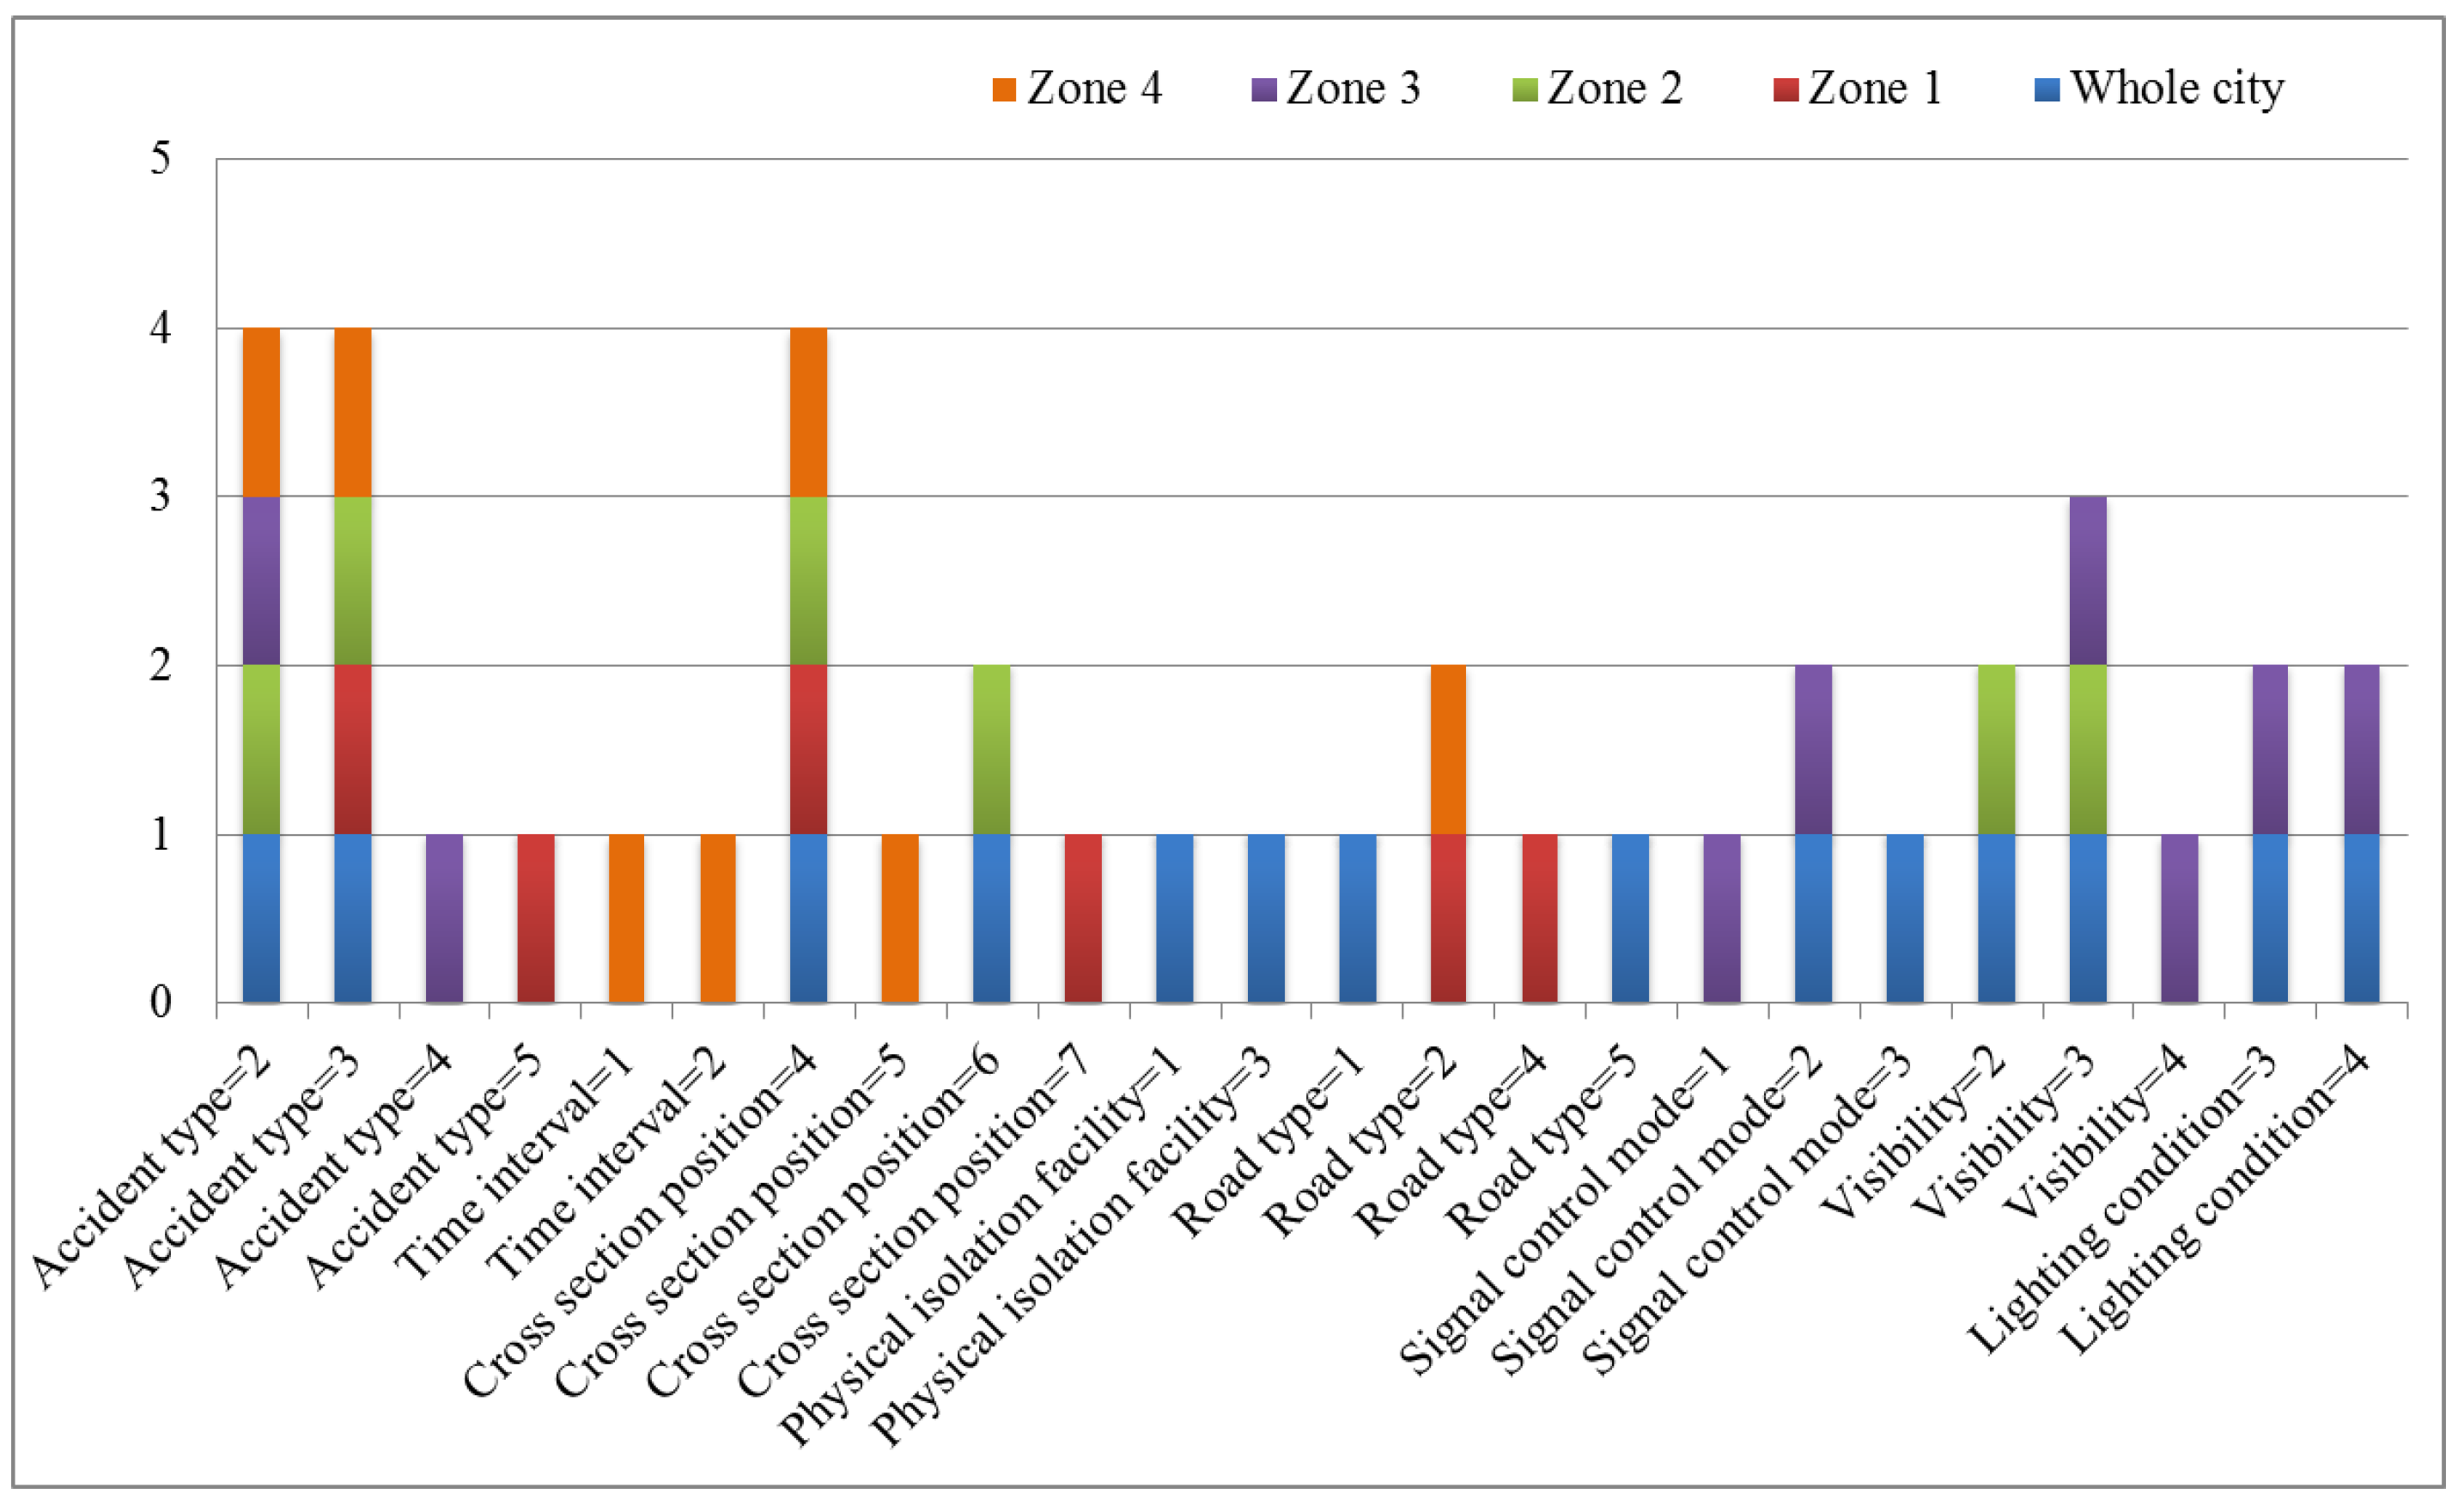
| Variables | Whole City | Zone 1 | Zone 2 | Zone 3 | Zone 4 | |||||
|---|---|---|---|---|---|---|---|---|---|---|
| Sig. | Exp(B) | Sig. | Exp(B) | Sig. | Exp(B) | Sig. | Exp(B) | Sig. | Exp(B) | |
| Accident attribute | ||||||||||
| Accident type | 0.000 | 0.002 | 0.000 | 0.000 | 0.000 | |||||
| 1 | 1.598 | 0.072 | 0.696 | 5.401 | 1.056 | |||||
| 2 | 4.422 | 0.337 | 1.927 | 13.304 | 4.391 | |||||
| 3 | 3.353 | 5.134 | 1.718 | 6.567 | 5.523 | |||||
| 4 | 2.401 | 0.424 | 1.272 | 6.665 | 1.781 | |||||
| 5 | # | # | # | # | # | |||||
| Time of occurrence | ||||||||||
| Time interval | - | - | - | - | 0.050 | |||||
| 1 | 2.586 | |||||||||
| 2 | 1.223 | |||||||||
| 3 | 1.112 | |||||||||
| 4 | # | |||||||||
| Infrastructure | ||||||||||
| Cross-section position | 0.001 | 0.031 | 0.001 | - | 0.048 | |||||
| 1 | 0.794 | 0.468 | 0.722 | 0.470 | ||||||
| 2 | 0.584 | 0.140 | 0.380 | 0.332 | ||||||
| 3 | 0.723 | 0.096 | 0.514 | 0.768 | ||||||
| 4 | 2.105 | 0.738 | 1.195 | 1.239 | ||||||
| 5 | 0.614 | 0.414 | 0.325 | 2.171 | ||||||
| 6 | 2.858 | / | 2.884 | / | ||||||
| 7 | # | # | # | # | ||||||
| Central isolation facility | - | - | - | 0.000 | - | |||||
| 1 | 1.177 | |||||||||
| 2 | 2.261 | |||||||||
| 3 | 2.355 | |||||||||
| 4 | # | |||||||||
| Physical isolation facility | 0.007 | - | - | 0.000 | - | |||||
| 1 | 1.059 | 0.877 | ||||||||
| 2 | 0.846 | 0.455 | ||||||||
| 3 | 1.334 | 1.349 | ||||||||
| 4 | # | # | ||||||||
| Road type | 0.000 | 0.024 | - | 0.001 | 0.004 | |||||
| 1 | 2.231 | / | 2.326 | 4.375 | ||||||
| 2 | 1.091 | 0.544 | 1.291 | 6.900E8 | ||||||
| 3 | 0.994 | 0.298 | 1.836 | 0.494 | ||||||
| 4 | 1.170 | # | 1.738 | 0.798 | ||||||
| 5 | 1.502 | / | 1.859 | 1.015 | ||||||
| 6 | # | / | # | # | ||||||
| Management status | ||||||||||
| Signal control mode | 0.001 | - | - | 0.004 | - | |||||
| 1 | 0.785 | 1.003 | ||||||||
| 2 | 1.060 | 1.428 | ||||||||
| 3 | # | # | ||||||||
| Environment condition | ||||||||||
| Visibility | 0.000 | - | 0.004 | 0.000 | - | |||||
| 1 | 0.590 | 0.143 | 0.662 | 0.489 | ||||||
| 2 | 1.028 | 0.074 | 1.326 | 0.953 | ||||||
| 3 | 1.273 | 0.004 | 1.564 | 1.336 | ||||||
| 4 | # | # | # | |||||||
| Lighting condition | 0.000 | - | - | 0.000 | - | |||||
| 1 | 1.020 | 1.227 | ||||||||
| 2 | 0.914 | 1.108 | ||||||||
| 3 | 2.162 | 3.153 | ||||||||
| 4 | 2.044 | 2.390 | ||||||||
| 5 | # | # | ||||||||
| Variables | Whole City | Zone 1 | Zone 2 | Zone 3 | Zone 4 |
|---|---|---|---|---|---|
| Accident attribute | |||||
| Accident type | 80.8% | 100.0% | 100% | 55.4% | 100.0% |
| Time of occurrence | |||||
| Day of the week | - | - | - | - | - |
| Time interval | * | - | 37.5% | * | 62.9% |
| Infrastructure | |||||
| Cross-section position | * | 43.1% | 68.3% | - | 58.2% |
| Central isolation facility | - | - | - | 38.6% | - |
| Physical isolation facility | * | - | - | 47.2% | - |
| Pavement condition | * | 31.1% | - | - | - |
| Pavement structure | - | - | * | - | - |
| Intersections type | * | - | * | - | - |
| Road line style | * | - | - | * | - |
| Road type | 41.8% | 40.3% | - | 84.7% | 53.4% |
| Management status | |||||
| Road safety attribute | - | - | * | - | - |
| Signal control mode | 25.2% | - | - | 44.0% | - |
| Environment condition | |||||
| Weather | - | - | 42.0% | - | - |
| Visibility | 28.8% | - | 55.3% | 62.9% | - |
| Lighting condition | 100.0% | - | - | 100.0% | 36.5% |
| Road surface condition | - | - | - | - | - |
| Zone | BLR | CART |
|---|---|---|
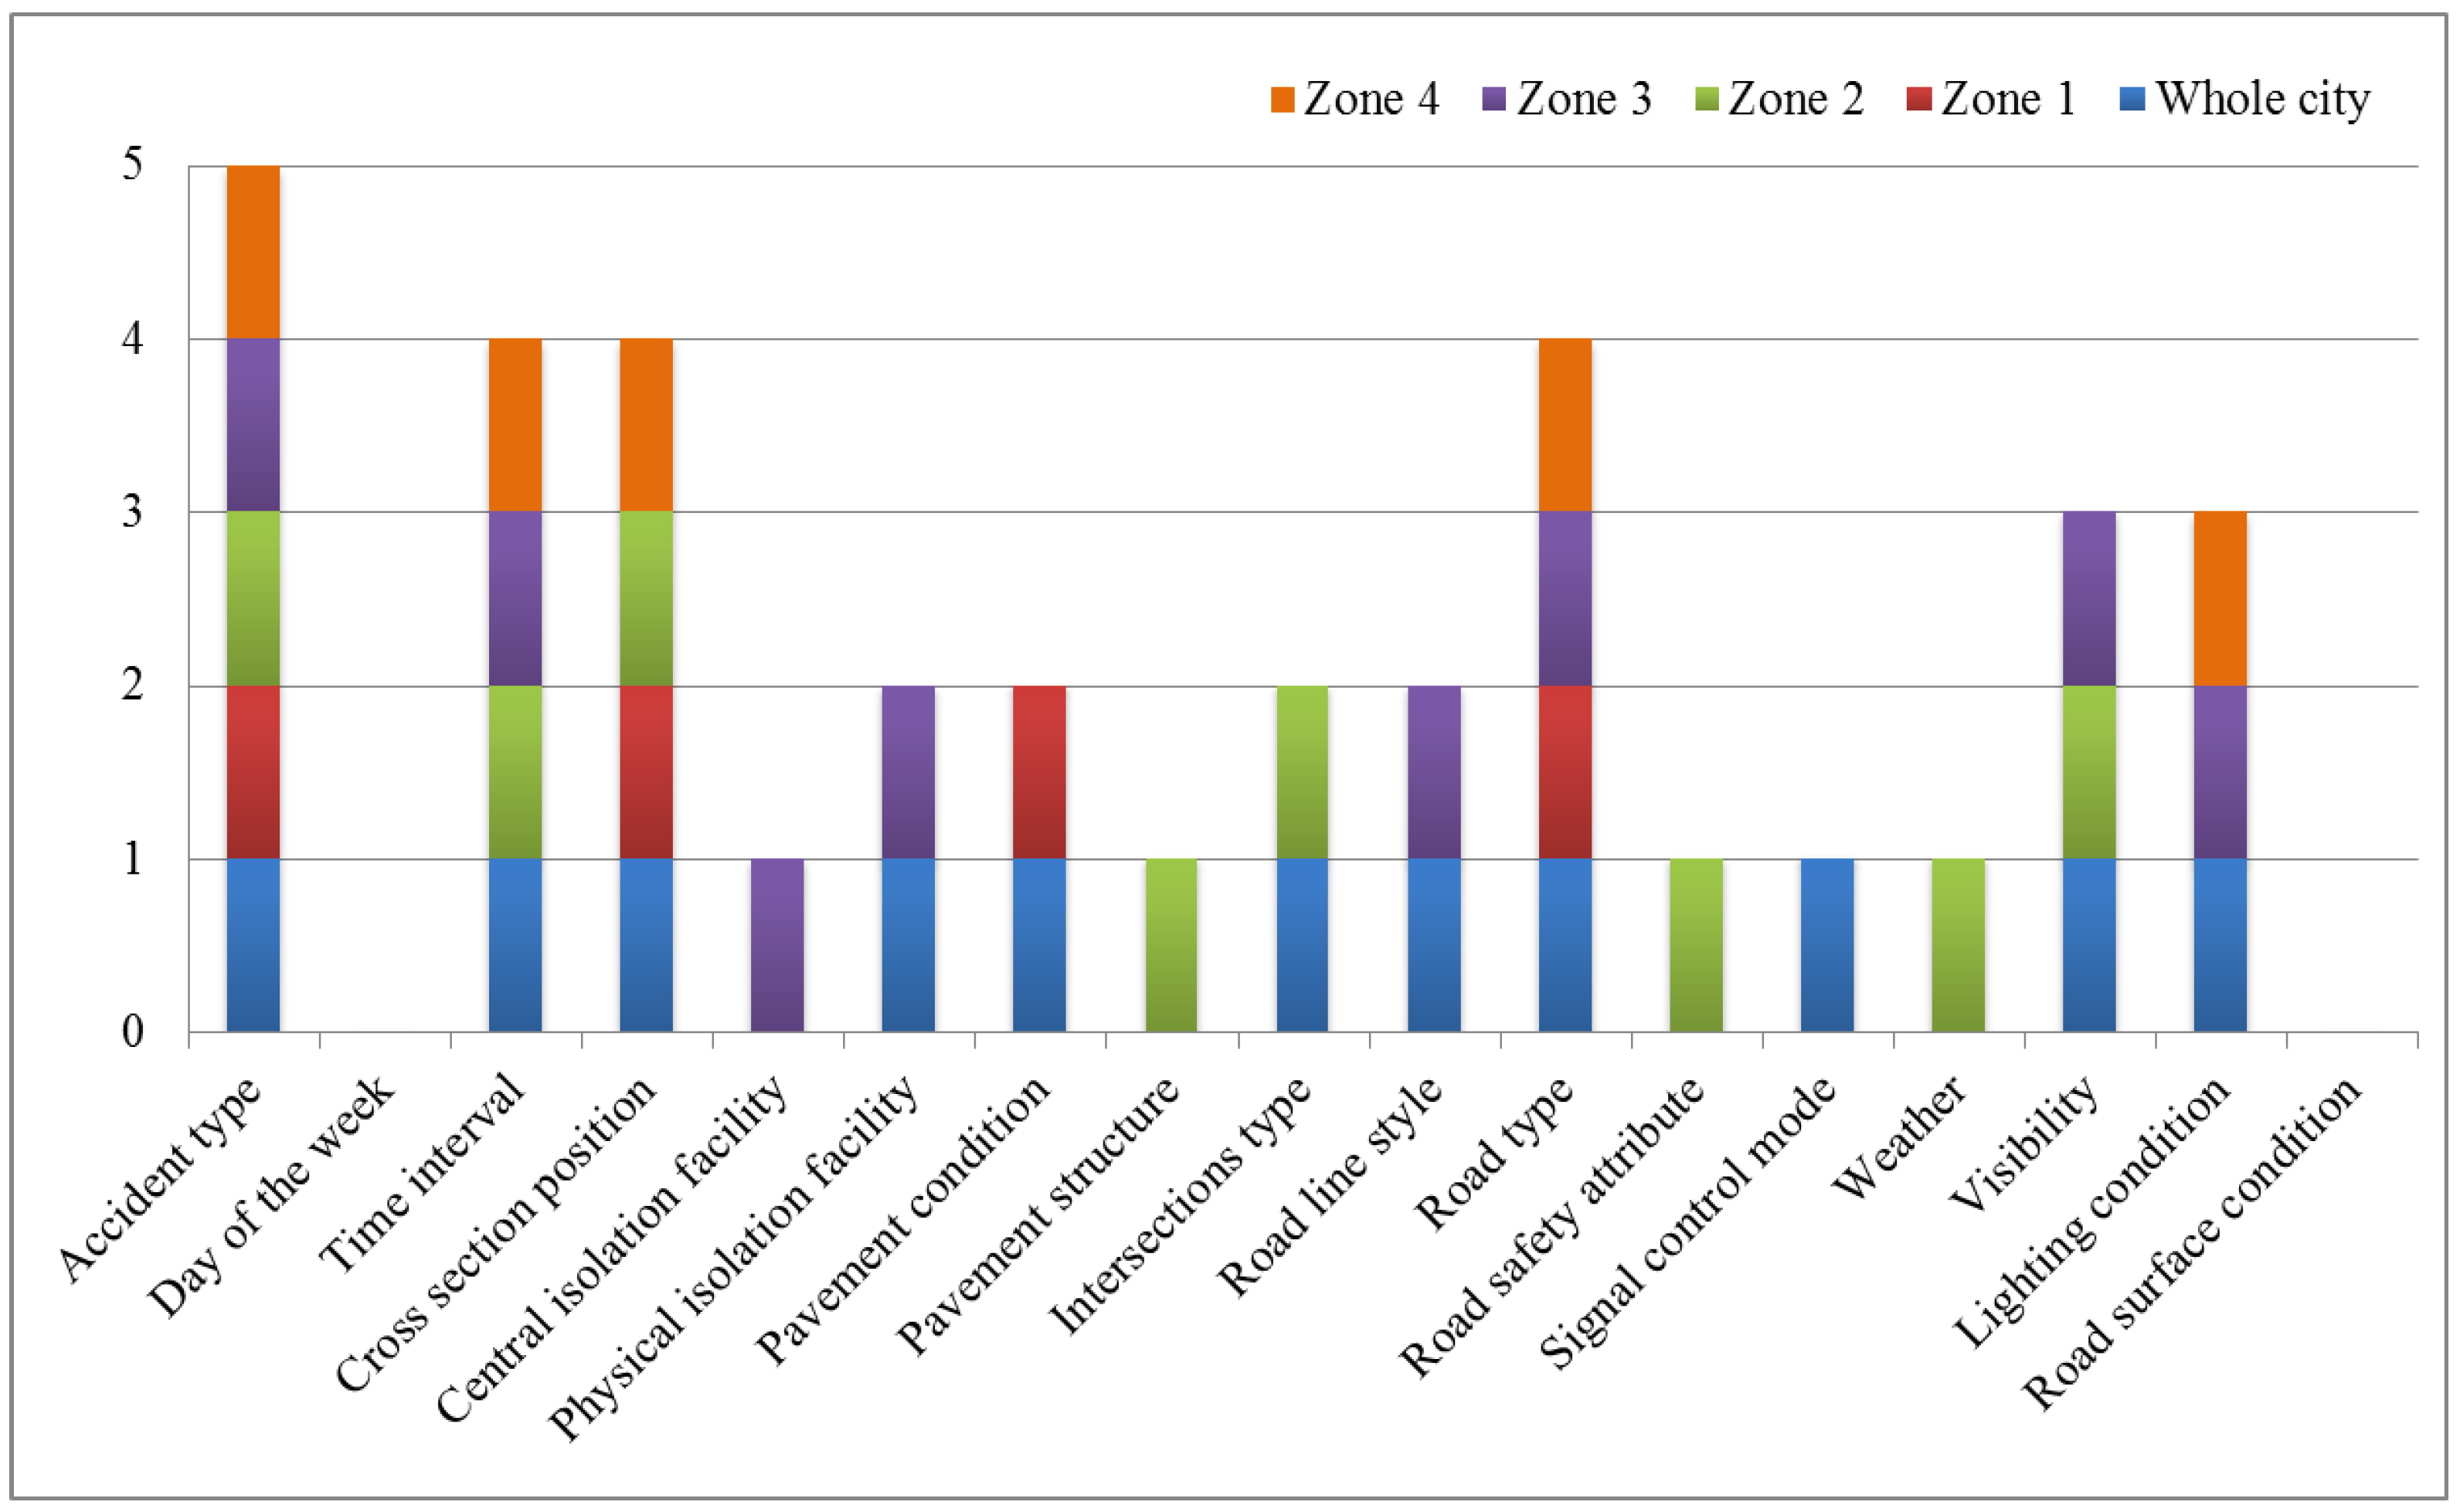
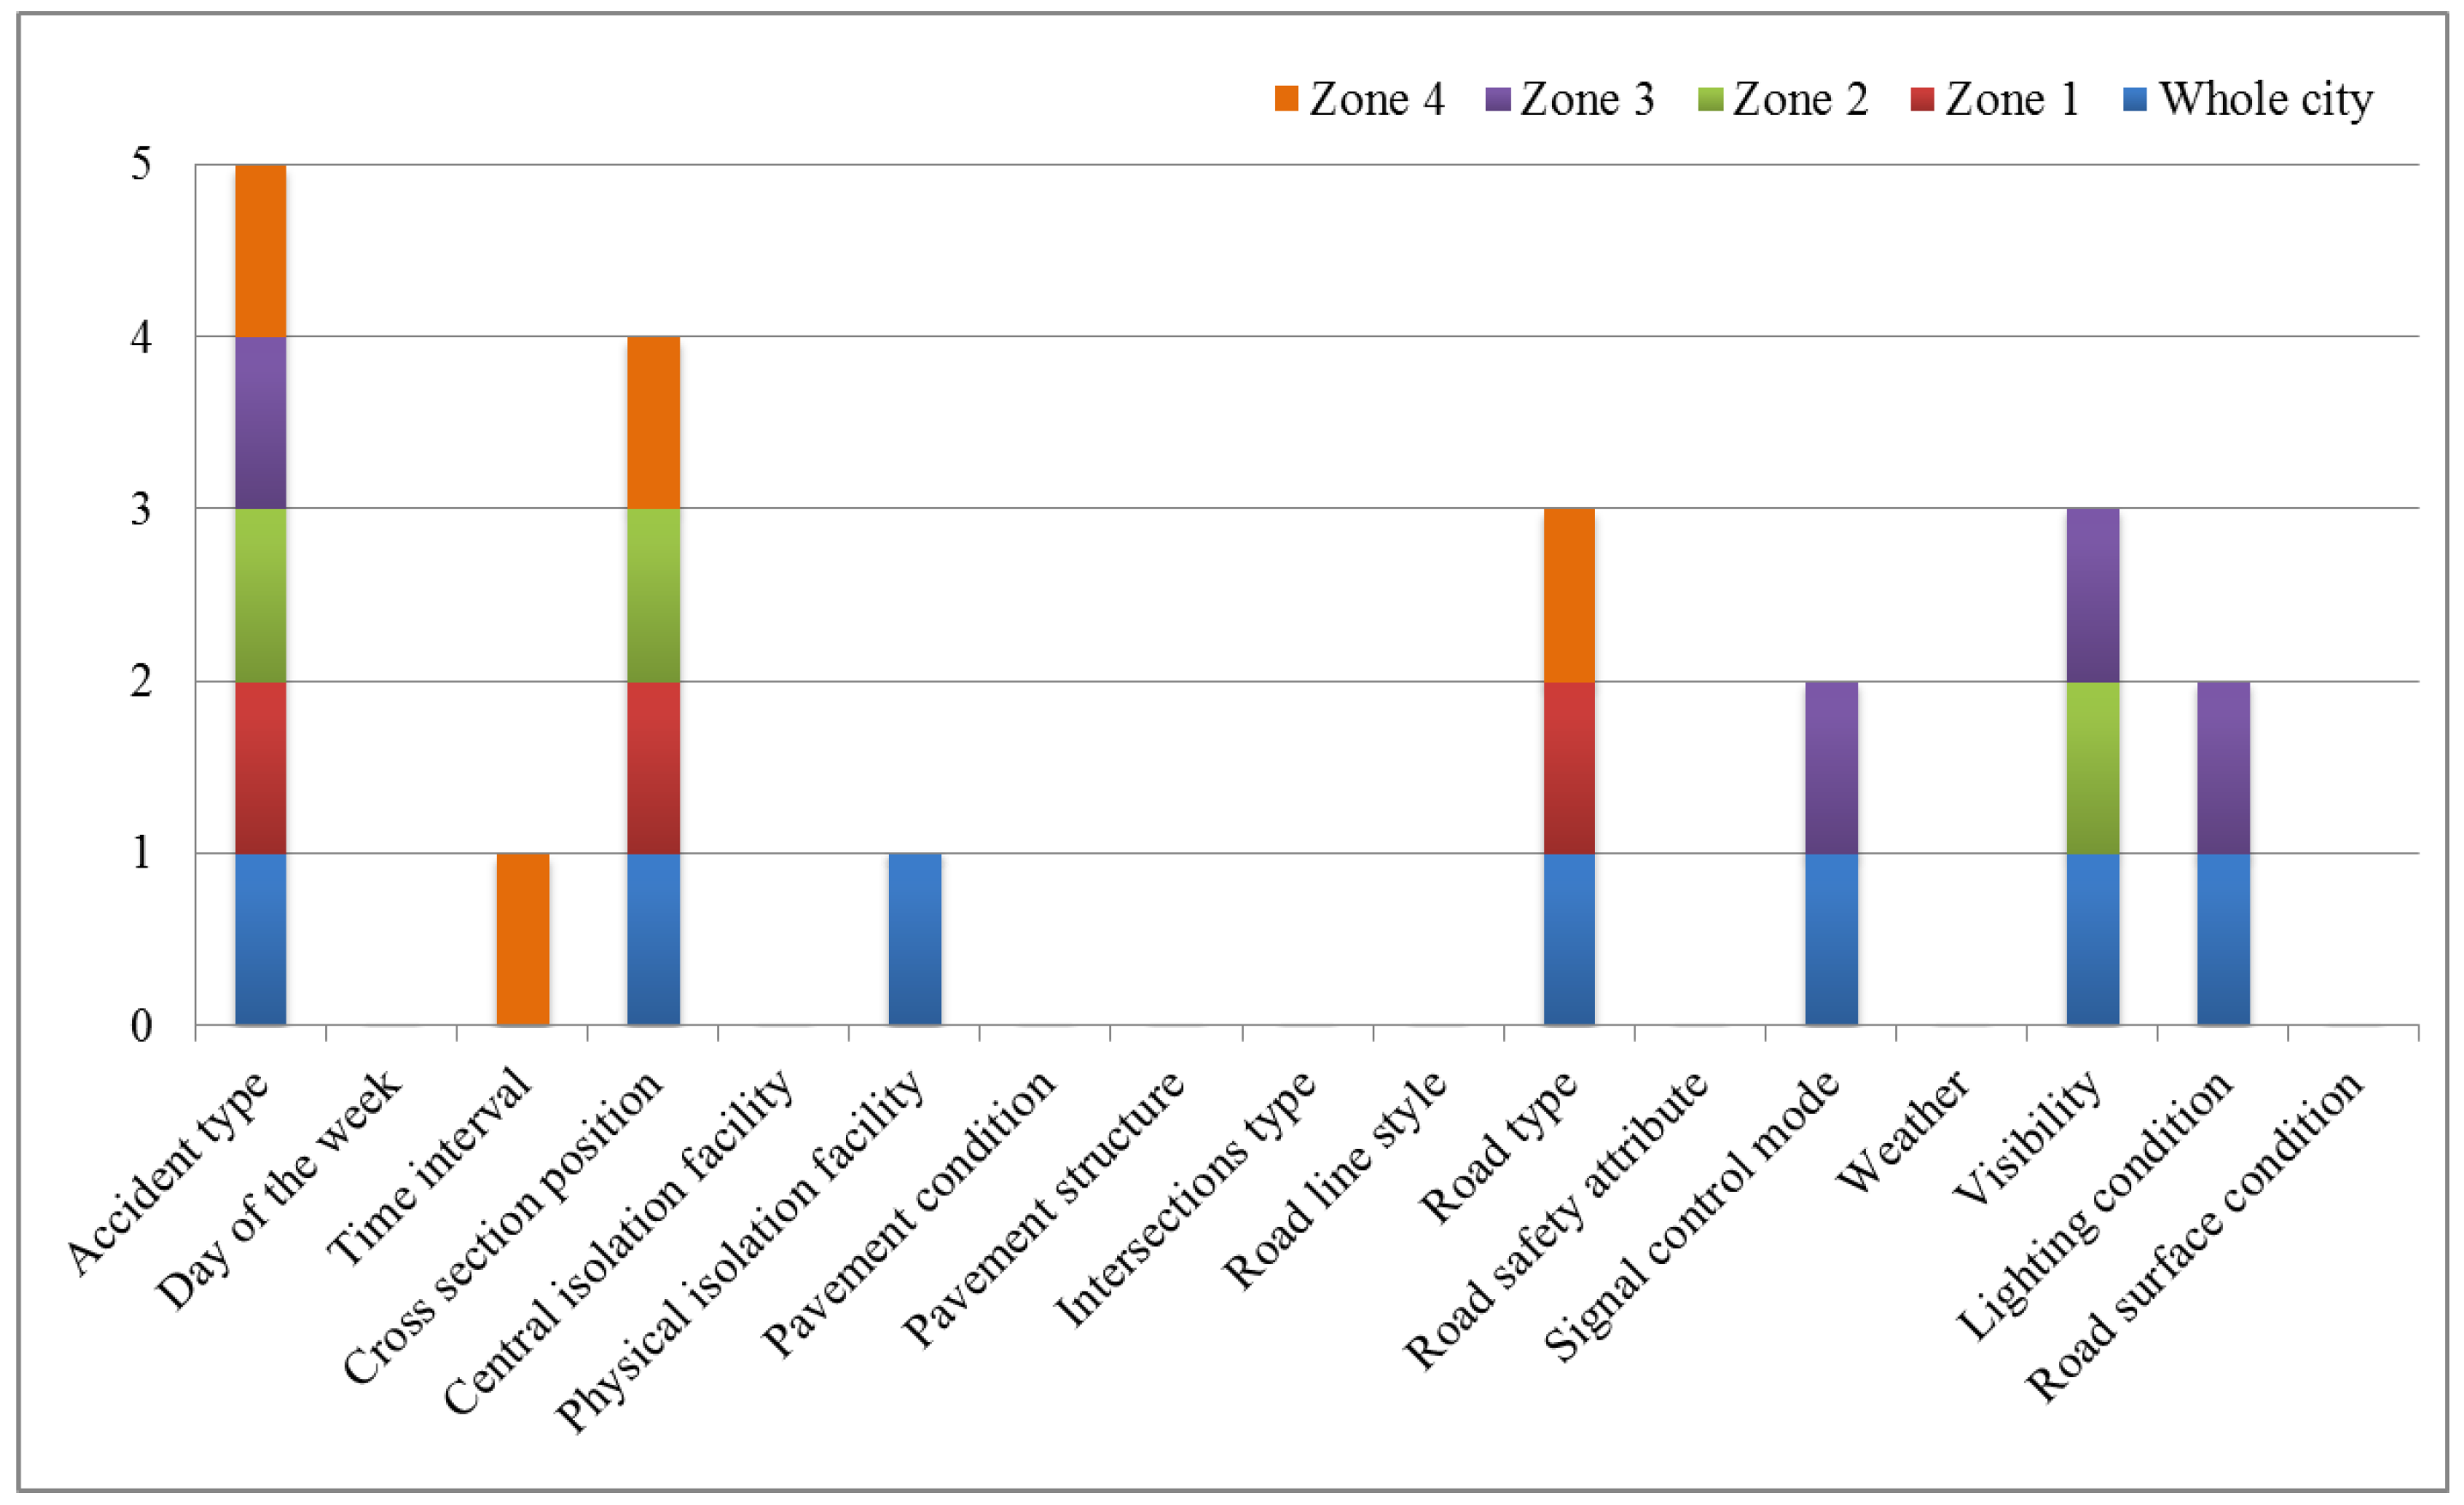
| Whole city | Accident type, cross-section position, physical isolation facility, road type, signal control mode, visibility, lighting condition | Lighting condition, accident type, road type, visibility, signal control mode |
| Zone 1 | accident type, cross-section position, road type | Accident type, cross-section position, road type, pavement condition |
| Zone 2 | Accident type, cross-section position, visibility | Accident type, cross-section position, visibility, weather, time interval |
| Zone 3 | Accident type, signal control mode, visibility, lighting condition | lighting condition, road type, visibility, Accident type, physical isolation facility, signal control mode, central isolation facility |
| Zone 4 | Accident type, time interval, cross-section position, road type | Accident type, time interval, cross-section position, road type, lighting condition |
© 2018 by the authors. Licensee MDPI, Basel, Switzerland. This article is an open access article distributed under the terms and conditions of the Creative Commons Attribution (CC BY) license (http://creativecommons.org/licenses/by/4.0/).
Share and Cite
Sun, Z.; Wang, J.; Chen, Y.; Lu, H. Influence Factors on Injury Severity of Traffic Accidents and Differences in Urban Functional Zones: The Empirical Analysis of Beijing. Int. J. Environ. Res. Public Health 2018, 15, 2722. https://doi.org/10.3390/ijerph15122722
Sun Z, Wang J, Chen Y, Lu H. Influence Factors on Injury Severity of Traffic Accidents and Differences in Urban Functional Zones: The Empirical Analysis of Beijing. International Journal of Environmental Research and Public Health. 2018; 15(12):2722. https://doi.org/10.3390/ijerph15122722
Chicago/Turabian StyleSun, Zhiyuan, Jianyu Wang, Yanyan Chen, and Huapu Lu. 2018. "Influence Factors on Injury Severity of Traffic Accidents and Differences in Urban Functional Zones: The Empirical Analysis of Beijing" International Journal of Environmental Research and Public Health 15, no. 12: 2722. https://doi.org/10.3390/ijerph15122722