1. Introduction
It is generally believed that developing countries reverse the situation that lacking of technological innovation in primary stage of development through utilizing the technology spillover effect of FDI [
1]. Therefore, for a long time, China’s policy makers have always seen foreign funded enterprises as representative of high-tech enterprises, and make use of local resources in exchange for advanced technology in production and management to achieve economic growth. However, does FDI really bring beneficial technological spillover effect to host countries? Yet another, more serious environmental problem has emerged before the crucial question has been answered explicitly. The PM
2.5 concentration in Beijing during 2013 significantly exceeded the health standard suggested by the World Health Organization (WHO) [
2,
3,
4], and has caused the total economic losses of 246.26 billion Yuan (approximately 1.1% of the national GDP) during 2007 [
5]. Not only that, the serious air pollution in China caused significant public health impacts [
6,
7]. The Global Burden of Disease (GBD) study undertaken by Institute for Health Metrics and Evaluation and World Health Organization (WHO) linked over 3.2 million premature deaths to PM pollution in 2010, and roughly one-third (1.23 million) of the world’s estimated PM pollution-related premature deaths were in China [
8]. Given China’s relatively lax environmental policy, it has raised concerns among academics about whether the developing countries that led by China have become a “Pollution Haven” for multinational companies (MNCs). The purpose of this article is not the simple verification on FDI technology spillover effect and environmental effect. Rather, we attempt to explore whether environmental regulation as a kind of non-market approach can promote the technological spillover effect of FDI and environmental quality under the background of the increasing environmental protection pressure in China.
In recent years, it is not groundless that FDI will deteriorate the ecological environment of host countries, the argument is as follows. Firstly, the international division of labor is unceasing deepening which is supported by the global value chain. According to factor endowment theory, developed countries have the move to shift the pollution to developing countries because of the comparative advantage in sufficient labor force and lax environmental regulation [
9,
10,
11,
12,
13]. Although this process has boosted the rapid growth of China’s economy, it has also led to serious “trade-induced” environmental pollution [
14], which results in the increasingly serious pollution in China. Secondly, the local government who is order to obtain advantages in regional economy and politics will have sufficient incentives to reduce environmental standards, which called “race to the bottom” behavior [
15]. This behavior will attract more foreign capital and other liquidity factors [
16], so that developing countries become transnational corporations’ “Pollution Havens” [
17]. This is the commonly studied “Pollution Haven Hypothesis (PHH)”. However, some scholars have argued that a large-scale entrance of FDI does not necessarily deteriorate the environmental quality in host countries. On the contrary, investment of the MNCs in host countries can bring more environmental friendly production standards and technologies, and have a positive impact on host countries’ environmental protection through the “demonstration effects”, this argument is known as a “Pollution Halo Hypothesis” [
18]. It attracted the attention of many scholars once presented. Zugravu-Soilita [
19] insisted that these foreign firms, although to some extent guided in their location choice by the “Pollution Haven Hypothesis” and merely complying with less severe regulations in the host country, are often found to be more environmentally efficient than local firms. Moreover, foreign companies might desire to use less polluting technologies are order to avoid backlash from constituencies of their home countries [
20]. In a simple theoretical model, Elliott and Zhou [
21] found support to the “Pollution Halo Hypothesis” when firms are assumed to be cleaner, which is usually characteristic of FDI from developed towards developing countries.
The two conflicting viewpoints described above indicate that FDI can bring a green technological spillover effect of improving economic growth in the long run accompanied with an improved environmental performance for the host countries, only when the degree of technological cleanliness selected is closely related to the stringency of environmental regulation of the host countries, in other words, the spillover effect of FDI does not occur automatically. More and more evidences show that increasing stringency of environmental regulation is not hinder the entrance of FDI, but on the contrary, may extrude FDI of high cleanliness from high-polluting domestic firms [
21], thus contributing to developing countries to achieve green development. Numerous studies have shown that, strict environmental regulation not only prompted the government to adjust the structure of foreign investment and improve the environment threshold of foreign investment, also filtered the FDI, which means giving priority to introduce FDI that is beneficial to environmental protection and technology upgrading, crowding out the FDI in pollution intensive industry. Dean and Lovely et al. [
10] separately confirmed that the strict environmental regulation significantly inhibited the entrance of FDI which has low technology-intense, high pollution level and low R&D intensity through their studies, and had no significant effect to FDI in the clean type of high-tech industry. Tang [
22] first noticed that significant variation exists in the process of environmental regulation influencing FDI which has different entry motivation, environmental regulation has a significant negative impact on vertical FDI, but has less effect on the horizontal FDI, and pointed out that the reason why most empirical studies related to “Pollution Haven Hypothesis” have differences is because they didn’t consider the heterogeneity of FDI.
In general speaking, the existing studies mostly emphasize the influence of environmental regulation on the choice of foreign investment entrance, even a few scholars studied the relationship between environmental regulation and FDI technology spillover effect, but it did not show whether FDI technology spillover effect is helpful for the improvement of the environment quality. According to the Acemoglu and Aghion et al. [
23], technology can be classified as “dirty” technology and “clean” technology, when there is guidance of environmental regulation, technical progress is no longer just a simple increase in technical level, but has a certain bias. Chung and Fare [
24] put forword a method of directional distance function, when measured the TFP of the Swedish pulp mill. This method takes pollution emission as unexpected. Then builds a Malmquist-Luenberger index based on on this basis. Since then, the method of measuring green total factor productivity has been widely used. But when there is an excessive input or insufficient output, which is if exist the non-zero relaxation of input or output (Slack), the radial type of DEA efficiency measurement will overestimate the efficiency of the object. Therefore, Färe and Grosskopf [
25], Fukuyama and Weber [
26] considered [
27,
28], and based on that developed a more general type of directional distance function based on non-radial SBM. Molinos-Senante and Maziotis et al. [
29] measured the green total factor productivity of the UK and Welsh water companies according to the SBM function, which were decomposed by the Malmquist-Luenberger index and the Luenberger index respectively, and it is considered that the former overestimated the change of productivity. To make up for the lack of previous research, we based on SBM model and Luenberger index to measure the rate of green technological progress in 30 sectors of China industry from 2003 to 2010, and proceeded empirical research on FDI technology spillover effect under the situation that fixed intensity of environmental regulation and variable intensity of environmental regulation.
The paper unfolds as follows:
Section 2 is based on the SBM directional distance function and the Luenberger productivity index to measure the efficiency of China’s manufacturing green technology progress.
Section 3 sets the indexes and classifies the manufacturing industry according to the strength of the two kinds of environmental regulation tools, and bases on our questions set two kinds of econometric models.
Section 4 answers the question from the first part through analyzing the empirical results.
Section 4 summarizes the whole paper and discusses the policy implications of the conclusions.
2. The Measure of the Manufacturing Green Technology Progress
The focous of this paper is that the measurement of green technology progress of manufacturing industry. We use the SBM directional distance function to measure the efficiency of 30 manufacturing industries and the Luenberger index to decompose the manufacturing green technology progress.
2.1. Methods
2.1.1. Production Possibility Set Considering Environmental Factors
In this paper, each industry is used as a decision making unit (DMU) to construct the production frontier, assuming that each DMU uses N input,
j is the industry, obtain M expected outputs,
, P non-anticipated outputs,
, DEA can be used to express the production frontier of non-expected outputs as follows:
where
is the weight of the observed values for each cross section.
2.1.2. SBM Directional Distance Function
We definite the directional distance function under the energy environment according to Fukuyama and Weber [
26]:
In the above equation, is the directional distance function of variable returns to scale (VRS) if take out is the directional distance function of constant returns to scale (CRS); , separately represent the input and output vectors, direction vectors and slack vectors of j industry.
2.1.3. The Luenberger Productivity Indicator (LPI)
Since Färe and Grosskopf [
30] developed the Malmquist productivity index, was which proposed by Caves and Christensen et al. [
31], the Malmquist productivity index is widely applied to a variety of fields. Chung and Fare [
24] extended it to the Malmquist–Luenberger (ML) index which contains environmental factors. Whether the M index or ML index is used, the measurement angle is under the hypothesis of minimizing cost or maximizing the profit, which means the measurement method is about input or output. Chambers and Fāure et al. [
32] developed a new method Luenberger productivity index, which is used without choosing the measurement angle and considering both the reduction of investment and the increasing of output. It corresponds to the hypothesis of maximizing profit, and the situation of minimizing cost and maximizing profit could be considered. Therefore, the Luenberger productivity index is a generalization of M index and ML index [
33].
The Luenberger total factor productivity (LTFP) indicators between t and t + 1 periods as follows Chambers and Fāure et al. [
32]:
Further, the LTFP can be decomposed into two components: efficiency change (Effe) and technical change (Tech) [
34].
The LTFP and its components can be interpreted as follows: (i) an means an improvement in the productivity; (ii) an means worsening of the productivity; and (iii) an means that the productivity has not changed.
Although previous studies generally decomposed LTFP into changes in technical efficiency and scale efficiency, but considering the changes of the manufacturing green technology mainly showed on the total factor productivity change. This change may come from the foreign technology absorption capacity and good foreign production management system, and perform certainly as the introduction of new technology and technological innovation, so this article only considers LTFP as an index to measure the technological progress in manufacture.
2.2. Relevant Data Processing
Measure the industry green technological progress also needs to construct the correlative indexes of the expected output, unexpected output and factor inputs, and the data required from the National Bureau of Statistics of the People’s Republic of China [
35].
Expected output: This paper sets the gross value of industrial output as expected output, and make 1990 for the base period, to deflate the gross value of industrial output in each year with various industries PPI.
Unexpected output: Academics generally view waste emissions as unexpected output. To measure the manufacturing green technology progress comprehensively, we select waste water, waste gas, solid waste as unexpected output.
Factor inputs: Capital stock, most of the existing research using the perpetual inventory method to measure the current capital stock, but this kind of method requires higher data quality. Considering the data availability and quality, we calculate the capital stock in current period; Labor capital investment, as the labor time of all industries is not available, in this paper, we utilize the average workers in China Industrial Economy Statistical Yearbook instead of the labor-based investment; as for total energy input, we choose industrial energy consumption as indicators of energy input.
2.3. The Measure Results and Analysis
According to the above theory method and index, we used the Matlab2015b software to estimate the change of the manufacturing LTFP that considers an unexpected output of waste water, waste gas and solid waste.
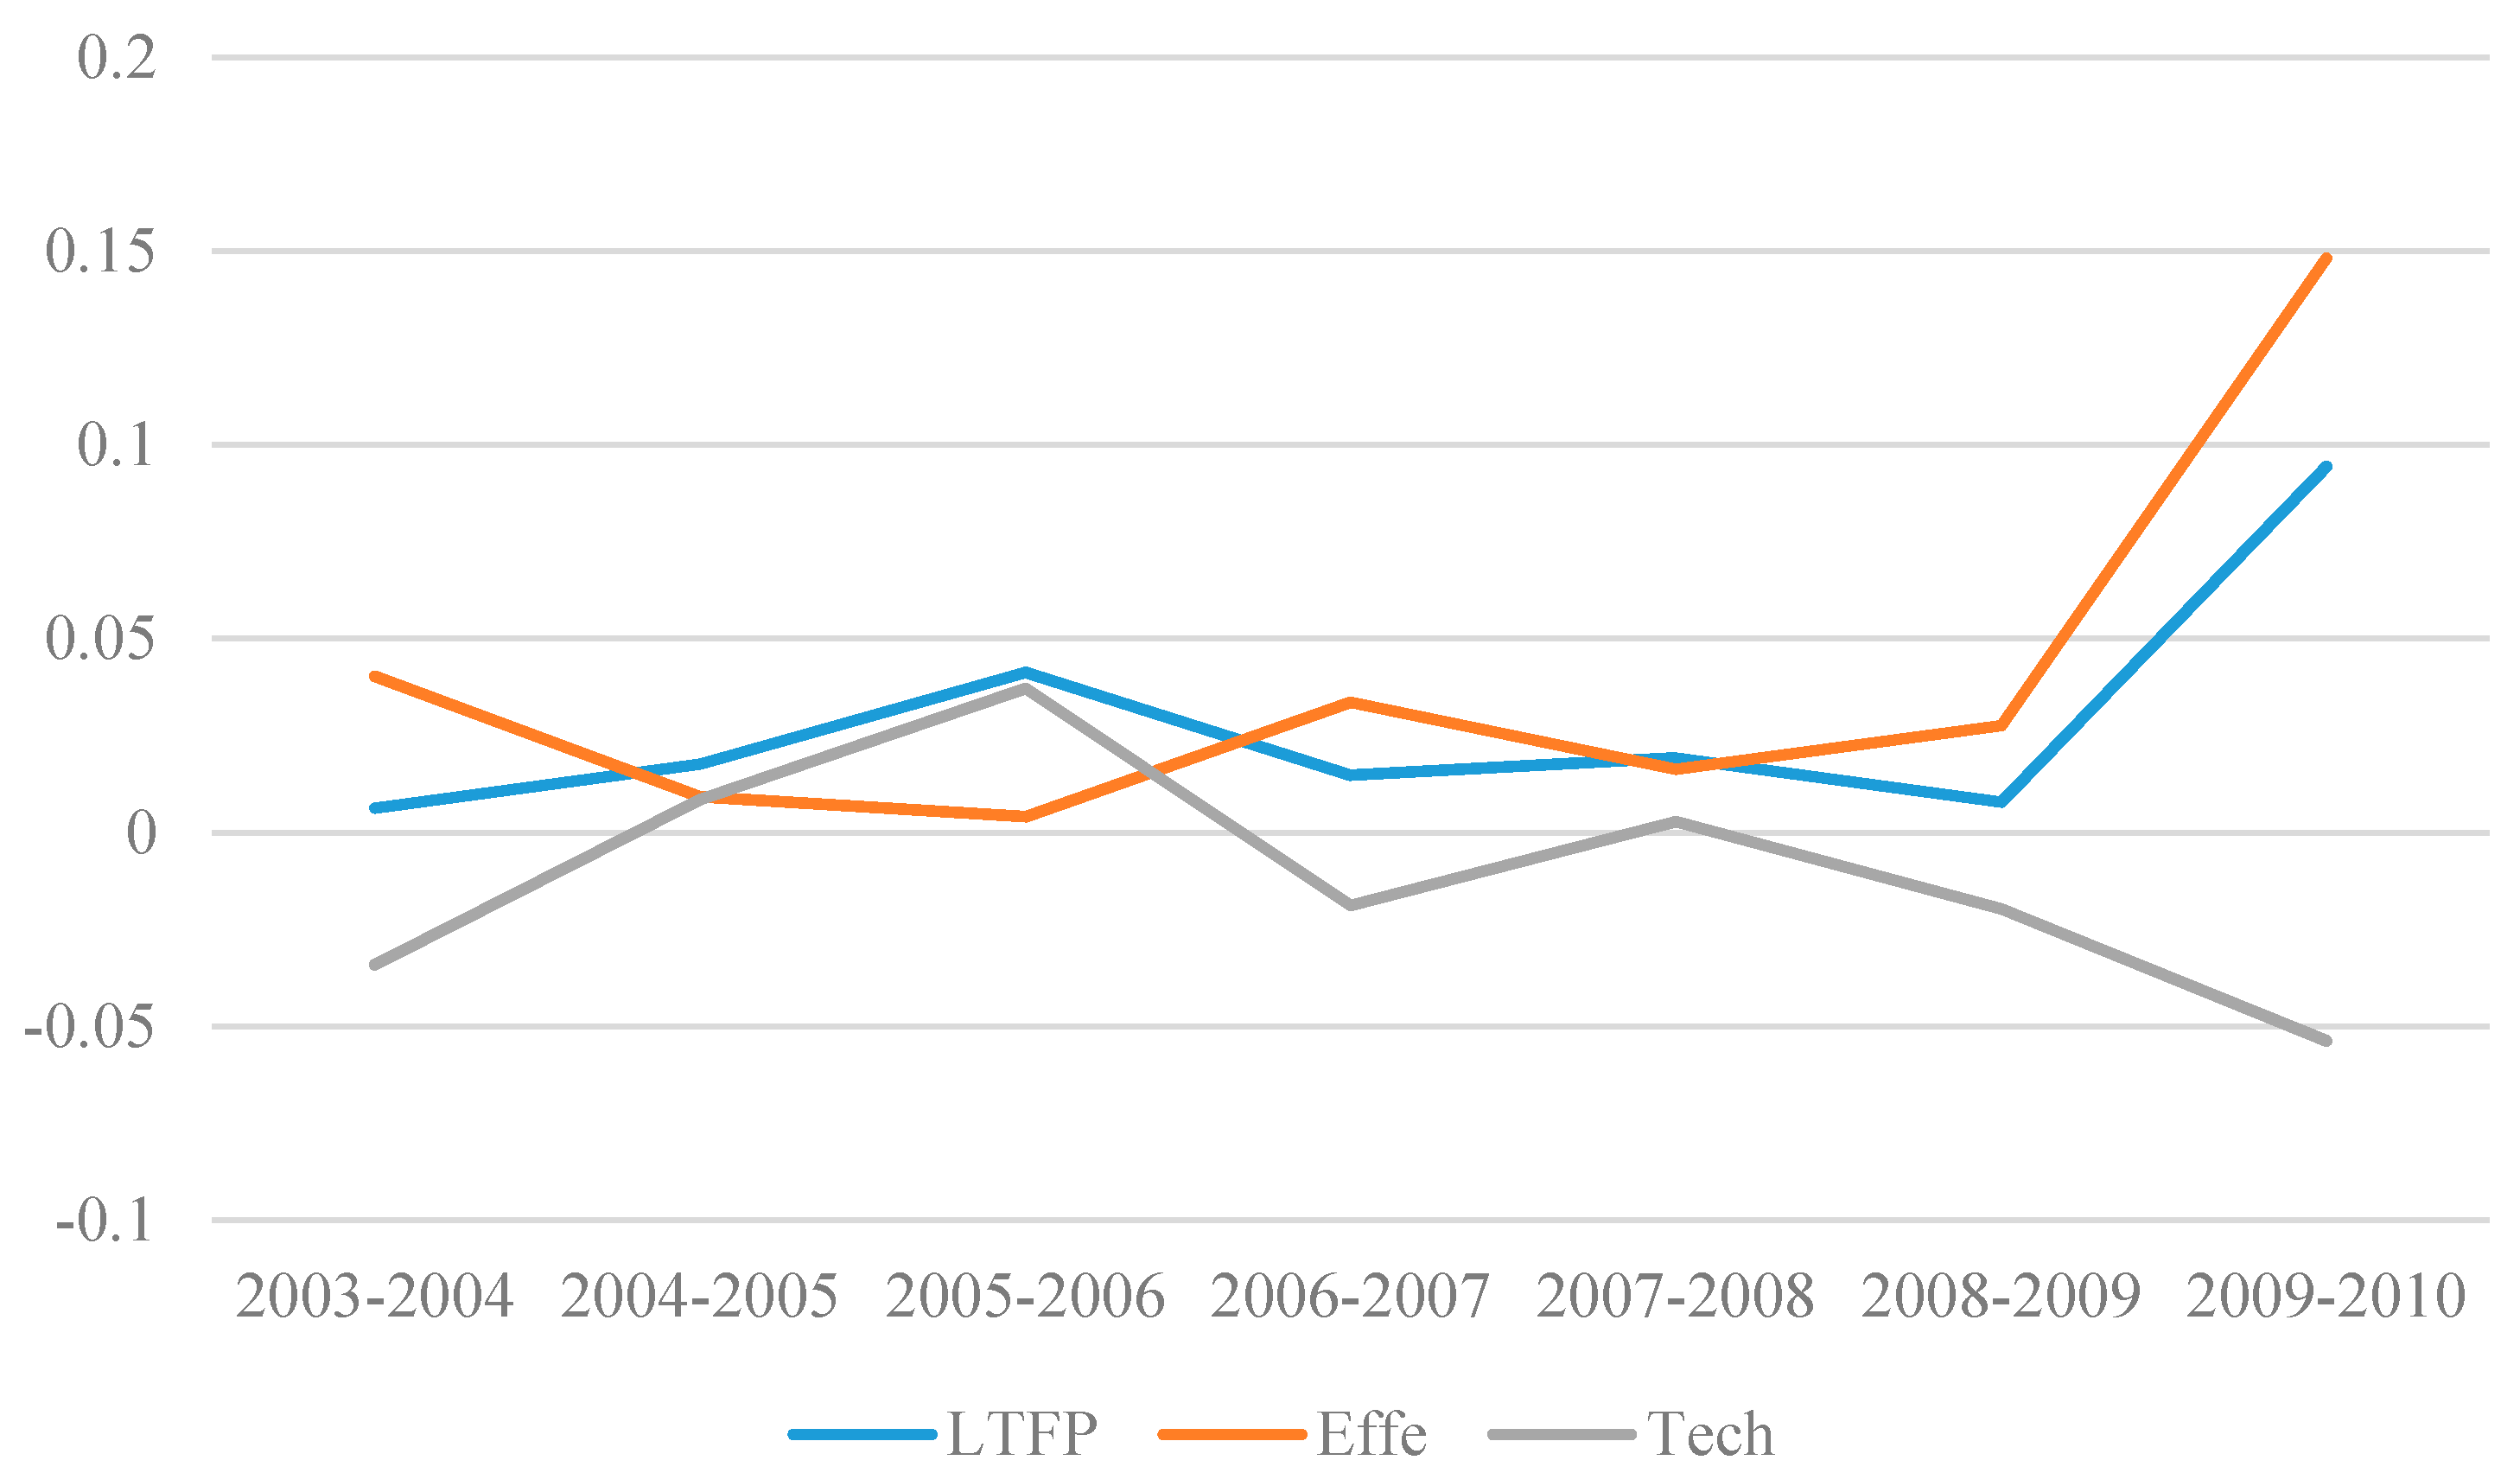
Figure 1 shows that the rate of China’s overall manufacturing green technology progress is changing positively, illustrating manufacture has not been locked as polluting industries in China. Specifically, LTFP is in accelerated phase in 2003–2006, growth rate increased from 0.627% to 4.14%, The engine of growth is mainly from Tech.
It should be highlighted that the changes in technological use efficiency and technological progress have disintegrated during this period. The efficiency of technology utilization decreased from 4.03% to 0.41%, while −3.4% increased to 3.72%. During the years 2007 to 2009, the speed of China’s overall manufacturing green technology progress is slow, but the direction is still positive. The main reason is that the Tech declined significantly, and the insufficient contribution of Effe to the LTFP. There are two reasons for this drop. Firstly, influenced by the global financial crisis in 2008, the enterprises’ R&D fund dropped sharply and insufficient R&D investment in green technologies lead to a slow green technology progress. Secondly, the protection of the environment is the basic state policy of China, the upgrade of green manufacturing conforms to China’s long-term development goals. During this time, the enterprise which causes high pollution and high energy consumption should be shut down gradually, thus avoid the progress of manufacturing technology transfers to polluted technology. In the sample of this paper, the LTFP peaked in 2010 which is 9.45%. The main reason is that technological progress (Tech) showed a spurt of growth, rising from 2.76% in 2009 to 14.82% in 2010.
4. Empirical Results and Discussion
To test for different environmental regulation intensity (in low environmental regulation intensity and high intensity of environmental regulation), how the FDI influence the manufacturing green technology progress, this paper makes an empirical analysis of the four types of manufacturing according to the above-mentioned classification.
In the meantime, in order to ensure the robustness of the regression, we cluster the standard error at the industry level. Econometric model regression results are displayed in
Table 2.
4.1. Analysis of Regression Results under Low Environmental Regulation Intensity
From the regression results, the labor-based FDI and capital-based FDI have differently influence the manufacturing green technology progress, among them, labor-based FDI represented labor intensive which always have a negative spillover effect in the manufacturing green technology progress of China, while capital-based FDI represented capital intensive on the contrary, it also explains why academia has different opinions on the role of FDI spillover effect and its direction.
Specifically, model (1) means in the situation which is low intensity discharge regulation and does not impose additional environmental regulation, when the influence of the labor-based FDI on the rate of China’s manufacturing green technology progress is significantly negative, the influence of the capital-based FDI shows a strong positive spillover effect. When additional sewage charges and emission standards are applied to the model (2), the green technological spillover of the labor-based FDI is negative. However, the coefficient dropped to −0.088; the coefficient of spillover effect in capital-based FDI is slightly reduced, from 0.312 to 0.28, but strengthen environmental standard regulation will reverse transmission force the manufacturing green technology progress of China. It makes up for the loss of FDI in positive externality, which are accord with the “Porter hypothesis” [
41], that is appropriately strengthening environmental regulation will help enterprises to carry out green technological innovation. Models (3) and (4) represent regression results in the low intensity environmental standards. In model (3), two types of FDI influence the rate of the manufacturing green technology progress of the opposite direction. When further imposed additional environmental regulation, we get the model (4). Labor-based FDI still showed a significant negative impact, and the coefficient rose from −0.16 to −0.169, while the coefficient of capital-based FDI was only 0.166. Overall, FDI has a negative impact on China’s green technology progress. The main reason is that the motive of labor-based FDI enters into China is primarily for seeking cheap labor capital and avoid the tighter environmental regulation in their motherland, their investment is mostly located in the bottom of value chain in the industry and assembly links. The link has the least added value, heaviest pollution, lowest technical content in the process of production, it’s not conducive to the host country to promote the efficiency of the manufacturing green technology progress. In contrast, capital-based FDI is mainly involved in the host country’s industry in the form of capital, to obtain a high return on capital. During the process of industrialization in developing countries, capital intensive industries are unable to purchase high environmental performance of mechanical equipment due to the shortage of funds, the capital-based FDI will not only convey the needed funds to upgrade equipment, but also promote the technical level of the local companies in host countries through “demonstration effect” and “learning effect”.
It should be highlighted that in the model (4) the impact of the two types of environmental regulations on the rate of green technology progress has also been differentiated. Among them, the charge regulation hinders the progress of manufacturing green technology, the coefficient is −0.023, while the emission standard regulation has a positive impact, the coefficient is 0.025. This indicates that the charge regulation directly increases the cost of enterprise regulation, may squeeze out the productive investment of the enterprise, and is not conducive to the progress of green technology in the manufacturing industry. Relatively speaking, emission standards are too low, and the emission standard regulation is appropriately raised, and the environmental efficiency that it brings may exceed the economic loss caused by it.
4.2. Analysis of Regression Results under High Environmental Regulation Strength
In high intensity of environmental regulation models, the influence of environmental regulation on the spillover effect of different types of FDI also has differentiation. In high intensity of charge regulation models, the spillover effects of the two types of FDI are not significant at the 10% significance level. However, in the regulation of high-intensity emission standards, only capital-type FDI continues to exert a positive spillover effect.
It is important to note that the industry of high intensity discharge regulation in the model (5), the innovation direction of the enterprise has been deflected, and R&D has been transformed from the negative influence of green technology progress to positive promotion, although not significant at 10% significance level. According to Krysiak [
42], when the environmental regulation achieves a certain intensity will force manufacturers to control the pollution generated from the technology in the R&D process of technology, in order to reduce environmental costs as much as possible, which make technical progress gradually transfer to clean technology. In model (5) and model (6), the negative spillover of labor-based FDI is completely restrained. This indicates that the low intensity of environmental regulation is the main reason for the negative spillover of labor FDI, which indicates that the “pollution haven” hypothesis is established in low intensity environmental regulation industry. However, the positive spillover effect of capital-based FDI becomes insignificant at the 10% significance level. Overhead expenses at the end, however, is a kind of burden outside the manufacturer routine operation, if the government rely too much on administrative commands to realize pollution reduction, it will do harm to green technological positive spillover effect of capital-based FDI. Compare to high intensity discharge regulation, in model (7) which is the regression results of high intensity emission standard regulation and model (8) which added the additional environmental regulation variables, the capital-based FDI always plays a positive green technological spillover effect on China’s manufacturing industry. Moreover, compared with other subgroups, capital-based FDI has a stronger spillover effect in the regulation of high-intensity emission standards, the coefficients reach 0.423 and 0.420 respectively. For a long time, China’s intellectual property protection (IPR) system is still not perfect relative to developed countries. Under the background of weak intensity environmental regulation, capital-based FDI will adopt the environmentally friendly technology, which consistent with the minimum level of environmental regulation in host countries in order to avoid the risk of technology exposure. As a result, when increasing the level of environmental standard regulation, capital-based FDI at the same time will take the corresponding green technology to further enhance the spillover effect of FDI on China’s manufacturing green technology innovation.
4.3. Further Explanatory Other Control Variables
In addition, this paper also analyzes the influence of other control variables on the green technology progress. The regression results show that: (1) Pollution emission intensity (lnNUE) in all models has shown a significant negative effect. It indicates that the higher pollution intensity of production technology, the easier it is for the technology to exhibit pollution bias, which detrimental to the development of green technology [
23]. (2) Cost-profit ratio (lnRCP) is always beneficial to promote green technology progress of China’s manufacturing industry, but it is only in the low intensity environmental regulation industry. This indicates that the tightening of environmental regulation, while reducing pollution emissions, but need to reduce economic output as a price [
43,
44]. (3) The per capital stock (lnk) only played a significant positive role in the low emission standard regulation and high discharge regulation. This indicates that the effect of lnk on the green technological progress of manufacturing industry is not only influenced by the intensity of environmental regulation, but also due to the choice of environmental regulation tools. (4) Energy production efficiency (lnEP) has shown a significant positive effect in all models. According to Porter [
41], Porter and Linde [
45], pollution is a manifestation of wasteful and inefficient use of resources in the production process. The reduction of pollution tends to be synergistic with the improvement of resource utilization. Therefore, strict environmental regulation not only will not weaken the competitiveness of enterprises, it also helps to promote green technology innovations to compensate for “compliance costs”.
5. Conclusions
The spillover influence of FDI on the manufacturing green technology progress has both positive promotion and negative hindrance, which are affected by their own structure and the strength of environmental regulation. Specifically, in the low discharge regulation and low emission standard regulation industry, labor-based FDI has a significant negative spillover effect, and capital-based FDI has a significant positive spillover effect. However, in the high-intensity environmental regulation industry, the negative influence of labor-based FDI is completely restrained, and capital-based FDI continues to play a significant positive green technological spillover effects.
The labor-based FDI and capital-based FDI generated differentiation in the direction of green technological spillover, and have path dependence. In any intensity of environmental regulation and whether impose additional environmental regulation, labor-based FDI shows negative spillover effect from beginning to end, the capital-based FDI performs positive green technological spillover effect all the time. As a result, developing countries including China should set about from two aspects. On the one hand, making reasonable environment policy to inhibit adverse impacts of labor-intensive foreign investment on the environment. On the other hand, formulating reasonable industrial policy, increasing the intensity of open, attracting foreign capital into heavy industries which are capital-intensive, and raising the level of green technology in domestic enterprises.
The direction and magnitude of foreign direct investment’s green technological spillover effect is influenced by the strength and tool of environmental regulation. In the low intensity of environmental regulation industry, the labor-based FDI performs significant negative spillover effect, but the negative spillover effect can be eased through strengthening environmental regulation. Noteworthily, in the industries which have different strength of environmental regulation, the effect of two environmental regulation tools is obviously different. In the industry of low-intensity environmental regulation, the effect of discharge regulation promoting green technological spillover effect of FDI is relatively good, but in the industry of high-intensity environmental regulation, the effect of emission standard regulation is better than the discharge regulation. Therefore, when the host countries are making environmental policy, it should not only stipulate reasonable intensity of environmental regulation according to industry characteristics, but also apply flexibly in terms of the different effectiveness of the environmental regulation tools, which will suppress the negative spillover of FDI and further improve the positive green technological spillover effect of FDI.

