The Effect of Seasonal Floods on Health: Analysis of Six Years of National Health Data and Flood Maps

Abstract
:1. Introduction
2. Materials and Methods
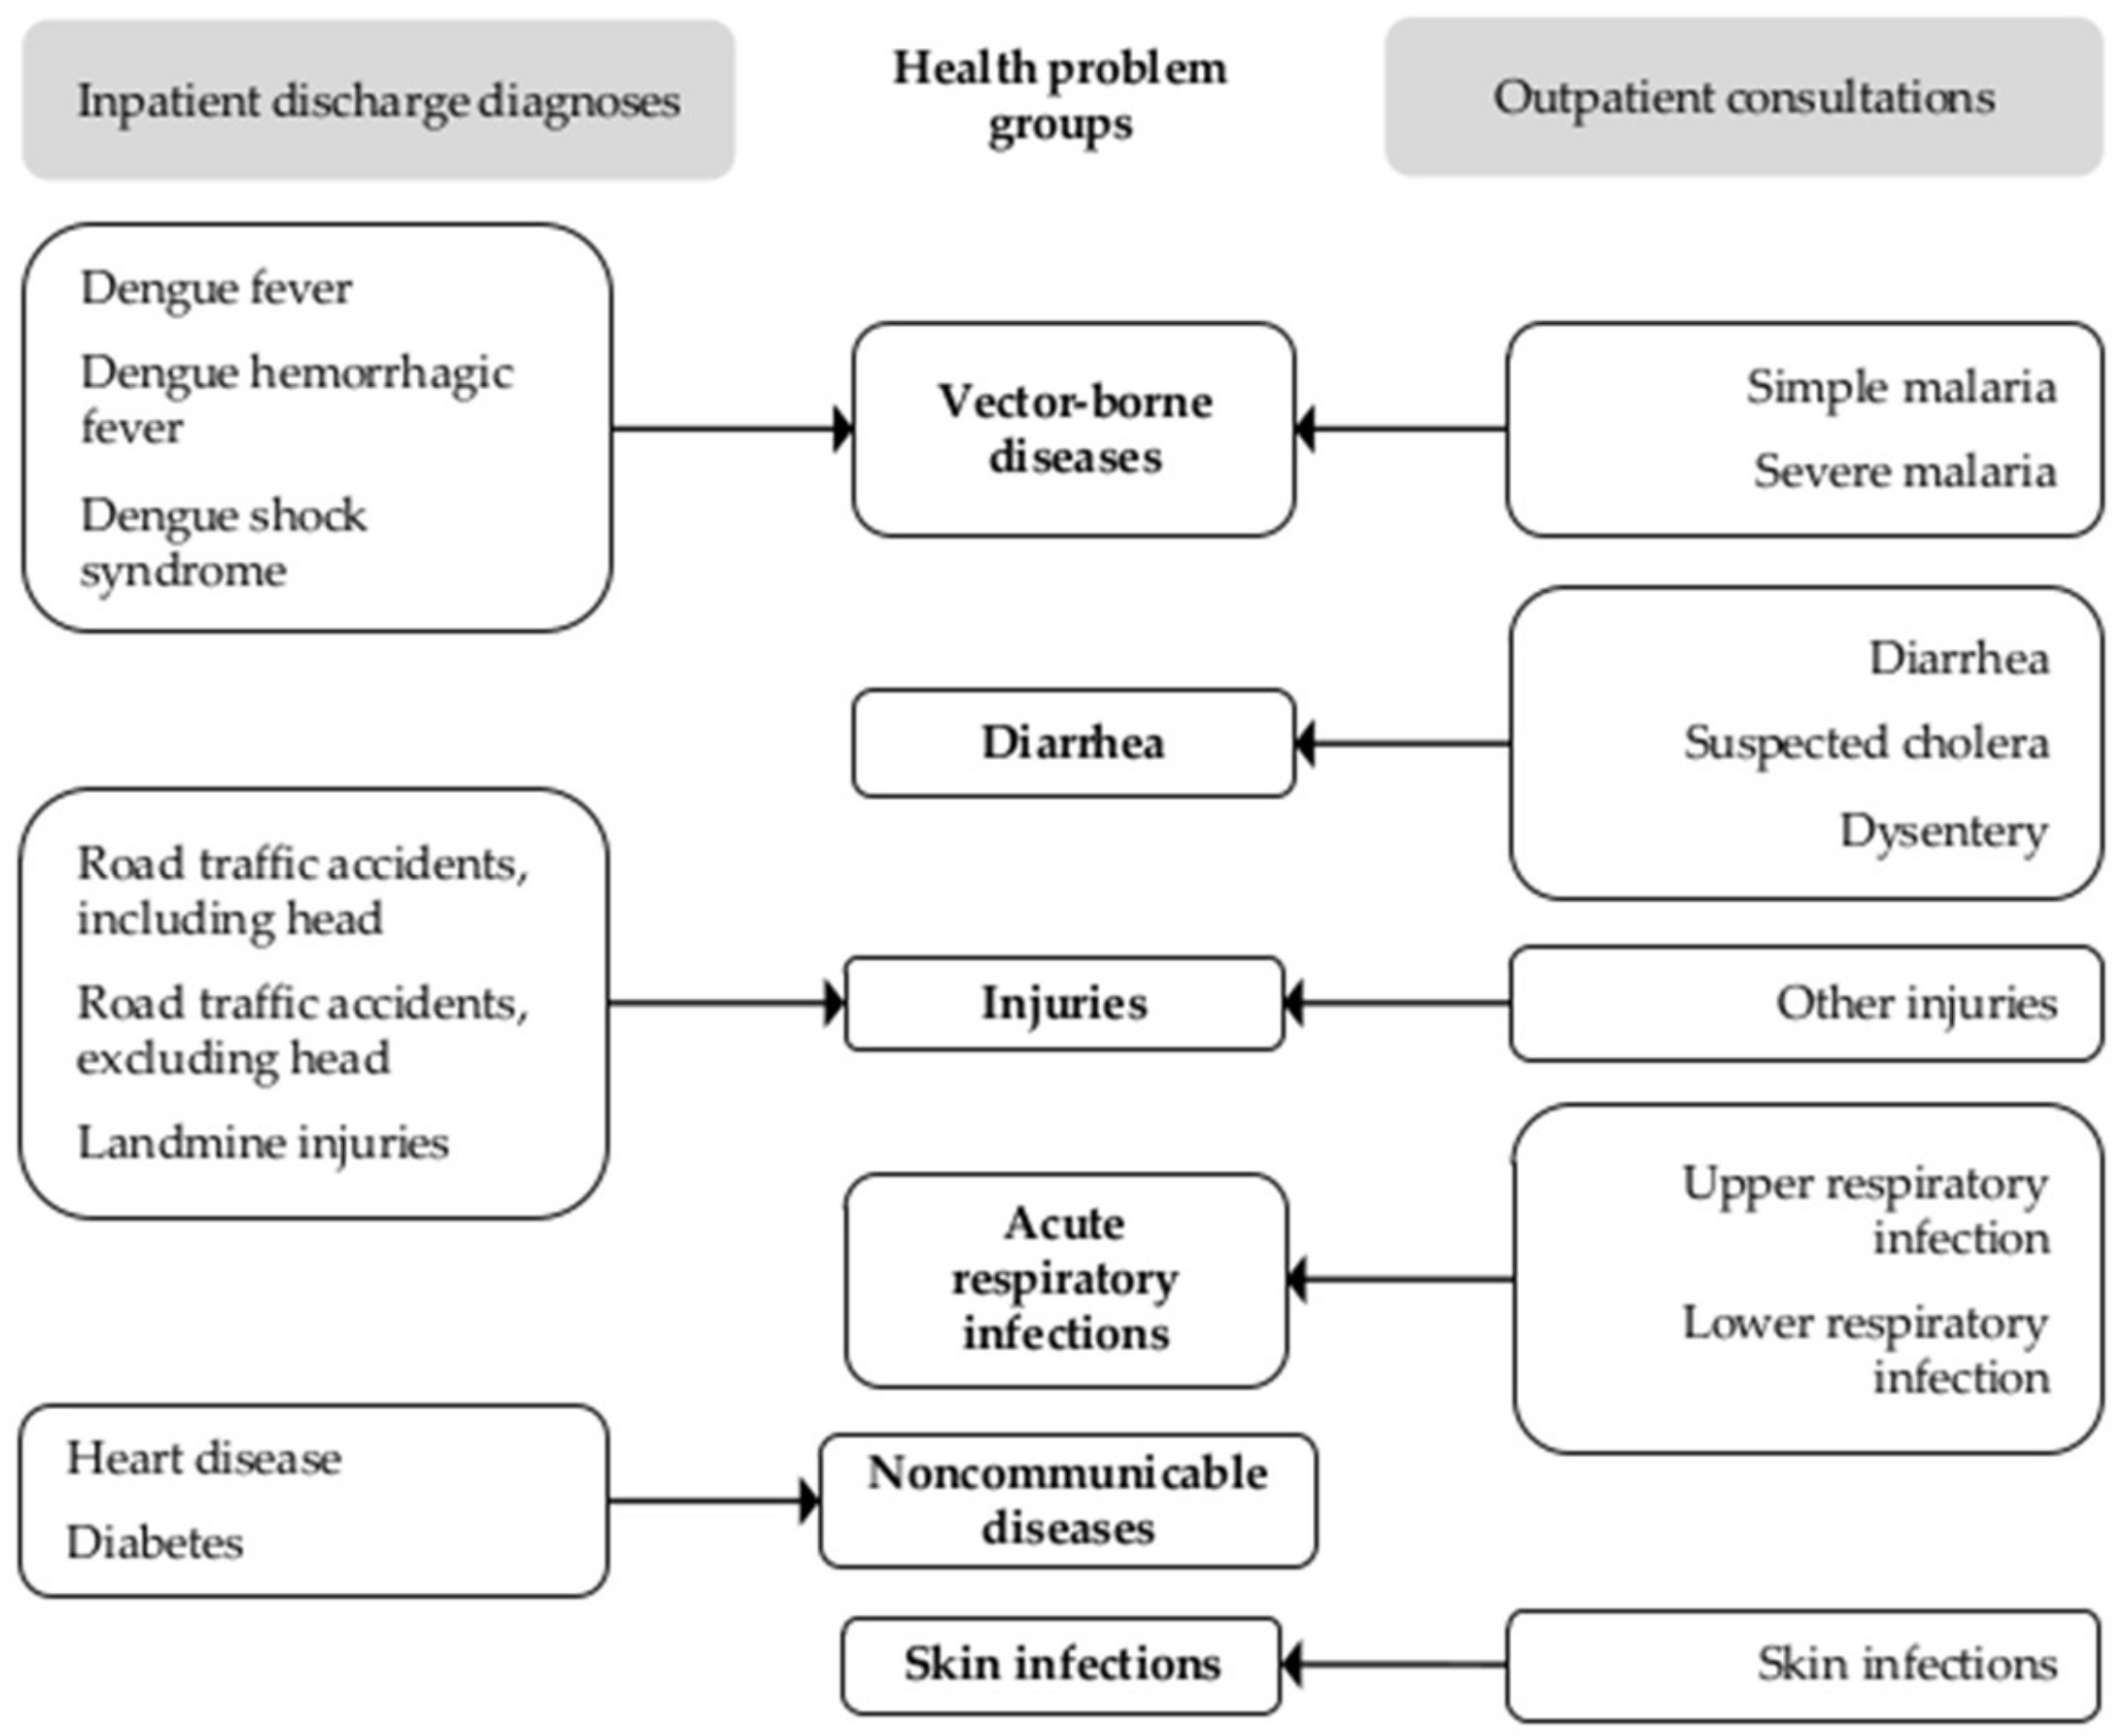
2.1. Data
2.2. Analysis
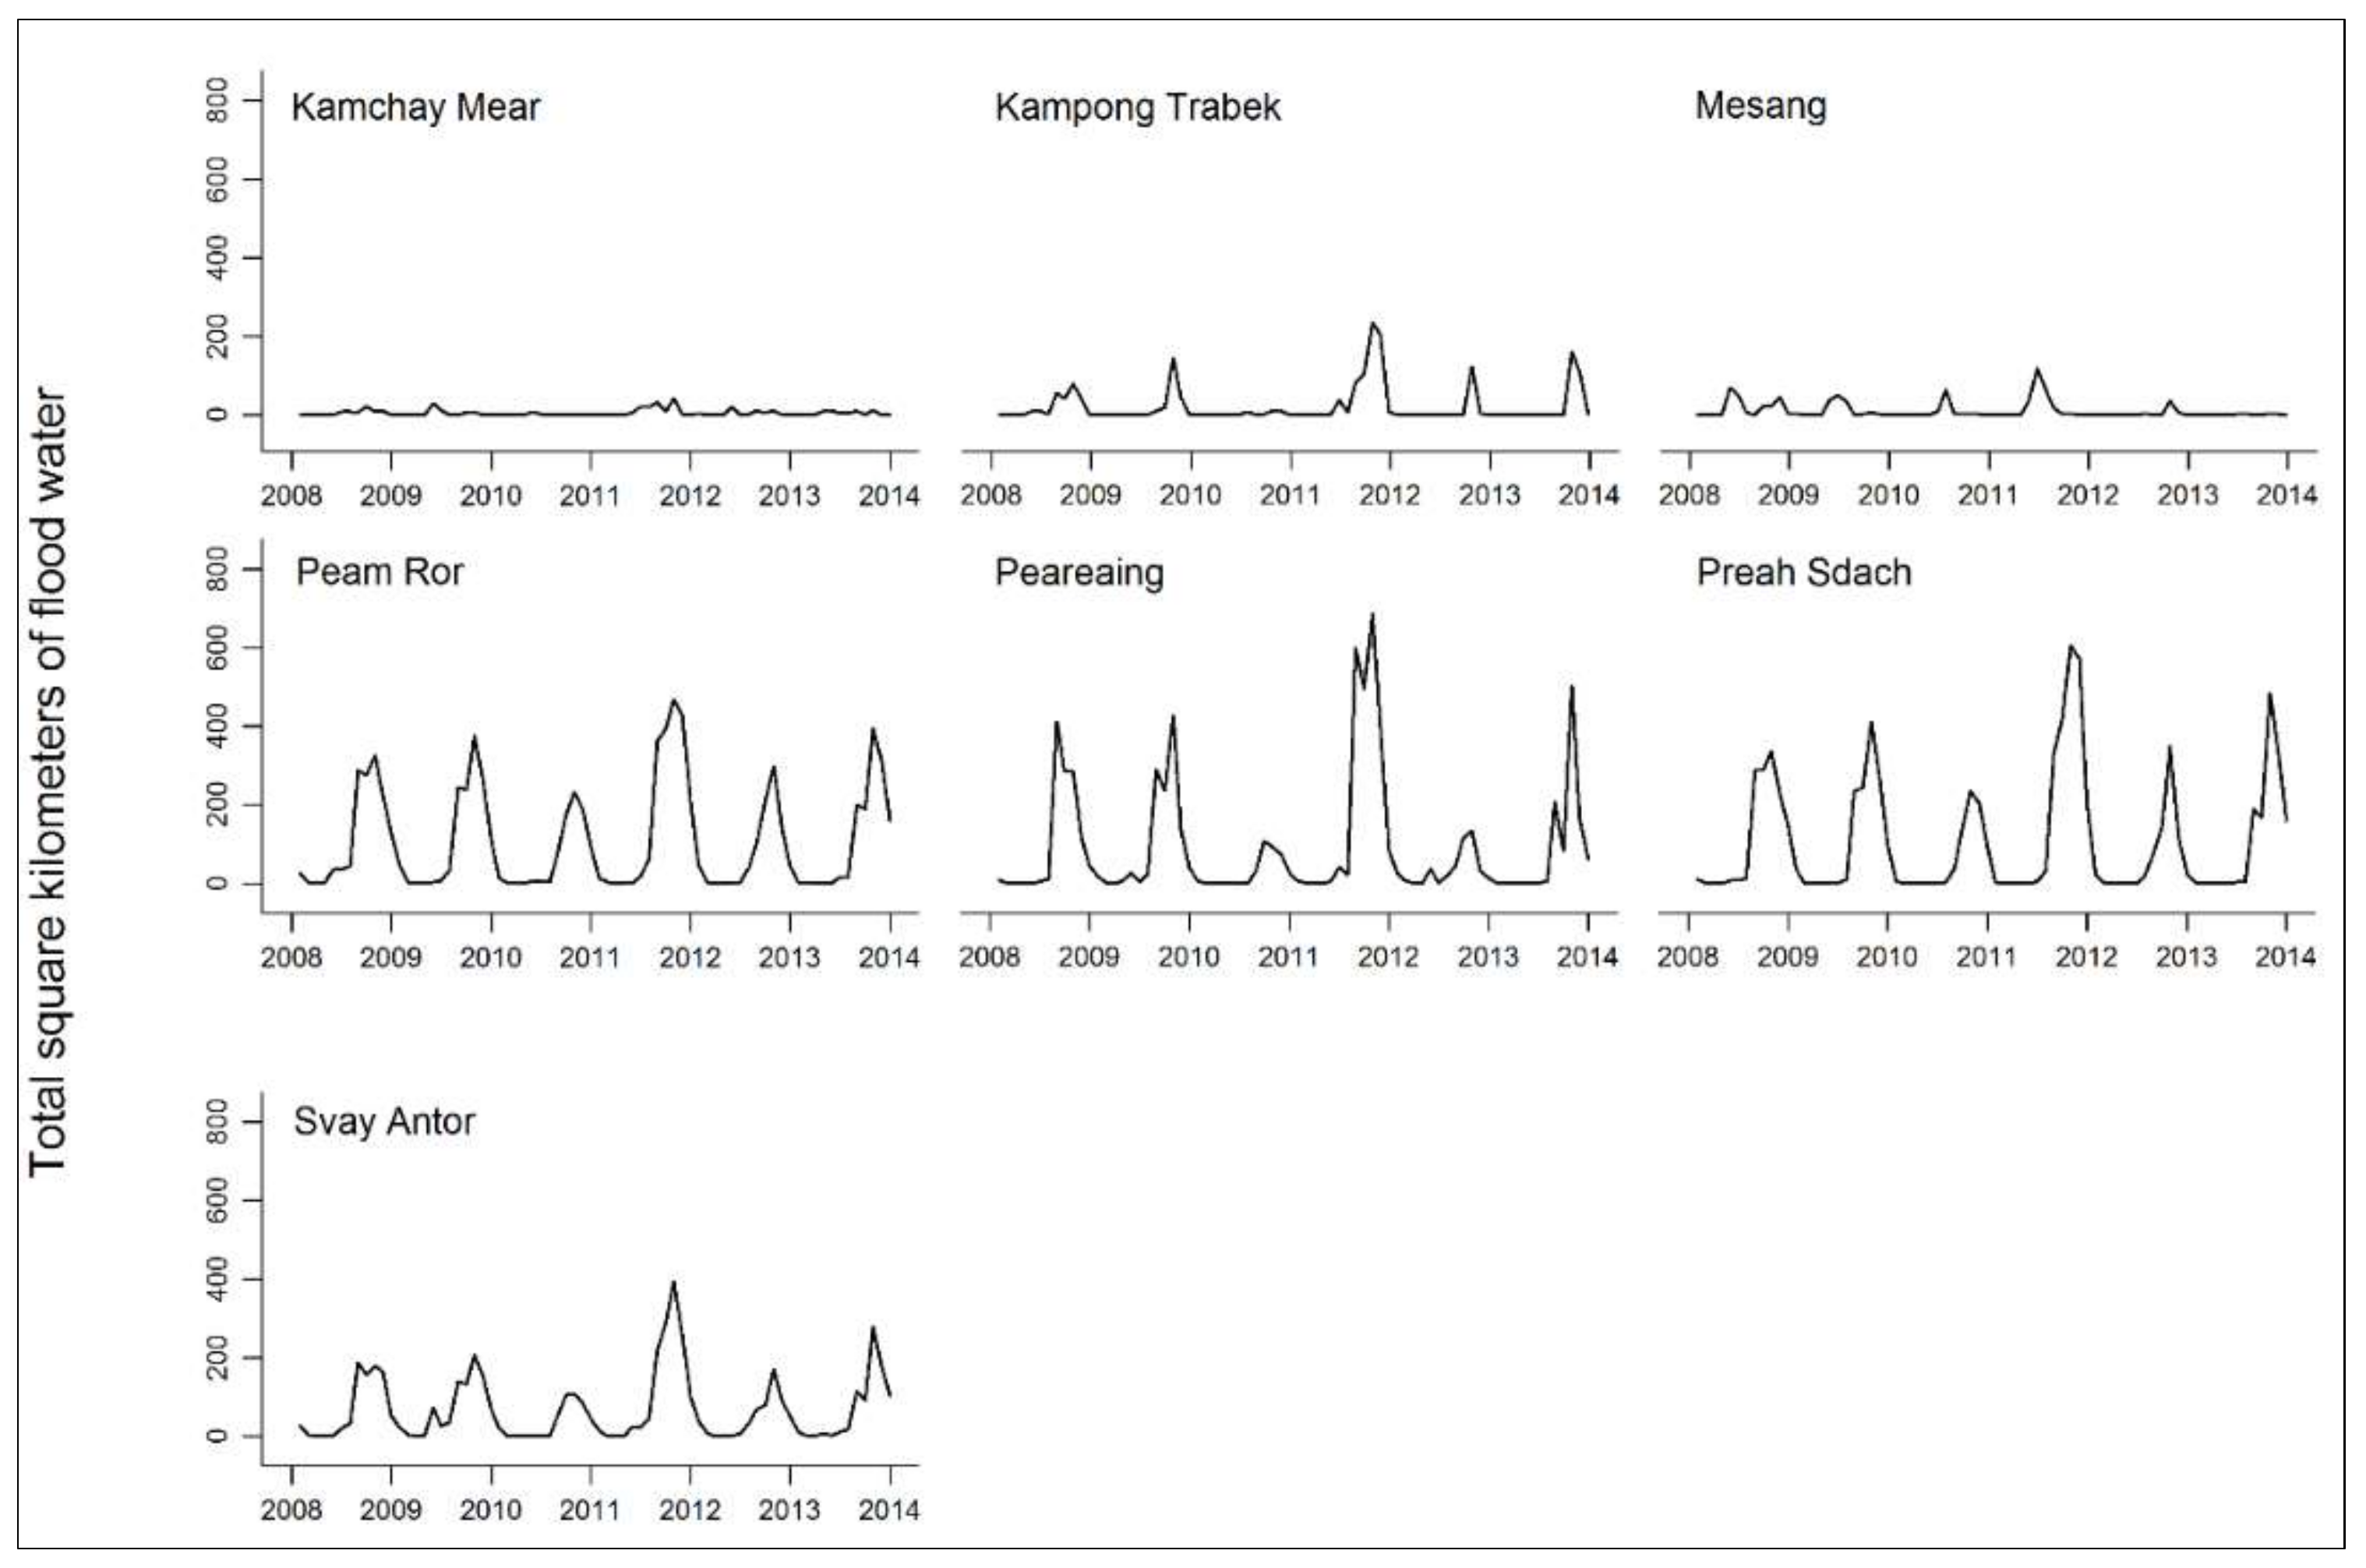
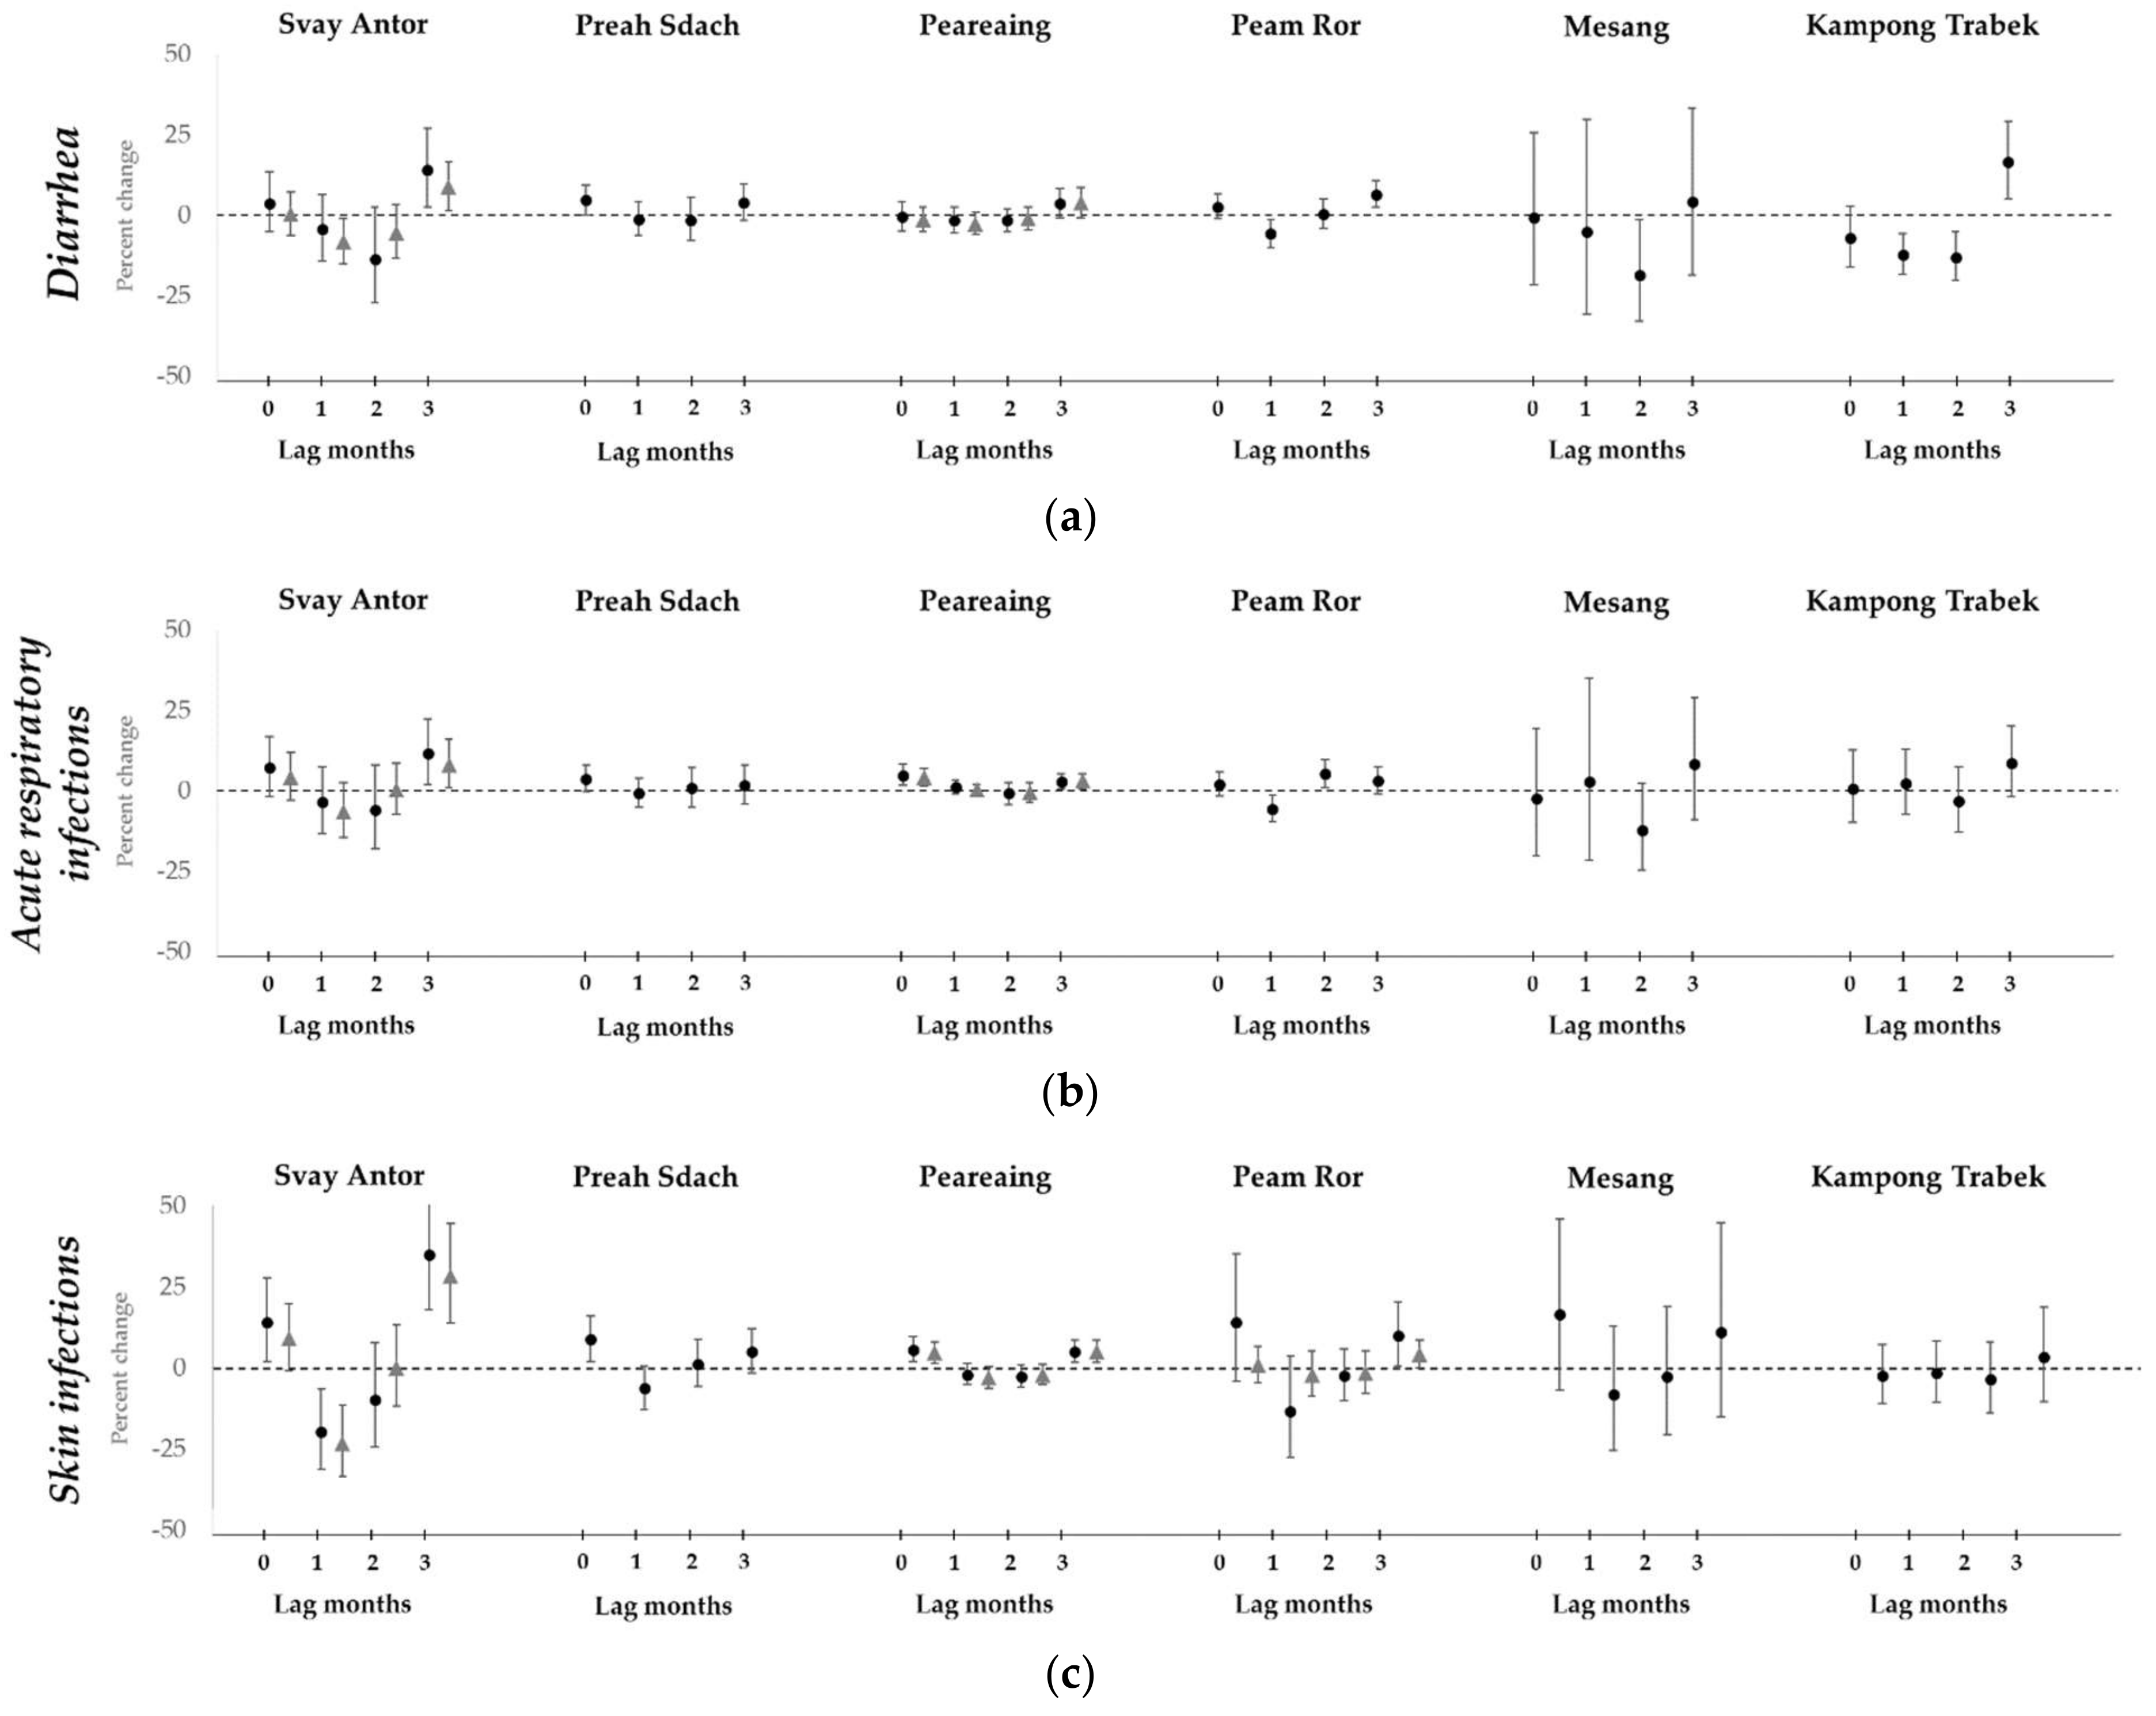
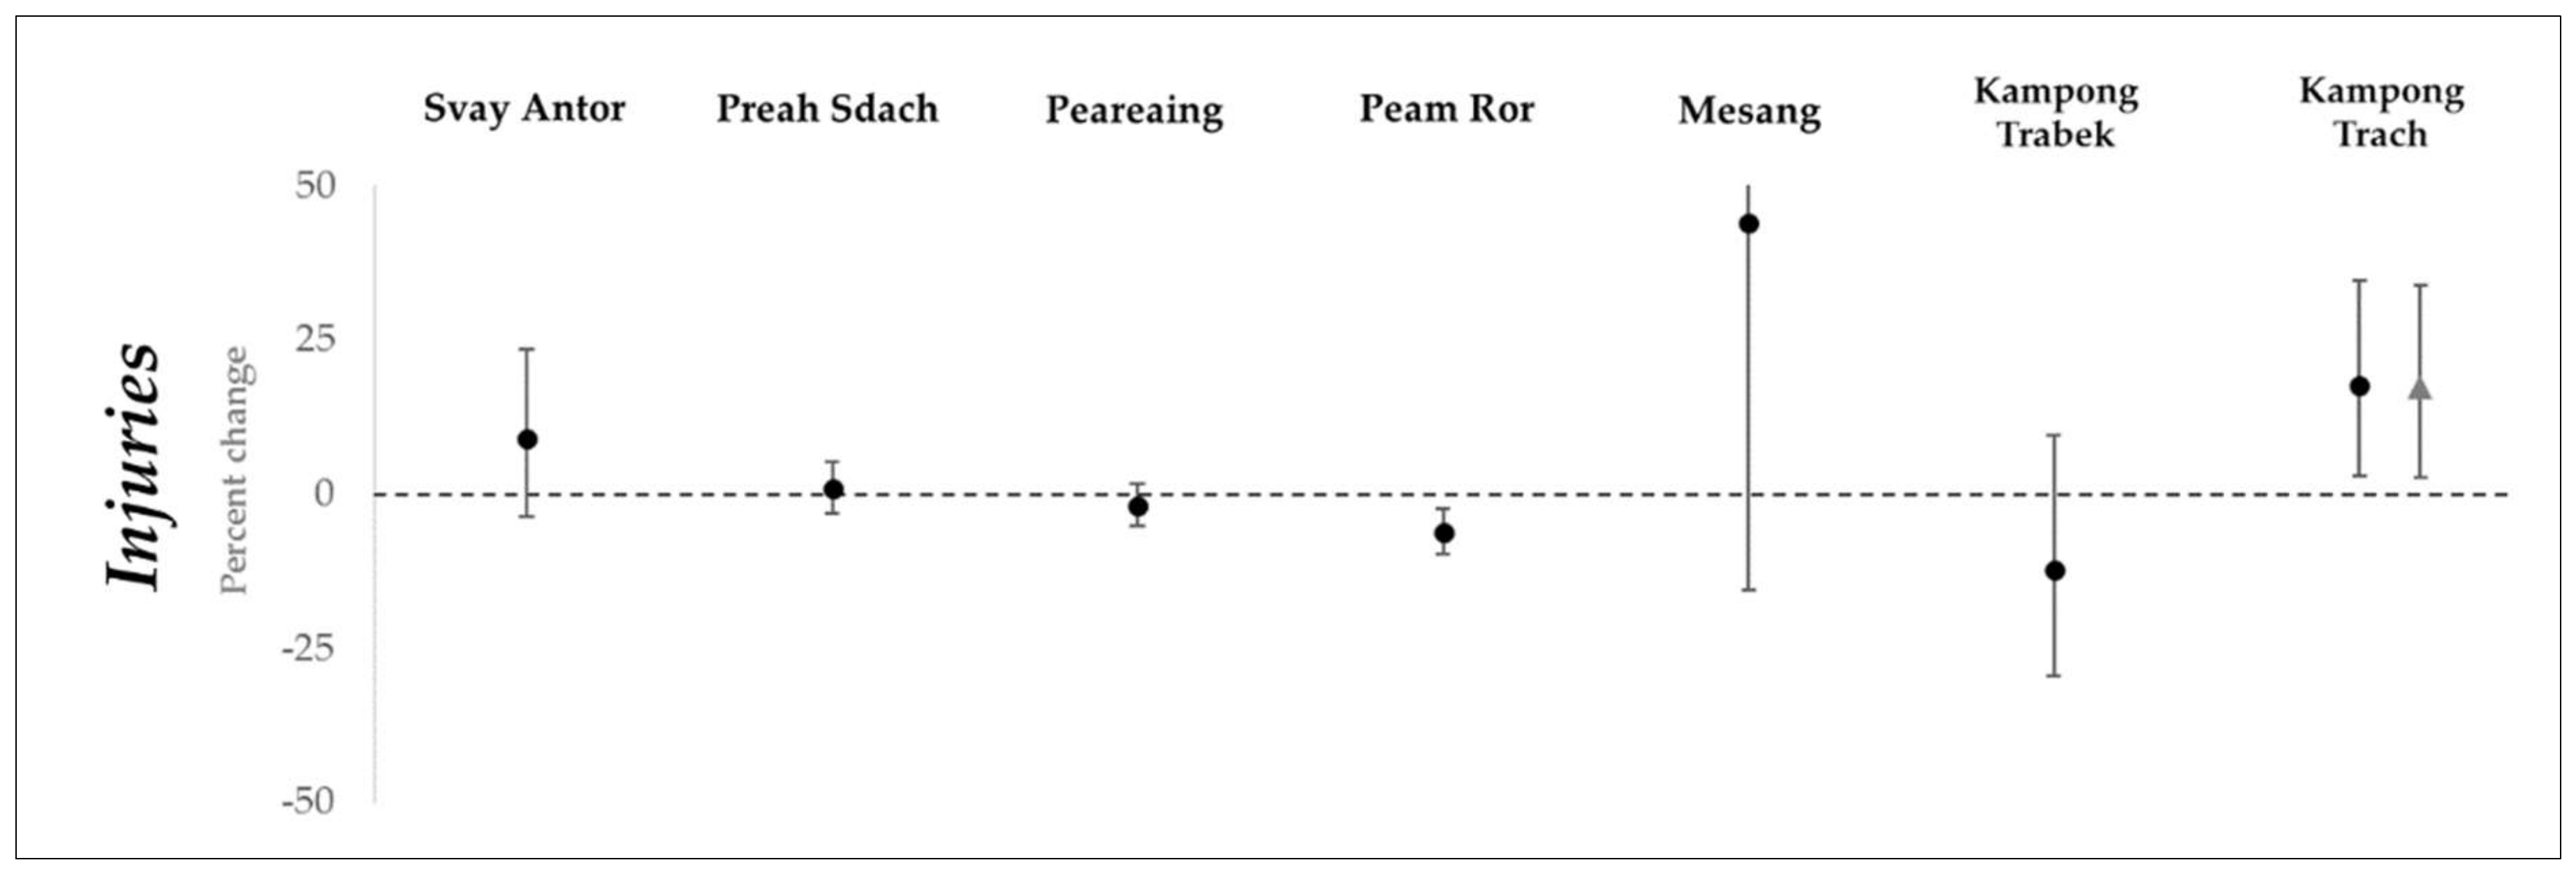
3. Results
4. Discussion
5. Conclusions
Supplementary Materials
Acknowledgments
Author Contributions
Conflicts of Interest
References
- Centre for Research on the Epidemiology of Disasters (CRED); United Nations Office for Disaster Risk Reduction (UNISDR). The Human Cost of Weather-Related Disasters: 1995–2015; UNISDR: Brussels, Belgium; Geneva, Switzerland, 2015. [Google Scholar]
- Ahern, M.; Kovats, R.S.; Wilkinson, P.; Few, R.; Matthies, F. Global Health Impacts of Floods: Epidemiologic Evidence. Epidemiol. Rev. 2005, 27, 36–46. [Google Scholar] [CrossRef] [PubMed]
- Du, W.; FitzGerald, G.J.; Clark, M.; Hou, X.Y. Health impacts of floods. Prehosp. Disaster Med. 2010, 25, 265–272. [Google Scholar] [CrossRef] [PubMed]
- Saulnier, D.D.; Ribacke Brolin, K.; Von Schreeb, J. No calm after the storm: A systematic review of human health following flood and storm disasters. Prehosp. Disaster Med. 2017, 32, 568–579. [Google Scholar] [CrossRef] [PubMed]
- National Committee for Disaster Management; United Nations Development Programme (UNDP). Cambodia 2013: Post-Flood Early Recovery Need Assessment Report; National Committee for Disaster Management; UNDP: Phnom Penh, Cambodia, 2014.
- World Health Organization (WHO); Public Health England. Floods in the WHO European Region: Health Effects and Their Prevention; WHO: Copenhagen, Denmark, 2013. [Google Scholar]
- Birnbaum, M.L.; Adibhatla, S.; Dudek, O.; Ramsel-Miller, J. Categorization and Analysis of Disaster Health Publications: An Inventory. Prehosp. Disaster Med. 2017, 32, 473–482. [Google Scholar] [CrossRef] [PubMed]
- Mekong River Commission (MRC). Annual Mekong Flood Report 2014; Mekong River Commission: Phnom Penh, Vientiane, 2015. [Google Scholar]
- United Nations International Strategy for Disaster Reduction (UNISDR); Economic and Social Commission for Asia and the Pacific (ESCAP). Reducing Vulnerability and Exposure to Disasters: The Asia-Pacific Disaster Report 2012; UNISDR; ESCAP: Bangkok, Thailand, 2012. [Google Scholar]
- Guha-Sapir, D. EM-DAT: The Emergency Events Database; UcdL (UCL): Brussels, Belgium, 2015. [Google Scholar]
- Disasters: Cambodia. Available online: https://reliefweb.int/disasters?country=48#content (accessed on 2 February 2018).
- Cambodia Health Management Information System. Available online: http://hismohcambodia.org/public/ (accessed on 17 March 2017).
- MODIS Near Real-Time Global Flood Mapping Project. Available online: https://floodmap.modaps.eosdis.nasa.gov/index.php (accessed on 2 July 2017).
- Nigro, J.; Slayback, D.; Policelli, F.; Brakenridge, G.R. NASA/DFO MODIS Near Real-Time (NRT) Global Flood Mapping Product: Evaluation of Flood and Permanent Water Detection. 2014. Available online: https://floodmap.modaps.eosdis.nasa.gov/documents/NASAGlobalNRTEvaluationSummary_v4.pdf (accessed on 2 July 2017).
- World Health Organization (WHO). Assessment of Health Facility Data Quality: Data Quality Report Card—Cambodia, 2012; WHO: Geneva, Switzerland, 2012. [Google Scholar]
- World Health Organization (WHO). Assessment of Health Facility Data Quality: Data Quality Report Card—Cambodia, 2011; WHO: Geneva, Switzerland, 2011. [Google Scholar]
- Zeger, S.L.; Irizarry, R.; Peng, R.D. On time series analysis of public health and biomedical data. Annu. Rev. Public Health 2006, 27, 57–79. [Google Scholar] [CrossRef] [PubMed]
- Bjerring, A.W.; Lier, M.E.; Rod, S.M.; Vestby, P.F.; Melf, K.; Endreseth, B.H.; Salvesen, O.; von Schreeb, J.; Wibe, A.; Kamara, T.B.; et al. Assessing cesarean section and inguinal hernia repair as proxy indicators of the total number of surgeries performed in Sierra Leone in 2012. Surgery 2015, 157, 836–842. [Google Scholar] [CrossRef] [PubMed]
- Xu, X.; Ding, G.; Zhang, Y.; Liu, Z.; Liu, Q.; Jiang, B. Quantifying the impact of floods on bacillary dysentery in Dalian City, China, from 2004 to 2010. Disaster Med. Public 2017, 11, 190–195. [Google Scholar] [CrossRef] [PubMed]
- Hashizume, M.; Wagatsuma, Y.; Faruque, A.S.; Hayashi, T.; Hunter, P.R.; Armstrong, B.; Sack, D.A. Factors determining vulnerability to diarrhoea during and after severe floods in Bangladesh. J. Water Health 2008, 6, 323–332. [Google Scholar] [CrossRef] [PubMed]
- Schwartz, B.S.; Harris, J.B.; Khan, A.I.; Larocque, R.C.; Sack, D.A.; Malek, M.A.; Faruque, A.S.; Qadri, F.; Calderwood, S.B.; Luby, S.P.; et al. Diarrheal epidemics in Dhaka, Bangladesh, during three consecutive floods: 1988, 1998, and 2004. Am. J. Trop. Med. Hyg. 2006, 74, 1067–1073. [Google Scholar] [PubMed]
- Milojevic, A.; Armstrong, B.; Hashizume, M.; McAllister, K.; Faruque, A.; Yunus, M.; Kim Streatfield, P.; Moji, K.; Wilkinson, P. Health effects of flooding in rural Bangladesh. Epidemiology 2012, 23, 107–115. [Google Scholar] [CrossRef] [PubMed]
- Davies, G.I.; McIver, L.; Kim, Y.; Hashizume, M.; Iddings, S.; Chan, V. Water-borne diseases and extreme weather events in Cambodia: Review of impacts and implications of climate change. Int. J. Environ. Res. Public Health 2015, 12, 191–213. [Google Scholar] [CrossRef] [PubMed]
- National Institute of Statistics Cambodia; Director General for Health Cambodia; ICF International. Cambodia Demographic and Health Survey 2014; National Institute of Statistics Cambodia; Director General for Health Cambodia; ICF International: Phnom Penh, Cambodia, 2015.
- World Bank. World DataBank. Available online: http://databank.worldbank.org/data/home.aspx (accessed on 15 March 2018).
- World Bank. Where Have All the Poor Gone? Cambodia Poverty Assessment 2013; World Bank: Washington, DC, USA, 2014. [Google Scholar]
- World Health Organization (WHO). The Kingdom of Cambodia Health System Review; World Health Organization Regional Office for the Western Pacific: Geneva, Switzerland, 2015. [Google Scholar]
- Bellos, A.; Mulholland, K.; O’Brien, K.L.; Qazi, S.A.; Gayer, M.; Checchi, F. The burden of acute respiratory infections in crisis-affected populations: A systematic review. Confl. Health 2010, 4, 3. [Google Scholar] [CrossRef] [PubMed]
- Bich, T.H.; Quang, L.N.; Ha, L.T.T.; Hanh, T.T.; Guha-Sapir, D. Impacts of flood on health: Epidemiologic evidence from Hanoi, Vietnam. Global Health Action 2011, 4, 6356. [Google Scholar] [CrossRef] [PubMed]
- Cann, K.F.; Thomas, D.R.; Salmon, R.L.; Wyn-Jones, A.P.; Kay, D. Extreme water-related weather events and waterborne disease. Epidemiol. Infect. 2013, 141, 671–686. [Google Scholar] [CrossRef] [PubMed]
- Euripidou, E.; Murray, V. Public health impacts of floods and chemical contamination. J. Public Health 2004, 26, 376–383. [Google Scholar] [CrossRef] [PubMed]
- World Health Organization (WHO); The United Nations Children’s Fund (UNICEF). Progress on Drinking Water, Sanitation and Hygiene: 2017 Update and SDG Baselines; WHO; UNICEF: Geneva, Switzerland, 2017. [Google Scholar]
- National Committee for Disaster Management Cambodia; United Nations Office for Disaster Risk Reduction (UNISDR). CamDi: Understand the Past, Save the Future: Analysis Report 1996–2013; National Committee for Disaster Management Cambodia; UNISDR: Phnom Penh, Cambodia, 2014.
- Lorent, N.; Choun, K.; Malhotra, S.; Koeut, P.; Thai, S.; Khun, K.E.; Colebunders, R.; Lynen, L. Challenges from Tuberculosis Diagnosis to Care in Community-Based Active Case Finding among the Urban Poor in Cambodia: A Mixed-Methods Study. PLoS ONE 2015, 10, e0130179. [Google Scholar] [CrossRef] [PubMed]
- Global Burden of Disease Collaborative Network. Global Burden of Disaster Study 2016 (GBD 2016) Results; Institute for Health Metrics and Evaluation: Seattle, WA, USA, 2017. [Google Scholar]
- Choi, Y.; Tang, C.; McIver, L.; Hashizume, M.; Chan, V.; Abeyasinghe, R.; Iddings, S.; Huy, R. Effects of weather factors on dengue fever incidence and implications for interventions in Cambodia. BMC Public Health 2016, 16, 241. [Google Scholar] [CrossRef] [PubMed]
- Khun, S.; Manderson, L. Health seeking and access to care for children with suspected dengue in Cambodia: An ethnographic study. BMC Public Health 2007, 7, 262. [Google Scholar] [CrossRef] [PubMed] [Green Version]
- King, H.; Keuky, L.; Seng, S.; Khun, T.; Roglic, G.; Pinget, M. Diabetes and associated disorders in Cambodia: Two epidemiological surveys. Lancet 2005, 366, 1633–1639. [Google Scholar] [CrossRef]
- Ir, P.; Men, C.; Lucas, H.; Meessen, B.; Decoster, K.; Bloom, G.; Damme, W.V. Self-reported serious illness in rural Cambodia: A cross-sectional survey. PLoS ONE 2010, 5, e10930. [Google Scholar] [CrossRef] [PubMed]
- Goyet, S.; Rammaert, B.; McCarron, M.; Khieu, V.; Fournier, I.; Kitsutani, P.; Ly, S.; Mounts, A.; Letson, W.G.; Buchy, P.; et al. Mortality in Cambodia: An 18-month prospective community-based surveillance of all-age deaths using verbal autopsies. Asia Pac. J. Public Health 2015, 27, 2458–2470. [Google Scholar] [CrossRef] [PubMed]
- Bigdeli, M.; Jacobs, B.; Men, C.R.; Nilsen, K.; Van Damme, W.; Dujardin, B. Access to Treatment for Diabetes and Hypertension in Rural Cambodia: Performance of Existing Social Health Protection Schemes. PLoS ONE 2016, 11, e0146147. [Google Scholar] [CrossRef] [PubMed]
- Jacobs, B.; Hill, P.; Bigdeli, M.; Men, C. Managing non-communicable diseases at health district level in Cambodia: A systems analysis and suggestions for improvement. BMC Health Serv. Res. 2016, 16, 32. [Google Scholar] [CrossRef] [PubMed]
- NASA NRT Global Flood Mapping. NASA GSFC MODIS Flood Mapping Products README; NASA NRT Global Flood Mapping: Greenbelt, MD, USA, 2017.


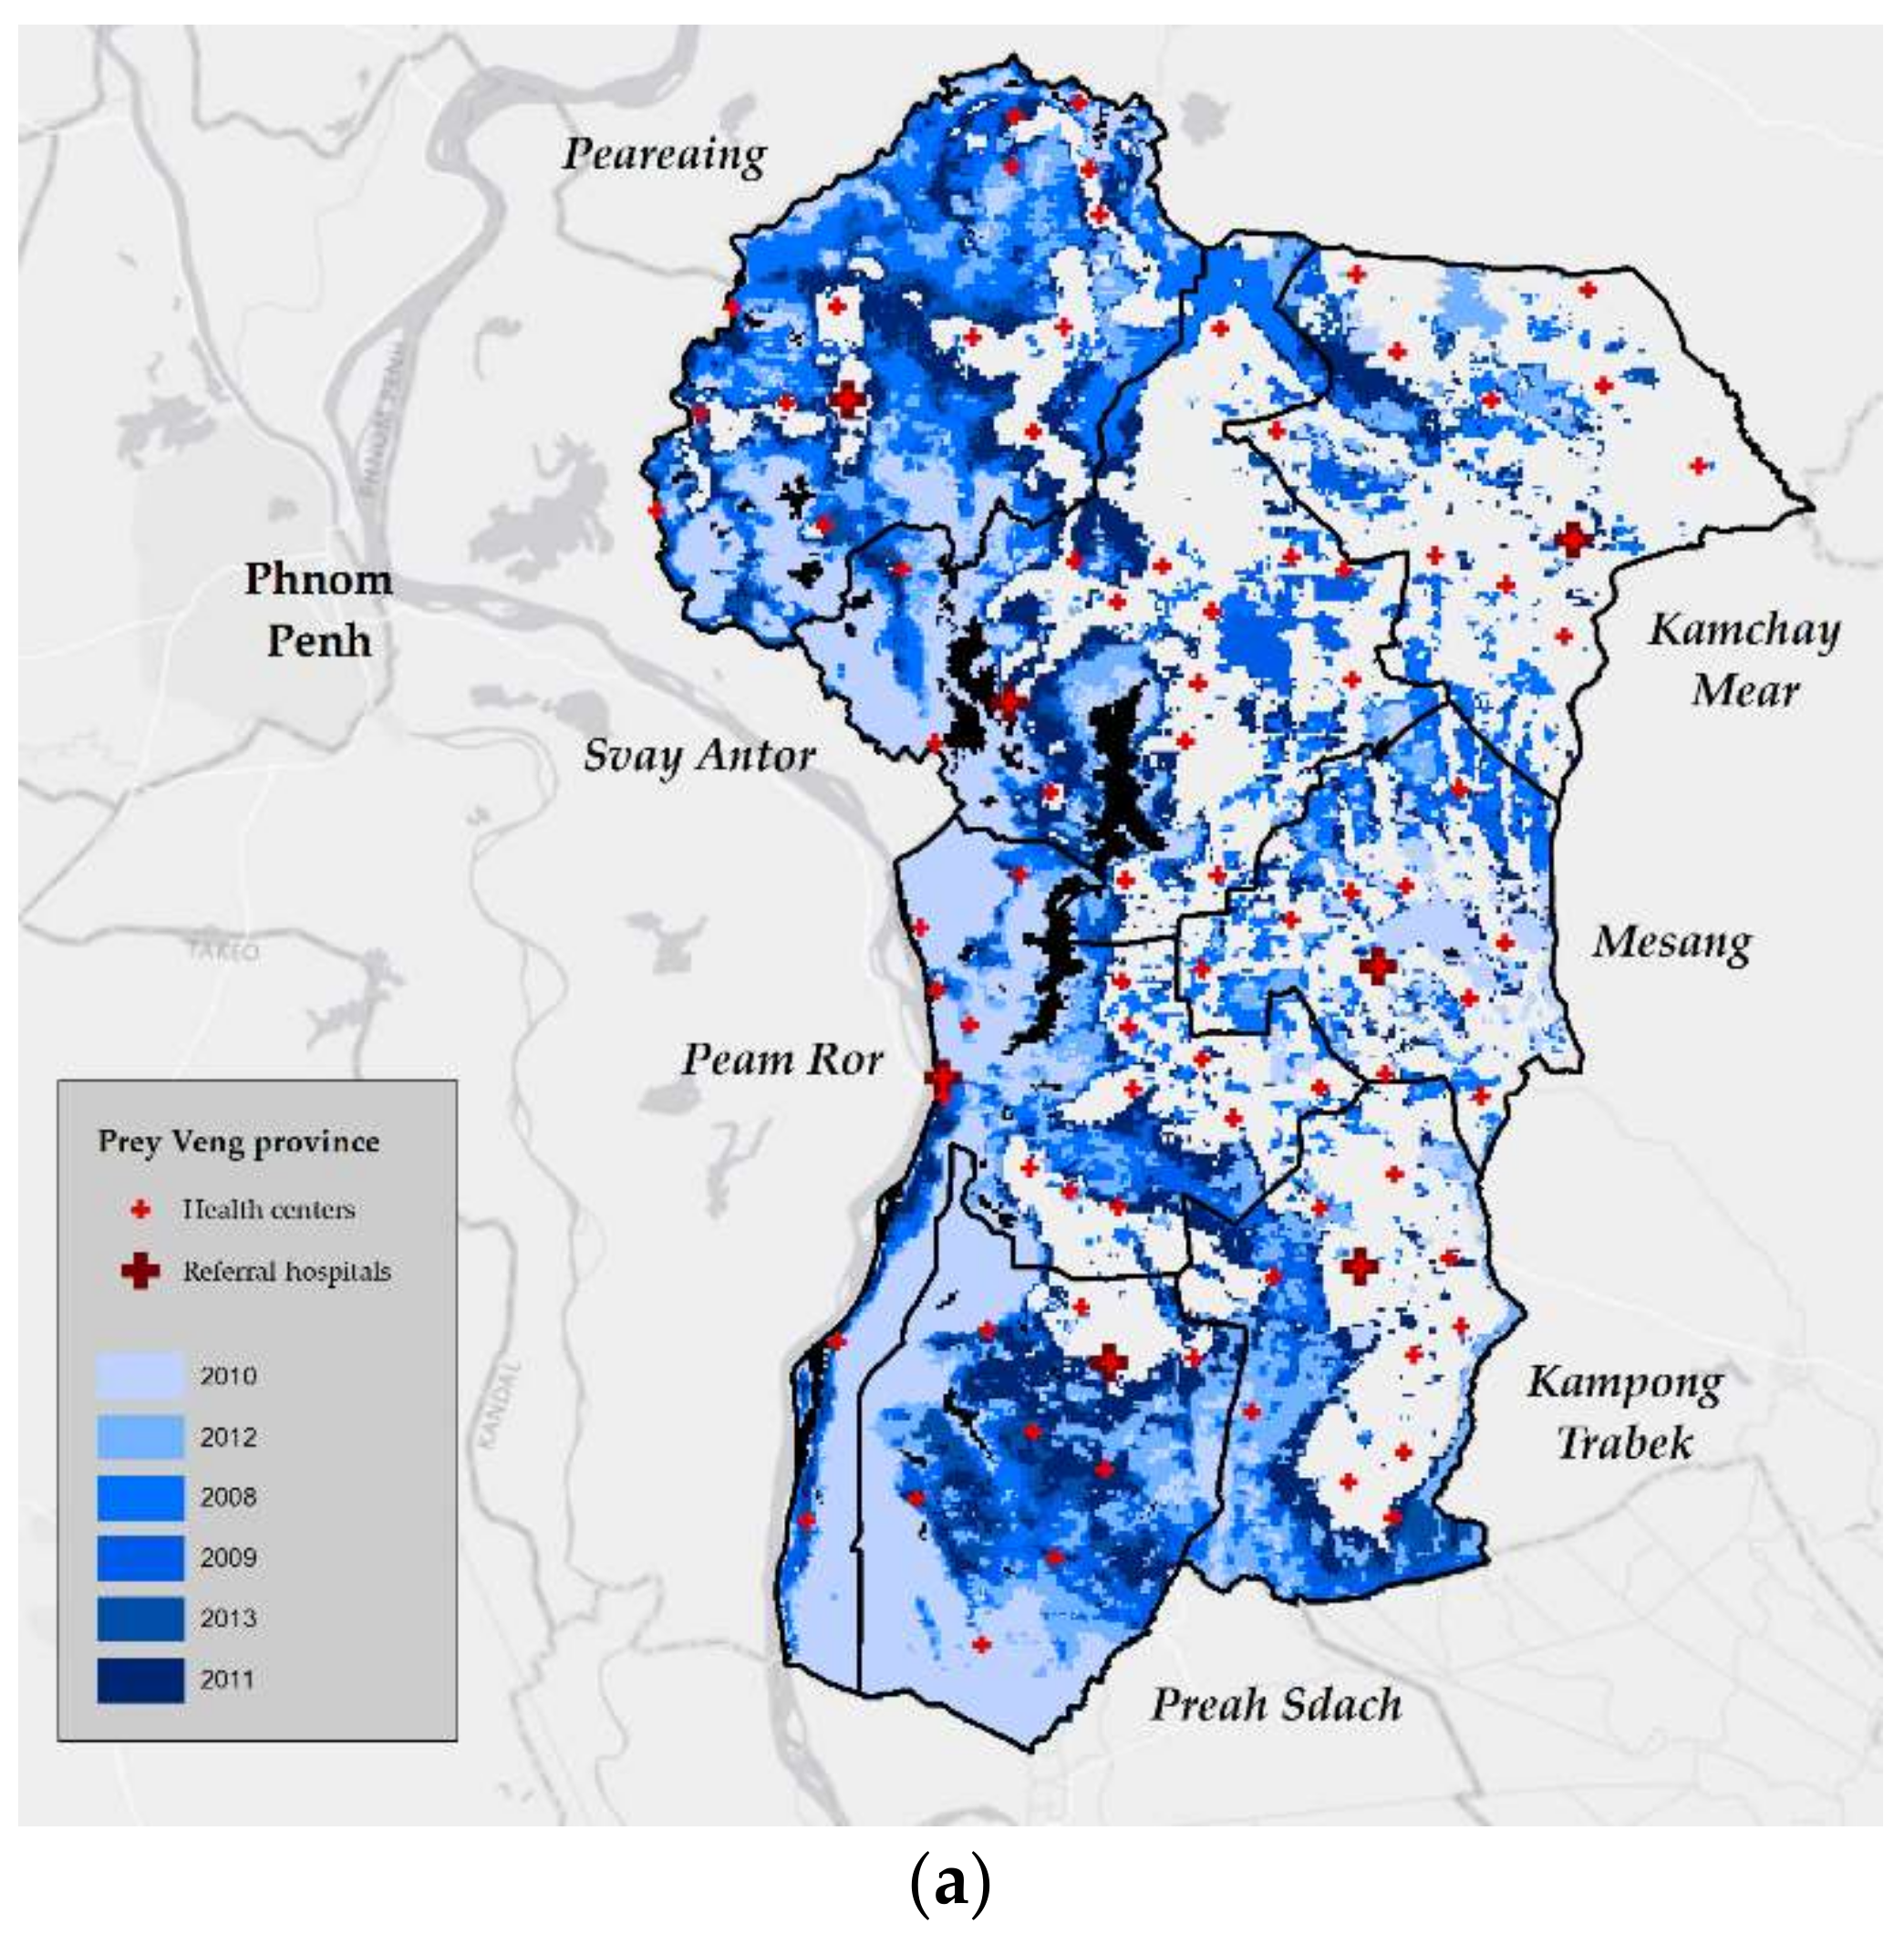
| District | Hospitals | Health Centers (n) |
|---|---|---|
| Prey Veng province | ||
| Kamchay Mear | Referral | 11 |
| Kampong Trabek | Referral | 11 |
| Mesang | Referral | 10 |
| Peam Ror | Referral | 17 |
| Peareaing | Referral | 15 |
| Preah Sdach | Referral | 9 |
| Svay Antor | Referral + provincial | 16 |
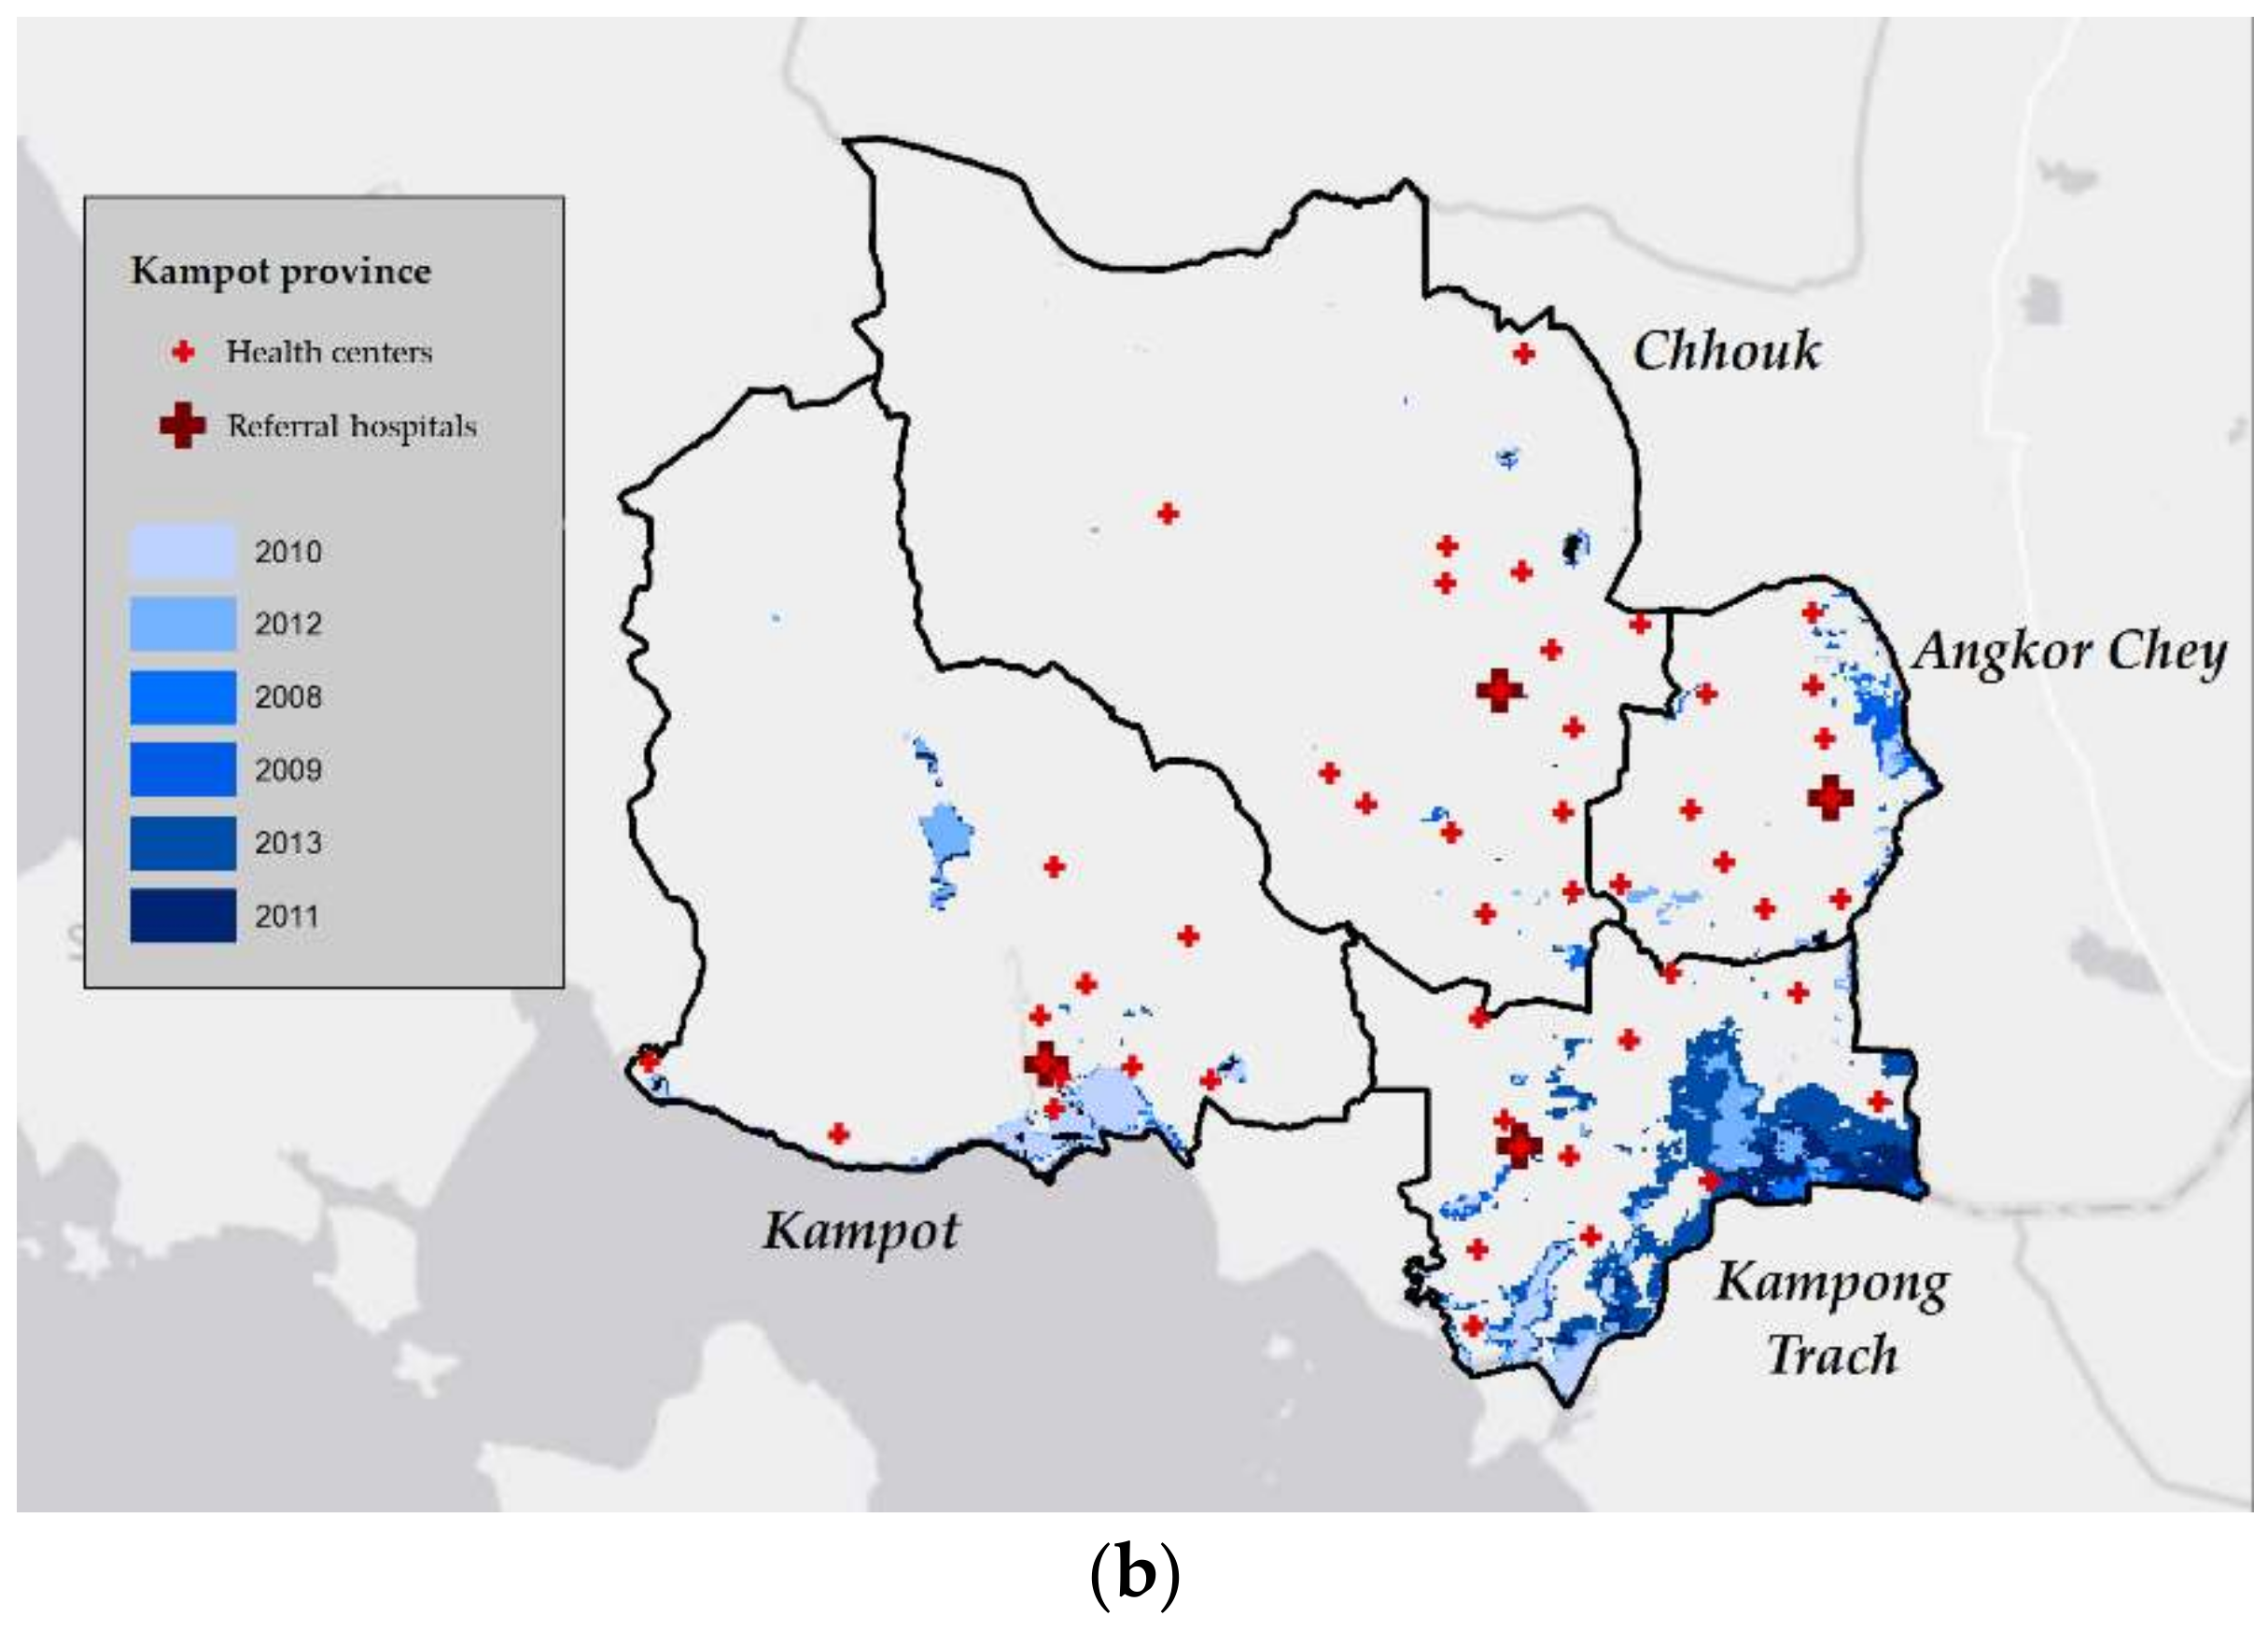
| Kampot province | ||
| Angkor Chey | Referral | 10 |
| Chhouk | Referral | 15 |
| Kampong Trach | Referral | 12 |
| Kampot | Referral + provincial | 11 |
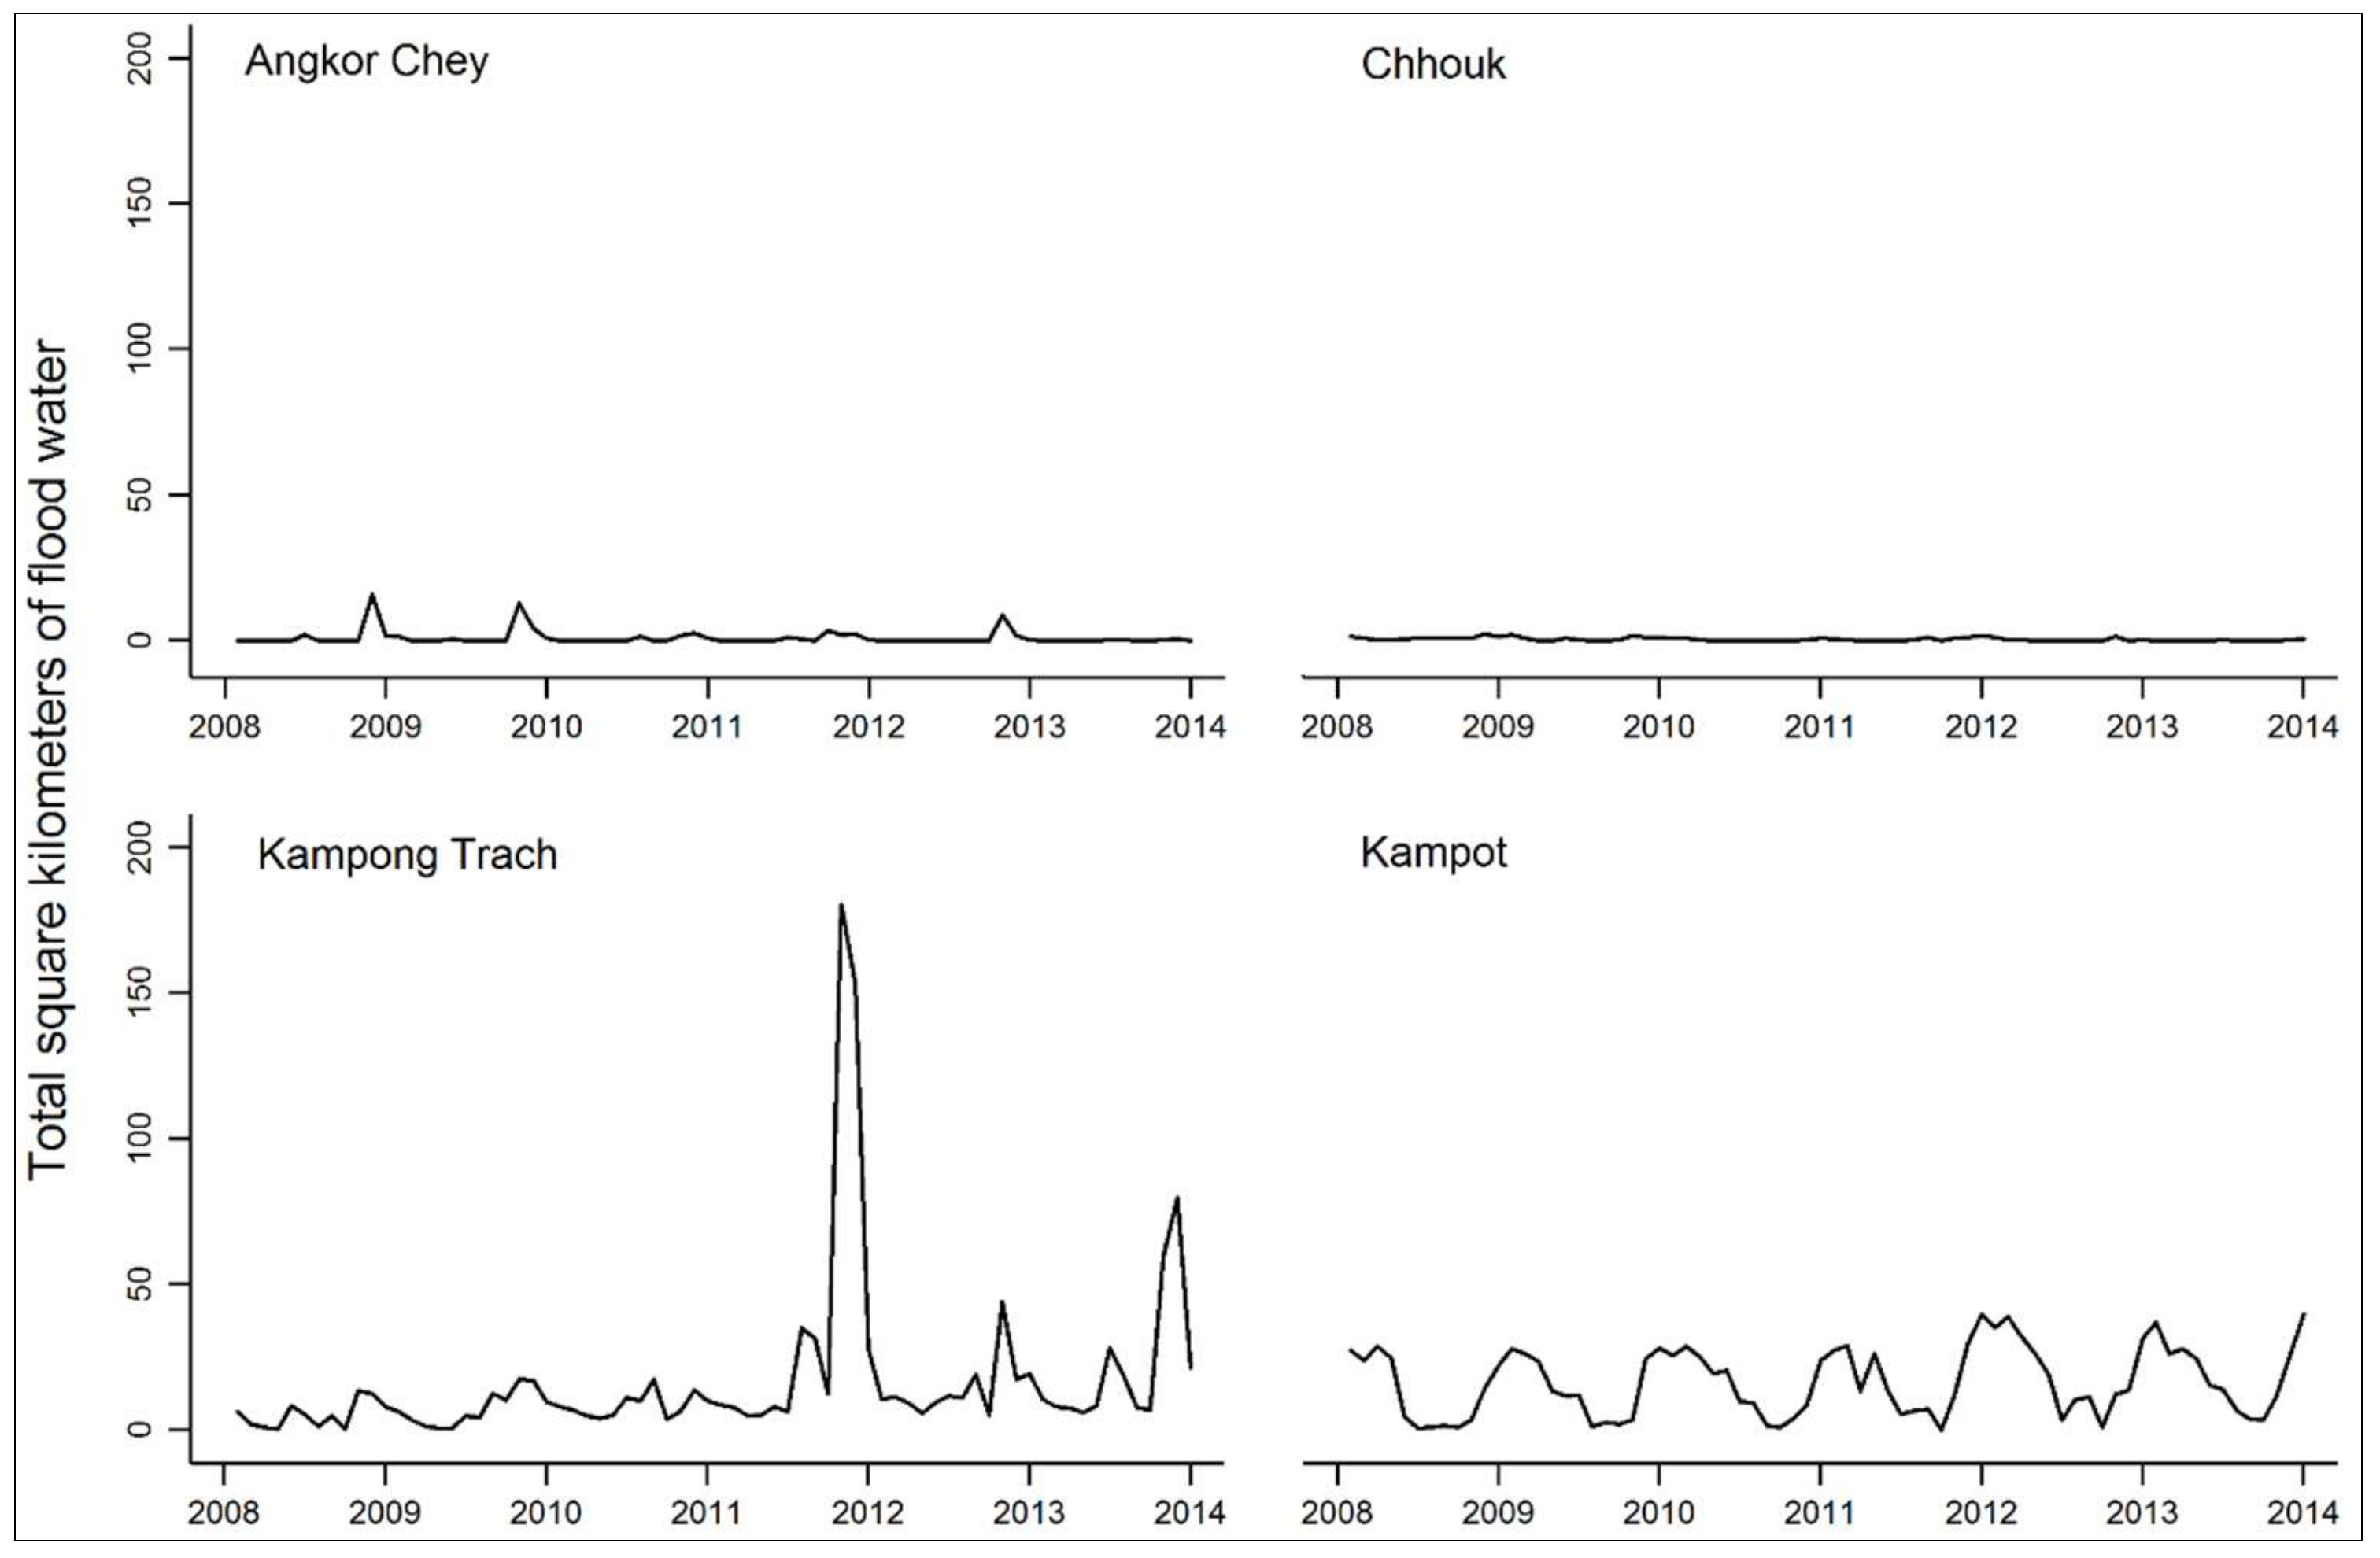
| District | Average Number of Visits, Per Month * | Mean Area Flooded Per Month (sq. Kilometers) | Mean Percent Cloud Cover Per Month | |||||
|---|---|---|---|---|---|---|---|---|
| Diarrhea | Acute Respiratory Infections | Skin Infections | Vector–Borne Diseases | Injuries | NCDs | |||
| Prey Veng province | 730 | 2891 | 221 | 5 | 78 | 1 | 58.2 | 29.3 |
| Kamchay Mear | 678 | 1818 | 134 | 7 | 74 | 0 | 5.2 | 37.2 |
| Kampong Trabek | 473 | 1344 | 113 | 3 | 26 | 0 | 22.0 | 28.9 |
| Mesang | 386 | 1848 | 192 | 1 | 42 | 0 | 10.5 | 31.5 |
| Peam Ror | 847 | 3525 | 258 | 5 | 110 | 1 | 106.0 | 22.4 |
| Peareaing | 1115 | 7280 | 347 | 10 | 120 | 6 | 90.4 | 27.0 |
| Preah Sdach | 1140 | 2758 | 384 | 4 | 152 | 0 | 105.8 | 28.0 |
| Svay Antor | 473 | 1666 | 121 | 3 | 23 | 2 | 67.2 | 30.3 |
| Kampot province | 267 | 1050 | 116 | 57 | 171 | 1 | 8.5 | 32.6 |
| Angkor Chey | 184 | 836 | 64 | 8 | 84 | 1 | 0.9 | 43.2 |
| Chhouk | 262 | 1190 | 182 | 118 | 175 | 1 | 0.5 | 31.7 |
| Kampong Trach | 191 | 916 | 130 | 16 | 140 | 0 | 16.2 | 33.6 |
| Kampot | 431 | 1 259 | 87 | 86 | 284 | 4 | 16.5 | 21.8 |
| Total number of visits, between 2008–2013 | ||||||||
| 569,887 | 2,445,511 | 215,164 | 33,672 | 124,989 | 1549 | |||
© 2018 by the authors. Licensee MDPI, Basel, Switzerland. This article is an open access article distributed under the terms and conditions of the Creative Commons Attribution (CC BY) license (http://creativecommons.org/licenses/by/4.0/).
Share and Cite
Saulnier, D.D.; Hanson, C.; Ir, P.; Mölsted Alvesson, H.; Von Schreeb, J. The Effect of Seasonal Floods on Health: Analysis of Six Years of National Health Data and Flood Maps. Int. J. Environ. Res. Public Health 2018, 15, 665. https://doi.org/10.3390/ijerph15040665
Saulnier DD, Hanson C, Ir P, Mölsted Alvesson H, Von Schreeb J. The Effect of Seasonal Floods on Health: Analysis of Six Years of National Health Data and Flood Maps. International Journal of Environmental Research and Public Health. 2018; 15(4):665. https://doi.org/10.3390/ijerph15040665
Chicago/Turabian StyleSaulnier, Dell D., Claudia Hanson, Por Ir, Helle Mölsted Alvesson, and Johan Von Schreeb. 2018. "The Effect of Seasonal Floods on Health: Analysis of Six Years of National Health Data and Flood Maps" International Journal of Environmental Research and Public Health 15, no. 4: 665. https://doi.org/10.3390/ijerph15040665
APA StyleSaulnier, D. D., Hanson, C., Ir, P., Mölsted Alvesson, H., & Von Schreeb, J. (2018). The Effect of Seasonal Floods on Health: Analysis of Six Years of National Health Data and Flood Maps. International Journal of Environmental Research and Public Health, 15(4), 665. https://doi.org/10.3390/ijerph15040665