Vertical Distribution of Total Mercury and Mercury Methylation in a Landfill Site in Japan

Abstract
1. Introduction
2. Materials and Methods
2.1. Sample Collection
2.2. Analysis of THg and MeHg Concentrations
2.3. Gene Analysis
3. Results and Discussion
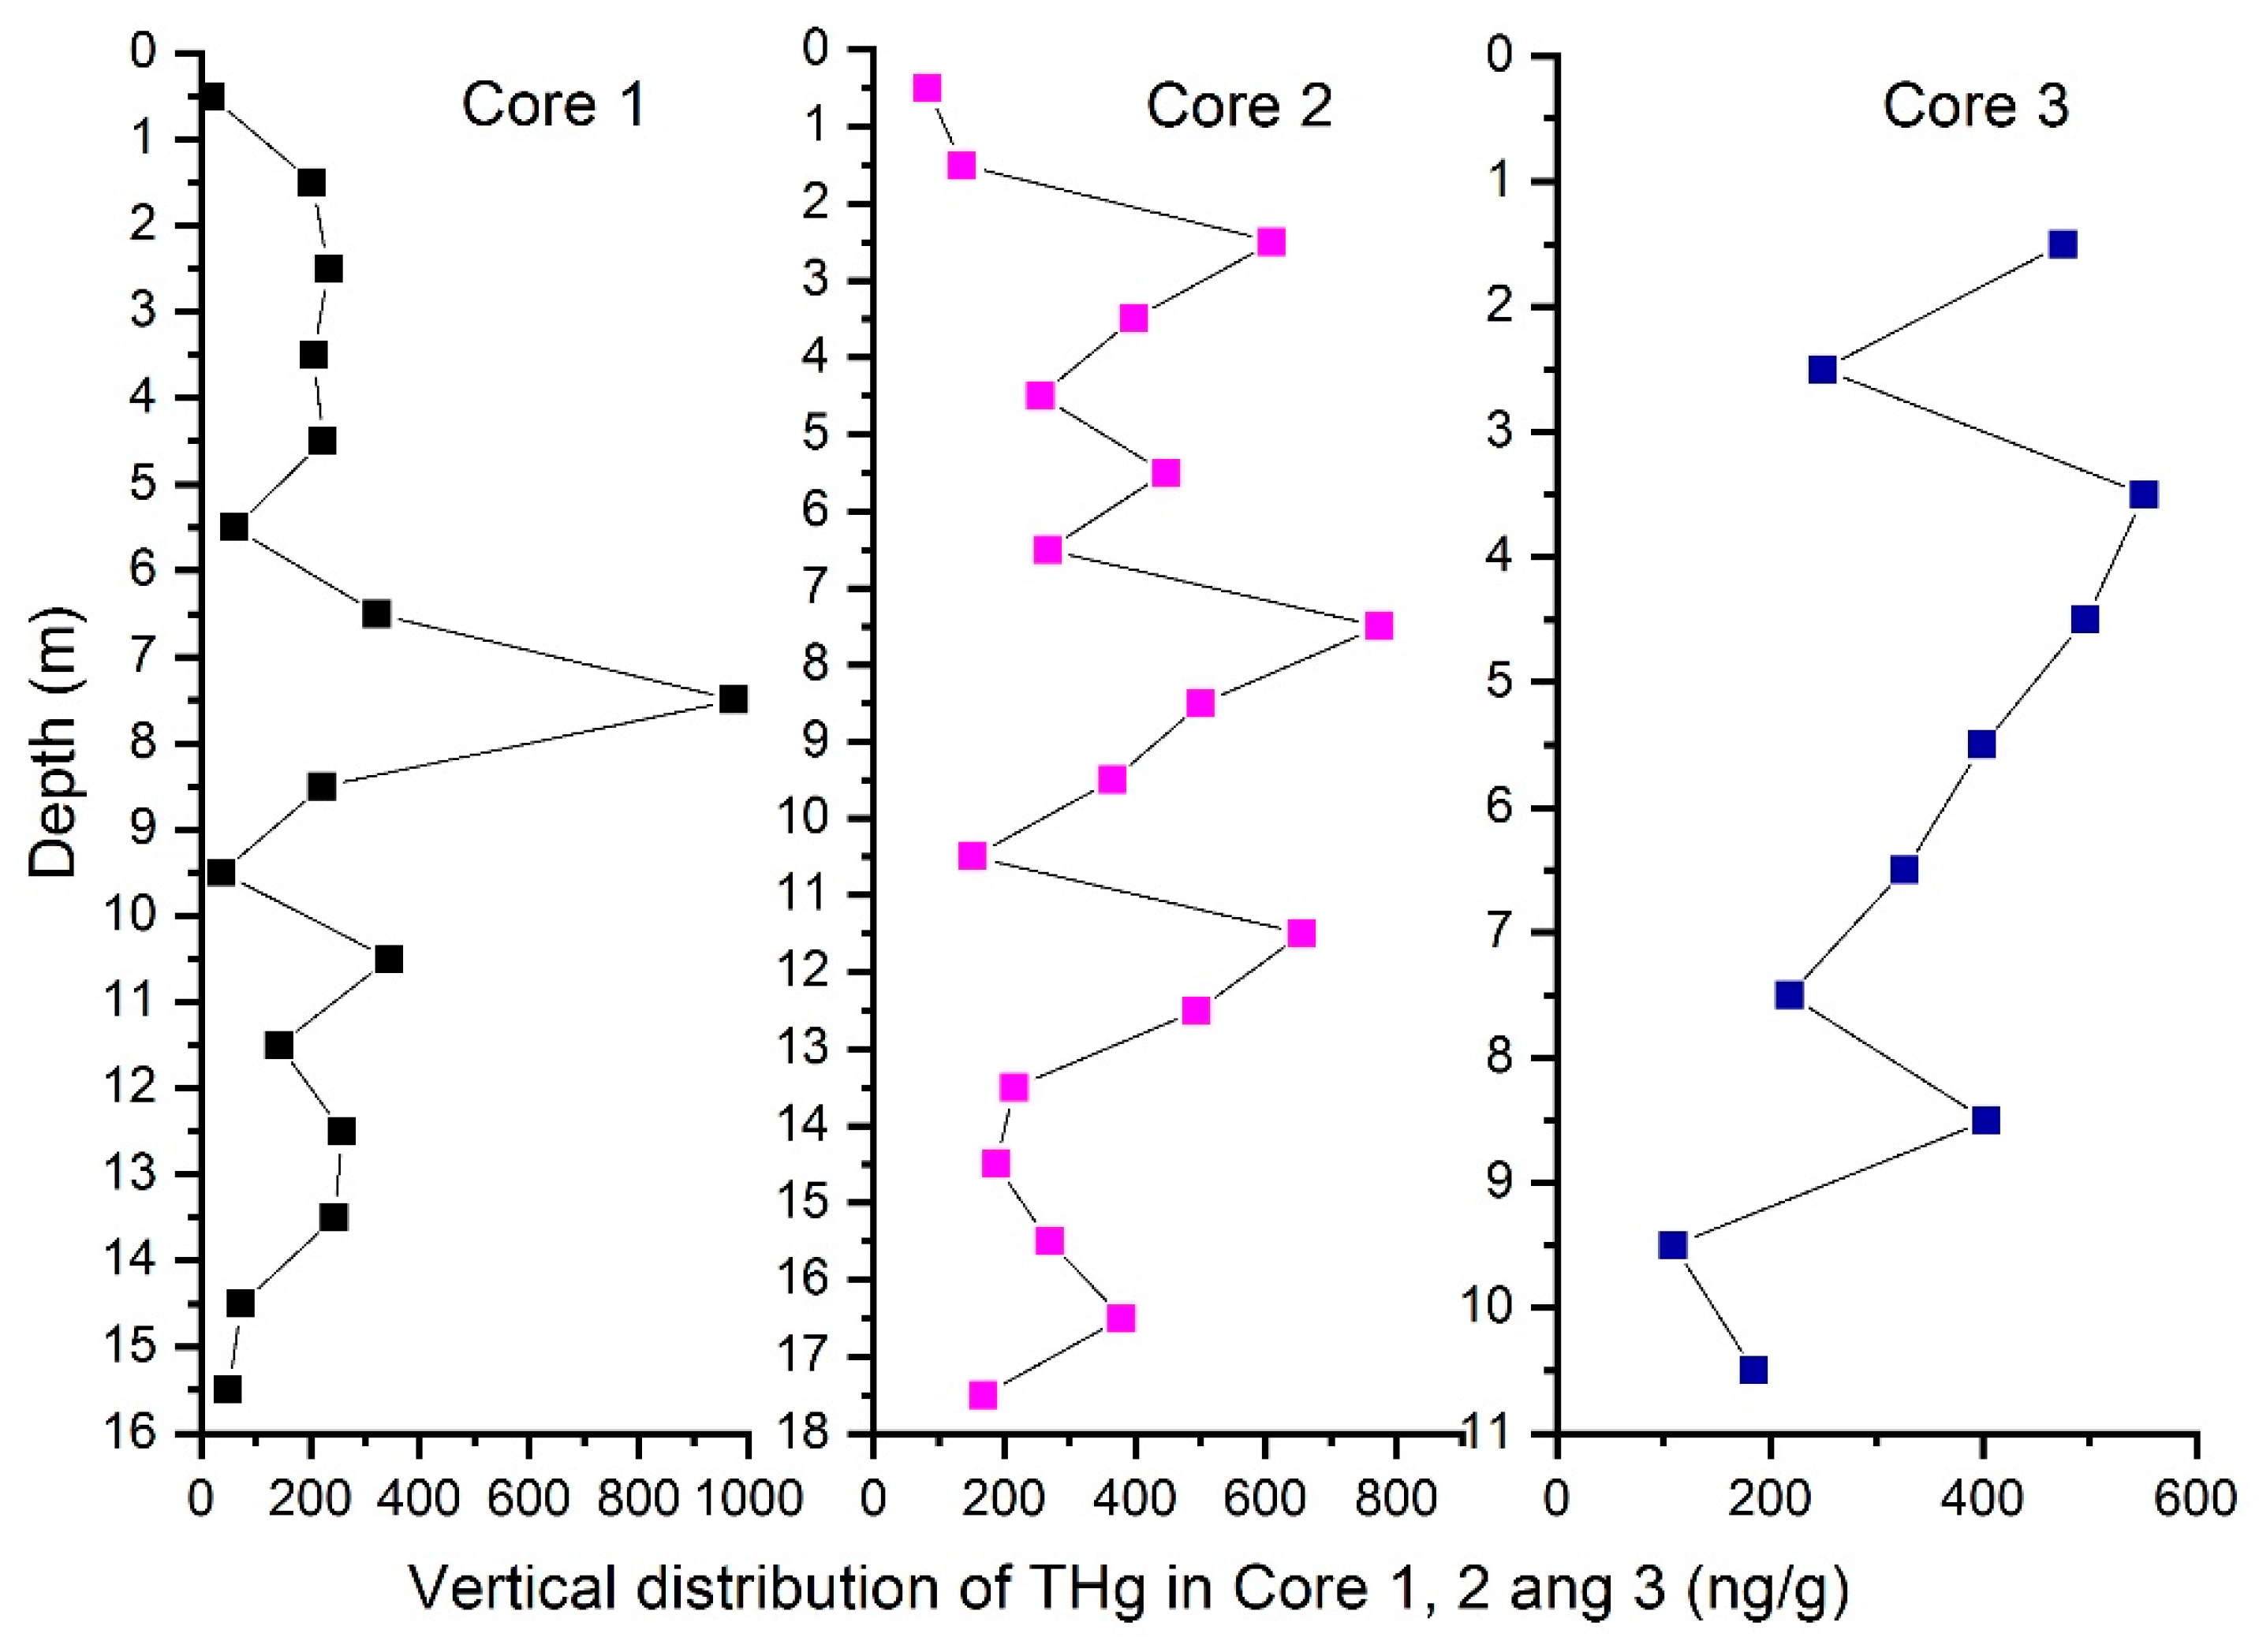
3.1. THg
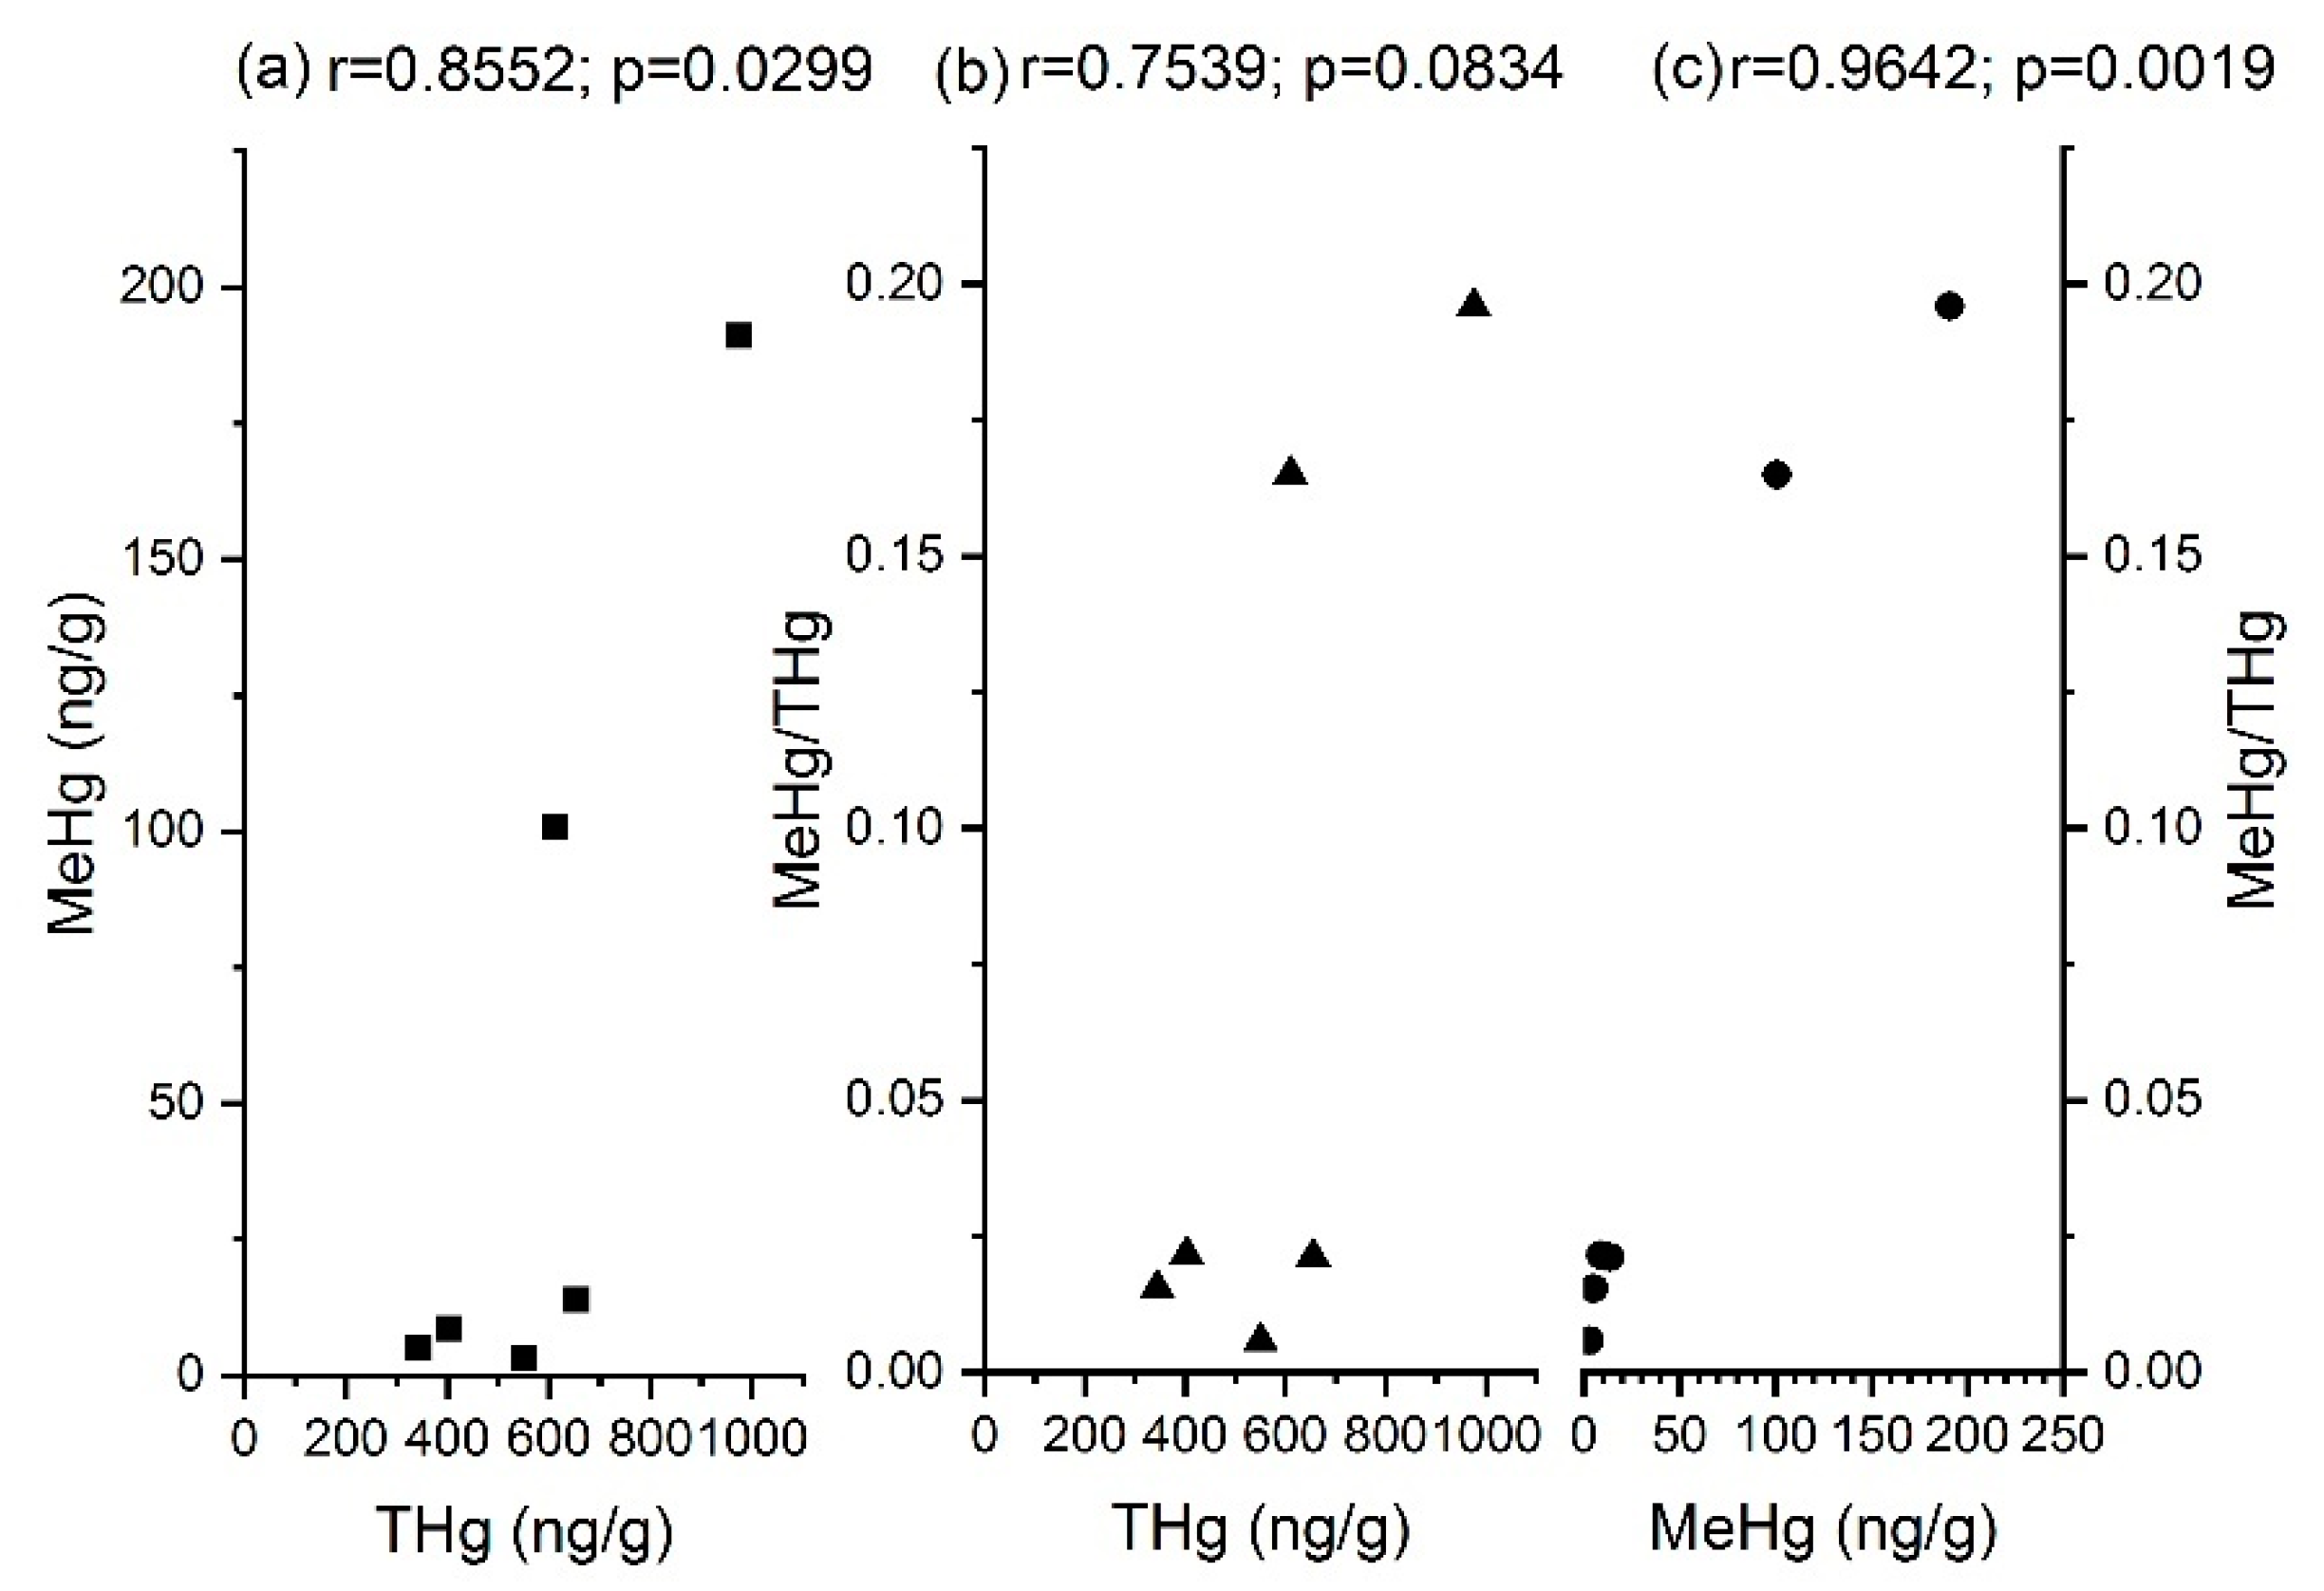
3.2. MeHg
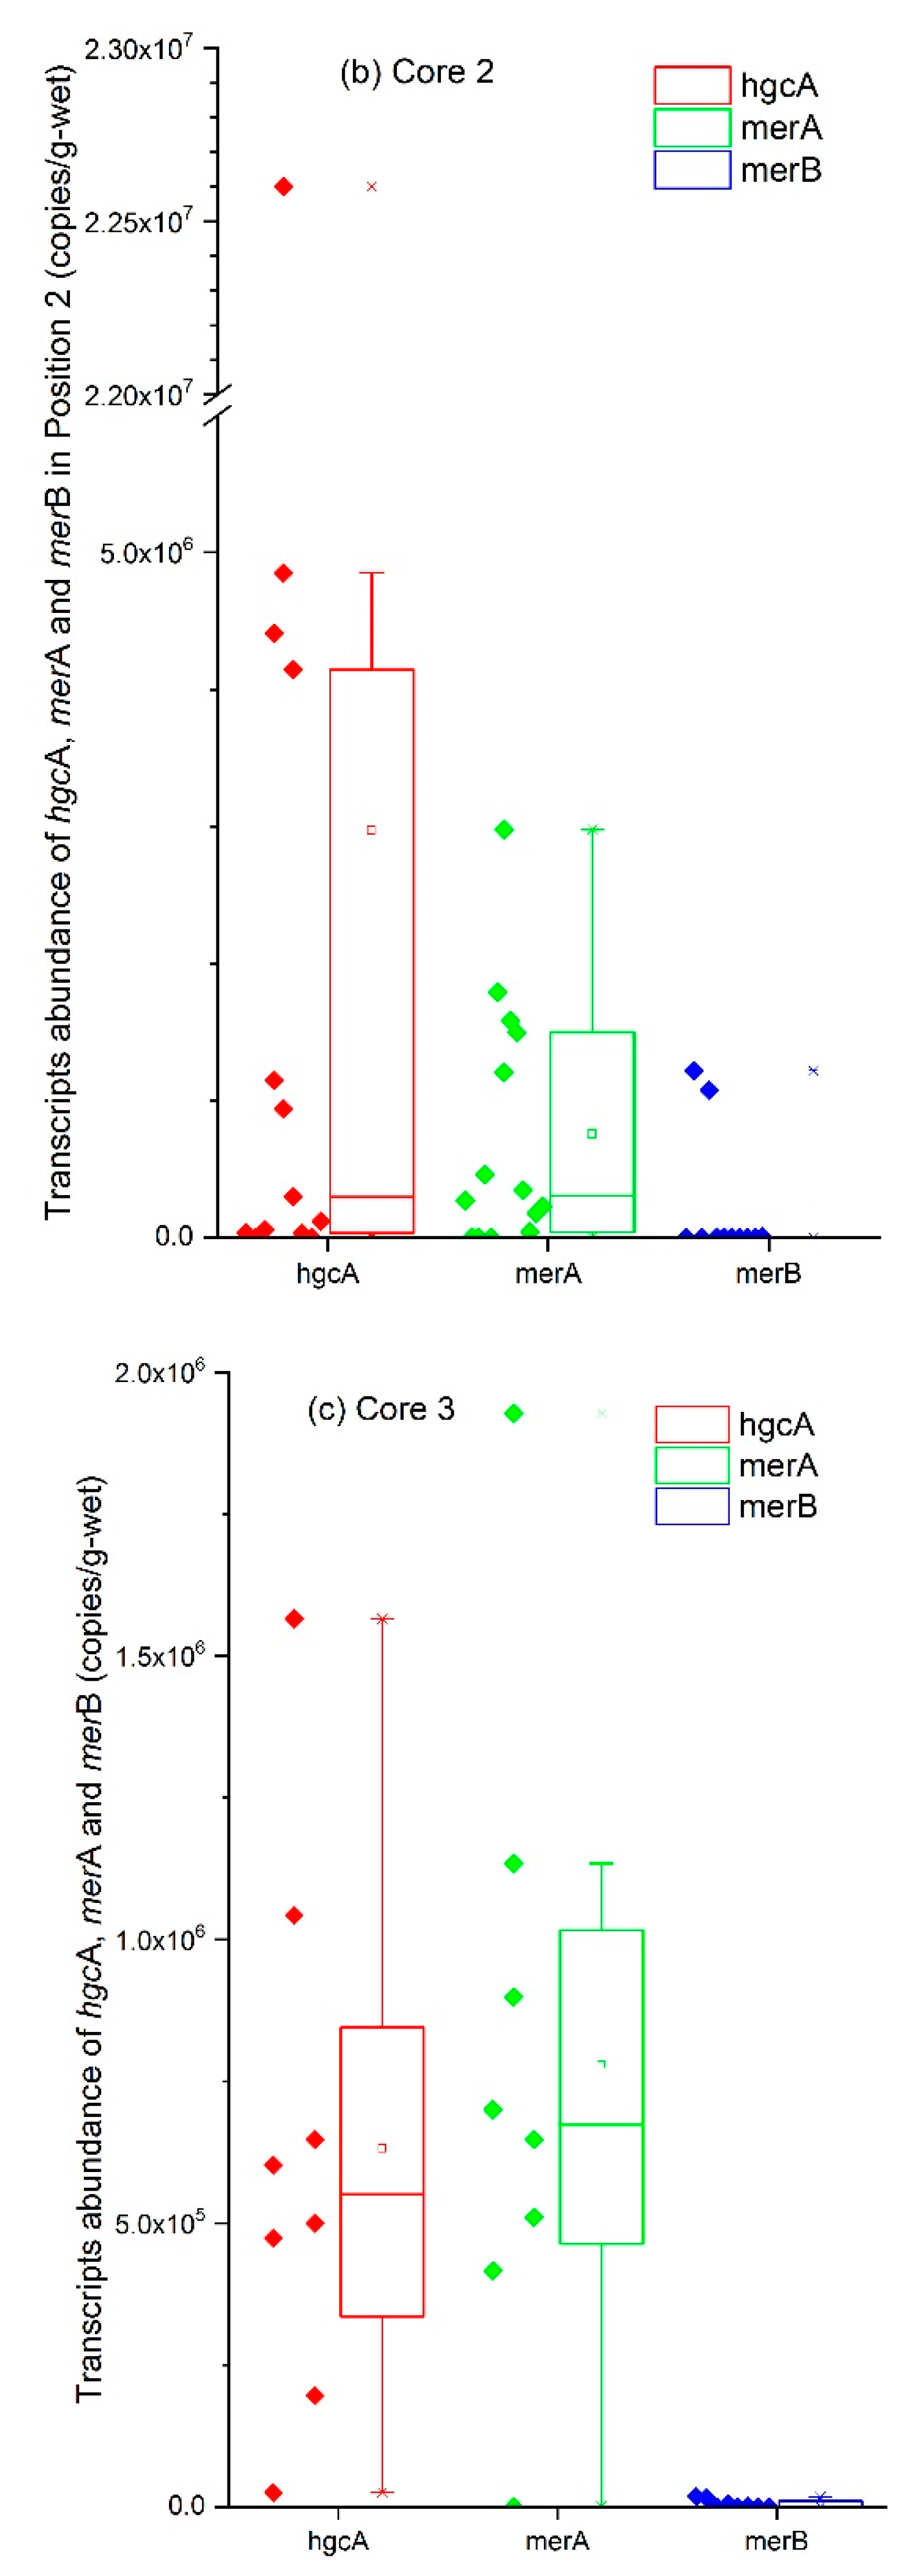
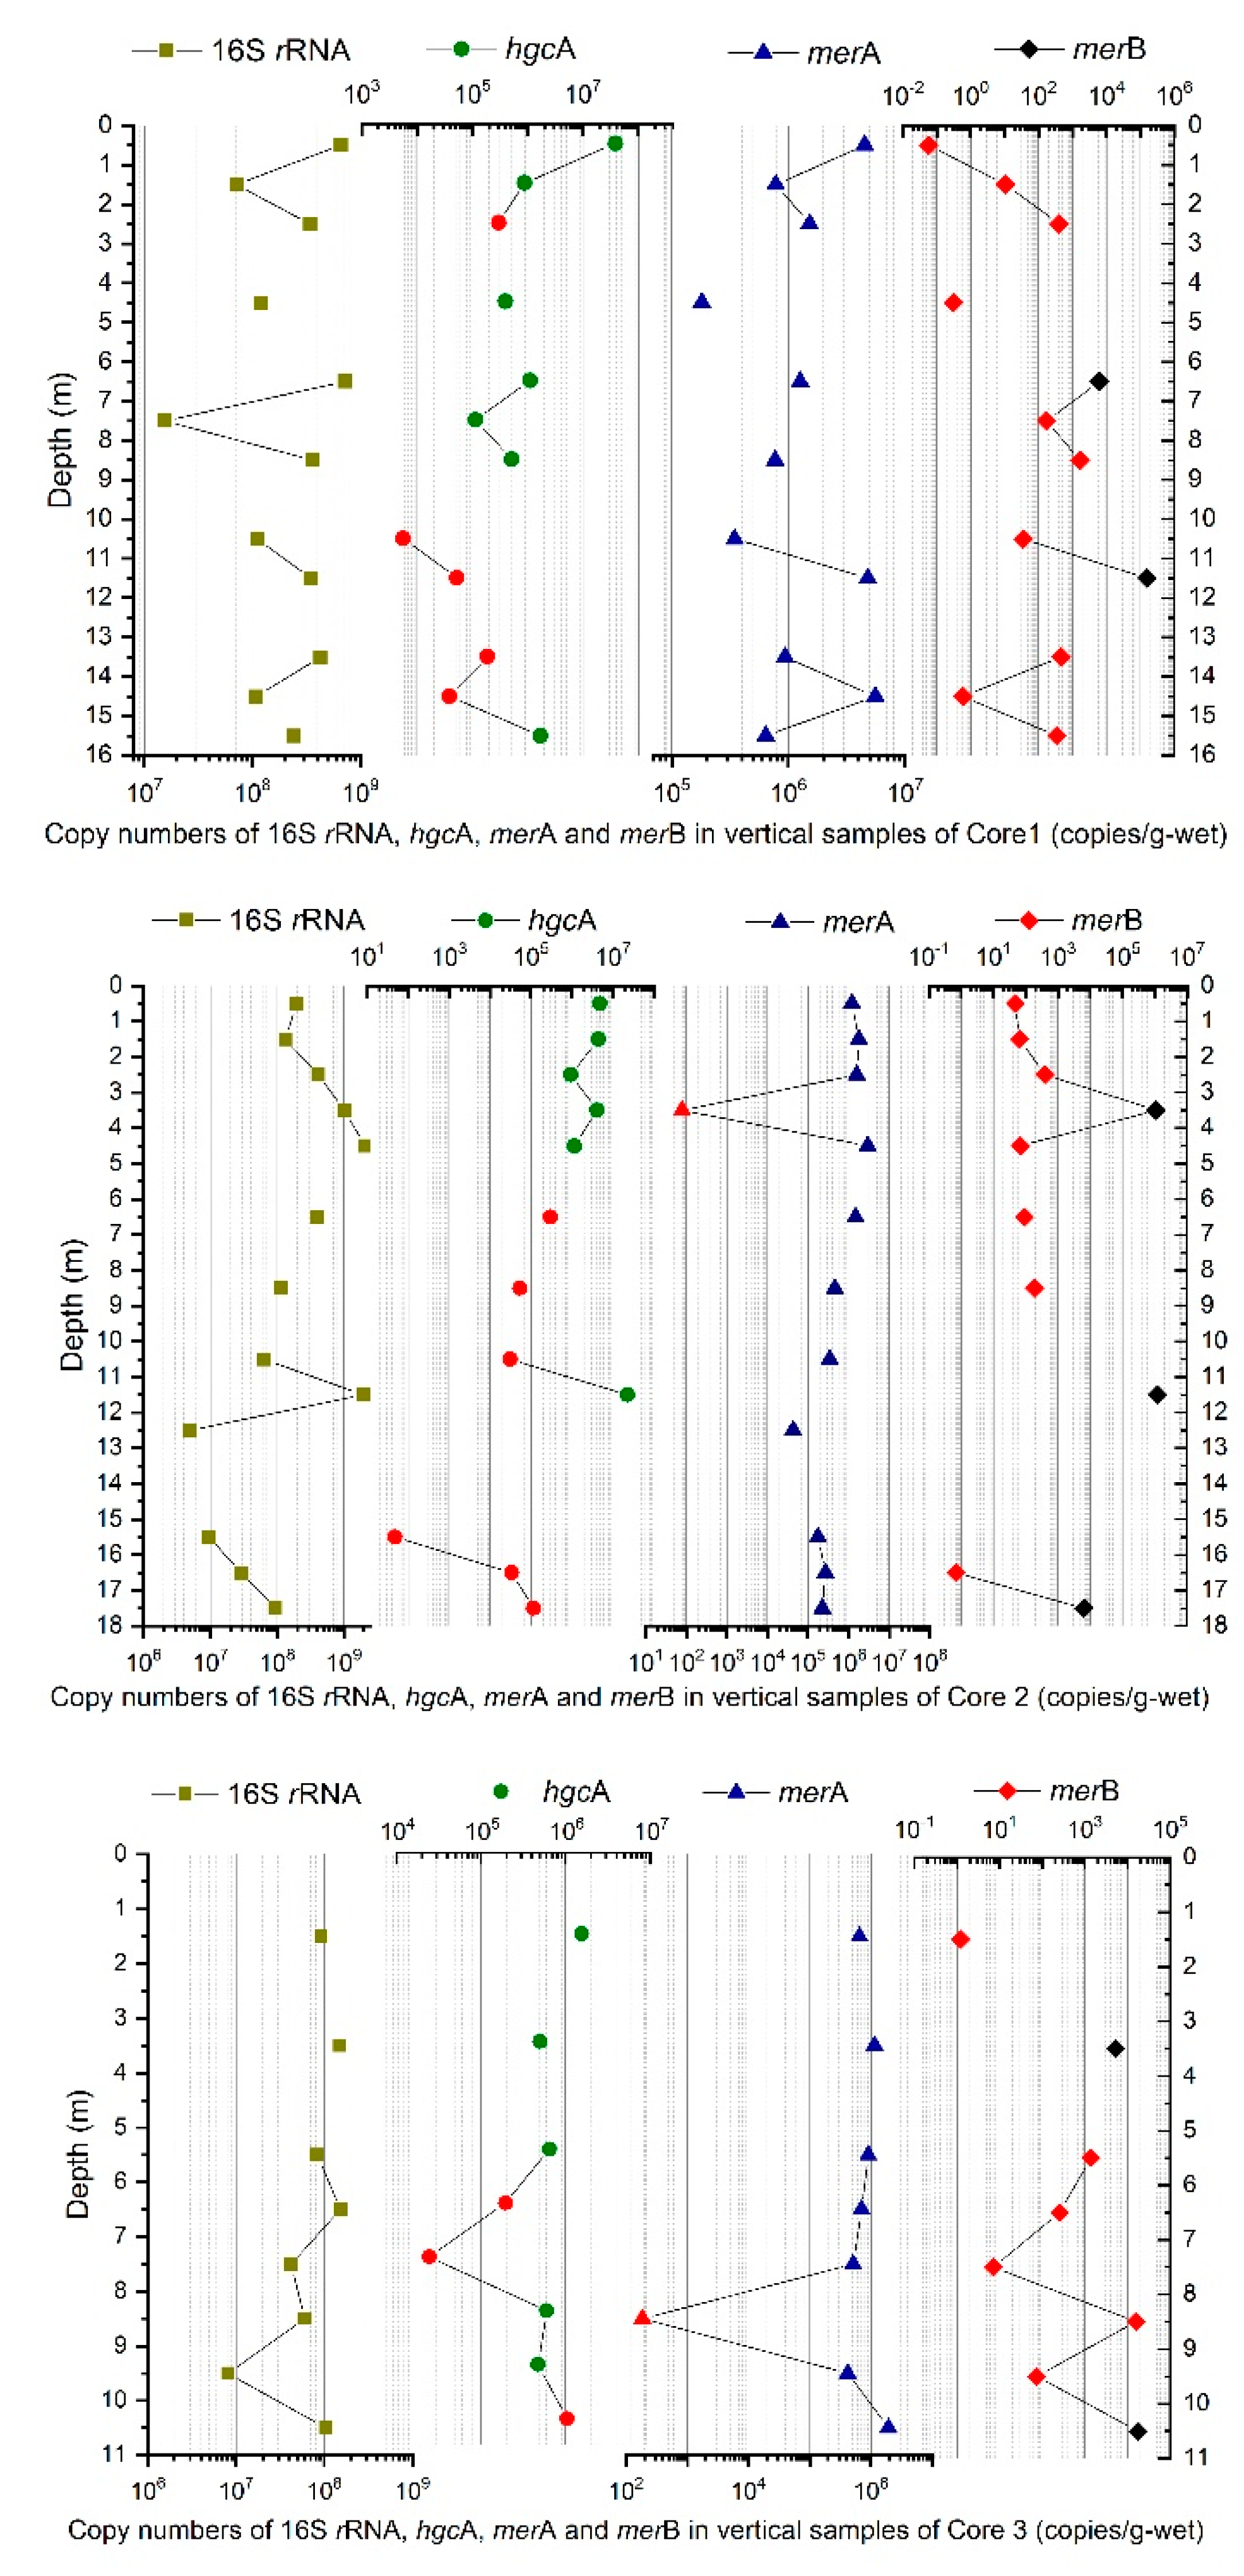
3.3. Analysis of the hgcA, merA, and merB Genes with Regard to Hg Speciation
4. Conclusions
Supplementary Materials
Author Contributions
Funding
Acknowledgments
Conflicts of Interest
References
- Sigler, J.M.; Lee, X.; Munger, W. Emission and long-range transport of gaseous mercury from a large-scale Canadian boreal forest fire. Environ. Sci. Technol. 2003, 37, 4343–4347. [Google Scholar] [CrossRef] [PubMed]
- Lacerda, L.D. Global mercury emissions from gold and silver mining. Water. Air. Soil Pollut. 1997, 97, 209–221. [Google Scholar] [CrossRef]
- Wang, S.; Feng, X.; Qiu, G.; Wei, Z.; Xiao, T. Mercury emission to atmosphere from Lanmuchang Hg-Tl mining area, Southwestern Guizhou, China. Atmos. Environ. 2005, 39, 7459–7473. [Google Scholar] [CrossRef]
- Joensuu, O.I. Fossil fuels as a source of mercury pollution. Science 1971, 172, 1027–1028. [Google Scholar] [CrossRef] [PubMed]
- Biester, H.; Müller, G.; Schöler, H.F. Estimating distribution and retention of mercury in three different soils contaminated by emissions from chlor-alkali plants: Part I. Sci. Total Environ. 2002, 284, 177–189. [Google Scholar] [CrossRef]
- Olson, B.H.; Cooper, R.C. Comparison of aerobic and anaerobic methylation of mercuric chloride by San Francisco Bay sediments. Water Res. 1976, 10, 113–116. [Google Scholar] [CrossRef]
- Feng, X.; Tang, S.; Li, Z.; Wang, S.; Liang, L. Landfill is an important atmospheric mercury emission source. Chin. Sci. Bull. 2004, 49, 2068. [Google Scholar] [CrossRef]
- Giang, A.; Stokes, L.C.; Streets, D.G.; Corbitt, E.S.; Selin, N.E. Impacts of the Minamata Convention on mercury emissions and global deposition from coal-fired power generation in Asia. Environ. Sci. Technol. 2015, 49, 5326–5335. [Google Scholar] [CrossRef] [PubMed]
- Selin, N.E. Global biogeochemical cycling of mercury: A review. Annu. Rev. Environ. Resour. 2009, 34, 43–63. [Google Scholar] [CrossRef]
- Hintelmann, H. 11. Organomercurials. Their formation and pathways in the environment. In Organometallics in Environment and Toxicology: Metal Ions in Life Sciences; The Royal Society of Chemistry: London, UK, 2010; Volume 7, pp. 365–401. ISBN 9781849730822. [Google Scholar]
- Poulain, A.J.; Barkay, T. Cracking the mercury methylation code. Science 2013, 339, 1280–1281. [Google Scholar] [CrossRef] [PubMed]
- Liu, Y.R.; Zheng, Y.M.; Zhang, L.M.; He, J.Z. Linkage between community diversity of sulfate-reducing microorganisms and methylmercury concentration in paddy soil. Environ. Sci. Pollut. Res. 2014, 21, 1339–1348. [Google Scholar] [CrossRef] [PubMed]
- Lindberg, S.E.; Price, J.L. Airborne emissions of mercury from municipal landfill operations: A short-term measurement study in Florida. J. Air Waste Manag. Assoc. 1999, 49, 520–532. [Google Scholar] [CrossRef] [PubMed]
- Lindberg, S.E.; Wallschläger, D.; Prestbo, E.M.; Bloom, N.S.; Price, J.; Reinhart, D. Methylated mercury species in municipal waste landfill gas sampled in Florida, USA. Atmos. Environ. 2001, 35, 4011–4015. [Google Scholar] [CrossRef]
- Kim, K.H.; Kim, M.Y. Mercury emissions as landfill gas from a large-scale abandoned landfill site in Seoul. Atmos. Environ. 2002, 36, 4919–4928. [Google Scholar] [CrossRef]
- Li, Z.G.; Feng, X.; Li, P.; Liang, L.; Tang, S.L.; Wang, S.F.; Fu, X.-W.; Qiu, G.L.; Shang, L.H. Emissions of air-borne mercury from five municipal solid waste landfills in Guiyang and Wuhan, China. Atmos. Chem. Phys. 2010, 10, 3353–3364. [Google Scholar] [CrossRef]
- Zhu, W.; Lin, C.J.; Wang, X.; Sommar, J.; Fu, X.; Feng, X. Global observations and modeling of atmosphere-surface exchange of elemental mercury: A critical review. Atmos. Chem. Phys. 2016, 16, 4451–4480. [Google Scholar] [CrossRef]
- Flores, É.L.M.; Paniz, J.N.G.; Flores, É.M.M.; Pozebon, D.; Dressler, V.L. Mercury speciation in urban landfill leachate by cold vapor generation atomic absorption spectrometry using ion exchange and amalgamation. J. Braz. Chem. Soc. 2009, 20, 1659–1666. [Google Scholar] [CrossRef]
- Ding, Z.H.; Tang, Q.H.; Liu, C.E.; Wang, W.H.; Zhuang, M.; Lin, Y.M. Distribution and ecological effect of mercury in Laogang landfill, Shanghai, China. J. Environ. Sci. 2007, 19, 200–204. [Google Scholar] [CrossRef]
- Earle, C.D.A.; Rhue, R.D.; Earle, J.F.K. Mercury in a municipal solid waste landfill. Waste Manag. Res. 1999, 17, 305–312. [Google Scholar] [CrossRef]
- Revis, N.W.; Osborne, T.R.; Holdsworth, G.; Hadden, C. Distribution of mercury species in soil from a mercury-contaminated site. Water. Air. Soil Pollut. 1989, 45, 105–113. [Google Scholar] [CrossRef]
- Chang, T.C.; Yen, J.H. On-site mercury-contaminated soils remediation by using thermal desorption technology. J. Hazard. Mater. 2006, 128, 208–217. [Google Scholar] [CrossRef] [PubMed]
- Teršič, T.; Gosar, M. Comparison of elemental contents in earthworm cast and soil from a mercury-contaminated site (Idrija area, Slovenia). Sci. Total Environ. 2012, 430, 28–33. [Google Scholar] [CrossRef] [PubMed]
- Tao, Z.; Dai, S.; Chai, X. Mercury emission to the atmosphere from municipal solid waste landfills: A brief review. Atmos. Environ. 2017, 170, 303–311. [Google Scholar] [CrossRef]
- Lee, S.-W.; Lowry, G.V.; Hsu-Kim, H. Biogeochemical transformations of mercury in solid waste landfills and pathways for release. Environ. Sci. Process. Impacts 2016, 18, 176–189. [Google Scholar] [CrossRef] [PubMed]
- Ferreira, S.L.C.; Lemos, V.A.; Silva, L.O.B.; Queiroz, A.F.S.; Souza, A.S.; da Silva, E.G.P.; dos Santos, W.N.L.; das Virgens, C.F. Analytical strategies of sample preparation for the determination of mercury in food matrices—A review. Microchem. J. 2015, 121, 227–236. [Google Scholar] [CrossRef]
- Akagi, H.; Nishimura, H. Speciation of mercury in the environment. In Advances in Mercury Toxicology; Suzuki, T., Imura, N., Clarkson, T.W., Eds.; Springer: Boston, MA, USA, 1991; pp. 53–76. ISBN 978-1-4757-9071-9. [Google Scholar]
- Matsuyama, A.; Yano, S.; Hisano, A.; Kindaichi, M.; Sonoda, I.; Tada, A.; Akagi, H. Distribution and characteristics of methylmercury in surface sediment in Minamata Bay. Mar. Pollut. Bull. 2016, 109, 378–385. [Google Scholar] [CrossRef] [PubMed]
- Liu, Y.R.; Yu, R.Q.; Zheng, Y.M.; He, J.Z. Analysis of the microbial community structure by monitoring an Hg methylation gene (hgcA) in paddy soils along an Hg gradient. Appl. Environ. Microbiol. 2014, 80, 2874–2879. [Google Scholar] [CrossRef] [PubMed]
- Sotero-Martins, A.; De Jesus, M.S.; Lacerda, M.; Moreira, J.C.; Filgueiras, A.L.L.; Barrocas, P.R.G. A conservative region of the mercuric reductase gene (merA) as a molecular marker of bacterial mercury resistance. Braz. J. Microbiol. 2008, 39, 307–310. [Google Scholar] [CrossRef] [PubMed]
- Liebert, C.A.; Wireman, J.; Smith, T.; Summers, A.O. Phylogeny of mercury resistance (mer) operons of gram-negative bacteria isolated from the fecal flora of primates. Appl. Environ. Microbiol. 1997, 63, 1066–1076. [Google Scholar] [PubMed]
- Yanase, R.; Hirata, O.; Matsufuji, Y.; Hanashima, M. Behavior of mercury from used batteries in landfills over 20 Years. J. Jpn. Soc. Mater. Cycles Waste Manag. 2009, 20, 12–23. [Google Scholar] [CrossRef]
- Van Faassen, H.G. Methylation of mercury compounds in soil, sediment and sewage-sludge samples. Plant Soil 1976, 44, 505–509. [Google Scholar] [CrossRef]
- Kannan, K.; Smith, R.F., Jr.; Lee, R.F.; Windom, H.L.; Heitmuller, P.T.; Macauley, J.M.; Summers, J.K. Distribution of total mercury and methyl mercury in water, sediment, and fish from south Florida estuaries. Arch. Environ. Contam. Toxicol. 1998, 34, 109–118. [Google Scholar] [CrossRef] [PubMed]
- Wagemann, R.; Trebacz, E.; Boila, G.; Lockhart, W.L. Methylmercury and total mercury in tissues of arctic marine mammals. Sci. Total Environ. 1998, 218, 19–31. [Google Scholar] [CrossRef]
- Liu, G.; Cai, Y.; Philippi, T.; Kalla, P.; Scheidt, D.; Richards, J.; Scinto, L.; Appleby, C. Distribution of total and methylmercury in different ecosystem compartments in the Everglades: Implications for mercury bioaccumulation. Environ. Pollut. 2008, 153, 257–265. [Google Scholar] [CrossRef] [PubMed]
- Smith, S.D.; Bridou, R.; Johs, A.; Parks, J.M.; Elias, D.A.; Hurt, R.A.; Brown, S.D.; Podar, M.; Wall, J.D. Site-directed mutagenesis of HgcA and HgcB reveals amino acid residues important for mercury methylation. Appl. Environ. Microbiol. 2015, 81, 3205–3217. [Google Scholar] [CrossRef] [PubMed]
- Case, R.J.; Boucher, Y.; Dahllöf, I.; Holmström, C.; Doolittle, W.F.; Kjelleberg, S. Use of 16S rRNA and rpoB genes as molecular markers for microbial ecology studies. Appl. Environ. Microbiol. 2007, 73, 278–288. [Google Scholar] [CrossRef] [PubMed]
- Henry, S.; Bru, D.; Stres, B.; Hallet, S.; Philippot, L. Quantitative detection of the nosZ gene, encoding nitrous oxide reductase, and comparison of the abundances of 16S rRNA, narG, nirK, and nosZ genes in soils. Appl. Environ. Microbiol. 2006, 72, 5181–5189. [Google Scholar] [CrossRef] [PubMed]
- Giovannoni, S.J.; DeLong, E.F.; Schnmidt, T.M.; Pace, N.R. Tangential flow filtration and preliminary phylogenetic analysis of marine picoplankton. Appl. Environ. Microbiol. 1990, 56, 2572–2575. [Google Scholar] [PubMed]
- Tillett, D.; Neilan, B.A. Xanthogenate nucleic acid isolation from cultured and environmental cyanobacteria. J. Phycol. 2000, 36, 251–258. [Google Scholar] [CrossRef]
- Parks, J.M.; Johs, A.; Podar, M.; Bridou, R.; Hurt, R.A.; Smith, S.D.; Tomanicek, S.J.; Qian, Y.; Brown, S.D.; Brandt, C.C.; et al. The genetic basis for bacterial mercury methylation. Science 2013, 339, 1332–1335. [Google Scholar] [CrossRef] [PubMed]
- Bravo, A.G.; Loizeau, J.L.; Dranguet, P.; Makri, S.; Björn, E.; Ungureanu, V.G.; Slaveykova, V.I.; Cosio, C. Persistent Hg contamination and occurrence of Hg-methylating transcript (hgcA) downstream of a chlor-alkali plant in the Olt River (Romania). Environ. Sci. Pollut. Res. 2016, 23, 10529–10541. [Google Scholar] [CrossRef] [PubMed]
- Benison, G.C.; Di Lello, P.; Shokes, J.E.; Cosper, N.J.; Scott, R.A.; Legault, P.; Omichinski, J.G. A stable mercury-containing complex of the organomercurial lyase MerB: Catalysis, product release, and direct transfer to MerA. Biochemistry 2004, 43, 8333–8345. [Google Scholar] [CrossRef] [PubMed]
- Dash, H.R.; Das, S. Bioremediation of mercury and the importance of bacterial mer genes. Int. Biodeterior. Biodegrad. 2012, 75, 207–213. [Google Scholar] [CrossRef]
- Schaefer, J.K.; Kronberg, R.M.; Morel, F.M.M.; Skyllberg, U. Detection of a key Hg methylation gene, hgcA, in wetland soils. Environ. Microbiol. Rep. 2014, 6, 441–447. [Google Scholar] [CrossRef] [PubMed]
- Santillan, E.F.U.; Gilmour, C.C.; Schwartz, G.; Christensen, G.A.; King, A.J.; Elias, D.A. The distribution and abundance of mercury methylating microorganisms in Mid-Atlantic wetlands. In AGU Fall Meeting Abstracts; American Geophysical Union: Washington, DC, USA, 2015; p. B14C-04. [Google Scholar]
- Du, H.; Ma, M.; Sun, T.; Dai, X.; Yang, C.; Luo, F.; Wang, D.; Igarashi, Y. Mercury-methylating genes dsrB and hgcA in soils/sediments of the Three Gorges Reservoir. Environ. Sci. Pollut. Res. 2017, 24, 5001–5011. [Google Scholar] [CrossRef] [PubMed]
- Gilmour, C.C.; Podar, M.; Bullock, A.L.; Graham, A.M.; Brown, S.D.; Somenahally, A.C.; Johs, A.; Hurt, R.A.; Bailey, K.L.; Elias, D.A. Mercury methylation by novel microorganisms from new environments. Environ. Sci. Technol. 2013, 47, 11810–11820. [Google Scholar] [CrossRef] [PubMed]
- Goñi-Urriza, M.; Corsellis, Y.; Lanceleur, L.; Tessier, E.; Gury, J.; Monperrus, M.; Guyoneaud, R. Relationships between bacterial energetic metabolism, mercury methylation potential, and hgcA/hgcB gene expression in Desulfovibrio dechloroacetivorans BerOc1. Environ. Sci. Pollut. Res. 2015, 22, 13764–13771. [Google Scholar] [CrossRef] [PubMed]
- Hsu-Kim, H.; Kucharzyk, K.H.; Zhang, T.; Deshusses, M.A. Mechanisms regulating mercury bioavailability for methylating microorganisms in the aquatic environment: A critical review. Environ. Sci. Technol. 2013, 47, 2441–2456. [Google Scholar] [CrossRef] [PubMed]
- Wiatrowski, H.A.; Ward, P.M.; Barkay, T. Novel reduction of mercury(II) by mercury-sensitive dissimilatory metal reducing bacteria. Environ. Sci. Technol. 2006, 40, 6690–6696. [Google Scholar] [CrossRef] [PubMed]
- Pak, K.R.; Bartha, R. Mercury methylation and demethylation in anoxic lake sediments and by strictly anaerobic bacteria. Appl. Environ. Microbiol. 1998, 64, 1013–1017. [Google Scholar] [PubMed]
- Howard, J.A. Mercury in the Environment: Field Studies from Tampa, Bolivia, and Guyana; University of South Florida: Tampa, FL, USA, 2010; p. 6352. [Google Scholar]


| Sample Number | Mean (ng/g) | Maximum (ng/g) | Minimum (ng/g) | Sd | Cv % |
|---|---|---|---|---|---|
| Core 1/16 (m) | 226 | 975 | 19 | 224 | 99.11 |
| Core 2/18 (m) | 353 | 774 | 82 | 196 | 55.52 |
| Core 3/11 (m) | 316 | 552 | 58 | 164 | 51.90 |
| Sample Number | MeHg (ng/g) | THg (ng/g) | MeHg % | ||||
|---|---|---|---|---|---|---|---|
| n = 1 | n = 2 | n = 3 | Mean | Sd | |||
| Core 1/8 (m) | 191 | 959 | 853 | 1113 | 975 | 131 | 19.6% |
| Core 1/11 (m) | 5.3 | 327 | 350 | 354 | 344 | 15 | 1.5% |
| Core 2/3 (m) | 100.7 | 880 | 533 | 418 | 610 | 241 | 16.5% |
| Core 2/12 (m) | 13.9 | 793 | 617 | 556 | 655 | 123 | 2.1% |
| Core 3/4 (m) | 3.2 | 541 | 789 | 324 | 551 | 233 | 0.6% |
| Core 3/9 (m) | 8.7 | 226 | 689 | 295 | 403 | 250 | 2.2% |
| Core | Number of Samples | Mean (Copies/g) | Maximum (Copies/g) | Minimum (Copies/g) |
|---|---|---|---|---|
| 1 | 12 | 2.9 × 10⁸ | 7.1 × 10⁸ | 1.5 × 10⁷ |
| 2 | 13 | 5.4 × 10⁸ | 2.1 × 10⁹ | 5.0 × 10⁶ |
| 3 | 8 | 7.8 × 10⁷ | 1.5 × 10⁸ | 8.1 × 10⁶ |
| Items | THg | MeHg | MeHg/THg | hgcA | merA | merB |
|---|---|---|---|---|---|---|
| THg | 1 | |||||
| MeHg | 0.8553 * | 1 | ||||
| MeHg/THg | 0.7539 | 0.9641 ** | 1 | |||
| hgcA | −0.0666 | −0.2478 | −0.2695 | 1 | ||
| merA | −0.3745 * | −1.734 × 10⁻⁵ | 0.1911 | 0.3036 | 1 | |
| merB | 0.2832 | −0.2600 | 0.2897 | 0.3760 * | −0.1735 | 1 |
© 2018 by the authors. Licensee MDPI, Basel, Switzerland. This article is an open access article distributed under the terms and conditions of the Creative Commons Attribution (CC BY) license (http://creativecommons.org/licenses/by/4.0/).
Share and Cite
Yang, J.; Takaoka, M.; Sano, A.; Matsuyama, A.; Yanase, R. Vertical Distribution of Total Mercury and Mercury Methylation in a Landfill Site in Japan. Int. J. Environ. Res. Public Health 2018, 15, 1252. https://doi.org/10.3390/ijerph15061252
Yang J, Takaoka M, Sano A, Matsuyama A, Yanase R. Vertical Distribution of Total Mercury and Mercury Methylation in a Landfill Site in Japan. International Journal of Environmental Research and Public Health. 2018; 15(6):1252. https://doi.org/10.3390/ijerph15061252
Chicago/Turabian StyleYang, Jing, Masaki Takaoka, Akira Sano, Akito Matsuyama, and Ryuji Yanase. 2018. "Vertical Distribution of Total Mercury and Mercury Methylation in a Landfill Site in Japan" International Journal of Environmental Research and Public Health 15, no. 6: 1252. https://doi.org/10.3390/ijerph15061252
APA StyleYang, J., Takaoka, M., Sano, A., Matsuyama, A., & Yanase, R. (2018). Vertical Distribution of Total Mercury and Mercury Methylation in a Landfill Site in Japan. International Journal of Environmental Research and Public Health, 15(6), 1252. https://doi.org/10.3390/ijerph15061252