The Concentration of BTEX in the Air of Tehran: A Systematic Review-Meta Analysis and Risk Assessment

 , ,
, , 
Abstract
:1. Introduction
2. Material and Methods
2.1. Strategy of Search
2.2. Screening of Articles
2.3. Data Extraction and Definitions
2.4. Meta-Analysis
2.5. Health Risk Assessment
2.5.1. Non-Carcinogenic Risk
2.5.2. Carcinogenic Risk
3. Results and Discussion
3.1. The Process of Select Papers
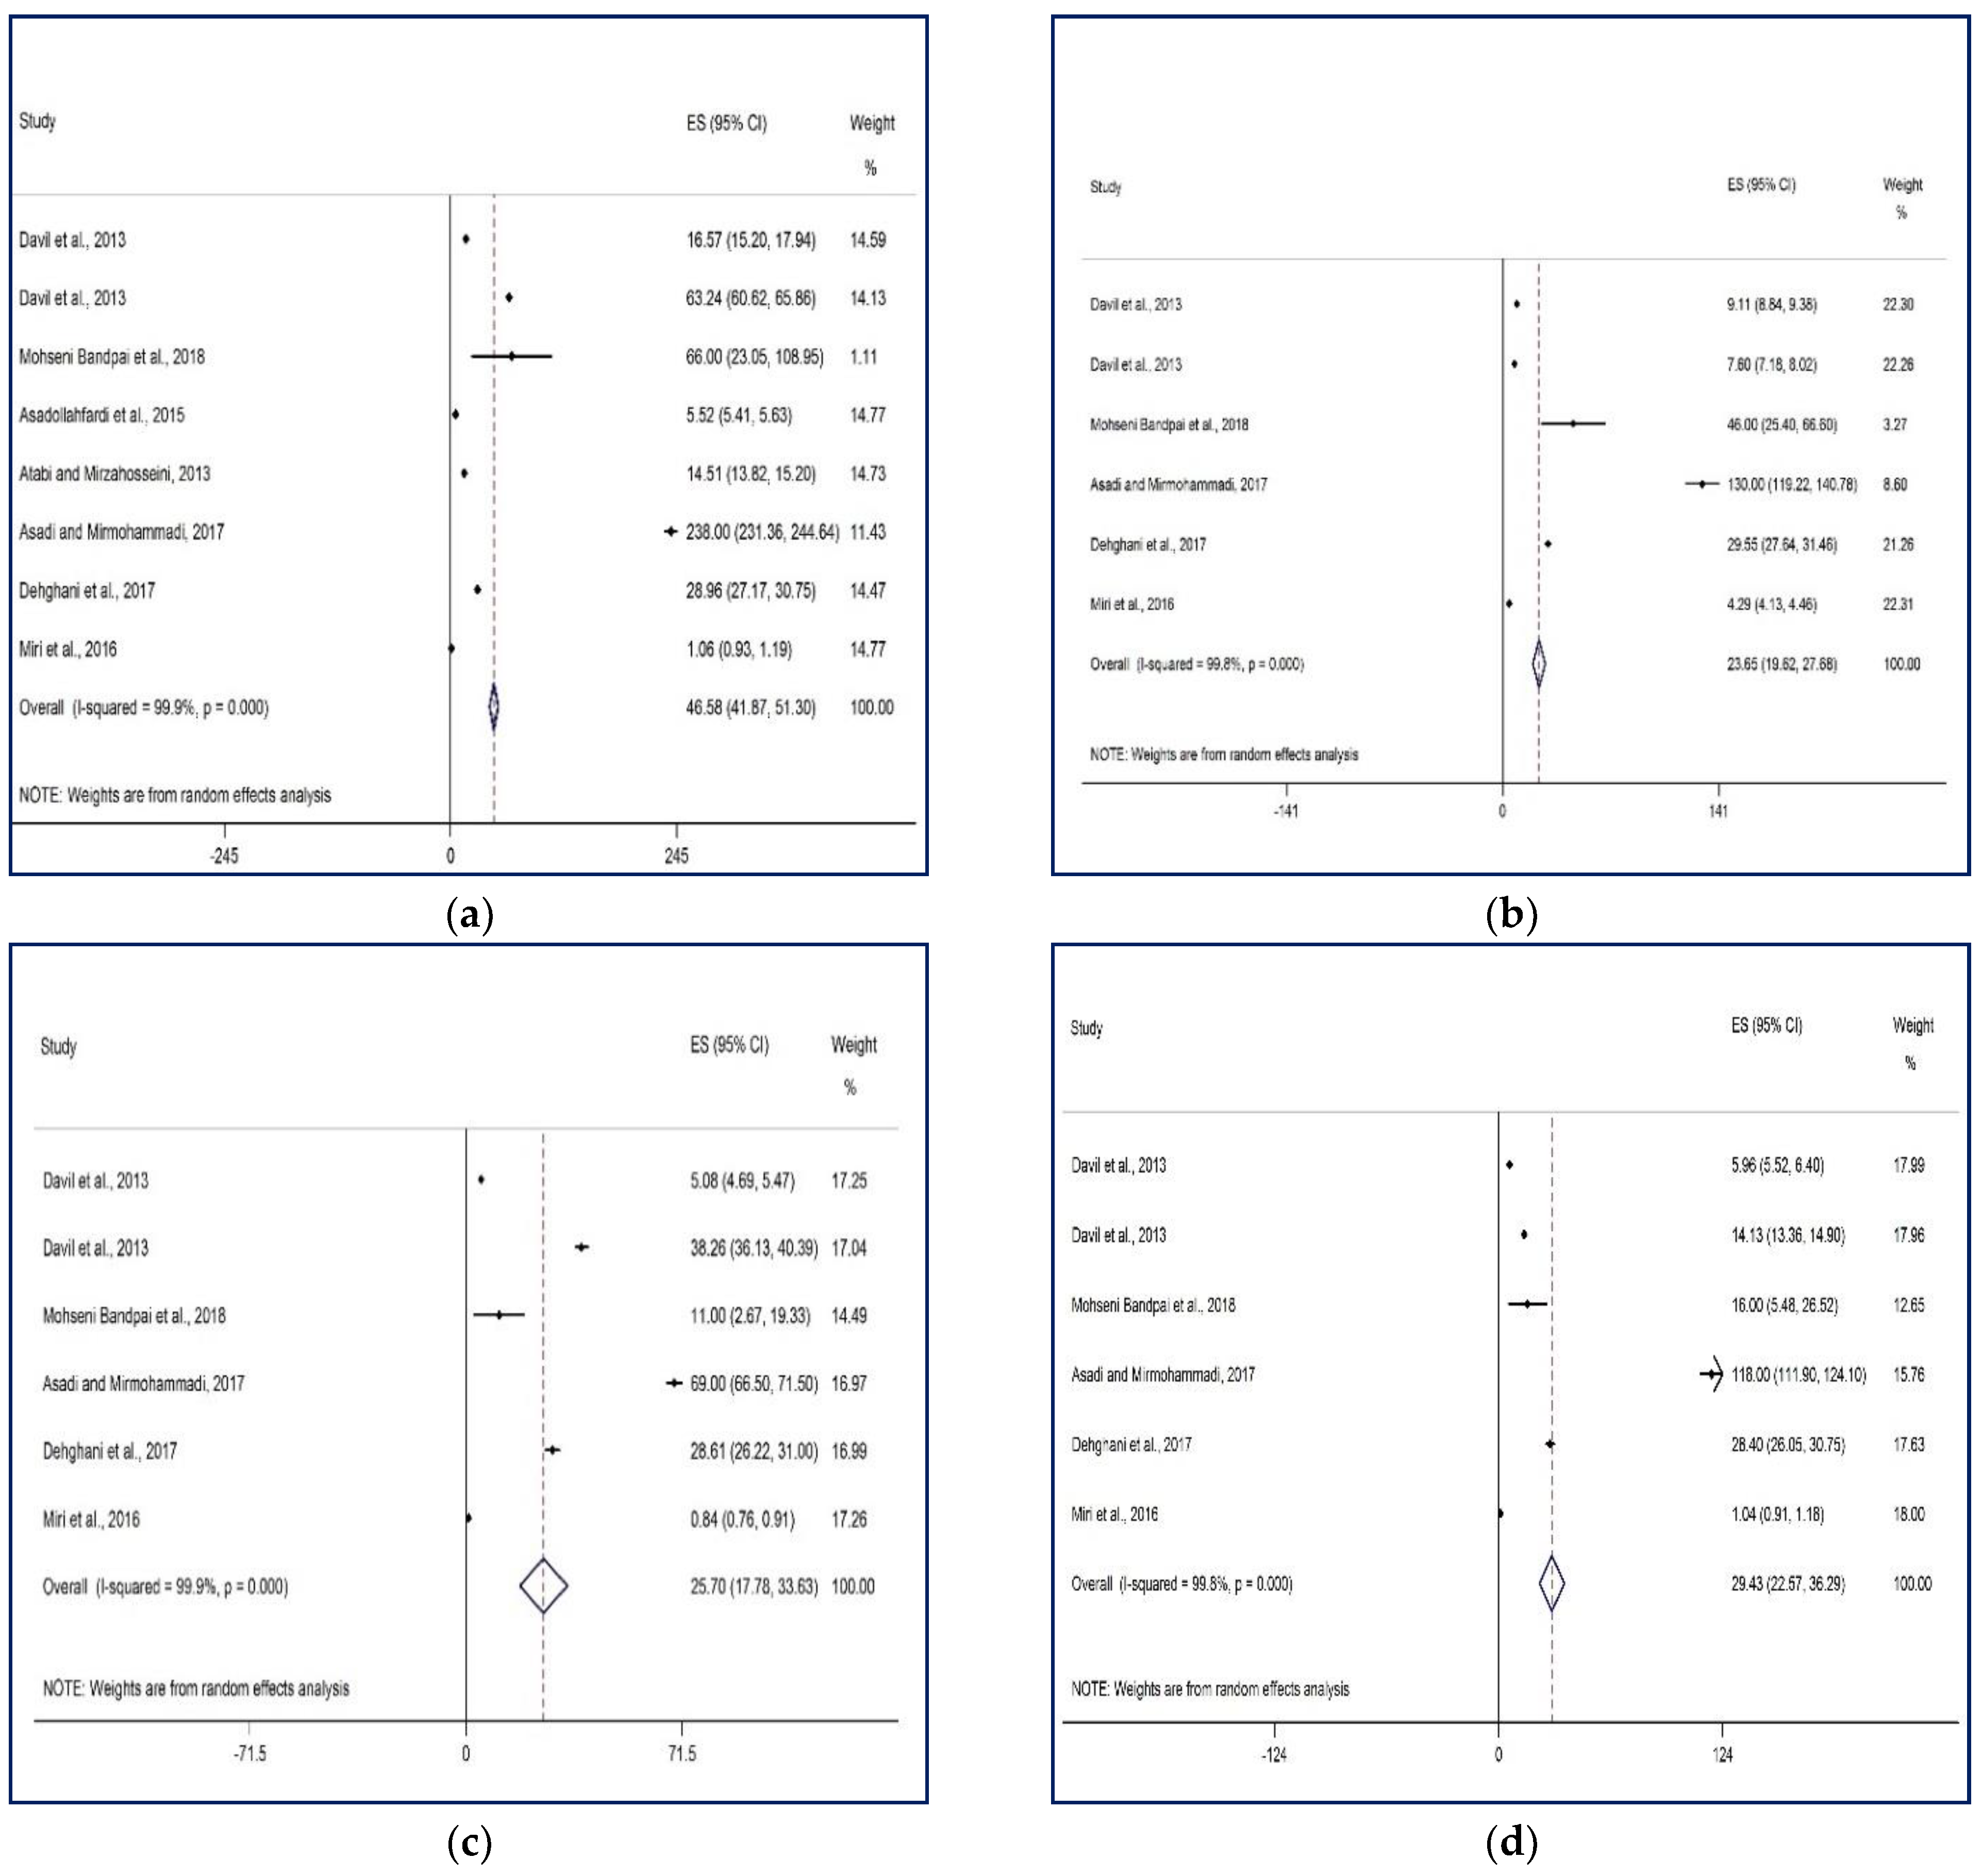
3.2. Concentration of BTEX
3.3. The Ratio between BTEX Compounds
3.4. Health Risk Assessment
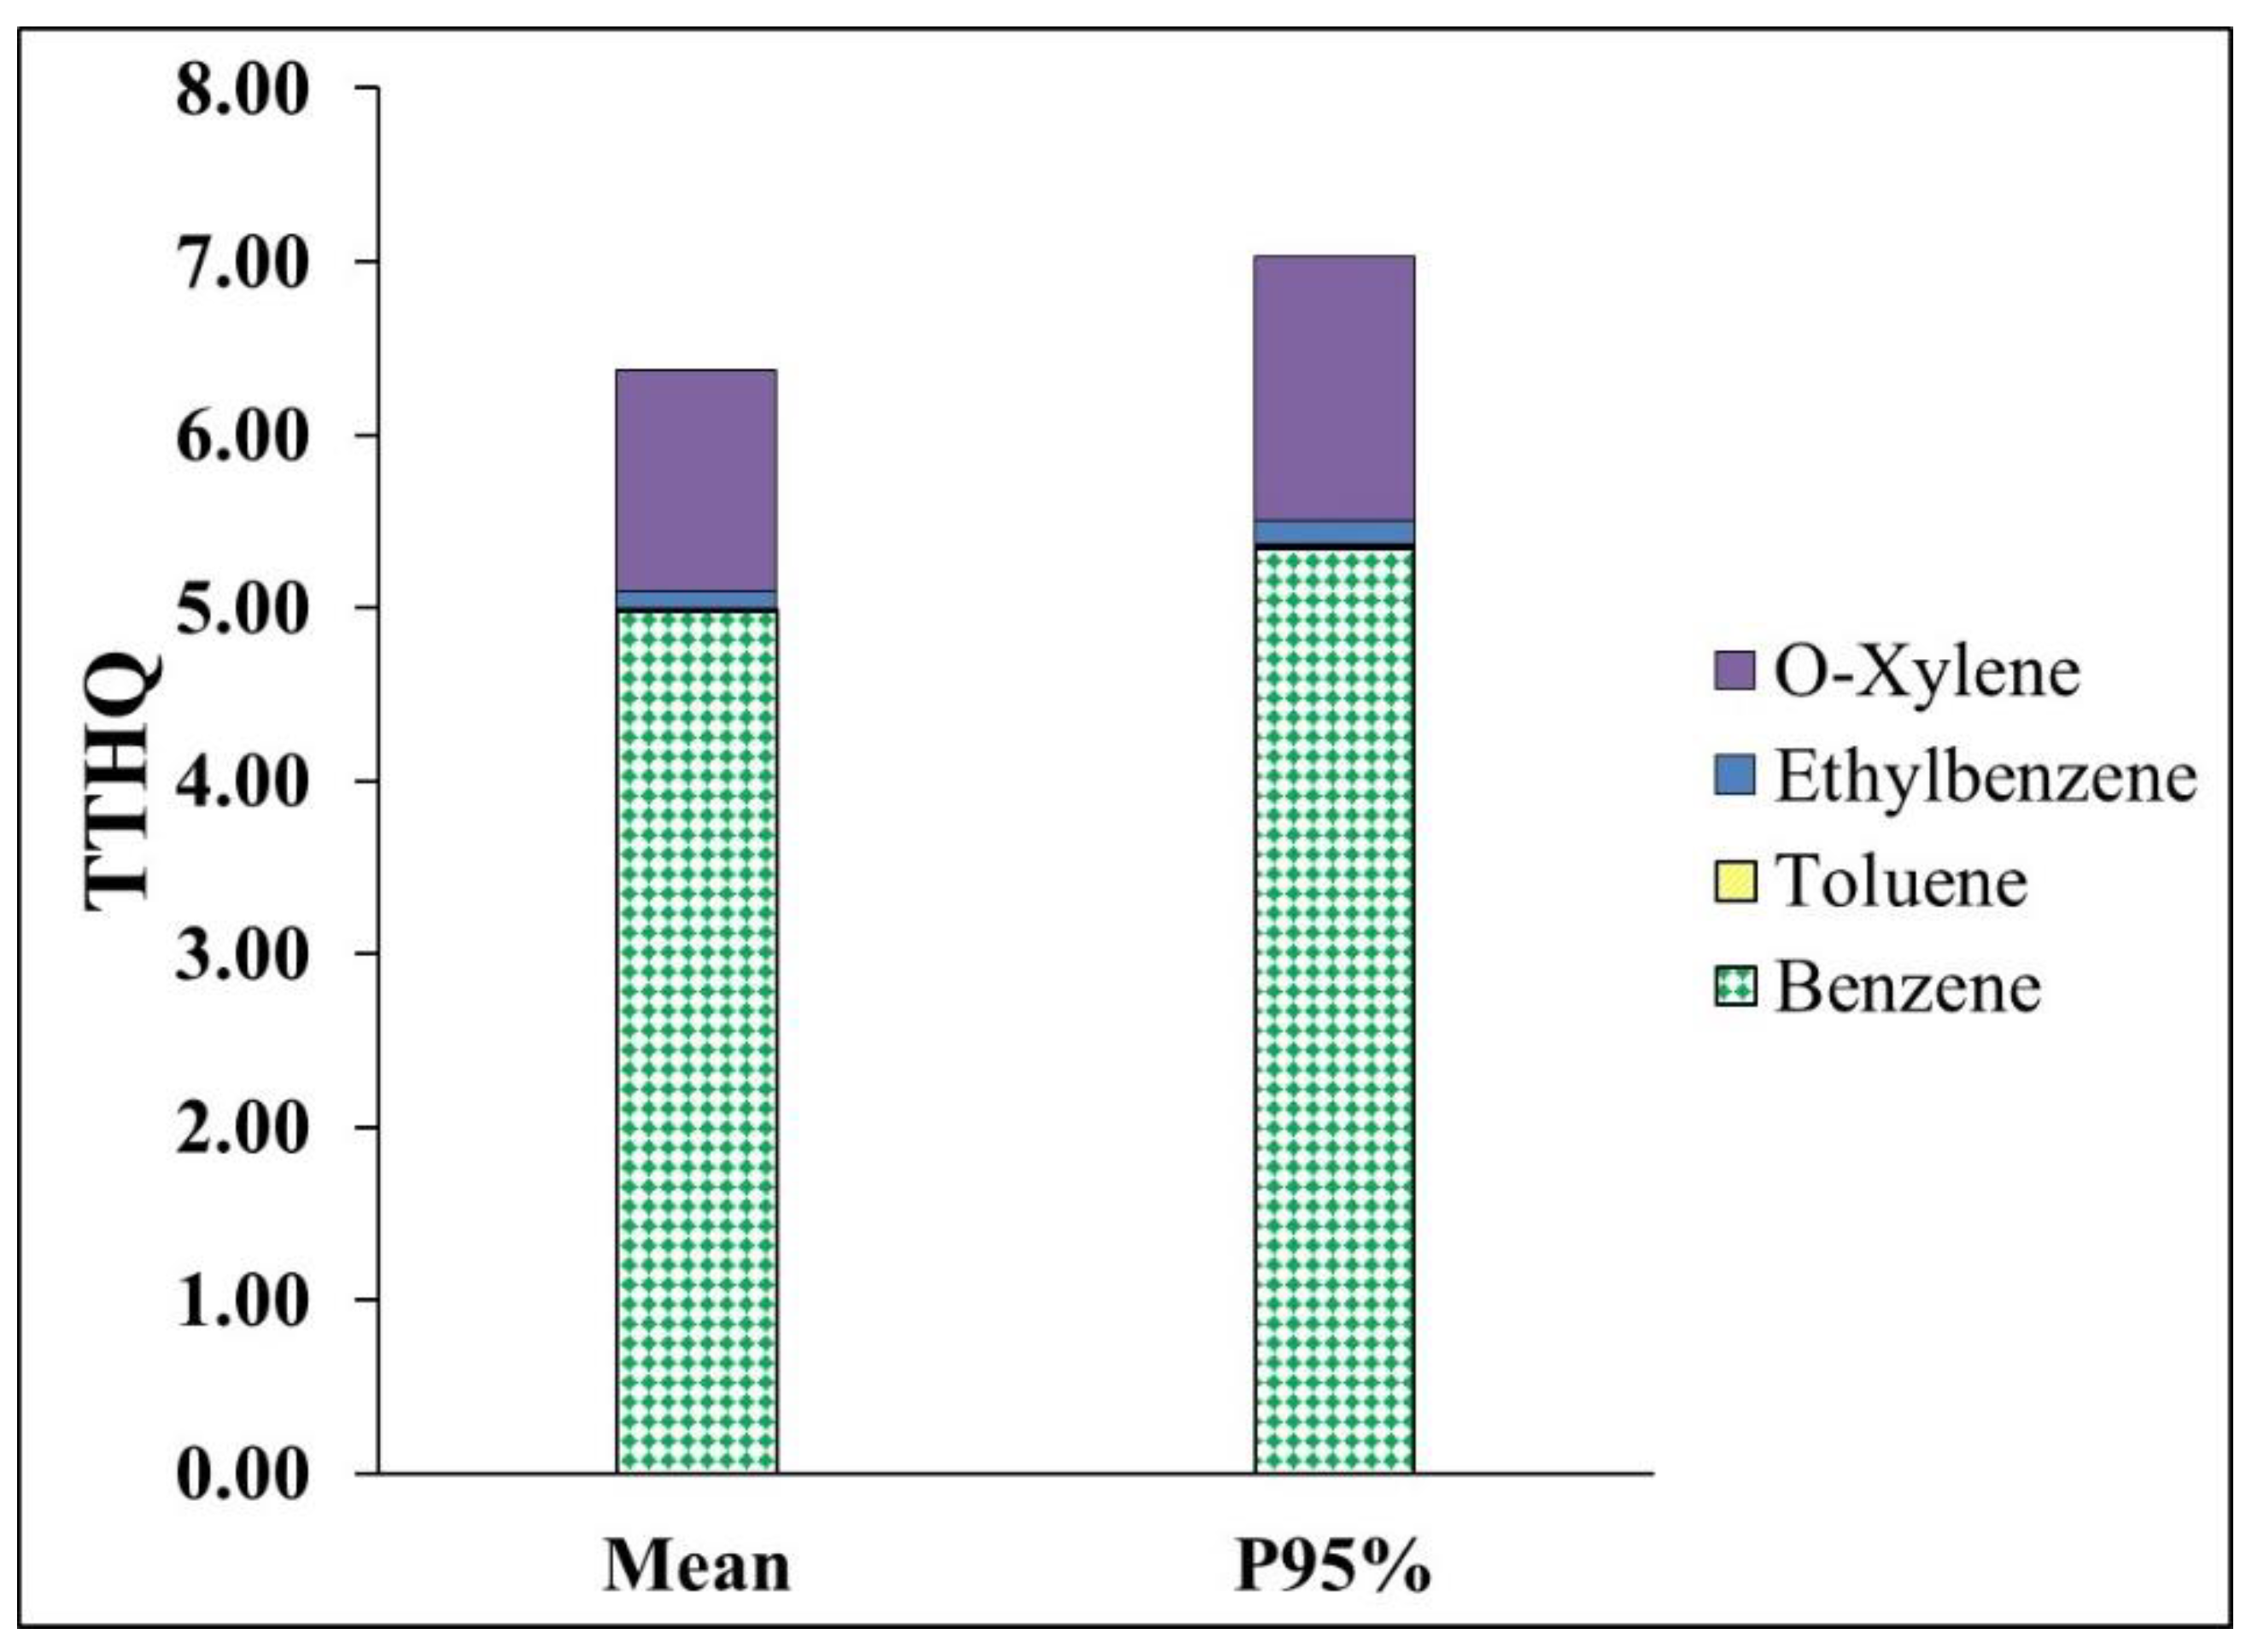
3.4.1. Non-Carcinogenic Risk Assessment
3.4.2. Carcinogenic Risk Assessment
4. Conclusions
Author Contributions
Funding
Acknowledgments
Conflicts of Interest
References
- Al-Dabbous, A.N.; Kumar, P. Number and size distribution of airborne nanoparticles during summertime in Kuwait: First observations from the Middle East. Environ. Sci. Technol. 2014, 48, 13634–13643. [Google Scholar] [CrossRef] [PubMed]
- Bouarar, I.; Wang, X.; Brasseur, G.P. Air Pollution in Eastern Asia: An Integrated Perspective; Springer: Berlin, Germany, 2017; Volume 16. [Google Scholar]
- Cecchi, L.; Annesi-Maesano, I. News on Climate change, air pollution and allergic trigger factors of asthma. J. Investig. Allergol. Clin. Immunol. 2018, 28, 91–97. [Google Scholar]
- Ghozikali, M.G.; Heibati, B.; Naddafi, K.; Kloog, I.; Conti, G.O.; Polosa, R.; Ferrante, M. Evaluation of chronic obstructive pulmonary disease (COPD) attributed to atmospheric O3, NO2, and SO2 using Air Q Model (2011–2012 year). Environ. Res. 2016, 144, 99–105. [Google Scholar] [CrossRef] [PubMed]
- Lin, R.-T.; Christiani, D.C.; Kawachi, I.; Chan, T.-C.; Chiang, P.-H.; Chan, C.-C. Increased risk of respiratory mortality associated with the high-tech manufacturing industry: A 26-Year study. Int. J. Environ. Res. Public Health. 2016, 13, 557. [Google Scholar] [CrossRef] [PubMed]
- Pekey, B.; Yılmaz, H. The use of passive sampling to monitor spatial trends of volatile organic compounds (VOCs) at an industrial city of Turkey. Microchem. J. 2011, 97, 213–219. [Google Scholar] [CrossRef]
- Sarkhosh, M.; Mahvi, A.H.; Zare, M.R.; Fakhri, Y.; Shamsolahi, H.R. Indoor contaminants from hardcopy devices: Characteristics of VOCs in photocopy centers. Atmos. Environ. 2012, 63, 307–312. [Google Scholar] [CrossRef]
- Hoque, R.R.; Khillare, P.; Agarwal, T.; Shridhar, V.; Balachandran, S. Spatial and temporal variation of BTEX in the urban atmosphere of Delhi, India. Sci. Total Environ. 2008, 392, 30–40. [Google Scholar] [CrossRef] [PubMed]
- Sharma, S.; Goel, A.; Gupta, D.; Kumar, A.; Mishra, A.; Kundu, S.; Chatani, S.; Klimont, Z. Emission inventory of non-methane volatile organic compounds from anthropogenic sources in India. Atmos. Environ. 2015, 102, 209–219. [Google Scholar] [CrossRef]
- Kim, H.; Bernstein, J.A. Air pollution and allergic disease. Curr. Allergy Asthma Rep. 2009, 9, 128–133. [Google Scholar] [CrossRef] [PubMed]
- Seaton, A.; Godden, D.; MacNee, W.; Donaldson, K. Particulate air pollution and acute health effects. Lancet 1995, 345, 176–178. [Google Scholar] [CrossRef]
- Thurston, G.D.; Burnett, R.T.; Turner, M.C.; Shi, Y.; Krewski, D.; Lall, R.; Ito, K.; Jerrett, M.; Gapstur, S.M.; Diver, W.R. Ischemic heart disease mortality and long-term exposure to source-related components of US fine particle air pollution. Environ. Health Perspect. 2016, 124, 785. [Google Scholar] [PubMed]
- Saalberg, Y.; Wolff, M. VOC breath biomarkers in lung cancer. Clin. Chim. Acta 2016, 459, 5–9. [Google Scholar] [CrossRef] [PubMed]
- Carlos-Wallace, F.M.; Zhang, L.; Smith, M.T.; Rader, G.; Steinmaus, C. Parental, in utero, and early-life exposure to benzene and the risk of childhood leukemia: A meta-analysis. Am. J. Epidemiol. 2015, 183, 1–14. [Google Scholar] [CrossRef] [PubMed]
- Masih, A.; Lall, A.S.; Taneja, A.; Singhvi, R. Exposure profiles, seasonal variation and health risk assessment of BTEX in indoor air of homes at different microenvironments of a terai province of northern India. Chemosphere 2017, 176, 8–17. [Google Scholar] [CrossRef] [PubMed]
- Partovi, E.; Fathi, M.; Assari, M.J.; Esmaeili, R.; Pourmohamadi, A.; Rahimpour, R. Risk assessment of occupational exposure to BTEX in the National Oil Distribution Company in Iran. Chronic Dis. J. 2018, 4, 48–55. [Google Scholar]
- International Agency for Research on Cancer (IARC). Agents Classified by the IARC Monographs; IARC: Lyon, France, 2011; Volume 1–102. [Google Scholar]
- Heshmati, A.; Ghadimi, S.; Khaneghah, A.M.; Barba, F.J.; Lorenzo, J.M.; Nazemi, F.; Fakhri, Y. Risk assessment of benzene in food samples of Iran’s market. Food Chem. Toxicol. 2018, 114, 278–284. [Google Scholar] [CrossRef] [PubMed]
- Mansha, M.; Saleemi, A.R.; Naqvi, J.H. Status and spatial visualization of toxic pollutants (BTEX) in urban atmosphere. Adv. Chem. Eng. Sci. 2011, 1, 231. [Google Scholar] [CrossRef]
- Helmes, C.; Atkinson, D.; Jaffer, J.; Sigman, C.; Thompson, K.; Kelsey, M.; Kraybill, H.; Munn, J. Evaluation and classification of the potential carcinogenicity of organic air pollutants. J. Environ. Sci. Health Part A 1982, 17, 321–389. [Google Scholar] [CrossRef] [PubMed]
- Possanzini, M.; Di Palo, V.; Gigliucci, P.; Scianò, M.C.T.; Cecinato, A. Determination of phase-distributed PAH in Rome ambient air by denuder/GC-MS method. Atmos. Environ. 2004, 38, 1727–1734. [Google Scholar] [CrossRef]
- Guimarães, E.D.F.; do Rego, E.C.; Cunha, H.; Rodrigues, J.M.; Figueroa-Villar, J.D. Certified reference material for traceability in environmental analysis: PAHs in toluene. J. Braz. Chem. Soc. 2014, 25, 351–360. [Google Scholar] [CrossRef]
- Henze, D.; Seinfeld, J.; Ng, N.; Kroll, J.; Fu, T.-M.; Jacob, D.J.; Heald, C. Global modeling of secondary organic aerosol formation from aromatic hydrocarbons: High-vs. low-yield pathways. Atmos. Chem. Phys. 2008, 8, 2405–2420. [Google Scholar] [CrossRef] [Green Version]
- Xie, X.; Shao, M.; Liu, Y.; Lu, S.; Chang, C.-C.; Chen, Z.-M. Estimate of initial isoprene contribution to ozone formation potential in Beijing, China. Atmos. Environ. 2008, 42, 6000–6010. [Google Scholar] [CrossRef]
- Na, K.; Kim, Y.P.; Moon, K.C. Diurnal characteristics of volatile organic compounds in the Seoul atmosphere. Atmos. Environ. 2003, 37, 733–742. [Google Scholar] [CrossRef]
- Zhang, Y.; Mu, Y.; Liu, J.; Mellouki, A. Levels, sources and health risks of carbonyls and BTEX in the ambient air of Beijing, China. J. Environ. Sci. 2012, 24, 124–130. [Google Scholar] [CrossRef] [Green Version]
- Murena, F. Air quality nearby road traffic tunnel portals: BTEX monitoring. J. Environ. Sci. 2007, 19, 578–583. [Google Scholar] [CrossRef]
- Barletta, B.; Meinardi, S.; Simpson, I.J.; Zou, S.; Rowland, F.S.; Blake, D.R. Ambient mixing ratios of nonmethane hydrocarbons (NMHCs) in two major urban centers of the Pearl River Delta (PRD) region: Guangzhou and Dongguan. Atmos. Environ. 2008, 42, 4393–4408. [Google Scholar] [CrossRef]
- Grosjean, D. In situ organic aerosol formation during a smog episode: Estimated production and chemical functionality. Atmos. Environ. Part A Gen. Top. 1992, 26, 953–963. [Google Scholar] [CrossRef]
- Song, Y.; Shao, M.; Liu, Y.; Lu, S.; Kuster, W.; Goldan, P.; Xie, S. Source apportionment of ambient volatile organic compounds in Beijing. Environ. Sci. Technol. 2007, 41, 4348–4353. [Google Scholar] [CrossRef] [PubMed]
- Lu, S.; Liu, Y.; Shao, M.; Huang, S. Chemical speciation and anthropogenic sources of ambient volatile organic compounds (VOCs) during summer in Beijing, 2004. Front. Environ. Sci. Eng. China 2007, 1, 147–152. [Google Scholar] [CrossRef]
- Gros, V.; Sciare, J.; Yu, T. Air-quality measurements in megacities: Focus on gaseous organic and particulate pollutants and comparison between two contrasted cities, Paris and Beijing. C. R. Geosci. 2007, 339, 764–774. [Google Scholar] [CrossRef]
- Jiang, Z.; Grosselin, B.; Daële, V.; Mellouki, A.; Mu, Y. Seasonal and diurnal variations of BTEX compounds in the semi-urban environment of Orleans, France. Sci. Total Environ. 2017, 574, 1659–1664. [Google Scholar] [CrossRef] [PubMed]
- Liu, K.; Zhang, C.; Cheng, Y.; Liu, C.; Zhang, H.; Zhang, G.; Sun, X.; Mu, Y. Serious BTEX pollution in rural area of the North China Plain during winter season. J. Environ. Sci. 2015, 30, 186–190. [Google Scholar] [CrossRef] [PubMed] [Green Version]
- Iranian Students News Agency (ISNA). 2017. Available online: https://www.isna.ir/news/96063118066/ (accessed on 1 February 2018).
- Soleimani, M.; Amini, N. Source Identification and Apportionment of Air Pollutants in Iran. J. Air Pollut. Health 2017, 2, 57–72. [Google Scholar]
- Davil, M.F.; Naddafi, K.; Rostami, R.; Zarei, A.; Feizizadeh, M. A mathematical model for predicting 24-h variations of BTEX concentrations in ambient air of Tehran. Int. J. Environ. Health Eng. 2013, 2, 4. [Google Scholar]
- Mohseni Bandpai, A.; Yaghoubi, M.; Hadei, M.; Salesi, M.; Shahsavani, A. Concentrations of Criteria Air Pollutants and BTEX in Mehrabad International Airport. J. Mazandaran Univ. Med. Sci. 2018, 28, 76–87. [Google Scholar]
- Asadollahfardi, G.; Mehdinejad, M.; Mirmohammadi, M.; Asadollahfardi, R. Predicting Atmospheric Concentrations of Benzene in the Southeast of Tehran using Artificial Neural Network. Asian J. Atmos. Environ. (AJAE) 2015, 9, 12–21. [Google Scholar] [CrossRef]
- Atabi, F.; Mirzahosseini, S.A.H. GIS-based assessment of cancer risk due to benzene in Tehran ambient air. Int. J. Occup. Med. Environ. Health 2013, 26, 770–779. [Google Scholar] [CrossRef] [PubMed] [Green Version]
- Asadi, M.; Mirmohammadi, M. Experimental study of benzene, toluene, ethylbenzene, and xylene (BTEX) contributions in the air pollution of Tehran, Iran. Environ. Qual. Manag. 2017, 27, 83–93. [Google Scholar] [CrossRef]
- Dehghani, M.H.; Sanaei, D.; Nabizadeh, R.; Nazmara, S.; Kumar, P. Source apportionment of BTEX compounds in Tehran, Iran using UNMIX receptor model. Air Qual. Atmos. Health 2017, 10, 225–234. [Google Scholar] [CrossRef]
- Miri, M.; Shendi, M.R.A.; Ghaffari, H.R.; Aval, H.E.; Ahmadi, E.; Taban, E.; Gholizadeh, A.; Aval, M.Y.; Mohammadi, A.; Azari, A. Investigation of outdoor BTEX: Concentration, variations, sources, spatial distribution, and risk assessment. Chemosphere 2016, 163, 601–609. [Google Scholar] [CrossRef] [PubMed]
- Higgins, J.P.; Green, S. Cochrane Handbook for Systematic Reviews of Interventions; John Wiley & Sons: Hoboken, NJ, USA, 2011; Volume 4. [Google Scholar]
- Khaneghah, A.M.; Fakhri, Y.; Raeisi, S.; Armoon, B.; Sant’Ana, A.S. Prevalence and concentration of ochratoxin A, zearalenone, deoxynivalenol and total aflatoxin in cereal-based products: A systematic review and meta-analysis. Food Chem. Toxicol. 2018, 118, 830–848. [Google Scholar] [CrossRef] [PubMed]
- Khaneghah, A.M.; Fakhri, Y.; Sant’Ana, A.S. Impact of unit operations during processing of cereal-based products on the levels of deoxynivalenol, total aflatoxin, ochratoxin A, and zearalenone: A systematic review and meta-analysis. Food Chem. 2018, 268, 611–624. [Google Scholar] [CrossRef] [PubMed]
- Dehghani, M.; Fazlzadeh, M.; Sorooshian, A.; Tabatabaee, H.R.; Miri, M.; Baghani, A.N.; Delikhoon, M.; Mahvi, A.H.; Rashidi, M. Characteristics and health effects of BTEX in a hot spot for urban pollution. Ecotoxicol. Environ. Saf. 2018, 155, 133–143. [Google Scholar] [CrossRef] [PubMed]
- Kuroki, T.; Watanabe, Y.; Teranishi, H.; Izumiyama, S.; Amemura-Maekawa, J.; Kura, F. Legionella prevalence and risk of legionellosis in Japanese households. Epidemiol. Infect. 2017, 145, 1398–1408. [Google Scholar] [CrossRef] [PubMed]
- Quan, H.; Zhang, J. Estimate of standard deviation for a log-transformed variable using arithmetic means and standard deviations. Stat. Med. 2003, 22, 2723–2736. [Google Scholar] [CrossRef] [PubMed]
- Higgins, J.; White, I.R.; Anzures-Cabrera, J. Meta-analysis of skewed data: Combining results reported on log-transformed or raw scales. Stat. Med. 2008, 27, 6072–6092. [Google Scholar] [CrossRef] [PubMed] [Green Version]
- United States Environmental Protection Agency (USEPA). Risk Assessment Guidance for Superfund. In Part A: Human Health Evaluation Manual; Part E, Supplemental Guidance for Dermal Risk Assessment; Part F, Supplemental Guidance for Inhalation Risk Assessment, Volume I. 2011. Available online: http://www.epa.gov/oswer/riskassessment/human_health_exposure.htm (accessed on 20 April 2011).
- Environmental Protection Agency (EPA). Risk Assessment Guidance for Superfund; Volume I: Human Health Evaluation Manual (Part A); EPA/540/1-89/002; USEPA: Washington, DC, USA, 2004.
- Environmental Protection Agency (EPA). Soil Screening Guidance Technical Background Document; EPA/540; Office of Solid Waste and Emergency Response: Washington, DC, USA, 1996; p. 95.
- United States Environmental Protection Agency (USEPA). Regional Screening Levels (RSLs)—Generic Tables. USEPA 2011b. 2017. Available online: http://www.epa.gov/region9/superfund/prg/index.html (accessed on 16 July 2017).
- United States Environmental Protection Agency (USEPA). Regional screening level (RSL) Summary Table (TR = 1E − 6, HQ = 1). Available online: https://www.epa.gov/risk/regional-screening-levels-rsls-generic-tables (accessed on 25 June 2013).
- Zheng, N.; Liu, J.; Wang, Q.; Liang, Z. Health risk assessment of heavy metal exposure to street dust in the zinc smelting district, Northeast of China. Sci. Total Environ. 2010, 408, 726–733. [Google Scholar] [CrossRef] [PubMed]
- United States Environmental Protection Agency (USEPA). Supplemental Guidance for Developing Soil Screening Levels for Superfund Sites; Peer Review Draft, OSWER 9355; USEPA: Washington, DC, USA, 2001; pp. 4–24.
- Ferreira-Baptista, L.; De Miguel, E. Geochemistry and risk assessment of street dust in Luanda, Angola: A tropical urban environment. Atmos. Environ. 2005, 39, 4501–4512. [Google Scholar] [CrossRef] [Green Version]
- UK-Air, Conversion Factors between ppb and µg m−3 and ppm. 2014. Available online: https://uk-air.defra.gov.uk/.../0502160851_Conversion_Factors_Between_ppb_and.p (accessed on 20 May 2014).
- De Miguel, E.; Iribarren, I.; Chacon, E.; Ordonez, A.; Charlesworth, S. Risk-based evaluation of the exposure of children to trace elements in playgrounds in Madrid (Spain). Chemosphere 2007, 66, 505–513. [Google Scholar] [CrossRef] [PubMed]
- Lim, H.-S.; Lee, J.-S.; Chon, H.-T.; Sager, M. Heavy metal contamination and health risk assessment in the vicinity of the abandoned Songcheon Au–Ag mine in Korea. J. Geochem. Explor. 2008, 96, 223–230. [Google Scholar] [CrossRef]
- Shahrbabki, P.E.; Hajimohammadi, B.; Shoeibi, S.; Elmi, M.; Yousefzadeh, A.; Conti, G.O.; Ferrante, M.; Amirahmadi, M.; Fakhri, Y.; Khaneghah, A.M. Probabilistic non-carcinogenic and carcinogenic risk assessments (Monte Carlo simulation method) of the measured acrylamide content in Tah-dig using QuEChERS extraction and UHPLC-MS/MS. Food Chem. Toxicol. 2018, 118, 361–370. [Google Scholar] [CrossRef] [PubMed]
- Ghasemidehkordi, B.; Malekirad, A.A.; Nazem, H.; Fazilati, M.; Salavati, H.; Shariatifar, N.; Rezaei, M.; Fakhri, Y.; Khaneghah, A.M. Concentration of lead and mercury in collected vegetables and herbs from Markazi province, Iran: A non-carcinogenic risk assessment. Food Chem. Toxicol. 2018, 113, 204–210. [Google Scholar] [CrossRef] [PubMed]
- Fakhri, Y.; Mohseni-Bandpei, A.; Conti, G.O.; Ferrante, M.; Cristaldi, A.; Jeihooni, A.K.; Dehkordi, M.K.; Alinejad, A.; Rasoulzadeh, H.; Mohseni, S.M.; et al. Systematic review and health risk assessment of arsenic and lead in the fished shrimps from the Persian Gulf. Food Chem. Toxicol. 2018, 113, 278–286. [Google Scholar] [CrossRef] [PubMed]
- Rahmani, J.; Alipour, S.; Miri, A.; Fakhri, Y.; Riahi, S.M.; Keramati, H.; Moradi, M.; Amanidaz, N.; Pouya, R.H.; Bahmani, Z.; et al. The prevalence of aflatoxin M1 in milk of Middle East region: A systematic review, meta-analysis and probabilistic health risk assessment. Food Chem. Toxicol. 2018, 118, 653–666. [Google Scholar] [CrossRef] [PubMed]
- Yousefi, M.; Shemshadi, G.; Khorshidian, N.; Ghasemzadeh-Mohammadi, V.; Fakhri, Y.; Hosseini, H.; Khaneghah, A.M. Polycyclic aromatic hydrocarbons (PAHs) content of edible vegetable oils in Iran: A risk assessment study. Food Chem. Toxicol. 2018, 118, 480–489. [Google Scholar] [CrossRef] [PubMed]
- Caselli, M.; de Gennaro, G.; Marzocca, A.; Trizio, L.; Tutino, M. Assessment of the impact of the vehicular traffic on BTEX concentration in ring roads in urban areas of Bari (Italy). Chemosphere 2010, 81, 306–311. [Google Scholar] [CrossRef] [PubMed]
- Xu, J.; Szyszkowicz, M.; Jovic, B.; Cakmak, S.; Austin, C.C.; Zhu, J. Estimation of indoor and outdoor ratios of selected volatile organic compounds in Canada. Atmos. Environ. 2016, 141, 523–531. [Google Scholar] [CrossRef]
- Civan, M.Y.; Elbir, T.; Seyfioglu, R.; Kuntasal, Ö.O.; Bayram, A.; Doğan, G.; Yurdakul, S.; Andiç, Ö.; Müezzinoğlu, A.; Sofuoglu, S.C.; et al. Spatial and temporal variations in atmospheric VOCs, NO2, SO2, and O3 concentrations at a heavily industrialized region in Western Turkey, and assessment of the carcinogenic risk levels of benzene. Atmos. Environ. 2015, 103, 102–113. [Google Scholar] [CrossRef]
- Gao, J.; Zhang, J.; Li, H.; Li, L.; Xu, L.; Zhang, Y.; Wang, Z.; Wang, X.; Zhang, W.; Chen, Y.; et al. Comparative study of volatile organic compounds in ambient air using observed mixing ratios and initial mixing ratios taking chemical loss into account—A case study in a typical urban area in Beijing. Sci. Total Environ. 2018, 628, 791–804. [Google Scholar] [CrossRef] [PubMed]
- Parra, M.; Elustondo, D.; Bermejo, R.; Santamaria, J. Ambient air levels of volatile organic compounds (VOC) and nitrogen dioxide (NO2) in a medium size city in Northern Spain. Sci. Total Environ. 2009, 407, 999–1009. [Google Scholar] [CrossRef] [PubMed]
- Miller, L.; Xu, X.; Wheeler, A.; Zhang, T.; Hamadani, M.; Ejaz, U. Evaluation of missing value methods for predicting ambient BTEX concentrations in two neighbouring cities in Southwestern Ontario Canada. Atmos. Environ. 2018, 181, 126–134. [Google Scholar] [CrossRef]
- Hosaini, P.N.; Khan, M.F.; Mustaffa, N.I.H.; Amil, N.; Mohamad, N.; Jaafar, S.A.; Nadzir, M.S.M.; Latif, M.T. Concentration and source apportionment of volatile organic compounds (VOCs) in the ambient air of Kuala Lumpur, Malaysia. Nat. Hazards 2017, 85, 437–452. [Google Scholar] [CrossRef]
- Nguyen, H.T.; Kim, K.-H.; Kim, M.-Y. Volatile organic compounds at an urban monitoring station in Korea. J. Hazard. Mater. 2009, 161, 163–174. [Google Scholar] [CrossRef] [PubMed]
- Buczynska, A.J.; Krata, A.; Stranger, M.; Godoi, A.F.L.; Kontozova-Deutsch, V.; Bencs, L.; Naveau, I.; Roekens, E.; Van Grieken, R. Atmospheric BTEX-concentrations in an area with intensive street traffic. Atmos. Environ. 2009, 43, 311–318. [Google Scholar] [CrossRef]
- Kerbachi, R.; Boughedaoui, M.; Bounoua, L.; Keddam, M. Ambient air pollution by aromatic hydrocarbons in Algiers. Atmos. Environ. 2006, 40, 3995–4003. [Google Scholar] [CrossRef]
- Khoder, M.I. Ambient levels of volatile organic compounds in the atmosphere of Greater Cairo. Atmos. Environ. 2007, 41, 554–566. [Google Scholar] [CrossRef]
- Perry, R.; Gee, I.L. Vehicle emissions in relation to fuel composition. Sci. Total Environ. 1995, 169, 149–156. [Google Scholar] [CrossRef]
- Barletta, B.; Meinardi, S.; Rowland, F.S.; Chan, C.-Y.; Wang, X.; Zou, S.; Chan, L.Y.; Blake, D.R. Volatile organic compounds in 43 Chinese cities. Atmos. Environ. 2005, 39, 5979–5990. [Google Scholar] [CrossRef]
- Ho, K.; Lee, S.; Guo, H.; Tsai, W. Seasonal and diurnal variations of volatile organic compounds (VOCs) in the atmosphere of Hong Kong. Sci. Total Environ. 2004, 322, 155–166. [Google Scholar] [CrossRef] [PubMed]
- Hellen, H.; Hakola, H.; Laurila, T. Determination of source contributions of NMHCs in Helsinki (60 N, 25 E) using chemical mass balance and the Unmix multivariate receptor models. Atmos. Environ. 2003, 37, 1413–1424. [Google Scholar] [CrossRef]
- Rappenglück, B.; Fabian, P. Nonmethane hydrocarbons (NMHC) in the greater Munich area/Germany. Atmos. Environ. 1999, 33, 3843–3857. [Google Scholar] [CrossRef]
- Singh, H.B.; Salas, L.J.; Cantrell, B.K.; Redmond, R.M. Distribution of aromatic hydrocarbons in the ambient air. Atmos. Environ. (1967) 1985, 19, 1911–1919. [Google Scholar] [CrossRef]
- Derwent, R.; Middleton, D.; Field, R.; Goldstone, M.; Lester, J.; Perry, R. Analysis and interpretation of air quality data from an urban roadside location in central London over the period from July 1991 to July 1992. Atmos. Environ. 1995, 29, 923–946. [Google Scholar] [CrossRef]
- Liu, Y.; Shao, M.; Zhang, J.; Fu, L.; Lu, S. Distributions and source apportionment of ambient volatile organic compounds in Beijing city, China. J. Environ. Sci. Health 2005, 40, 1843–1860. [Google Scholar] [CrossRef] [PubMed]
- Atkinson, R.; Arey, J. Gas-phase tropospheric chemistry of biogenic volatile organic compounds: A review. Atmos. Environ. 2003, 37, 197–219. [Google Scholar] [CrossRef]
- Atkinson, R. Gas-phase tropospheric chemistry of organic compounds: A review. Atmos. Environ. Part A Gen. Top. 1990, 24, 1–41. [Google Scholar] [CrossRef]
- Yassaa, N.; Brancaleoni, E.; Frattoni, M.; Ciccioli, P. Isomeric analysis of BTEXs in the atmosphere using β-cyclodextrin capillary chromatography coupled with thermal desorption and mass spectrometry. Chemosphere 2006, 63, 502–508. [Google Scholar] [CrossRef] [PubMed]


| Sampling Date | Type of Monitoring Station | Monitoring Station Number | Sample Size | Concentration | Method of Detection | Ref | ||||||||
|---|---|---|---|---|---|---|---|---|---|---|---|---|---|---|
| Benzene | Toluene | Ethyl Benzene | O-Xylene | |||||||||||
| Start Time | End Time | Average | SD | Average | SD | Average | SD | Average | SD | |||||
| 23-November | 22-December-2007 | Urban | 1 | 70 | 16.57 | 5.86 | 9.11 | 1.16 | 5.08 | 1.67 | 5.96 | 1.89 | VOC71M-PID | [37] |
| 10-December | 9-January-2008 | Urban | 1 | 70 | 63.24 | 11.19 | 7.6 | 1.78 | 38.26 | 9.08 | 14.13 | 3.29 | VOC71M-PID | [37] |
| 1-December | 30-December-2015 | Urban | 1 | 20 | 66 | 98 | 46 | 47 | 11 | 19 | 16 | 24 | GC/FID | [38] |
| July | September-2010 | Urban | 14 | 948 | 5.52 | NM 1 | NM | NM | NM | NM | NM | NM | NM | [39] |
| 5-April-2010 | 25-March-2011 | Traffic | 16 | 80 | 14.51 | 3.17 | NM | NM | NM | NM | NM | NM | VOC71M-PID | [40] |
| February | July-2015 | Urban | 46 | 360 | 238 | NM | 130 | 62.04 | 69 | NM | 118 | NM | GC/FID | [41] |
| November-2014 | March-2015 | Traffic | 1 | 100 | 28.96 | 9.12 | 29.55 | 9.73 | 28.61 | 12.2 | 28.4 | 12.01 | GC/FID | [42] |
| March-2012 | March-2013 | Urban | 7 | 30 | 1.056 | NM | 4.291 | NM | 0.837 | NM | 1.044 | NM | GC/FID | [43] |
| Parameter | Define | Unit | Value | Reference |
|---|---|---|---|---|
| EC | Chronic and sub-chronic exposure concentration | µg m−3 | ─ | [54] |
| C | Concentration | mg m−3 | ─ | |
| THQ | Target Hazard Quotient | Unitless | ─ | [54] |
| TTHQ | Total target Hazard Quotient | Unitless | ─ | |
| IURBap | Inhalation unit risk | ((mg m−3)−1) | Benzene: 7.8 × 10⁶ Ethylbenzene: 2.5 × 10⁶ | [55] |
| ECR | Excessive cancer risk | Unitless | Benzene: 0.030 | [55] |
| RfCi | Inhalation reference concentrations | mg m−3 | Toluene: 5.000 Ethylbenzene: 1.000 O-Xylene: 0.100 | [55] |
| EF | Exposure frequency | day year−1 | 180 | [56] |
| ED | Exposure duration | year | Adults: 24 | [57] |
| ET | Exposure time | hour day−1 | 24 | [52] |
| ATn | Averaging time | days | ATn = Non-carcinogens: ED × EF days | [58] |
| IUR | Inhalation unit risk | (µg m−3)−1 | Benzene = 7.80 × 10⁶ Ethylbenzene = 2.50 × 10⁶ | [55] |
| 1000 | Convert factor mg to µg | ─ | ─ |
| City/Country | Sample Size | Monitoring Periods | Benzene | Toluene | Ethylbenzene | O-Xylene | Method | Type of Source | References |
|---|---|---|---|---|---|---|---|---|---|
| Bari/Italy | NM 1 | April, September and October 2008 | 2.29 ± 1.59 | 4.76 ± 3.41 | 0.92 ± 0.66 | 1.3 ± 0.94 | GC/MS | Urban | [67] |
| 18 areas/Canada | NM | September 2009 and December 2011 | 0.58 | 1.55 | 0.24 | 0.24 | GC/MS | Urban | [68] |
| Aliaga/Western Turkey | 13 | 2005 and 2007 | 0.68 ± 0.68 | 1.6 ± 1.1 | 0.25 ± 0.17 | 0.16 ± 0.13 | GC/FID | Urban | [69] |
| Kocaeli/Turkey | 49 | July 2006 | 2.26 ± 3.20 | 35.51 ± 39.55 | 9.72 ± 9.20 | 12.46 ± 12.46 | GC/FID | Urban | [6] |
| Beijing/China | 41 | 26 February and 7 March 2013 | 1.73 ± 1.68 | 2.21 ± 2.10 | 0.38 ± 0.38 | 0.19 ± 0.17 | GC/FID | Urban | [70] |
| Orleans/France | 56 | Winter 2011 | 0.95 | 0.27 | 0.95 | 0.14 | (TD–GC–MSD) | Semi-urban | [33] |
| Navarra/Spain | 932 | June 2006 to June 2007 | 2.84 | 13.26 | 2.15 | 2.63 | GC/MS | Urban | [71] |
| Sarnia/Canada | 37 | 2004–2005 | 0.93 | 2.54 | 0.46 | 0.49 | GC/MS | Urban | [72] |
| Windsor/Canada | 42 | 2004–2005 | 0.76 | 2.88 | 0.44 | 0.45 | GC/MS | Urban | [72] |
| Kuala Lumpur/Malaysia | 28 | December 2013 and January 2014 | 58.374 | 113.805 | 661.3 | NM | GC/MS | Urban | [73] |
| Seoul/South Korea | 8003 | 2004 | 2.829 | 32.76 | 80.75 | NM | GC/FID | Urban | [74] |
| Present study | 1678 | 2007–2015 | 149.18 | 87.97 | 110.12 | 127.14 |
| Area Study | B/T | E/O-X | References |
|---|---|---|---|
| Guangzhou/China | 0.35 | [28] | |
| Hong Kong/China | 0.13 | [80] | |
| Helsinki/Finland | 0.36 | [81] | |
| Munich/Germany | 0.53 | [82] | |
| Louis/India | 0.93 | [83] | |
| Paris/France | 0.15 | [32] | |
| London/English | 0.65 | [84] | |
| Seoul/South Korea | 0.13 | [25] | |
| Beijing/China | 0.71 | [85] | |
| Beijing/China | 0.87 | [24] | |
| Bari/Italy | 0.48 | 0.71 | [67] |
| 18 areas/Canada | 0.37 | 1.00 | [68] |
| Aliaga/Western Turkey | 0.43 | 1.56 | [69] |
| Kocaeli/Turkey | 0.06 | 0.78 | [6] |
| Beijing/China | 0.78 | 2.00 | [70] |
| Orleans/France | 3.49 | 6.50 | [33] |
| Navarra/Spain | 0.21 | 0.82 | [71] |
| Sarnia/Canada | 0.37 | 0.94 | [72] |
| Windsor/Canada | 0.26 | 0.98 | [72] |
| Kuala Lumpur/Malaysia | 0.51 | [73] | |
| Tehran/Iran | 1.69 | 0.86 | Present study |
| VOCs Compounds | C (Mean) | C (P95%) | EC (Mean) | EC (P95%) | RfCi | THQ (Mean) | THQ (P95%) |
|---|---|---|---|---|---|---|---|
| µg/m−3 | µg/m−3 | mg/m3 | |||||
| Benzene | 149.178 | 160.27 | 0.149 | 0.160 | 0.03 | 4.973 | 5.342 |
| Toluene | 87.970 | 107 | 0.088 | 0.107 | 5.00 | 0.018 | 0.021 |
| Ethylbenzene | 110.150 | 142 | 0.110 | 0.142 | 1.00 | 0.110 | 0.142 |
| O-Xylene | 127.160 | 152.2 | 0.127 | 0.152 | 0.10 | 1.272 | 1.522 |
| VOCs Compounds | EC (Mean) | EC (P95%) | IUR | ECR (Mean) | ECR (P95%) |
|---|---|---|---|---|---|
| Benzene | 0.149 | 0.160 | 7.80 × 10⁶ | 1.16 × 10⁶ | 1.25 × 10⁶ |
| Ethylbenzene | 0.110 | 0.142 | 2.50 × 10⁶ | 8.59 × 10⁷ | 1.11 × 10⁶ |
© 2018 by the authors. Licensee MDPI, Basel, Switzerland. This article is an open access article distributed under the terms and conditions of the Creative Commons Attribution (CC BY) license (http://creativecommons.org/licenses/by/4.0/).
Share and Cite
Abtahi, M.; Fakhri, Y.; Oliveri Conti, G.; Ferrante, M.; Taghavi, M.; Tavakoli, J.; Heshmati, A.; Keramati, H.; Moradi, B.; Amanidaz, N.; et al. The Concentration of BTEX in the Air of Tehran: A Systematic Review-Meta Analysis and Risk Assessment. Int. J. Environ. Res. Public Health 2018, 15, 1837. https://doi.org/10.3390/ijerph15091837
Abtahi M, Fakhri Y, Oliveri Conti G, Ferrante M, Taghavi M, Tavakoli J, Heshmati A, Keramati H, Moradi B, Amanidaz N, et al. The Concentration of BTEX in the Air of Tehran: A Systematic Review-Meta Analysis and Risk Assessment. International Journal of Environmental Research and Public Health. 2018; 15(9):1837. https://doi.org/10.3390/ijerph15091837
Chicago/Turabian StyleAbtahi, Mehrnoosh, Yadolah Fakhri, Gea Oliveri Conti, Margherita Ferrante, Mahmoud Taghavi, Javad Tavakoli, Ali Heshmati, Hassan Keramati, Bigard Moradi, Nazak Amanidaz, and et al. 2018. "The Concentration of BTEX in the Air of Tehran: A Systematic Review-Meta Analysis and Risk Assessment" International Journal of Environmental Research and Public Health 15, no. 9: 1837. https://doi.org/10.3390/ijerph15091837