Heat Stress Response to National-Committed Emission Reductions under the Paris Agreement
Abstract
:1. Introduction
2. Data and Methods
2.1. Emission Scenarios
2.2. Estimation of Heat Stress Response to Emissions
2.2.1. Heat Stress Index Calculation
2.2.2. Estimated Heat-Stress Change under the Paris Agreement
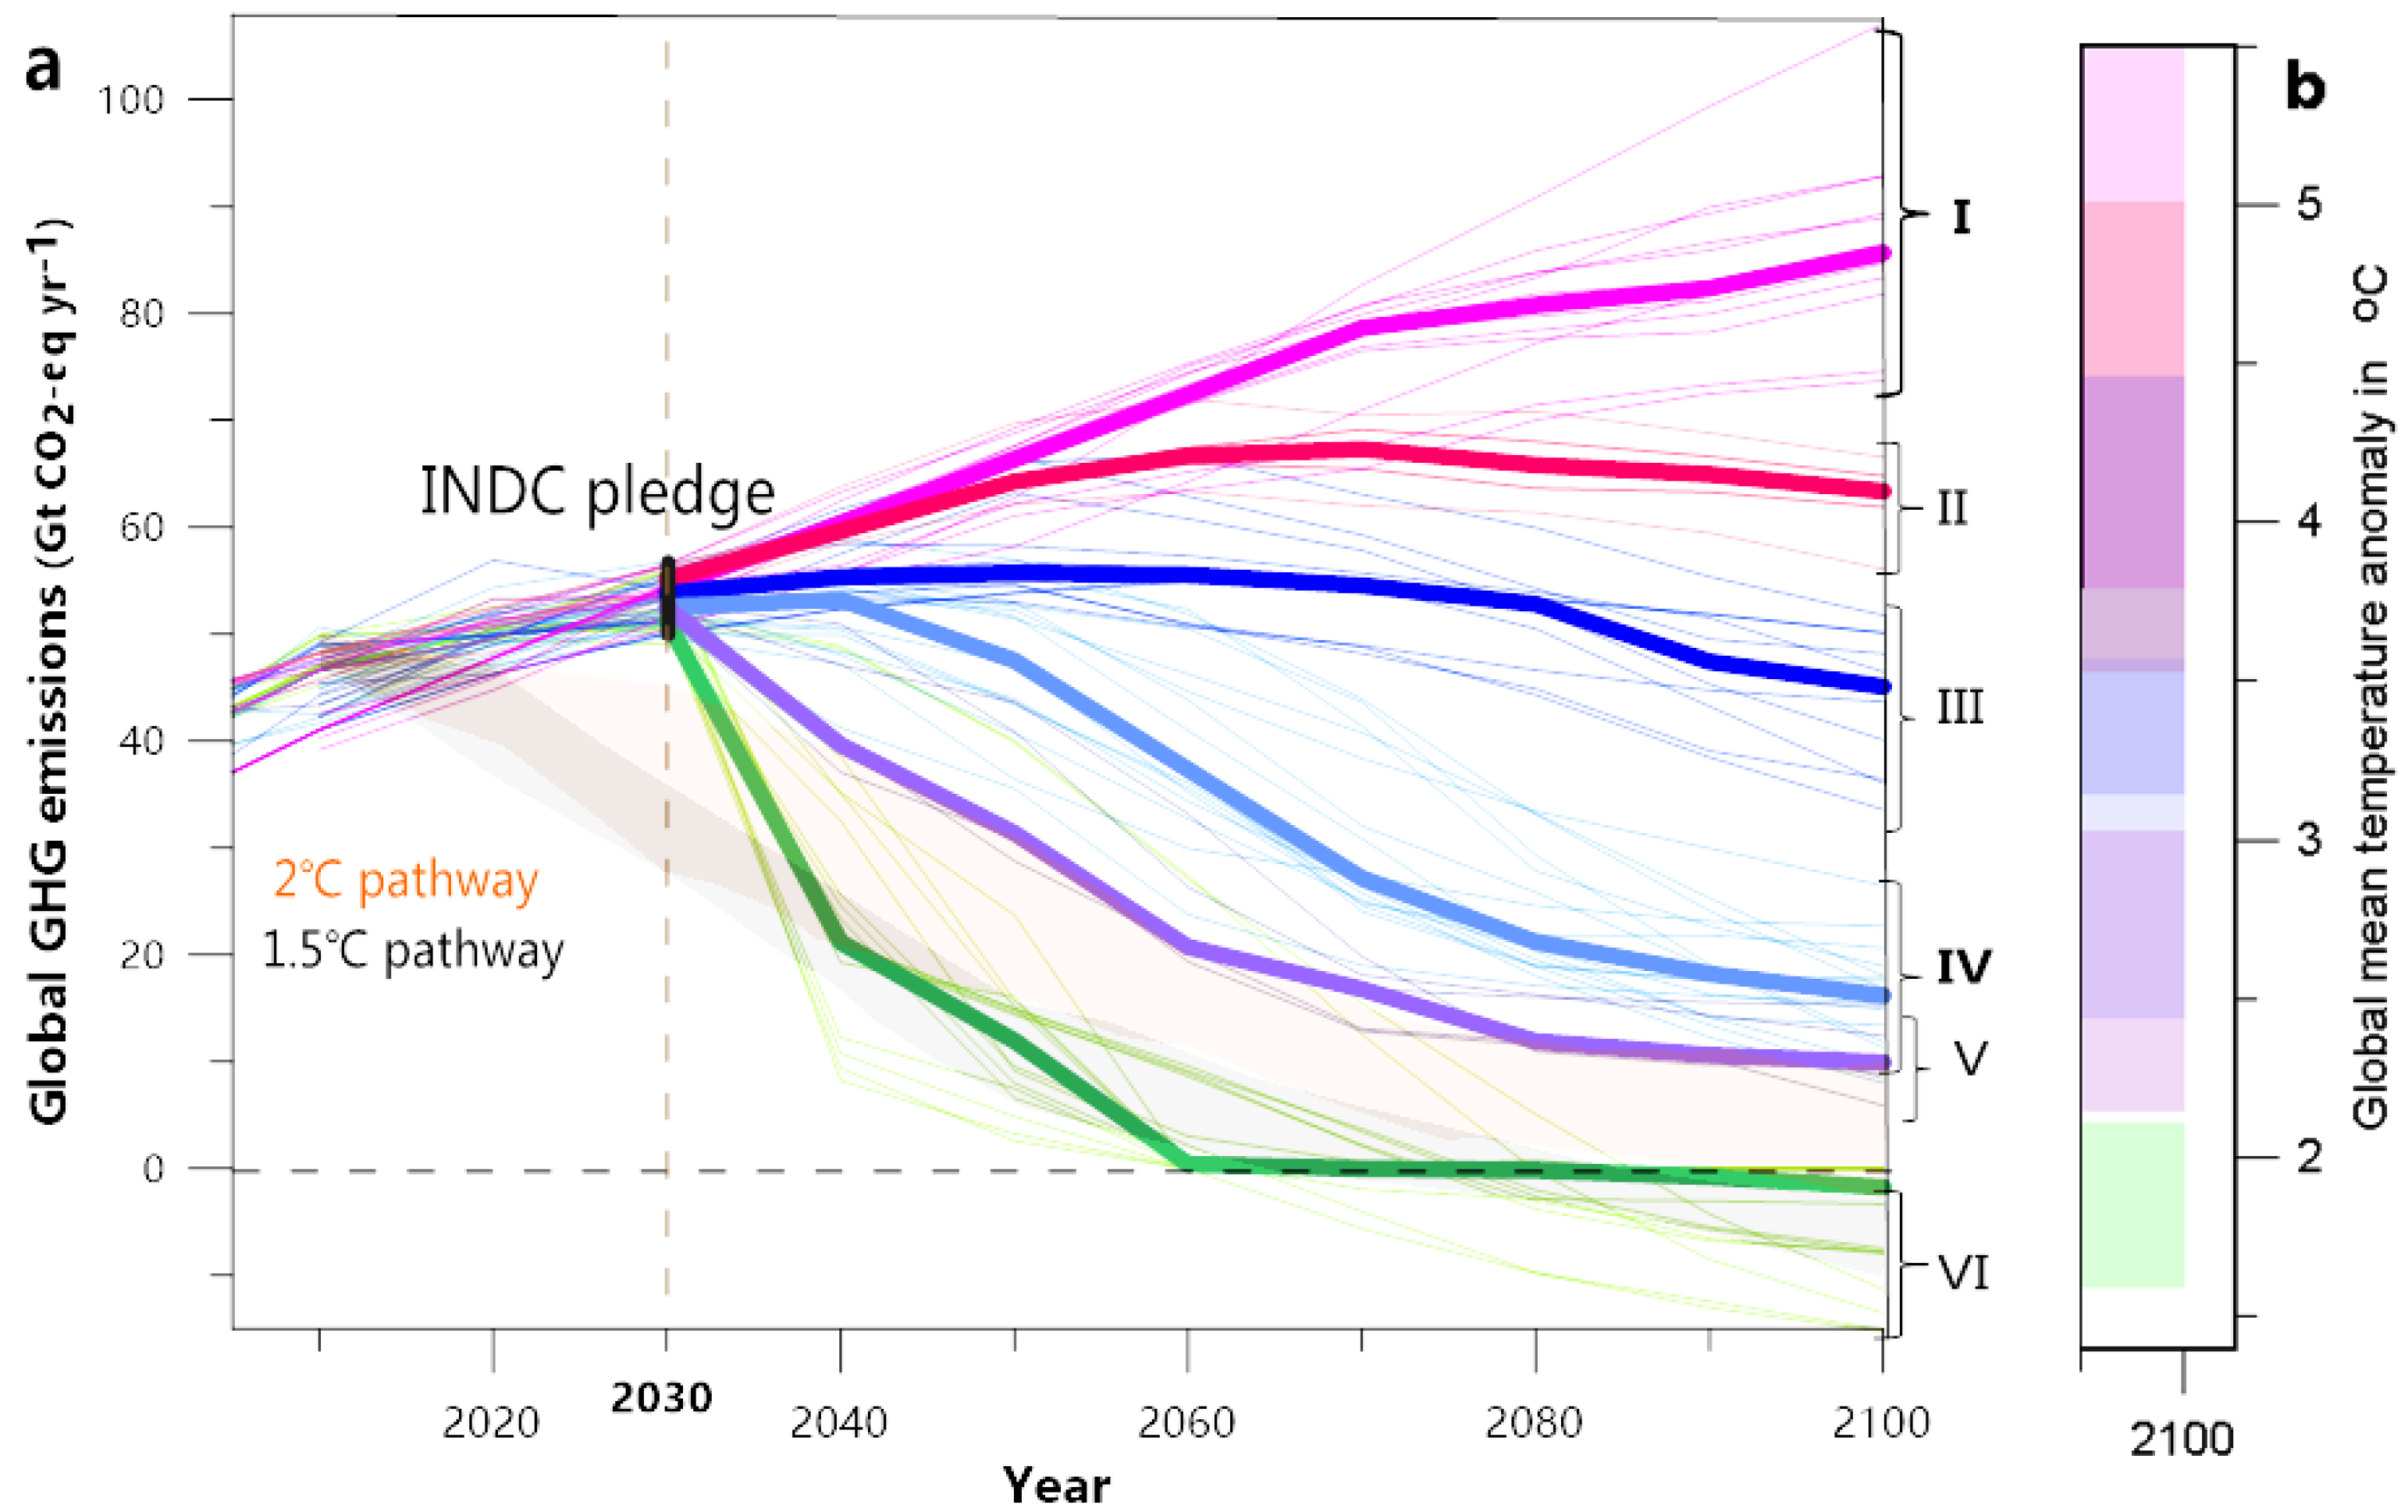
- Firstly, to assess the global mean warming level induced by each greenhouse gas emission scenario. Based on the 78 climate sensitivity experiments from the earth system models (ESMs) ensemble of CMIP5 [26], we assessed the possible corresponding global mean temperature rise for various emission scenarios [22,23]; we also integrated several other studies (temperature rise levels for some pathways have been provided) [27,28,29]. After a comprehensive assessment, we determined the most likely range of temperature increase for the continuous and delayed mitigation pathways of INDCs (Figure 1b).
- Secondly, to estimate the space pattern of heat-stress change. We used 14 ESMs from the CMIP5 archives. These models have different levels of climate sensitivity [30] and represent a wide range of climate responses to emission scenarios. Supplementary Table S2 summarizes information regarding the 14 ESMs used in this study. All model data were interpolated to a common 1.5° × 1.5° horizontal grid. The spatial pattern of the heat stress in response to each scenario was identified using a time-slice approach, where the spatial state at a specific warming point related to (and the global targets of the 1.5 °C and 2 °C scenarios) was separately obtained from the decadal time slices with the respective mean warming for each model. The spatial simulations of future heat-stress change were based on the CMIP5 models ensemble and the 5–95th percentile confidence intervals (CIs) were estimated from 10,000 bootstrapped subsamples of data. The period of 1980–2010 was referred to as the present-day baseline and the preindustrial period was defined as 1861–1900.
- Lastly, to evaluate population exposure to extreme heat stress. We used the population data from socioeconomic development scenarios of SSPs [31] and the data were changed to a 1.5 ° × 1.5° latitude/longitude grid to match the GCM resolution. The population exposed to an extreme wet-bulb temperature was calculated at a daily time resolution. If the wet-bulb temperature at a given grid cell exceeded the threshold value on a given day (for example, a wet-bulb temperature of 32 °C or 30 °C), then the grid cell was considered to be exposed, and the total number of exposed cells was counted in units of person-days. The total amount of annual exposure (in units of person-days) is the number of people multiplied by time. The uncertainty of the population exposure value is calculated by taking the 5–95th percentile confidence intervals of 14 GCMs (to reduce the influence of predicted temperature outliers in several GCMs).
3. Results
3.1. Global Heat-Stress Extreme Distribution
3.2. Global Heat-Stress Exposure Frequency
3.3. Global Population Exposure to Critical Heat Events
4. Discussion
5. Conclusions
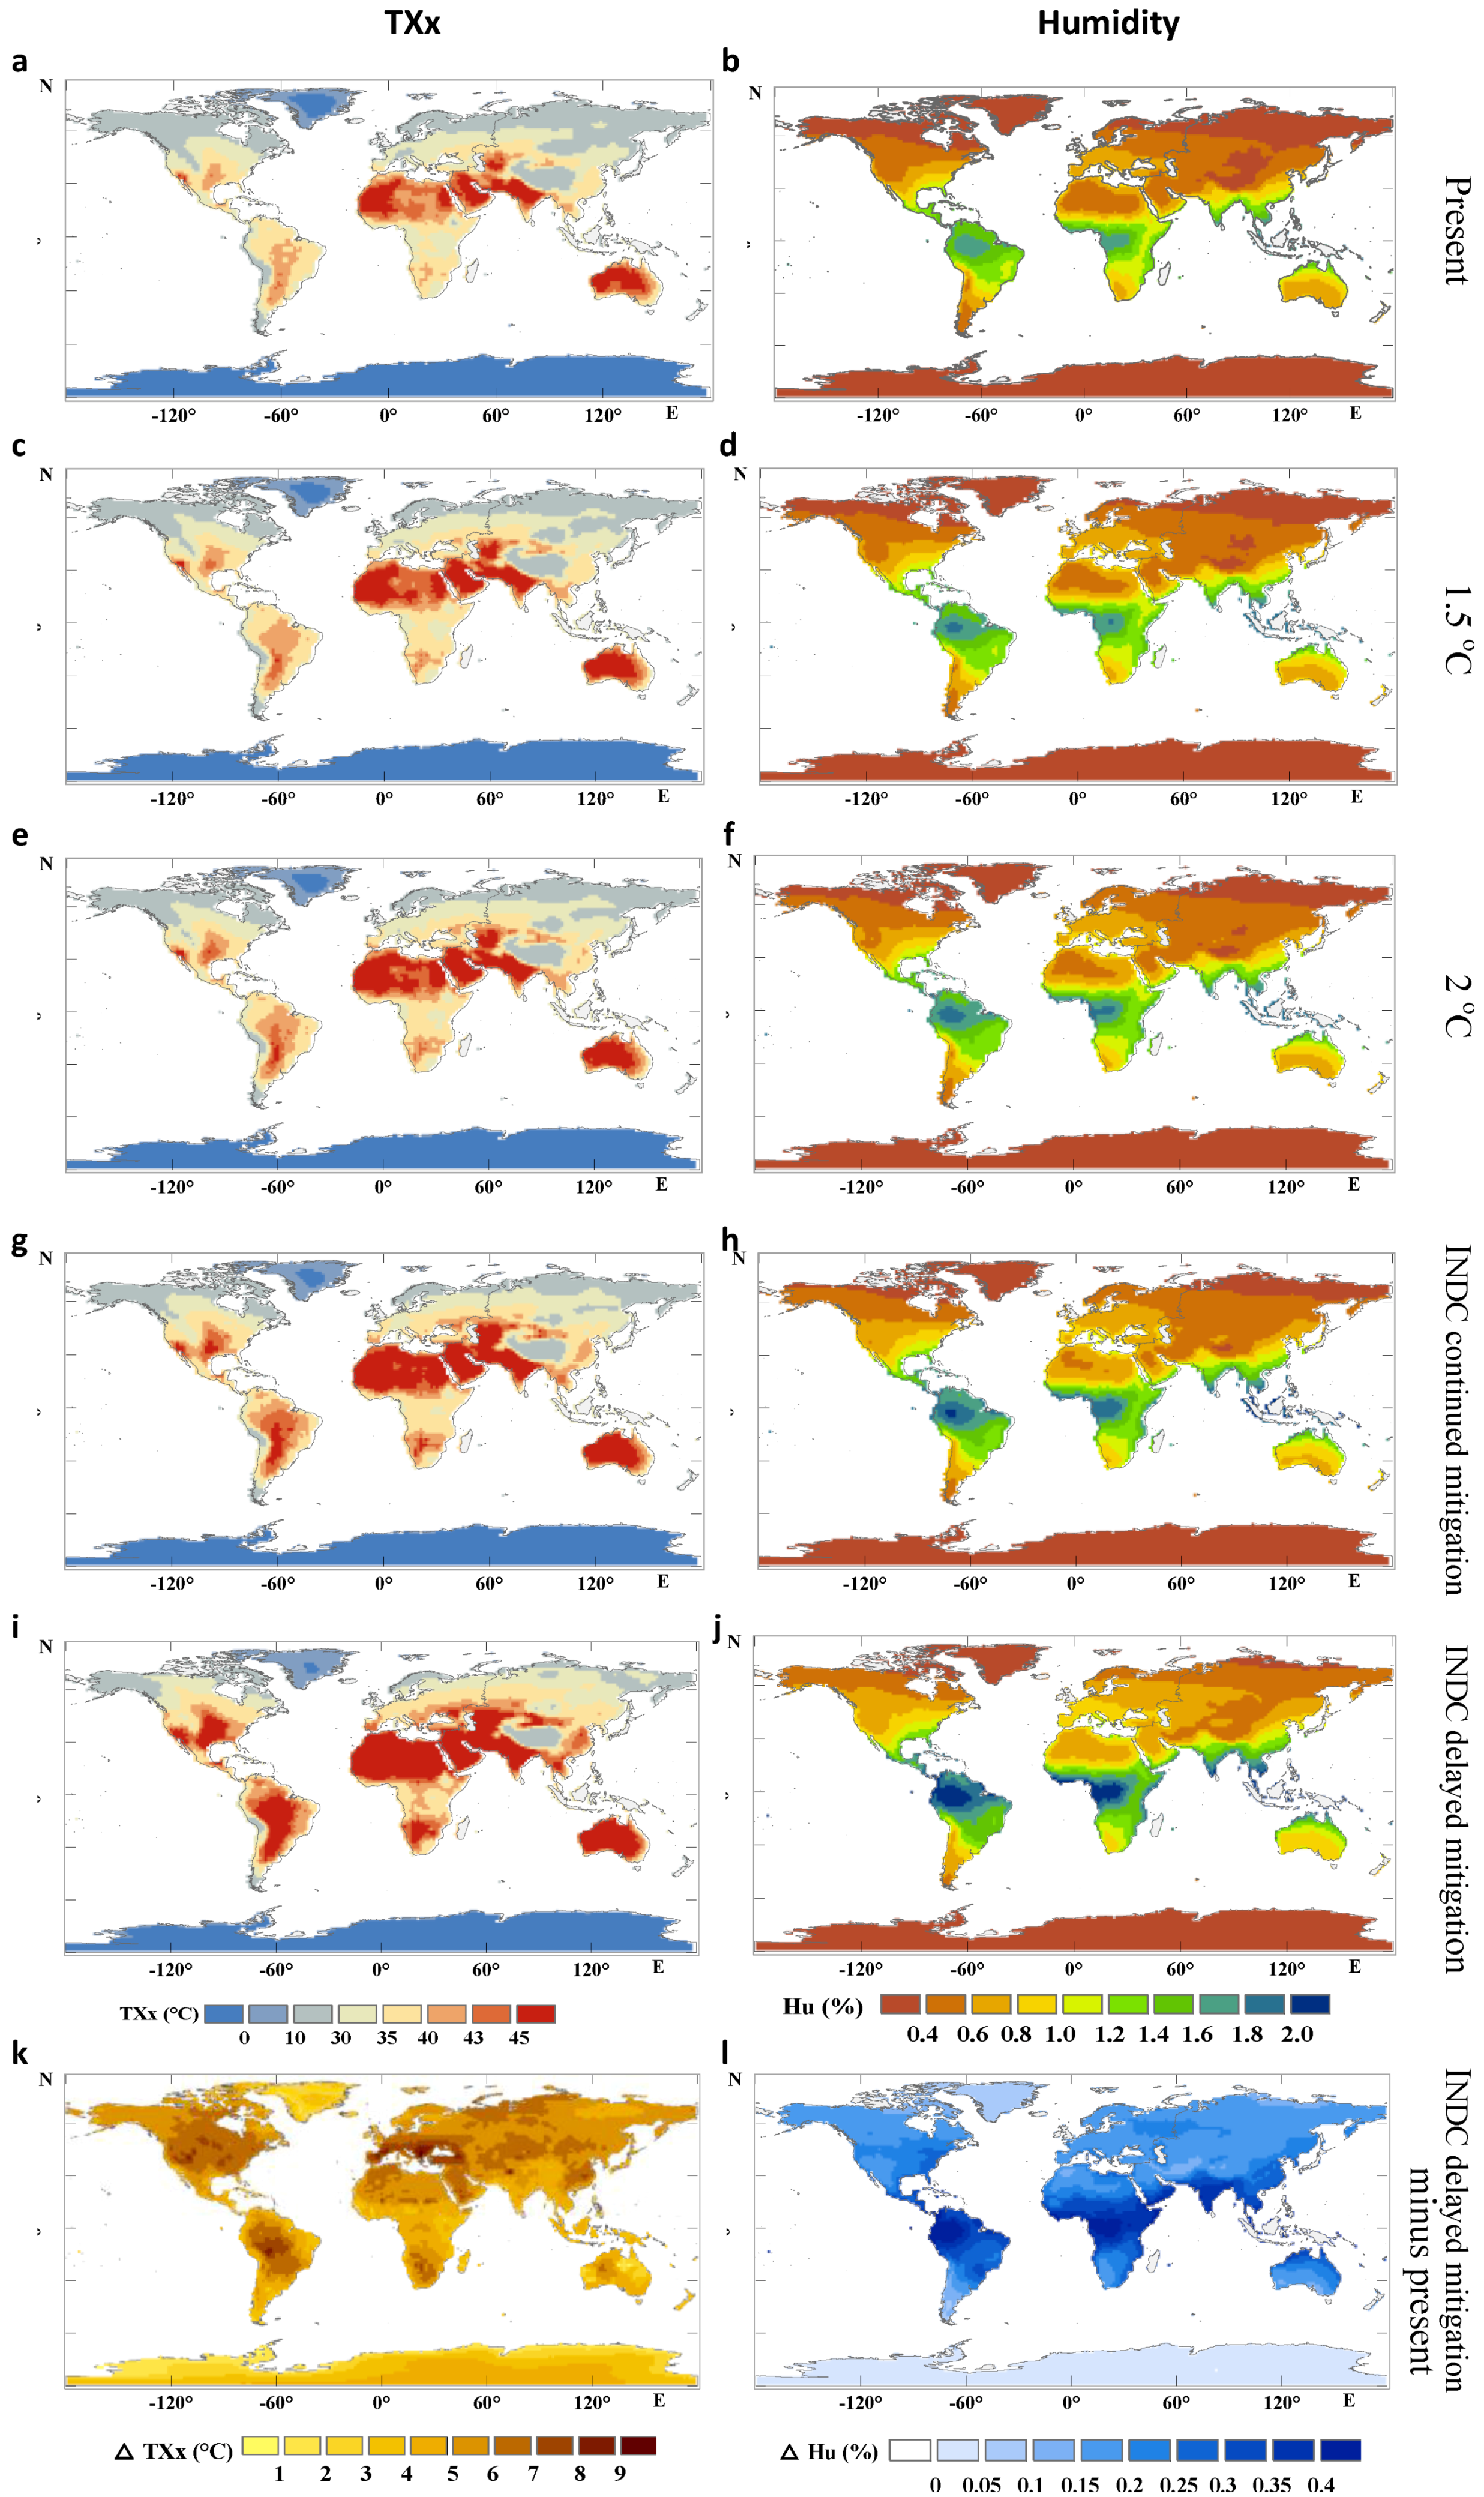
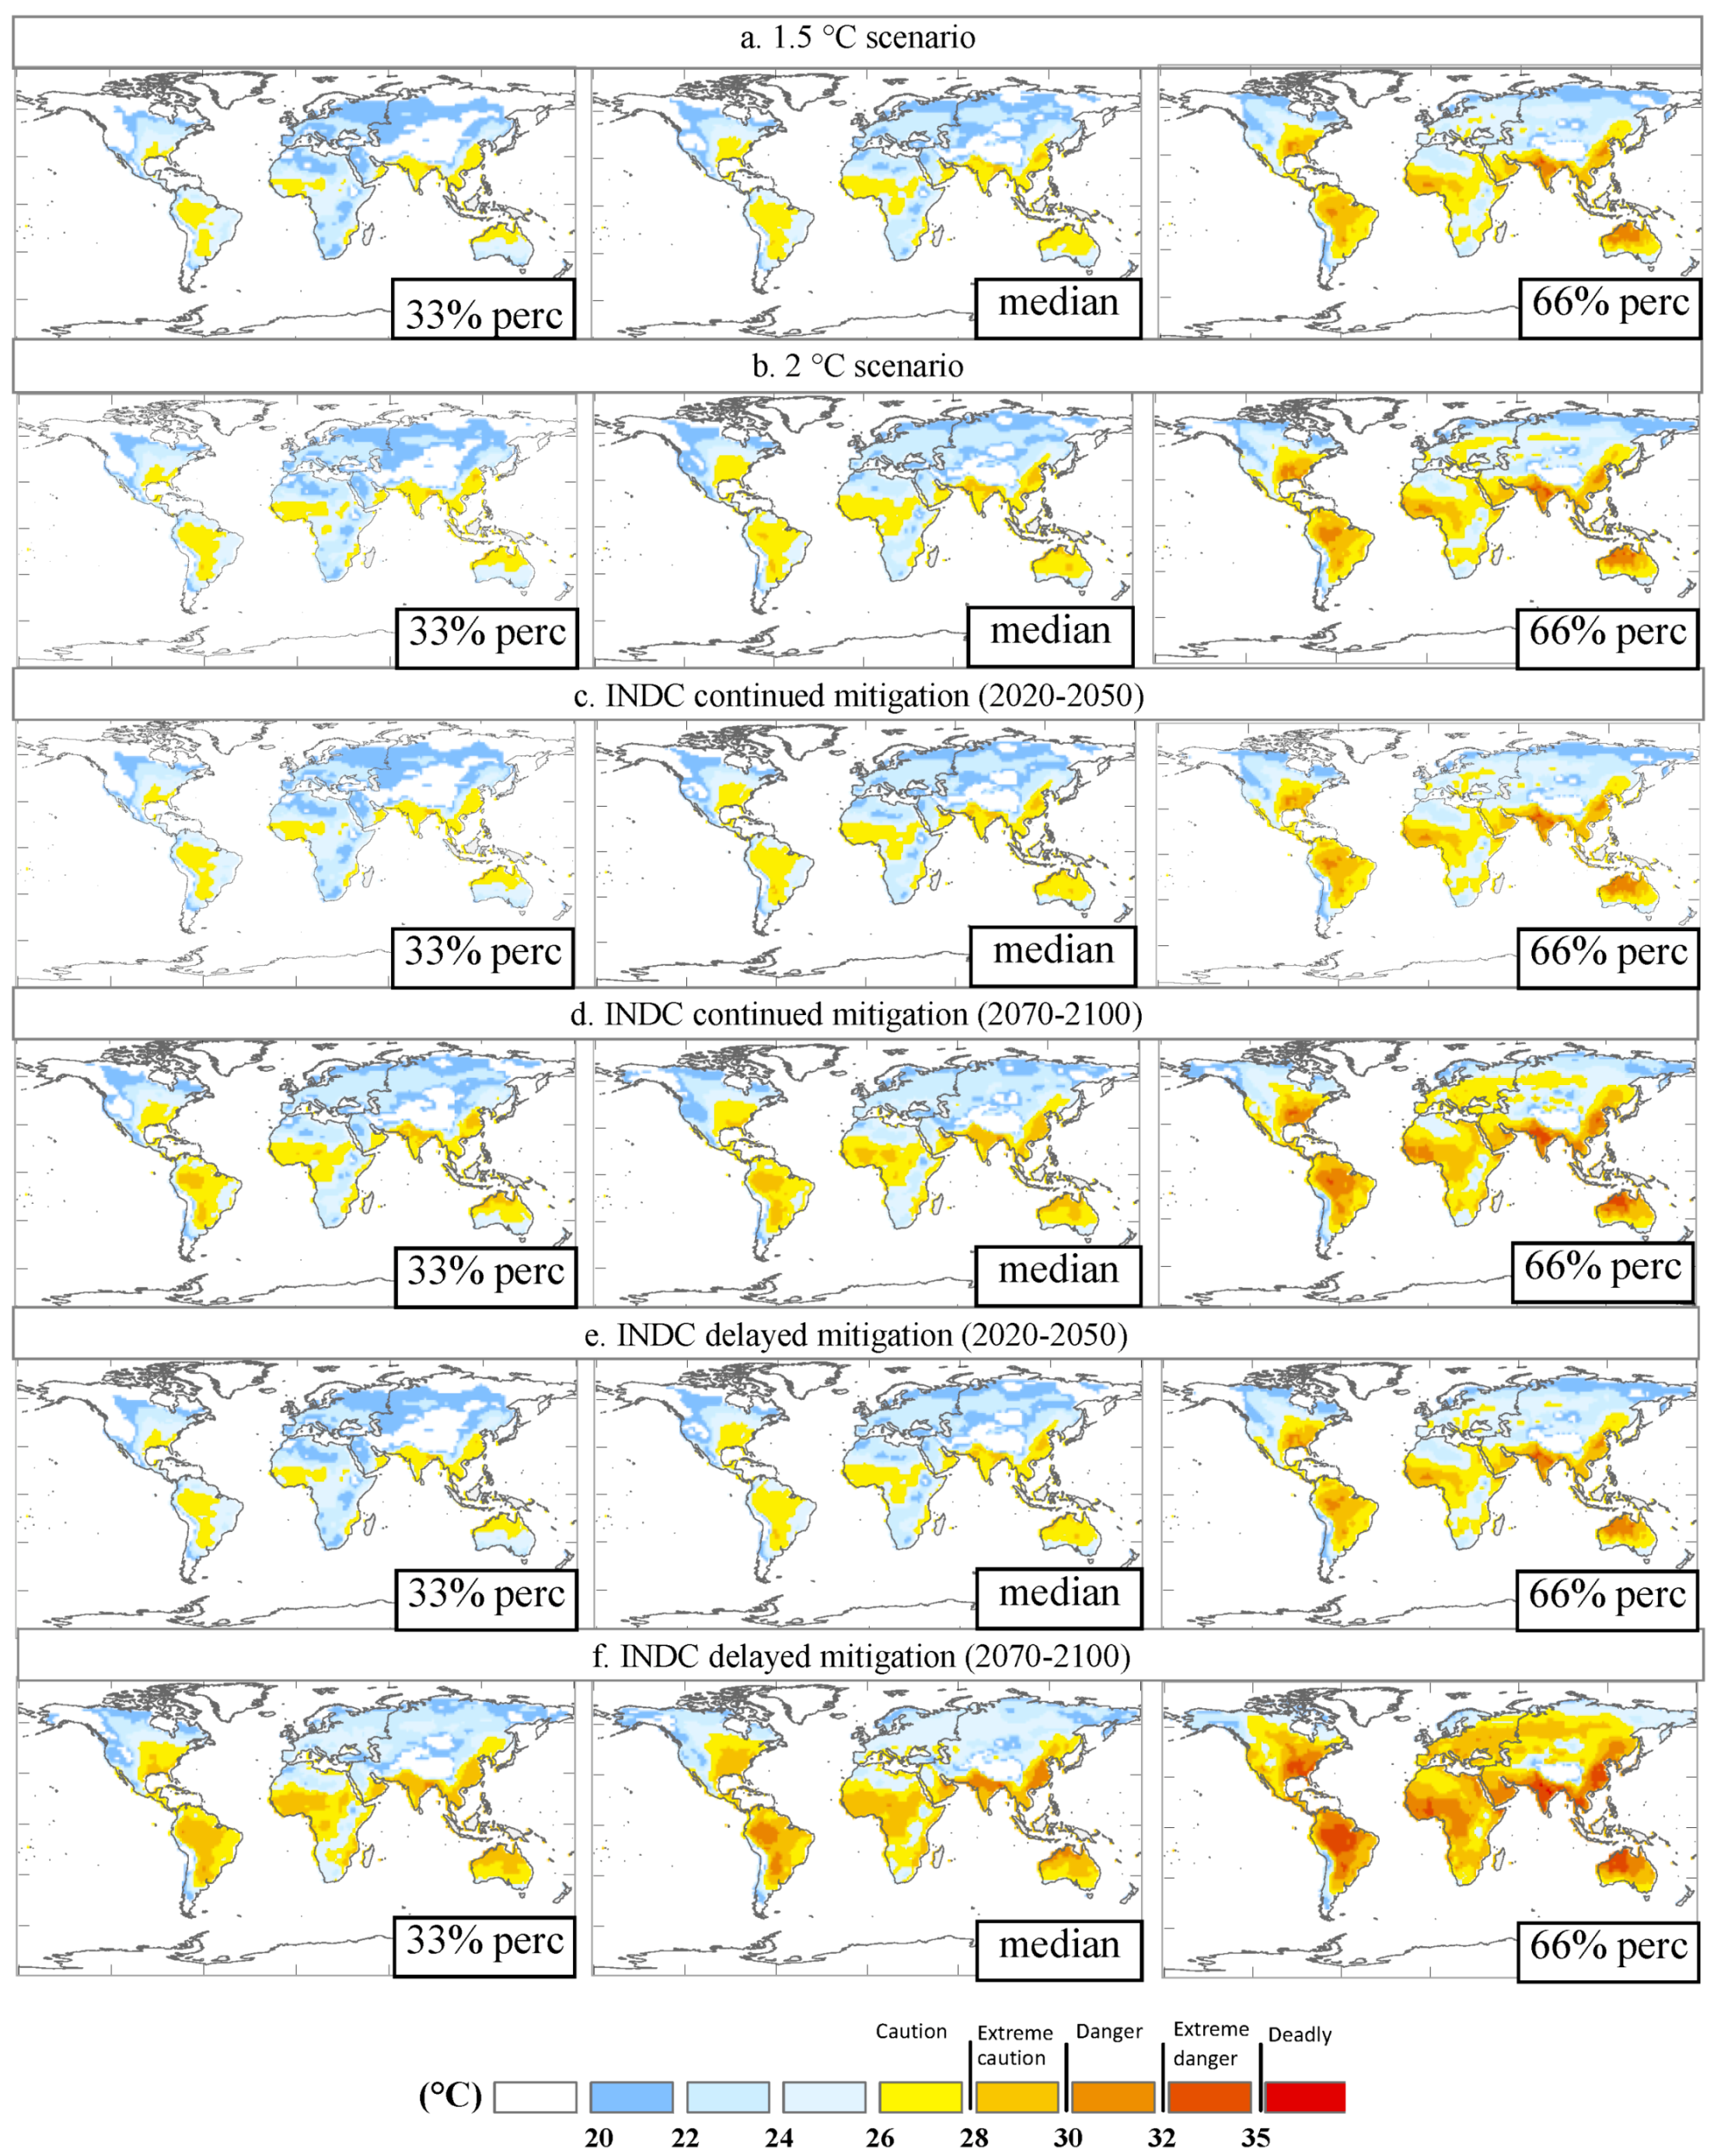
- With the combination of temperature and humidity under climate change, heat stress intensity in the middle- and low-latitude regions will increase significantly. Under the delayed mitigation scenario, by the end of the 21st century, eastern China, South Asia, the Amazon, western Africa, the eastern United States, northern Australia, and other regions will be particularly vulnerable to heat stress; among them, South Asia, eastern China, and the Amazon are the most vulnerable. While under the INDC continuous mitigation efforts, the wet-bulb temperature of these three regions would decrease 1–2 °C in 2070–2100. Under the 1.5 °C and 2 °C global target scenarios, the predicted wet-bulb temperature of most regions, according to the majority of the models is below 29 °C.
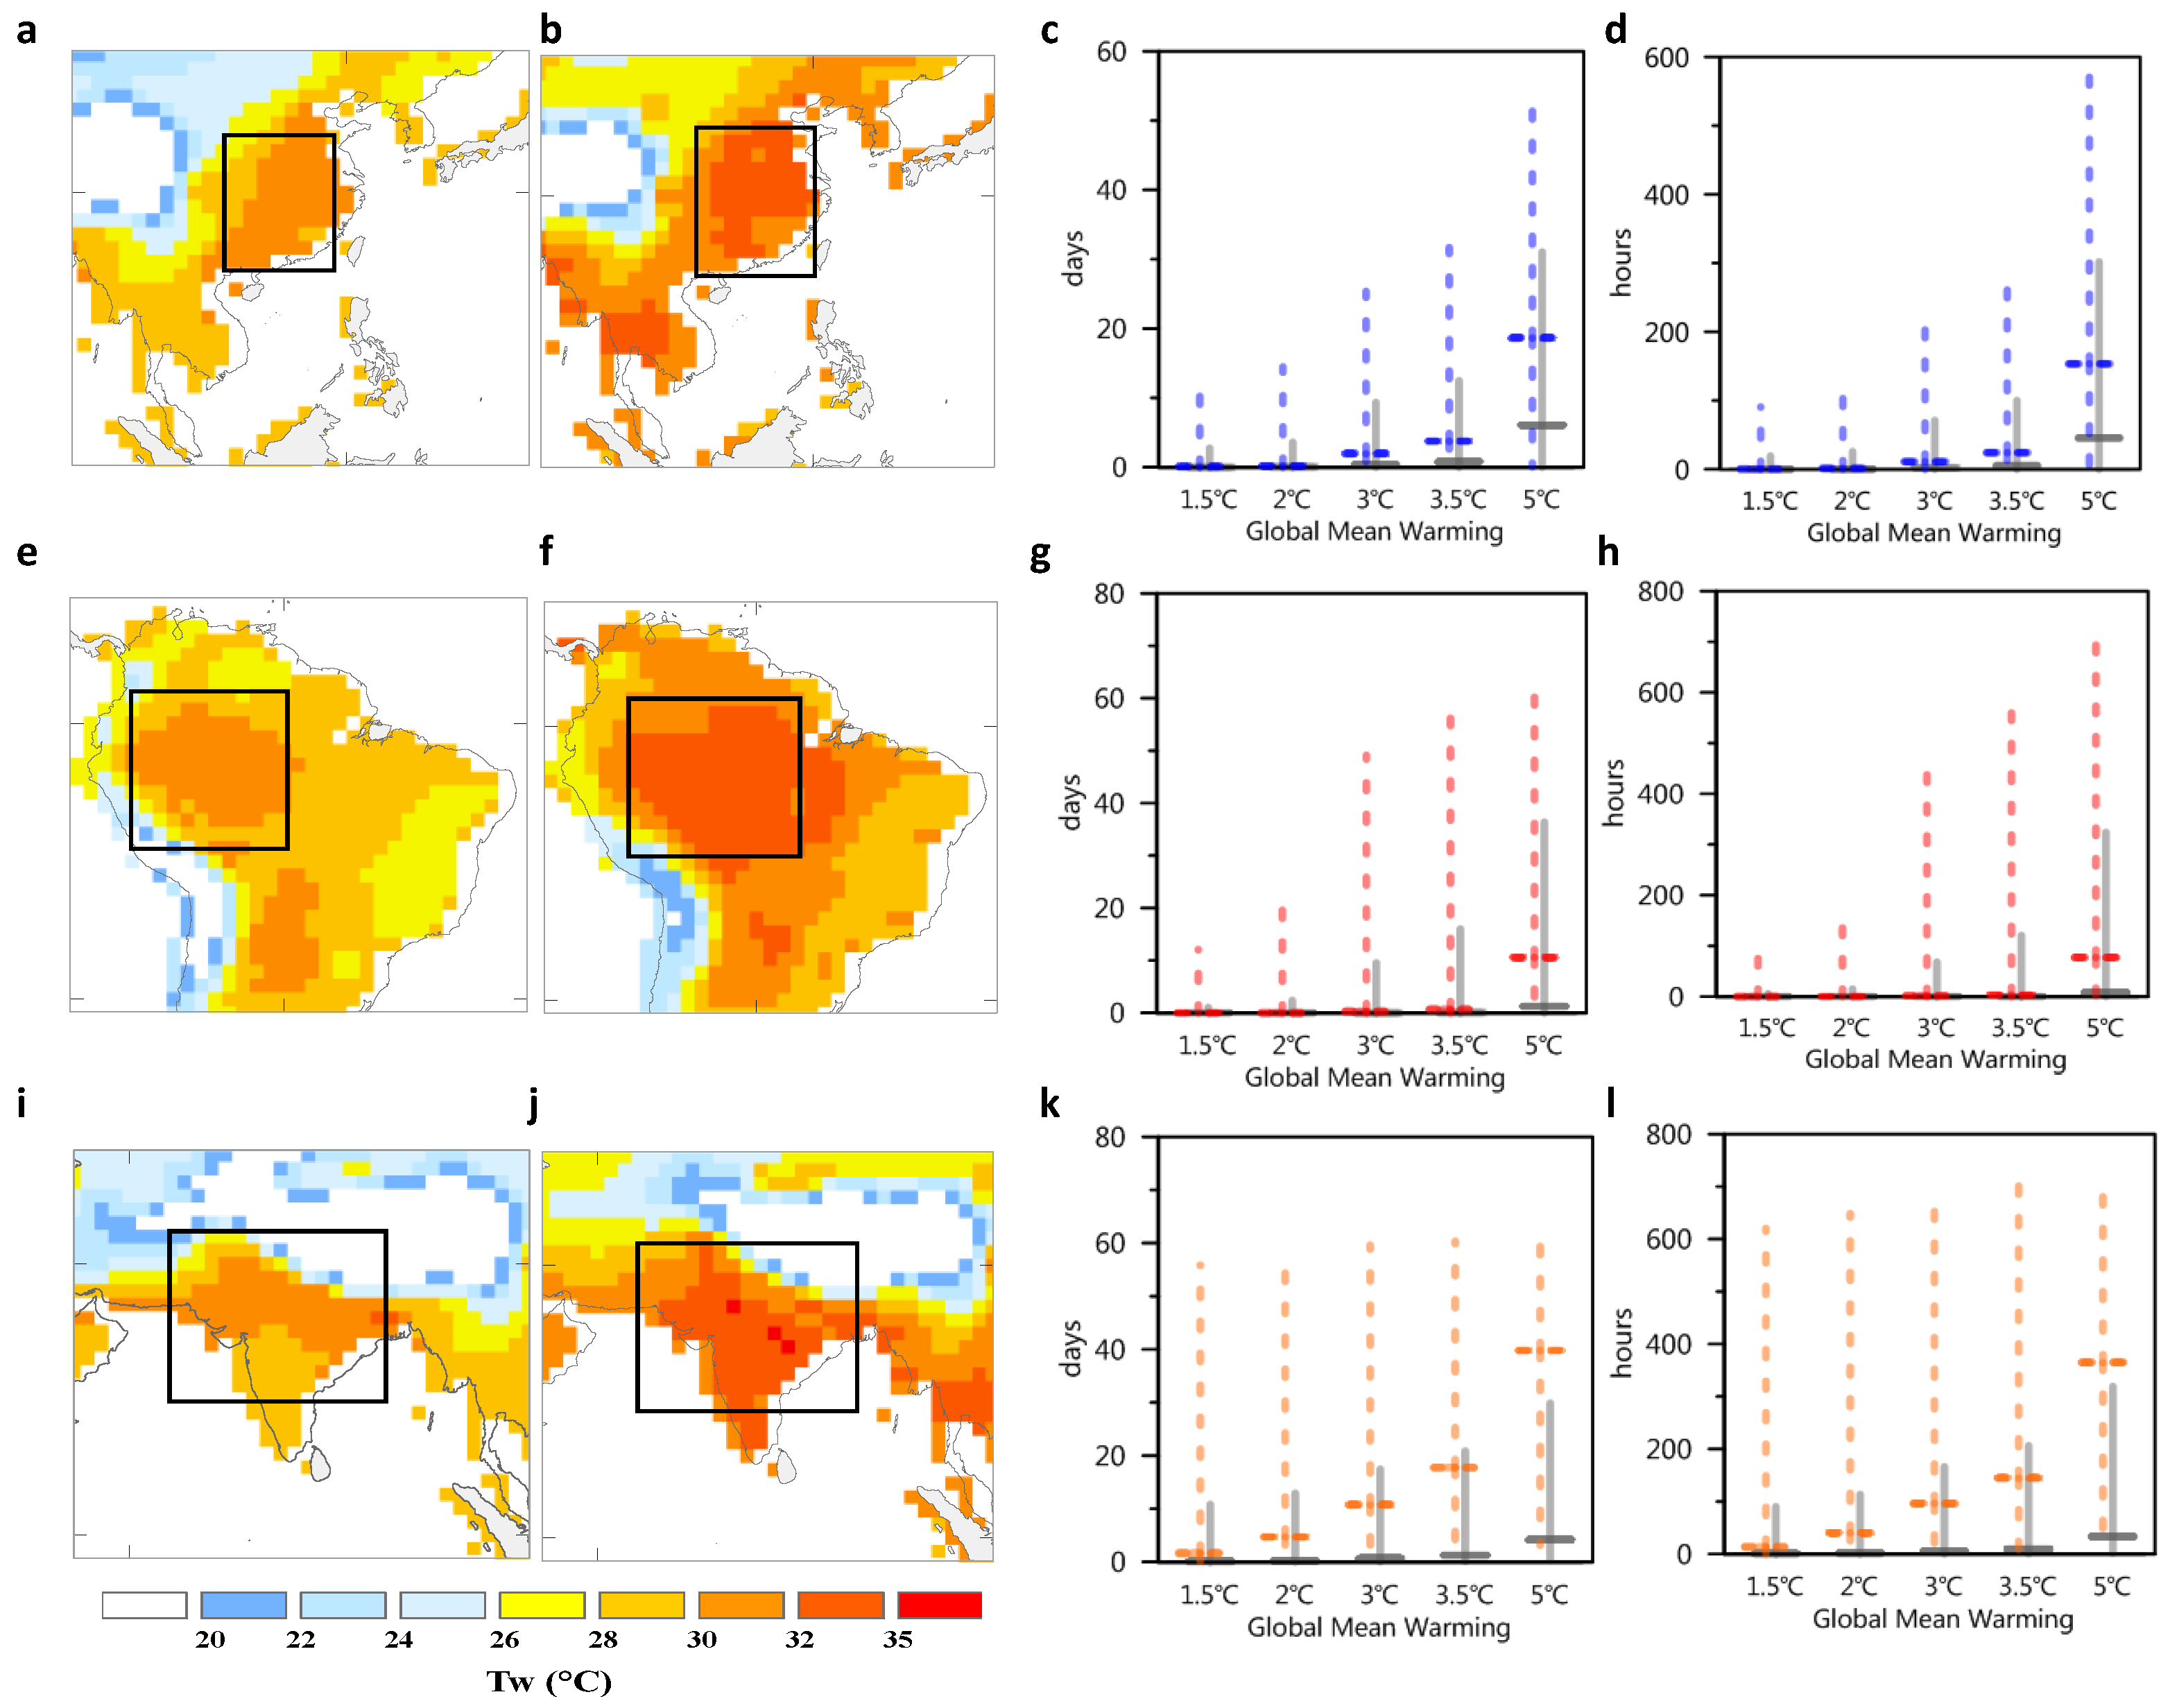
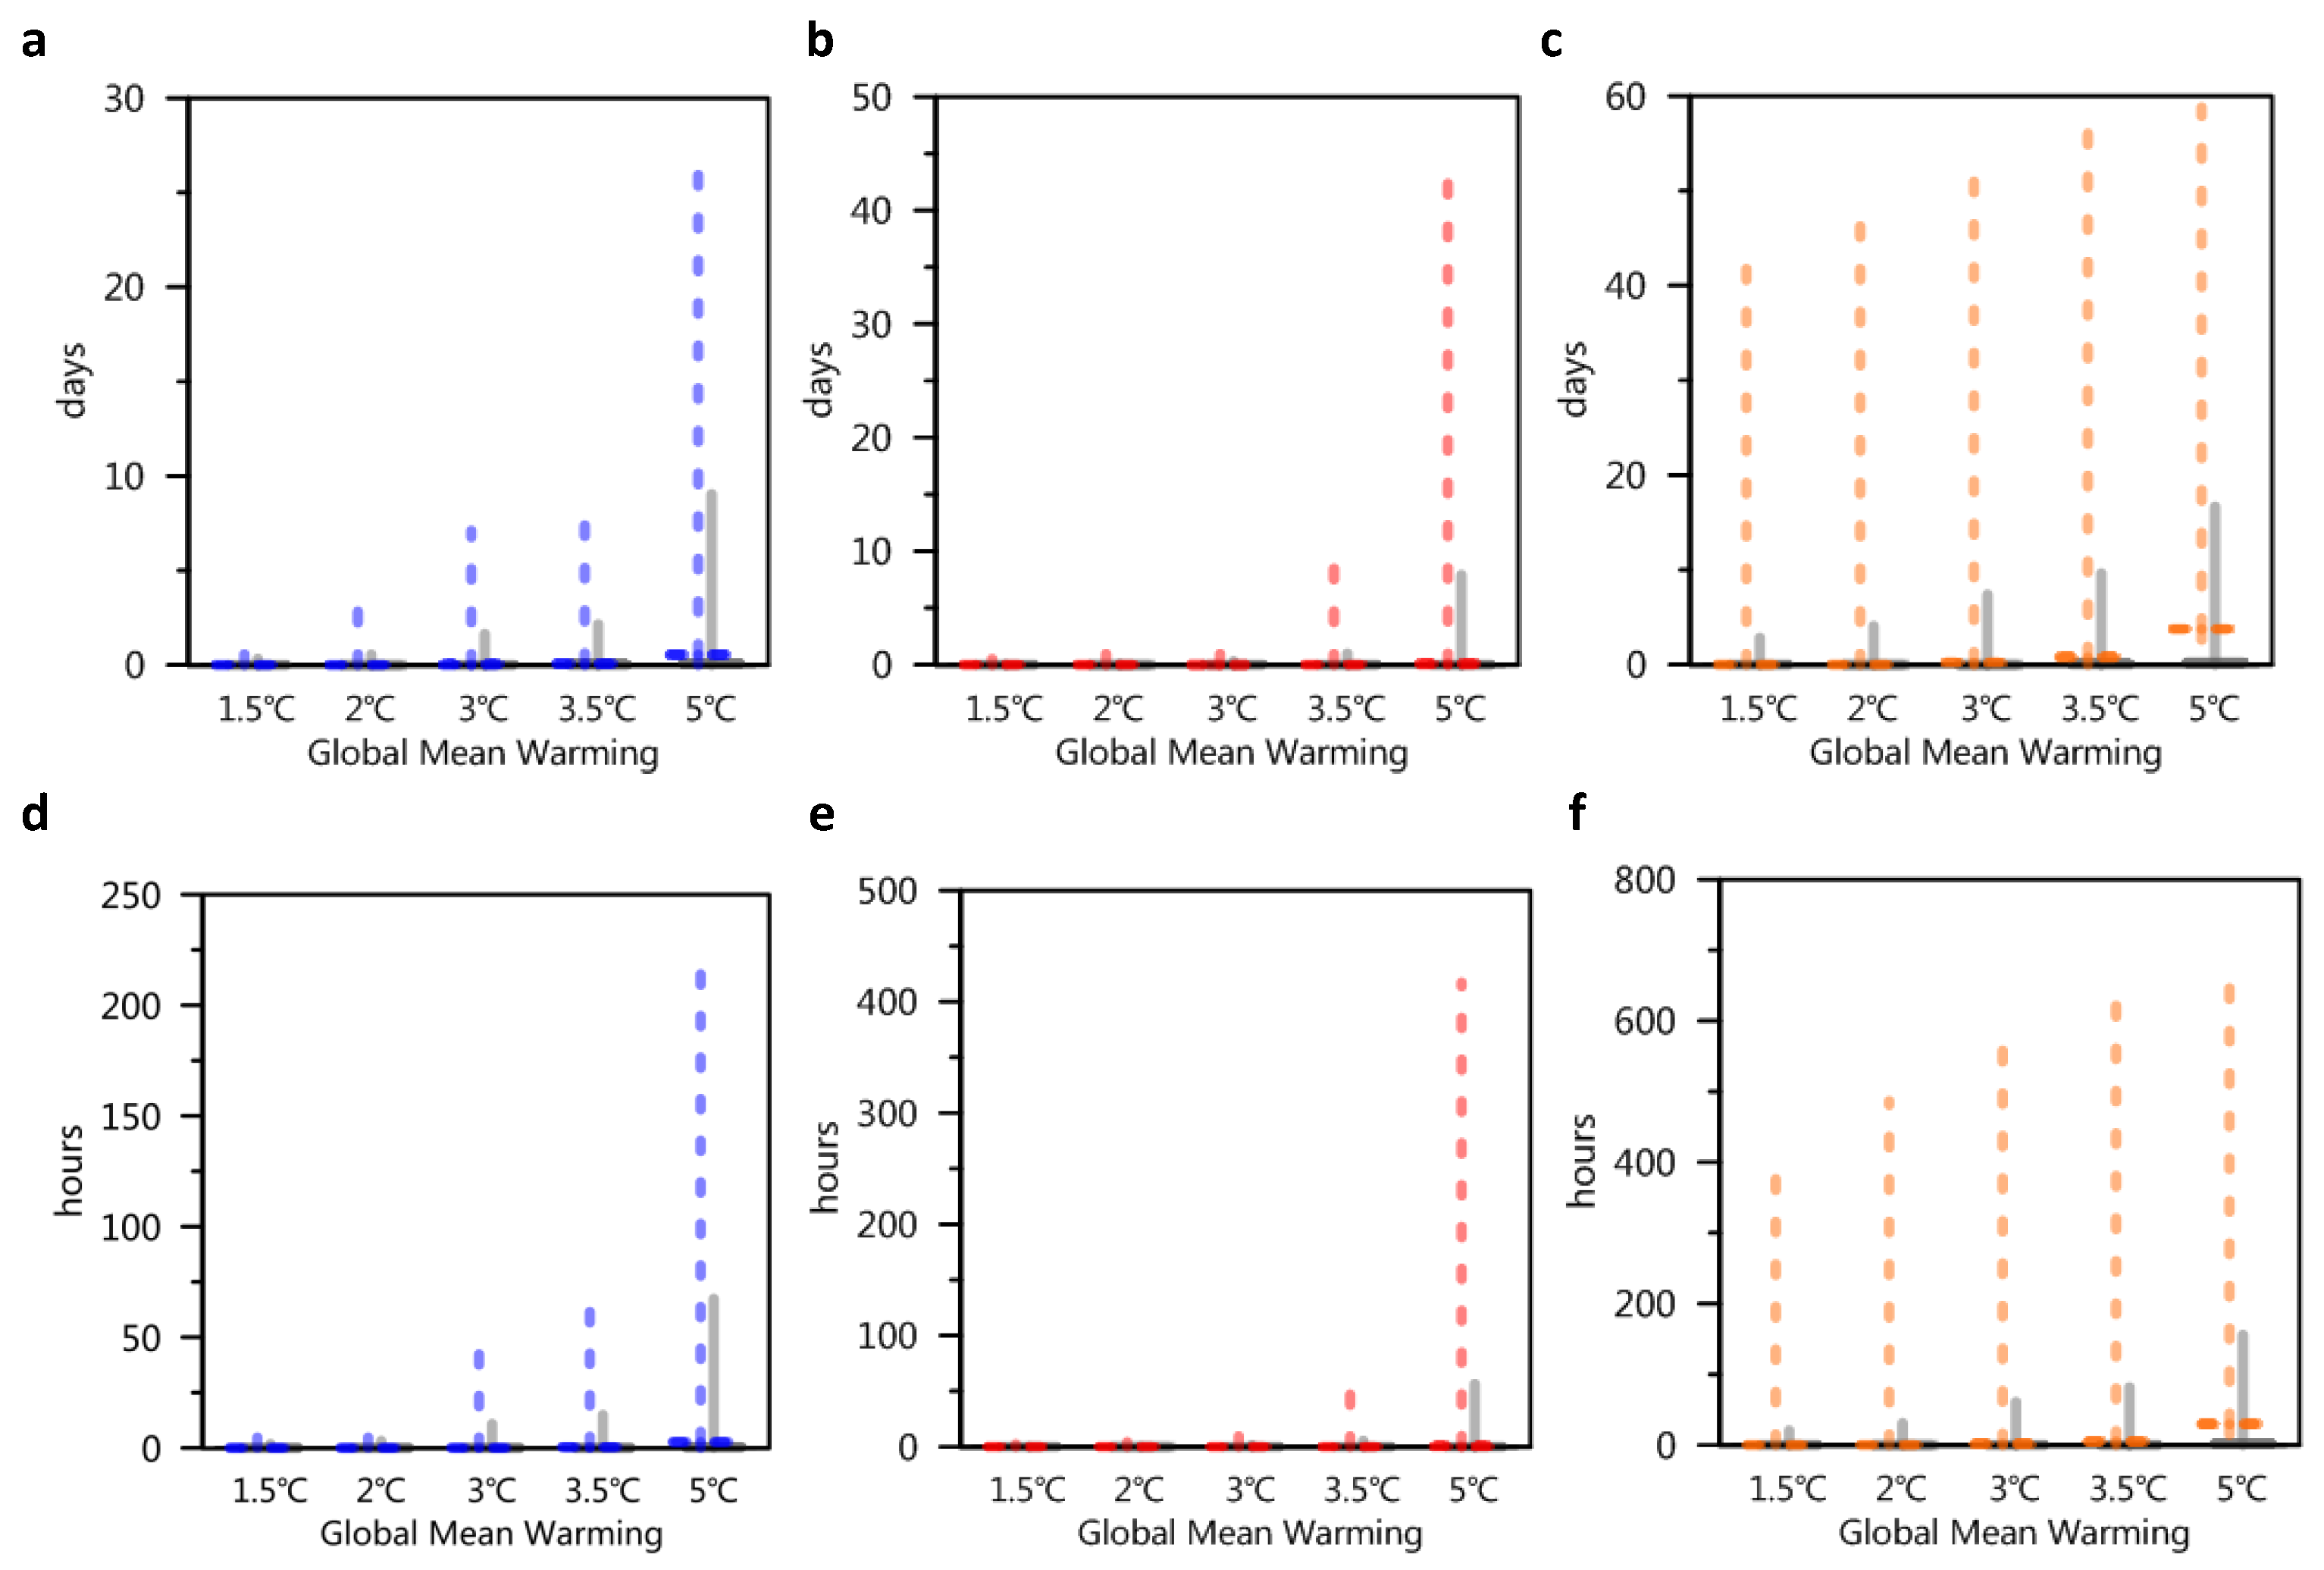
- The frequency of exposure to the dangerous wet-bulb temperature threshold (which may severely affect human labor productivity) also potentially increases. In particular, the heat-stress exposure duration is the longest along the India-Pakistan border region of South Asia, and temperatures exceeding 30 °C and 32 °C during the period 2070–2100 are expected to occur more than 40 days and several to ten days per year, respectively (under the delayed mitigation scenario). Continuous mitigation efforts (compared to the delayed mitigation scenario) can significantly shorten the days and hours of heat exposure in India, but compared with the 1.5 °C and 2 °C global target scenarios, continuous mitigation efforts may still lead to higher exposure risks of heat stress.
- Populations exposed to dangerous wet-bulb temperatures are expected to continue to increase with climate change. More active mitigation policies could reduce population exposure (to wet-bulb temperatures greater than 30–32 °C) by approximately one order of magnitude (pursuing the INDC continuous mitigation scenario versus the delayed mitigation scenario), and half to one order of magnitude (the 2 °C global target scenario versus the INDC continuous mitigation scenario). Given the dramatic increase in the number of people worldwide who may be exposed to dangerous heat stress, failure to take proactive mitigation and adaptation measures in the future will likely result in greater economic losses and increased heat-related mortality.
Supplementary Materials
Author Contributions
Funding
Acknowledgments
Conflicts of Interest
References
- Mora, C.; Dousset, B.; Caldwell, I.R.; Powell, F.E.; Geronimo, R.C.; Bielecki, C.R.; Counsell, C.W.W.; Dietrich, B.S.; Johnston, E.T.; Louis, L.V.; et al. Global risk of deadly heat. Nat. Clim. Chang. 2017, 7, 501–506. [Google Scholar] [CrossRef]
- Patz, J.A.; Diarmid, C.L.; Tracey, H.; Foley, J.A. Impact of regional climate change on human health. Nature 2005, 408, 310–317. [Google Scholar] [CrossRef] [PubMed]
- Basu, R.; Samet, J.M. Relation between elevated ambient temperature and mortality: A review of the epidemiologic evidence. Epidemiol. Rev. 2002, 24, 190–202. [Google Scholar] [CrossRef] [PubMed]
- Kovats, R.S.; Hajat, S. Heat stress and public health: A critical review. Annu. Rev. Public Health 2008, 29, 41–55. [Google Scholar] [CrossRef] [PubMed]
- Leon, L.R. Pathophysiology of Heat Stroke; Morgan & Claypool Life Sciences: San Rafael, CA, USA, 2015; Volume 7. [Google Scholar]
- Ostro, B.D.; Roth, L.A.; Green, R.S.; Basu, R. Estimating the mortality effect of the July 2006 California heat wave. Environ. Res. 2009, 109, 614–619. [Google Scholar] [CrossRef] [PubMed]
- Glaser, J.; Lemery, J.; Rajagopalan, B.; Diaz, H.F.; García-Trabanino, R.; Taduri, G.; Madero, M.; Amarasinghe, M.; Abraham, G.; Anutrakulchai, S. Climate change and the emergent epidemic of CKD from heat stress in rural communities: The case for heat stress nephropathy. Clin. J. Am. Soc. Nephrol. 2016, 11, 1472. [Google Scholar] [CrossRef] [PubMed]
- Dunne, J.P.; Stouffer, R.J.; John, J.G. Reductions in labour capacity from heat stress under climate warming. Nat. Clim. Chang. 2013, 3, 563. [Google Scholar] [CrossRef]
- Haines, A.; Kovats, R.S.; Campbell-Lendrum, D.; Corvalan, C. Climate change and human health: Impacts, vulnerability and mitigation. Lancet 2006, 367, 2101–2109. [Google Scholar] [CrossRef]
- Sherwood, S.C.; Matthew, H. An adaptability limit to climate change due to heat stress. Proc. Natl. Acad. Sci. USA 2010, 107, 9552–9555. [Google Scholar] [CrossRef] [Green Version]
- Pal, J.S.; Eltahir, E.A.B. Future temperature in southwest Asia projected to exceed a threshold for human adaptability. Nat. Clim. Chang. 2015, 6, 197–200. [Google Scholar] [CrossRef]
- Im, E.S.; Pal, J.S.; Eab, E. Deadly heat waves projected in the densely populated agricultural regions of South Asia. Sci. Adv. 2017, 3. [Google Scholar] [CrossRef] [PubMed]
- Kjellstrom, T.; Holmer, I.; Lemke, B. Workplace heat stress, health and productivity—An increasing challenge for low and middle-income countries during climate change. Glob. Health Action 2009, 2, 46–51. [Google Scholar] [CrossRef]
- Kjellstrom, T.; Briggs, D.; Freyberg, C.; Lemke, B.; Otto, M.; Hyatt, O. Heat, Human performance and occupational health: A key issue for the assessment of global climate change impacts. Annu. Rev. Public Health 2016, 37, 97. [Google Scholar] [CrossRef] [PubMed]
- Schär, C. Climate extremes: The worst heat waves to come. Nat. Clim. Chang. 2016, 6, 128–129. [Google Scholar] [CrossRef]
- Knutson, T.R. Detection of anthropogenic influence on a summertime heat stress index. Clim. Chang. 2016, 138, 1–15. [Google Scholar] [CrossRef]
- Battisti, D.S.; Naylor, R.L. Historical warnings of future food insecurity with unprecedented seasonal heat. Science 2009, 323, 240–244. [Google Scholar] [CrossRef] [PubMed]
- IPCC. Climate Change 2014: Synthesis Report. Contribution of Working Groups I, II and III to the Fifth Assessment Report of the Intergovernmental Panel on Climate Change; IPCC: Geneva, Switzerland, 2014; p. 151. [Google Scholar]
- IPCC. Global Warming of 1.5 °C. Available online: https://www.ipcc.ch/sr15/ (accessed on 20 June 2019).
- UNFCCC. National Inventory Submissions. 2019. Available online: https://unfccc.int/process-and-meetings/transparency-and-reporting/reporting-and-review-under-the-convention/greenhouse-gas-inventories-annex-i-parties/national-inventory-submissions-2019 (accessed on 1 May 2019).
- UNFCCC. Adoption of the Paris Agreement. Proposal by the President; Report No. FCCC/CP/2015/L.9/Rev.1; UNFCCC: Geneva, Switzerland, 2015; p. 32. [Google Scholar]
- Wang, F.; Tokarska, K.B.; Zhang, J.; Ge, Q.; Hao, Z.; Zhang, X.; Wu, M. Climate warming in response to emission reductions consistent with the Paris Agreement. Adv. Meteorl. 2018, 2018, 1–9. [Google Scholar] [CrossRef]
- Wang, F.; Ge, Q.; Chen, D.; Luterbacher, J.; Tokarska, K.B.; Hao, Z. Global and regional climate responses to national-committed emission reductions under the Paris Agreement. Geogr. Ann. A 2018, 100, 240–253. [Google Scholar] [CrossRef]
- Tsonis, A.A. An Introduction to Atmospheric Thermodynamics, 2nd ed.; Cambridge University Press: Cambridge/London, UK, 2007; p. 259. [Google Scholar]
- Davies-Jones, R. An efficient and accurate method for computing the wet-bulb temperature along pseudoadiabats. Mon. Weather Rev. 2008, 136, 2764–2785. [Google Scholar] [CrossRef]
- Taylor, K.E.; Stouffer, R.J.; Meehl, G.A. An Overview of CMIP5 and the Experiment Design. Bull. Am. Meteorol. Soc. 2011, 93, 485–498. [Google Scholar] [CrossRef]
- Rogelj, J.; den Elzen, M.; Höhne, N.; Fransen, T.; Fekete, H.; Winkler, H.; Schaeffer, R.; Sha, F.; Riahi, K.; Meinshausen, M. Paris Agreement climate proposals need a boost to keep warming well below 2 °C. Nature 2016, 534. [Google Scholar] [CrossRef]
- UNEP. The Emissions Gap Report; UNEP: Nairobi, Kenya, 2017. [Google Scholar]
- CAT. Addressing Global Warming. Available online: https://climateactiontracker.org/global/temperatures/ (accessed on 1 May 2019).
- Gillett, N.P.; Arora, V.K.; Matthews, D.; Allen, M.R. Constraining the ratio of global warming to cumulative CO2 emissions using CMIP5 Simulations. J. Clim. 2013, 26, 6844–6858. [Google Scholar] [CrossRef]
- Jones, B.; O’Neill, B.C. Spatially explicit global population scenarios consistent with the Shared Socioeconomic Pathways. Environ. Res. Lett. 2016, 11. [Google Scholar] [CrossRef]
- Kang, S.; Eltahir, E.A.B. North China Plain threatened by deadly heatwaves due to climate change and irrigation. Nat. Commun. 2018, 9. [Google Scholar] [CrossRef]
- Liang, C.; Zheng, G.; Zhu, N.; Zhe, T.; Lu, S.; Ying, C. A new environmental heat stress index for indoor hot and humid environments based on Cox regression. Build. Environ. 2011, 46, 2472–2479. [Google Scholar] [CrossRef]
- Buzan, J.R.; Oleson, K.; Huber, M. Implementation and comparison of a suite of heat stress metrics within the Community Land Model version 4.5. Geosci. Model Dev. 2015, 8, 151–170. [Google Scholar] [CrossRef] [Green Version]
- Bernabucci, U.; Mele, M. Effect of heat stress on animal production and welfare: The case of dairy cow. Agrochimica 2014, 58, 53–60. [Google Scholar]
- Bohmanova, J.; Misztal, I.; Cole, J.B. Temperature humidity indices as indicators of milk production losses due to heat stress. J. Dairy Sci. 2007, 90, 1947–1956. [Google Scholar] [CrossRef]
- Nardone, A.; Ronchi, B.; Lacetera, N.; Ranieri, M.S.; Bernabucci, U. Effects of climate changes on animal production and sustainability of livestock systems. Livest. Sci. 2010, 130, 57–69. [Google Scholar] [CrossRef]
- Wahid, A.; Gelani, S.; Ashraf, M.; Foolad, M.R. Heat tolerance in plants: An overview. Environ. Exp. Bot. 2007, 61, 199–223. [Google Scholar] [CrossRef]

© 2019 by the authors. Licensee MDPI, Basel, Switzerland. This article is an open access article distributed under the terms and conditions of the Creative Commons Attribution (CC BY) license (http://creativecommons.org/licenses/by/4.0/).
Share and Cite
Wang, F.; Zhang, J. Heat Stress Response to National-Committed Emission Reductions under the Paris Agreement. Int. J. Environ. Res. Public Health 2019, 16, 2202. https://doi.org/10.3390/ijerph16122202
Wang F, Zhang J. Heat Stress Response to National-Committed Emission Reductions under the Paris Agreement. International Journal of Environmental Research and Public Health. 2019; 16(12):2202. https://doi.org/10.3390/ijerph16122202
Chicago/Turabian StyleWang, Fang, and Jintao Zhang. 2019. "Heat Stress Response to National-Committed Emission Reductions under the Paris Agreement" International Journal of Environmental Research and Public Health 16, no. 12: 2202. https://doi.org/10.3390/ijerph16122202
APA StyleWang, F., & Zhang, J. (2019). Heat Stress Response to National-Committed Emission Reductions under the Paris Agreement. International Journal of Environmental Research and Public Health, 16(12), 2202. https://doi.org/10.3390/ijerph16122202


