Inhibitory Risks Affecting the Maintenance of Healthy Lifestyle Habits—A Study Based on Demographic Factors and Personality Traits

Abstract
:1. Introduction
1.1. Background
1.2. Purpose
1.3. Research Features
- 1)
- This study is novel in that it analyzes the difference between the risk factors of living habits based on both demographic factors and personality traits.
- 2)
- This study assesses risk factors and provides reference information for future planning of healthy cities based on a comprehensive perspective incorporating subjective perception and the living environment.
- 3)
- This study proposes solutions to the difficulties of improving living habits and their ‘reversion,’ by researching online questionnaires.
2. Materials and Methods
2.1. Survey Method
2.1.1. Participants & Procedure
2.1.2. Measures
2.2. Definitions
2.2.1. Definition of Living Habits
- (nutritional balance): two or more meals per day, including staple foods, a main course, and side dishes.(In the first question of this survey, definitions and some examples of staple foods, a main course, and side dishes were provided as a reference to the survey respondents.)
- (sleeping): adequate sleeping time (longer than seven hours).
- (exercise): exercise regularly (over 30 min each time).
- (walking): walk 8000 steps or more each day.
2.2.2. Definition of Stages of Behavioral Change
- (pre-contemplation) stage: no desire to improve, no action plan.
- (preparation) stage: want to improve and having a plan, but no action.
- (action) stage: action, lasting more than 1 month.
- (maintenance) stage: sustaining action indefinitely.
- (reversion) stage: was in action for more than a month, but stopped.
- In the items referencing the stages of behavioral change, this questionnaire used objective question. (e.g., “In the last three years, which of the following descriptions did your walking habits follow? Please choose one from the following opptions which are true.”).
2.2.3. Definition and Constitution of Attributes
- (Demographic Factors):
- 1)
- Gender,
- 2)
- Age group (young residents, 25–44 years old; middle-aged residents, 45–64 years old; elderly residents, over 65 years old [6],
- 3)
- Household type (single household, couple household, multi-generational household),
- 4)
- Employment status (employed, unemployed),
- 5)
- State of vehicle ownership (no ownership or cannot use any vehicle, hereafter, ‘no vehicle’), self-specific owned vehicle (hereafter, ‘self-ownership’), non-self-owned vehicle, but an available family car or car-sharing service (hereafter, ‘co-ownership’), and
- 6)
- Living city scale (central city—Tokyo 23 wards, Chiba city, Yokohama city, Kawasaki city, Sagamihara city, Saitama city); cities in central city commuting area [30], Medium-sized cities (hereinafter, ‘surrounding cities’); small cities and villages (other than the central cities and surrounding cities).
- (Personality Traits):To measure personality traits related to health status, the study used the hardiness scale [26]. The hardiness scale measures three personality trait dimensions: challenge, control, and commitment. Challenge refers to the tendency to view unexpected changes or potential threats as positive challenges for future growth, rather than as harmful events. Control refers to the awareness that control over daily life events is possible. Commitment’ refers to the tendency to feel committed and involved in different areas of life. The Japanese version of the scale has been verified as reliable [27]. In the stages of personality traits items, this questionnaire used a 7-point Likert Scale (e.g., “Q. Most days, life is really interesting and exciting for me. “1 = “Strongly disagree” to 7 = “Strongly agree””).
2.2.4. Risk Factors
2.3. Analytical Approach
- 1)
- Ascertaining personality traits through factor analysis: To extract the factors of personality traits from the 15-item hardiness scale. Referring to the methods of research [26], this study adopted the factor analysis method. The reason for not using principal component analysis is that there is no affiliation between the questions in the 15-item hardiness scale, therefore it does not apply to principal component analysis.
- 2)
- On the basis of Analysis step-1, the crosstabs analysis was used, exploring changes in the distribution tendency of stages of behavioral change of various living habits with different demographic factors and personality traits; also, analyzing correlation between demographic factors and personality traits of the ‘non-action’ or ‘maintenance’ stages of behavioral change, such as ‘reversion’, ‘preparation’, and ‘pre-contemplation’ stages.
- 3)
- Investigation as to whether there is a correlation between the individual attributes and the sensitivity of the risk factors of each lifestyle was done. Extracting and grouping demographic factors that affect inhibitory risk (divided into 21 groups and explained in the following sections). It was done based on the above grouping results in each group, with the ratio of personality traits as X, incidence frequency of the risk factor as Y, and a single regression analysis being performed to analyze the effects of differences in personality traits of each group on the maintenance or action of each living habit.
3. Results
3.1. Results of the Questionnaire Survey
3.2. Results of Personality Attribute Analysis
3.3. Relation of Stage Change, Personality Traits, and Demographic Factors
- 1)
- Specifically examining the results of the vehicle ownership status in Figure 2, the living habits of those who use vehicle co-ownership do not tend to stay in ‘pre-contemplation’ stage. They are more inclined to be in the ‘action’ stage of improving living habits.
- 2)
- Residents of single households are less inclined to adopt healthy lifestyles.
- 3)
- Keep their living habits, but residents with multi-generational-households tend to ‘maintain’ their stages of nutritional balance, sleep, and exercise.
- 4)
- Based on the above results, residents who use co-vehicle are more likely to have partners who work together. This kind of residents is more inclined to improve their living habits because of the help of their peers. Contrary to the single households, it is difficult to recognize that they need to improve current living habits and lack of support for living habits due to the lack of influence of another person.
- 5)
- Young residents tend not to ‘maintain’ nutritional balance, sleep, and exercise habits. They tend to stay in the ‘preparation’ stage.
- 6)
- Employed residents are more likely to be in the ‘reversion’ stage of nutritional balance than unemployed residents.
- 7)
- Young residents and employed residents are more inclined to be more busy working, therefore it is more difficult for them to maintain healthy living habits in the long-term. In addition, although it is likely that they appear as though they are trying to change living habits, however it is more likely that they are in the ‘reversion’ stage.
- 8)
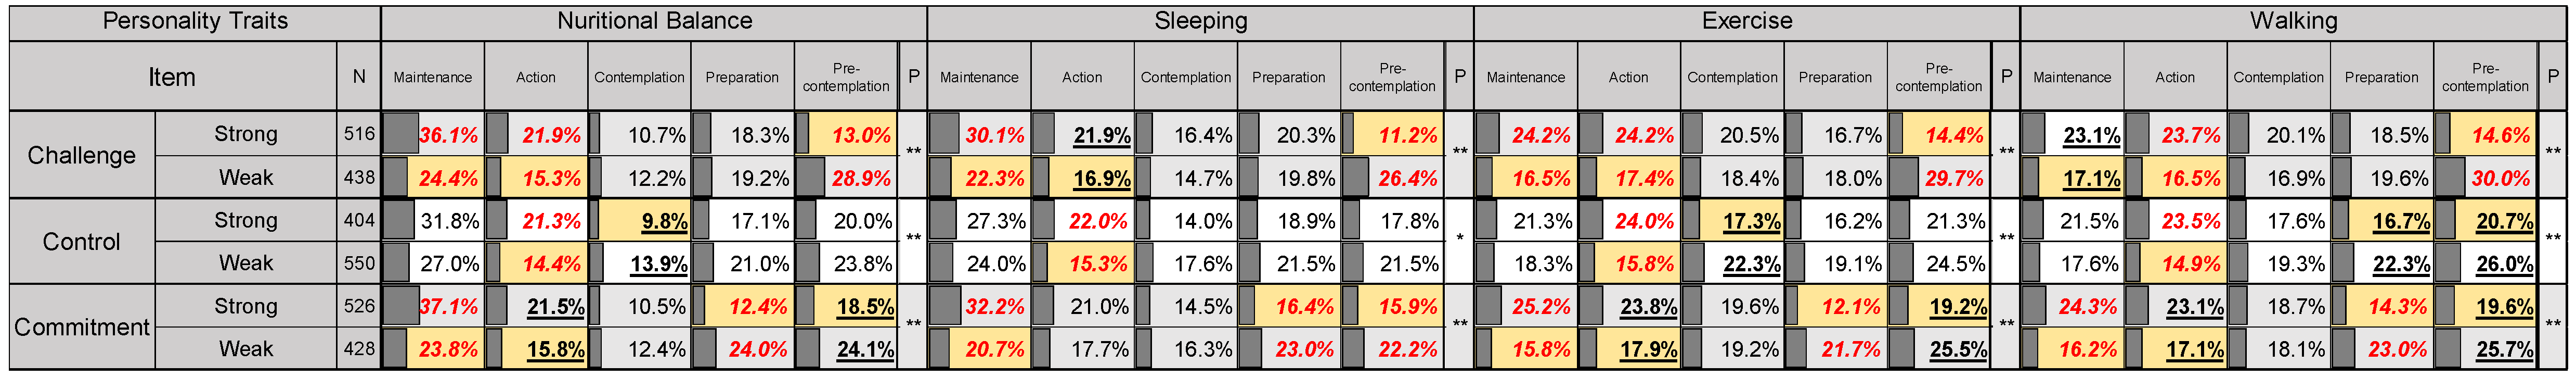
- Specifically examining the results of the personality traits in Figure 3, each living habit of those with a strong challenge feature and commitment feature tend to be in the ‘maintain’ stage or the ‘action’ stage. People with a strong ‘control’ feature have experienced less of the ‘reversion’ stage of nutritional balance and exercise.
- 9)
- According to the above analysis of personality traits, residents with challenge features are more inclined to try new things, and those residents with commitment features are more inclined to have a more positive attitude toward the change of living habits. Therefore, it can be considered that residents with challenges and commitments features are prone to improve behavioral change and more positive attitudes towards improvement, so that improved stage of behavioral change to the ‘action’ stage, and keeping in ‘maintenance’ stage. Residents with the ‘control’ feature are more likely to believe that they will get the desired results according to their efforts. Therefore, such residents are less prone to the ‘reversion’ stage.
- 1)
- Non-elderly residents who are in ‘reversion’, ‘preparation’, and ‘pre-contemplation’ stages tend to feel inhibitory risk.
- 2)
- Specific analysis of the state of vehicle ownership revealed that residents who use vehicle co-ownership easily feel inhibitory risks of sleep and exercise living habits.
- 3)
- For the analysis of personality traits, stronger the challenge and commitment features are associated with greater likelihood of sensitivity to inhibitory risk. However, residents with strong control features tend not to feel inhibitory risk. Residents with strong control features devote more attention to achieving their goals through their own efforts. Therefore, they tend to report that they might not be readily aware of external inhibitory risk.
3.4. Relations of Risk Factors and Personality Traits by Extrinsic Personal Attribute Group
- 1)
- Equation (1) measures the incidence of the factors of inhibitory risks of living habits (items presented in Table 1) in each group. The higher the incidence frequency, the more likely a person is to feel the inhibitory risks related to corresponding living habits:: incidence of risk factors of group of living habit: number of risk factors of living habit of group: number of living habit of group: 1–21 groups: nutritional balance (N), sleeping (SL), exercise (EX), walking (W): living environment (EM), social and community network (SN), individual lifestyle (time (T) · economic (EC)), subjective perception (sense of health (H) · negative awareness (N))
- 2)
- Equation (2) is used to measure the ratio of each feature of personality traits. Higher ratios are associated with stronger personality traits of the group:: ratio of group’s stronger feature of personality traits: number of group’s stronger feature of personality traits: challenge (CHA), control (CON), commitment (COM)
- 1)
- Significant correlation was found between the ratio of challenge feature and the incidence of factors of inhibitory risk.
- 2)
- The risk factors for walking habits are more likely to consist of multiple items.
- 3)
- Compared to other personality traits, residents with challenge features are more likely to try new things. Therefore, such residents need to think about which aspect they can change. At the same time, they are more likely to be exposed to aspects that they cannot change in the process of thinking, which is the risk factor in this study. For example, in order to change their exercise habits, residents showing the challenge feature will think about their own schedules and expenditures, and adjust their schedules to set aside exercise time or save money for sports. Among them, some residents may realize that they can’t make adjustments in their work schedule and realize that time is an inhibitory risk.
- 4)
- Residents with a commitment feature do not have an inclination to challenge new things, therefore making it difficult for them to realize what obstacles in their living habits prevent them from maintaining a healthy lifestyle. Residents with control feature are more inclined to rely on their own efforts, rather than being easily influenced by external factors.
- 1)
- Specifically examining the results of nutritional balance (Figure 4a,b), among those in the ‘preparation’ stage, the incidence of the social and community network between the young residents (10 group) and middle-aged residents (13 groups) who used the co-ownership vehicle shows the largest difference in the inhibitory risk factor (Figure 4a,b).
- 2)
- Specifically examining the results of sleep (Figure 4c), young residents (g1, g2, and g3 groups) are in the ‘reversion’ stage, and the time constraints of individual lifestyles are higher than that of others. However, the difference in the occurrence incidence of the risk factors of subjective perception in sensory perception might not be readily apparent.
- 3)
- Specifically examining risk factors in walking habits (Figure 4d1,2), the challenge feature ratio of the elderly residents in the ‘reversion’ and ‘preparation’ stages are lower than that of the non-elderly residents. Moreover, the incidence of risk factors is low. However, elderly residents in the ‘preparation’ stage have a high incidence of negative awareness (Figure 4d1). No significant difference was found in the ratio of different challenge features because of stages of behavioral change in elderly residents.
4. Discussion
- 1)
- Specifically addressing the analysis of vehicle ownership status, residents who use vehicle co-ownership tend not only to remain in the ‘pre-contemplation’ stage but also tend to be in the ‘action’ stage of improving each living habit. Moreover, couple households can often maintain nutritional balance, sleep, and exercise habits. Therefore, the presence of other people, such as acquaintances and partners, might be an important factor to improve living habits. Previous research has shown that social networks have an impact on improving health issues such as obesity [1]. In that study, the social network did not directly affect the improvement of diet and exercise behavior but was affected by surrounding friends or family members. Colagiuri’s research results corroborated the results from this study. Whether Australia or Japan, it is not limited to countries or regions that social networks have a positive impact on maintaining or improving living habits. Furthermore, policies prescribing the promotion of social communities that can provide partners for single-person households could result in revolutionary changes. In combination with the results of vehicle ownership status, promoting the car sharing service within the community or within a certain range can promote the formation of the surrounding social networks, and can eliminate obstacles caused by the inconvenience of public transportation.
- 2)
- Residents who use vehicle co-ownership tend to be sensitive about the risk factors in their sleep and exercise habits. The reason might be due to limitations to their behavior and time due to anxiety associated with traffic. Therefore, improving the public transportation service level and thus encouraging free movement could be more effective in improving sleep and exercise habits.
- 3)
- Comparison with unemployed residents shows that employees tend to a ‘reversion’ stage in nutritional balance living habits. Establishing a balanced diet in a company is an important policy. In other research, it has been proved that providing healthy foods such as fruits in the workplace is more likely to interfere with negative nutritional living habits of the members, thereby improving the effect of chronic diseases [33].
- 4)
- Compared with the demographic factors, the correlation between the personality traits and risk factors in each living habit are might be readily apparent. Policies might exist that are based only on demographic factors such as vulnerable road users, which might result in weaker living habit improvement measures. Therefore, to improve the improvement measure effectiveness, one must implement policies that foster challenging features of residents and formulate new policies based on combinations of challenge features. According to an earlier study [33], during 15 weeks of testing, the tester realized that the need to achieve the set small improvement goals can help to cultivate challenge features of personality traits. Results of this study demonstrate that, for activities of health mobility management or school learning activities, it is easier to improve living habits by combining a policy for individual improvement and the introduction of incremental improvement goals.
- 5)
- Young residents are stronger in terms of challenging characteristics than middle-aged residents. They are susceptible to peer pressure in the presence or absence of people who eat together and the behavior of surrounding people. Therefore, even if they want to improve their nutritional balance, such behavior might not occur. Action improvement of young residents might increase by offering information not only to individuals but also to the surrounding people. One earlier study [34] found that young people (20s) continue to live dependently on convenience stores and eating in restaurants. They should be educated about ‘proper dietary health’ such as eating vegetables while using convenience stores and eating instant noodles. With that proposal, effects can be improved further if people are educated in ‘proper dietary health’, and if they are targeted not only as one individual among the young residents but as belonging to an entire family or social network that should be using ‘proper dietary health’. There are also other studies on How to used personality traits opinion to improve living habits such as diet and exercise [35,36].
- 6)
- Elderly residents over the age of 65 are mostly in retirement. Therefore, for elderly residents, the risk factors from time constraints and economic constraints are less binding. However, this study showed that elderly residents in the ‘preparation’ stage often suppress maintenance or improvement of their living habits because of their negative feelings about living habits. For instance, elderly residents are more inclined than non-elderly residents to feel difficulty related to walking and do not feel the necessity to walk. Healthy city policy formulated for elderly residents who are in the ‘preparation’ stage should specifically examine how to smoothly convert negative feelings regarding walking habits, and to convey the importance of walking for health. Thus, the effects of implementing such healthy city policies might increase in effectiveness.
5. Conclusions
Author Contributions
Funding
Acknowledgments
Conflicts of Interest
Appendix A

| Valid Sample | 954 |
|---|---|
| Survey areas | Tokyo and Kanto 6 counties (Ibaraki, Tochigi, Gunma, Saitama, Chiba, Kanagawa) |
| Survey target | Male and female over 25 years old |
| Survey period | 2018/9/21–28 |
| Main survey item |
|
| Item | Detail of Major Item | Item | Detail of Major Item | ||
|---|---|---|---|---|---|
| Constraints in the living environment | 1. Facilities necessary for daily life are far away (e.g., commercial facilities, restaurants, parks, sports facilities). | Constraints due to social and community network | 1. There are no roommates to exercise or eat together with. | ||
| 2. Facilities necessary for daily life are limited (e.g., commercial facilities, restaurants, parks, sports facilities). | 2. There are no acquaintances to exercise or eat together within school or the workplace. | ||||
| 3. Facilities that are useful at a convenient time are limited (e.g., restaurants, supermarkets, convenience stores, sports facilities). | 3. There are no family members or neighbors who cook breakfast or provide a nutritious, balanced diet. | ||||
| 4. No restaurant, supermarket, convenience store, etc. will provide meals and ingredients with balanced nutrition in the neighborhood. | Personal lifestyle constraints | Time constraints | 1. I am not good at getting up early. (measuring the time limit in the morning or not) | ||
| 5. I am dissatisfied with the neighboring road environment (feeling danger when walking and feeling noise). | 2. The time to leave the office or go home is late. | ||||
| 6. Public security in the neighborhood is bad. | 3. It takes a long time to commute to and from school or work. | ||||
| Subjective perception | Sense of health | 1. I restrict my diet to lose weight. | 4. I have no time because of work or studying (Including overtime hours, excluding commuting time and commuting time). | ||
| 2. Human relationships impose a heavy burden on the body and mind. | 5. I have no time because of nursing care, nursing, child rearing. | ||||
| 3. I have heavy mental and physical burdens in my work/study. | 6. I have no time because of housework (excluding nursing care, nursing, child-rearing time). | ||||
| 4. I have heavy mental and physical burdens in my domestic affairs, nursing care, or child rearing. | 7. I have no time because of rest and sleep. | ||||
| 5. The employment situation is unstable and stressful. | 8. I have no time because of rest and sleep because of my hobbies and entertainment (excluding rest and sleep time). | ||||
| 6. I have physical and mental difficulties such as illness or disability. | 9. It takes time to move to the facilities (e.g., facilities for purchasing food items such as supermarkets and athletic facilities such as gymnasiums and parks). | ||||
| Negative feelings | 1. It is troublesome to practice and continue this lifestyle. | Economicconstraints | 1. I am saving food expenses. | ||
| 2. I think it is not necessary to practice or continue this lifestyle. | 2. Expenses for comfortable bedding and sleeping environment are expensive. | ||||
| 3. I have no intention of practicing or continuing this lifestyle. | 3. Expenses for exercise (such as exercise equipment prices and exercise facility expenses) are too high. | ||||
| 4. Even if I were to continue this lifestyle, the effects I hope for are unobtainable. | 4. My household cannot afford them. | ||||
| 5. I do not like this lifestyle. | 5. There is something else that I prefer to use my money on. | ||||
References
- Colagiuri, S.; Lee, C.M.; Colagiuri, R.; Magliano, D.; Shaw, J.E.; Zimmet, P.Z.; Caterson, I.D. The cost of overweight and obesity in Australia. Med. J. Aust. 2010, 192, 260–264. [Google Scholar] [PubMed]
- World Health Organization (WHO) Health Topics-Diet. Available online: http://www.who.inttopics/diet/en/ (accessed on 6 May 2019).
- Zellner, S.; Bowdish, L. The ROI of Health and Well-Being: Business Investment in Healthier Communities. NAM Perspect. 2017, 17. [Google Scholar] [CrossRef]
- Hill, J.O.; Wyatt, H.R.; Reed, G.W.; Peters, J.C. Obesity and the environment: where do we go from here? Science 2003, 299, 853–855. [Google Scholar] [CrossRef] [PubMed]
- Glechner, A.; Keuchel, L.; Affengruber, L.; Titscher, V.; Sommer, I.; Matyas, N.; Wagner, G.; Kien, C.; Klerings, I.; Gartlehner, G. Effects of lifestyle changes on adults with prediabetes: A systematic review and meta-analysis. Prim. Care Diabetes 2018, 12, 393–408. [Google Scholar] [CrossRef] [PubMed]
- Japan Health Promotion & Fitness Foundation. 2003. Available online: http://www.kenkounippon21.gr.jp/ (accessed on 6 May 2019).
- Ministry of Health Labour and Welfare. Available online: https://www.mhlw.go.jp /stf/newpage_00792.html (accessed on 6 May 2019).
- Ministry of Health Labour and Welfare. Available online: https://www.mhlw.go. jp/cotent10904750/000344234.pdf (accessed on 6 May 2019).
- Marcus, B.H.; Forsyth, L.H. Motivating People To Be Physically Active; Physical Activity Intervention Series; Human Kinetics: San Diego, CA, USA, 2003; ISBN 978-0736072472. [Google Scholar]
- DiClemente, C.C.; Prochaska, J.O.; Fairhurst, S.K.; Velicer, W.F.; Velasquez, M.M.; Rossi, J.S. The process of smoking cessation: an analysis of precontemplation, contemplation, and preparation stages of change. J. Consult. Clin. Psychol. 1991, 59, 295–304. [Google Scholar] [CrossRef] [PubMed]
- Hui, S.A.; Grandner, M.A. Associations between poor sleep quality and stages of change of multiple health behaviors among participants of employee wellness program. Prev. Med. Rep. 2015, 2, 292–299. [Google Scholar] [CrossRef] [PubMed] [Green Version]
- Cohen, J.E.; Pederson, L.L.; Ashley, M.J.; Bull, S.B.; Ferrence, R.; Poland, B.D. Is ‘stage of change’ related to knowledge of health effects and support for tobacco control? Addict. Behav. 2002, 27, 49–61. [Google Scholar] [CrossRef]
- Prochaska, J.O.; Velicer, W.F. The Transtheoretical Model of Health Behavior Change. Am. J. Heal. Promot. 1997, 12, 38–48. [Google Scholar] [CrossRef]
- TRUITY: The Big Five Personality Test. Available online: https://www.truity.com/test/big-five-personality-test (accessed on 28 June 2019).
- Letzring, T.D.; Edmonds, G.W.; Hampson, S.E. Personality change at mid-life is associated with changes in self-rated health: Evidence from the Hawaii Personality and Health Cohort. Pers. Individ. Dif. 2014, 58, 60–64. [Google Scholar] [CrossRef]
- Yamashita, Y.; Seki, N.; Umeda, K.; Tanabe, N.; Shinoda, K.; Konishi, I.; Sekiya, A.; Sekii, A.; Ohta, T. [Relationship between exercise adherence and personality characteristics in persons experienced in the Medical Fitness program]. Nihon. Koshu Eisei Zasshi. 2017, 64, 664–671. [Google Scholar]
- Masaka, M.; Kato, K.; Kondo, A.; Okushima, M. The health and environment facilitation effect with health mobility manacement in the local city. J. Jpn. Soc. Civ. Eng. D3 (Infrastruct. Plan. Manag. 2013, 69, I_57–I_65. [Google Scholar]
- Nakai, S.; Taniguchi, M.; Matsunaka, R.; Moriya, J. Mobility Management Effects on Behavior Modification: Walking Volume Feedback. Doboku Gakkai Ronbunshuu D 2008, 64, 45–54. [Google Scholar] [CrossRef]
- Sai, B.; Katayama, A.; Tanigu-chi, A.; Taniguchi, M. “Eating environment” and “Intention of eating behavior” effects on subjuective health. J. Jpn. Soc. Civ. Eng. Ser. G (Envi-ron. Res. 2017, 73, 121–129. [Google Scholar]
- Taniguchi, A.; Tabe, T.; Iryo, M.; Miyakawa, A.; Kojima, A. An Effect of Pedestrian’s Communication Toward driver on Promotion of Driver’s Cooperative Behavior to Give a Way for Pedestrian. Infrastruct. Plan. Manag. 2016, 72, I_1241–I_1247. [Google Scholar]
- Aznar, S.; Queralt, A.; García-massó, X.; Villarrasa-sapiña, I.; Molina-garcía, J. Multifactorial combinations predicting active vs inactive stages of change for physical activity in adolescents considering built environment and psychosocial factors: A classi fi cation tree approach. Health Place 2018, 53, 150–154. [Google Scholar] [CrossRef]
- Kelly, M.P.; Barker, M. Why is changing health-related behaviour so difficult? Public Health 2016, 136, 109–116. [Google Scholar] [CrossRef] [Green Version]
- Ishii, K.; Inoue, S.; Ohya, Y.; Odagiri, Y.; Takamiya, T.; Suijo, K.; Owen, N.; Shimomitsu, T. Sociodemographic Variation in the Perception of Barriers to Exercise Among Japanese Adults. J. Epidemiol. 2009, 19, 161–168. [Google Scholar] [CrossRef] [Green Version]
- Subtirelu, M.; Rincon-Subtirelu, M.; Pickett, M.; Heath, G.W. Promoting Active Living and Healthy Eating among Inner-City Youth through Community Health Workers: From Clinic to Neighborhood. Health (Irvine. Calif). 2014, 06, 2342–2348. [Google Scholar] [CrossRef] [Green Version]
- Macdonald, L.; Olsen, J.R.; Shortt, N.K.; Ellaway, A. Do ‘ environmental bads ’ such as alcohol, fast food, tobacco, and gambling outlets cluster and co-locate in more deprived areas in Glasgow City, Scotland? Health Place 2018, 51, 224–231. [Google Scholar] [CrossRef]
- Rakuten Insight. Available online: https://insight.rakuten.co.jp/en/aboutus.html (accessed on 28 June 2019).
- Sai, B.; Mori, H.; Taniguchi, A.; Taniguchi, M. The Causal Model of Linkages among Regional Environment and Physical/Mental Health: A Study based on BMI and Health-Related QOL. J. Jpn. Soc. Civ. Eng. Ser. D3 (Infrastruct. Plan. Manag. 2017, 73, I_355–I_366. [Google Scholar]
- Kobasa, S.C. Stressful life events, personality, and health: an inquiry into hardiness. J. Pers. Soc. Psychol. 1979, 37, 1–11. [Google Scholar] [CrossRef] [PubMed]
- Ayumi, H.; Masaru, H. Hardiness Scale and its relations to Mental Health. Juntendo Med. J. 2008, 54, 192–199. [Google Scholar] [CrossRef]
- Japanese Government Statistics. Population Cen-sus. Available online: https: //www.e-stat.go.jp/en/stat-search/filespage=1&layout=datalist&toukei=00200521&tstat=000001080615&cycle=0&tclass1=000001110216&stat_infid=00003165 2959 (accessed on 6 May 2019).
- Wilkinson, R.G.; Marmot, M. Social Determinants of Health: The Solid Facts; World Health Organization: Nottingham, UK, 2003; ISBN 9289012870. [Google Scholar]
- Ueshima, H. Environmental Factors as a Cause of Lifestyle-related Disease. Nihon Naika Gakkai Zasshi 2012, 101, 1404–1412. [Google Scholar] [CrossRef] [PubMed] [Green Version]
- Hudson, N.W.; Briley, D.A.; Chopik, W.J.; Derringer, J. You have to follow through: Attaining behavioral change goals predicts volitional personality change. J. Pers. Soc. Psychol. 2018. [Google Scholar] [CrossRef] [PubMed]
- Kajiwara, K. People’s life-style and awareness on eating concerned with a study of the young “Shoku-no-gaibuka”. J. Integr. Study Diet. Habits 2006, 17, 59–67. [Google Scholar] [CrossRef]
- Steptoe, A.; Wardle, J.; Vinck, J.; Tuomisto, M.; Holte, A.; Wichstrøm, L. Personality and attitudinal correlates of healthy and unhealthy lifestyles in young adults. Psychol. Health 1994, 9, 331–343. [Google Scholar] [CrossRef] [PubMed]
- Mõttus, R.; Realo, A.; Allik, J.; Deary, I.J.; Esko, T.; Metspalu, A. Personality traits and eating habits in a large sample of Estonians. Heal. Psychol. 2012, 31, 806–814. [Google Scholar] [CrossRef] [PubMed]


| No. | 15-Item Hardiness Scale | Factors of Personality Traits 1 | ||
|---|---|---|---|---|
| Challenge | Control | Commitment | ||
| 1 | Most days, life is really interesting and exciting for me. | 0.820 | 0.182 | 0.056 |
| 2 | I find it challenging to do more than one thing at a time. | 0.816 | 0.251 | 0.051 |
| 3 | Changes in daily activities are interesting. | 0.810 | 0.307 | 0.034 |
| 4 | I would like to have various experiences. | 0.808 | 0.308 | 0.055 |
| 5 | I like to change my daily schedule. | 0.696 | 0.313 | 0.022 |
| 6 | I like to learn new things. | 0.667 | 0.177 | 0.170 |
| 7 | By working hard you can nearly always achieve your goals. | 0.226 | 0.856 | 0.090 |
| 8 | How things go in my life depends on my own actions. | 0.241 | 0.850 | 0.086 |
| 9 | My choices make a real difference in how things turn out in the end. | 0.268 | 0.816 | 0.143 |
| 10 | When dealing with some difficult task, I know when to ask for help. | 0.205 | 0.785 | 0.045 |
| 11 | Planning ahead helps to avoid most future difficulties. | 0.297 | 0.719 | 0.171 |
| 12 | Something of interest might happen. | 0.573 | 0.048 | 0.453 |
| 13 | I don’t think there’s much I can do to influence my own future. | −0.111 | −0.052 | −0.851 |
| 14 | I feel that my life is somewhat empty of meaning. | 0.087 | −0.096 | −0.831 |
| 15 | Most of my life is spent doing meaningful things. | 0.343 | 0.310 | 0.596 |
| Category | Nutritional Balance | Sleeping | Exercise | Walking | ||||||||||
|---|---|---|---|---|---|---|---|---|---|---|---|---|---|---|
| Demographic factors | item | N | % | p | N | % | p | N | % | p | N | % | p | |
| state of vehicle ownership | no vehicle | 113 | 60% | * 0.017 | 82 | 39% | * 0.019 | |||||||
| self-ownership | 140 | 65% | 118 | 51% | ||||||||||
| co-ownership | 92 | 76% | 67 | 53% | ||||||||||
| gender | male | 117 | 44% | 187 | 66% | 139 | 46% | 209 | 67% | |||||
| female | 101 | 44% | 158 | 66% | 128 | 49% | 189 | 72% | ||||||
| age groups | young residents | 115 | 52% | ** 0.0001 | 181 | 73% | ** 0.0001 | 143 | 56% | ** 0.0001 | 192 | 76% | ** 0.003 | |
| middle-aged residents | 88 | 43% | 133 | 62% | 104 | 45% | 151 | 65% | ||||||
| elderly residents | 15 | 23% | 31 | 49% | 20 | 25% | 55 | 60% | ||||||
| employment situation | unemployed | 40 | 34% | * 0.012 | 73 | 57% | * 0.021 | |||||||
| employed | 178 | 47% | 272 | 69% | ||||||||||
| Personality traits | challenge | strong | 112 | 61% | ** 0.0001 | 167 | 80% | ** 0.0001 | 136 | 60% | ** 0.0001 | 193 | 83% | ** 0.0001 |
| weak | 106 | 34% | 178 | 57% | 131 | 38% | 205 | 60% | ||||||
| control | strong | 95 | 37% | ** 0.001 | 161 | 58% | ** 0.0001 | 126 | 42% | ** 0.010 | 180 | 59% | ** 0.0001 | |
| weak | 123 | 52% | 184 | 75% | 141 | 53% | 218 | 80% | ||||||
| commitment | strong | 94 | 53% | ** 0.003 | 146 | 73% | ** 0.009 | 118 | 54% | ** 0.010 | 174 | 77% | ** 0.0001 | |
| weak | 124 | 39% | 199 | 61% | 149 | 43% | 224 | 64% | ||||||
| Average check count of constituent factors of inhibition risk | 2.08 | 1.7 | 2.25 | 1.8 | ||||||||||
| Checked number of constituent factors of inhibition risk | large | 277 | 345 | 300 | 398 | |||||||||
| less | 218 | 179 | 267 | 178 | ||||||||||
| Total (n) | 495 | 524 | 567 | 576 | ||||||||||
| Classified Items | Nutritional Balance | Sleeping | Exercise | Walking | Group No. | ||
|---|---|---|---|---|---|---|---|
| 「reversion」stage | young residents | no vehicle | 11 | 22 | 21 | 24 | 1 |
| self-ownership | 23 | 27 | 38 | 33 | 2 | ||
| co-ownership | 11 | 21 | 26 | 19 | 3 | ||
| middle-aged residents | no vehicle | 18 | 16 | 22 | 18 | 4 | |
| self-ownership | 20 | 26 | 27 | 28 | 5 | ||
| co-ownership | 13 | 21 | 23 | 26 | 6 | ||
| elderly residents | 14 | 15 | 28 | 27 | 7 | ||
| 「preparation」stage | young residents | no vehicle | 41 | 40 | 35 | 36 | 8 |
| self-ownership | 34 | 36 | 32 | 35 | 9 | ||
| co-ownership | 19 | 24 | 17 | 20 | 10 | ||
| middle-aged residents | no vehicle | 23 | 23 | 23 | 23 | 11 | |
| self-ownership | 35 | 34 | 36 | 37 | 12 | ||
| co-ownership | 13 | 18 | 11 | 11 | 13 | ||
| elderly residents | 14 | 16 | 12 | 20 | 14 | ||
| 「pre-contemplation」stage | young residents | no vehicle | 40 | 37 | 44 | 41 | 15 |
| self-ownership | 26 | 25 | 24 | 27 | 16 | ||
| co-ownership | 17 | 15 | 18 | 17 | 17 | ||
| middle-aged residents | no vehicle | 26 | 22 | 27 | 26 | 18 | |
| self-ownership | 43 | 42 | 46 | 47 | 19 | ||
| co-ownership | 16 | 12 | 16 | 16 | 20 | ||
| elderly residents | 38 | 32 | 41 | 45 | 21 | ||
| Living Habits | Explanatory Variable | Objective Variable 1 | ||||||||
|---|---|---|---|---|---|---|---|---|---|---|
| Category | ALL | Challenge | Control | Commitment | ||||||
| Subcategory | N | % | R2 | p | R2 | p | R2 | p | ||
| Nutritional balance | Constraints in living environment | 80 | 16% | 0.27 | 0.02 | 0.00 | 0.84 | 0.03 | 0.43 | |
| Constraints due to social and community network | 88 | 18% | 0.41 | 0.00 | 0.01 | 0.75 | 0.00 | 0.81 | ||
| Personal lifestyle constraints | Time constraints | 219 | 44% | 0.42 | 0.00 | 0.04 | 0.39 | 0.01 | 0.75 | |
| Economic constraints | 114 | 23% | 0.30 | 0.01 | 0.04 | 0.41 | 0.07 | 0.24 | ||
| Subjective perception | Sense of health | 71 | 14% | 0.13 | 0.11 | 0.14 | 0.10 | 0.02 | 0.54 | |
| Negative feelings | 228 | 46% | 0.27 | 0.01 | 0.06 | 0.28 | 0.02 | 0.51 | ||
| Sleeping | Constraints in living environment | 58 | 11% | 0.02 | 0.55 | 0.04 | 0.41 | 0.00 | 0.90 | |
| Constraints due to social and community network | - | - | - | - | - | - | - | - | ||
| Personal lifestyle constraints | Time constraints | 265 | 51% | 0.46 | 0.00 | 0.00 | 0.86 | 0.02 | 0.57 | |
| Economic constraints | 87 | 17% | 0.23 | 0.03 | 0.00 | 0.97 | 0.01 | 0.63 | ||
| Subjective perception | Sense of health | 148 | 28% | 0.52 | 0.00 | 0.00 | 0.92 | 0.02 | 0.59 | |
| Negative feelings | 185 | 35% | 0.27 | 0.02 | 0.00 | 0.96 | 0.04 | 0.36 | ||
| Exercise | Constraints in living environment | 104 | 18% | 0.24 | 0.02 | 0.03 | 0.47 | 0.08 | 0.22 | |
| Constraints due to social and community network | 50 | 9% | 0.21 | 0.04 | 0.01 | 0.62 | 0.05 | 0.34 | ||
| Personal lifestyle constraints | Time constraints | 273 | 48% | 0.42 | 0.00 | 0.02 | 0.51 | 0.05 | 0.33 | |
| Economic constraints | 131 | 23% | 0.28 | 0.01 | 0.03 | 0.45 | 0.00 | 0.95 | ||
| Subjective perception | Sense of health | 100 | 18% | 0.26 | 0.02 | 0.04 | 0.39 | 0.04 | 0.39 | |
| Negative feelings | 281 | 50% | 0.26 | 0.02 | 0.02 | 0.51 | 0.06 | 0.29 | ||
| Walking | Constraints in living environment | 89 | 15% | 0.30 | 0.01 | 0.07 | 0.26 | 0.03 | 0.43 | |
| Constraints due to social and community network | 41 | 7% | 0.36 | 0.00 | 0.00 | 0.84 | 0.00 | 0.94 | ||
| Personal lifestyle constraints | Time constraints | 254 | 44% | 0.49 | 0.00 | 0.01 | 0.65 | 0.03 | 0.49 | |
| Economic constraints | 85 | 15% | 0.32 | 0.01 | 0.03 | 0.46 | 0.03 | 0.42 | ||
| Subjective perception | Sense of health | 99 | 17% | 0.19 | 0.05 | 0.04 | 0.42 | 0.02 | 0.53 | |
| Negative feelings | 280 | 49% | 0.40 | 0.00 | 0.00 | 0.87 | 0.18 | 0.06 | ||
© 2019 by the authors. Licensee MDPI, Basel, Switzerland. This article is an open access article distributed under the terms and conditions of the Creative Commons Attribution (CC BY) license (http://creativecommons.org/licenses/by/4.0/).
Share and Cite
Cui, W.; Katayama, A.; Shimizu, H.; Taniguchi, M. Inhibitory Risks Affecting the Maintenance of Healthy Lifestyle Habits—A Study Based on Demographic Factors and Personality Traits. Int. J. Environ. Res. Public Health 2019, 16, 2322. https://doi.org/10.3390/ijerph16132322
Cui W, Katayama A, Shimizu H, Taniguchi M. Inhibitory Risks Affecting the Maintenance of Healthy Lifestyle Habits—A Study Based on Demographic Factors and Personality Traits. International Journal of Environmental Research and Public Health. 2019; 16(13):2322. https://doi.org/10.3390/ijerph16132322
Chicago/Turabian StyleCui, Wenzhu, Akane Katayama, Hiroki Shimizu, and Mamoru Taniguchi. 2019. "Inhibitory Risks Affecting the Maintenance of Healthy Lifestyle Habits—A Study Based on Demographic Factors and Personality Traits" International Journal of Environmental Research and Public Health 16, no. 13: 2322. https://doi.org/10.3390/ijerph16132322