Examining the Walking Accessibility, Willingness, and Travel Conditions of Residents in Saudi Cities


Abstract
:1. Introduction
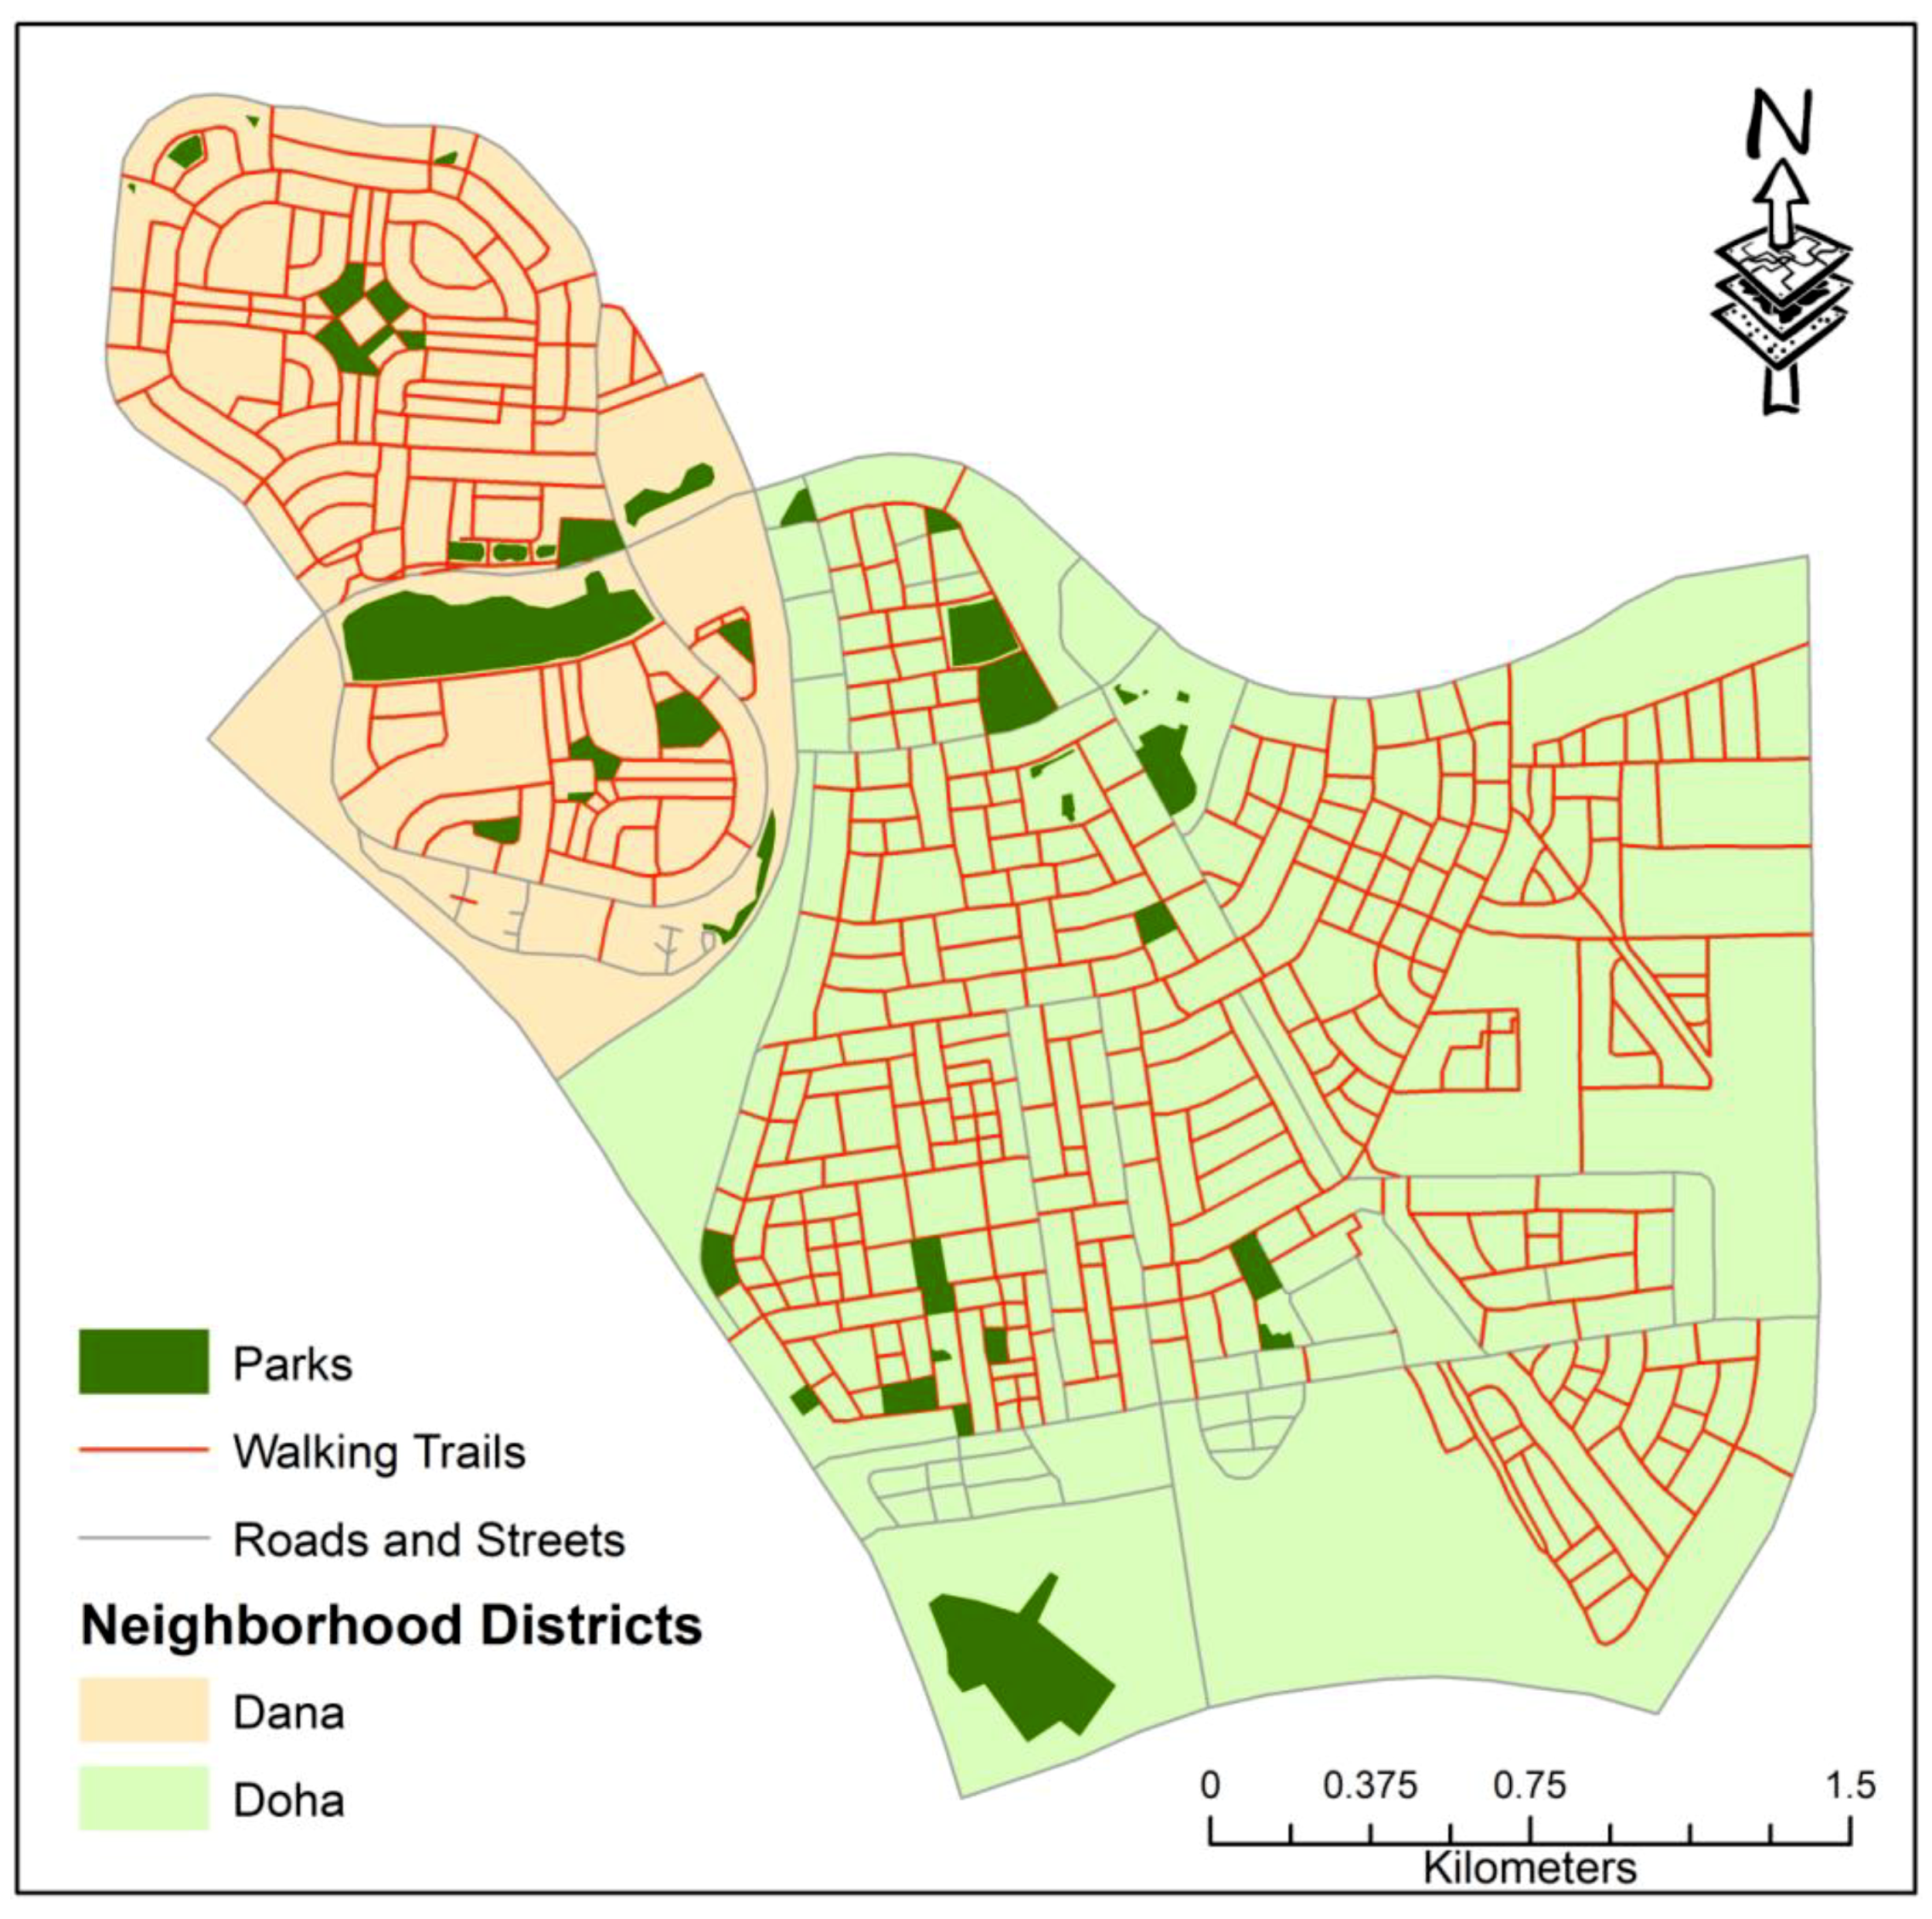
2. Study Area
3. Data and Methods
4. Results
4.1. Patterns and Distribution of Community Services
4.2. Travel and Walking Behavior, and the Willingness to Walk by the Residents
4.3. Neighborhood Walking Conditions
5. Discussion
5.1. Patterns and Distribution of Community Services
5.2. Walking Behavior and Willingness to Walk by the Residents
5.3. Neighborhood Walking Conditions
5.4. Study Limitations
6. Conclusions
Author Contributions
Funding
Acknowledgments
Conflicts of Interest
References
- De Pergola, G.; Silvestris, F. Obesity as a major risk factor for cancer. J. Obes. 2013, 2013, 1–11. [Google Scholar] [CrossRef] [PubMed]
- Calle, E.E.; Thun, M.J. Obesity and cancer. Oncogene 2004, 23, 6365–6378. [Google Scholar] [CrossRef] [Green Version]
- Lavie, C.J.; Milani, R.V.; Ventura, H.O. Obesity and Cardiovascular Disease. Risk Factor, Paradox, and Impact of Weight Loss. J. Am. Coll. Cardiol. 2009, 53, 1925–1932. [Google Scholar] [CrossRef]
- Al-Goblan, A.S.; Al-Alfi, M.A.; Khan, M.Z. Mechanism linking diabetes mellitus and obesity. Diabetes Metab. Syndr. Obes. Targets Ther. 2014, 7, 587–591. [Google Scholar] [CrossRef] [PubMed]
- Boston, G. The Many Benefits of Walking 30 Minutes a Day. Available online: https://www.washingtonpost.com/lifestyle/wellness/the-many-benefits-of-walking-30-minutes-a-day/2015/10/19/cf12c938-71e1-11e5-9cbb-790369643cf9_story.html?utm_term=.5064ea52b381 (accessed on 13 February 2018).
- Atef Elhamy Kamel, M. Encouraging walkability in GCC cities: Smart urban solutions. Smart Sustain. Built Environ. 2013, 2, 288–310. [Google Scholar] [CrossRef]
- Litman, T.A. Economic Value of Walkability. Transp. Res. Rec. 2003, 10, 3–11. [Google Scholar] [CrossRef]
- Humpel, N. Environmental factors associated with adults’ participation in physical activity A review. Am. J. Prev. Med. 2002, 22, 188–199. [Google Scholar] [CrossRef]
- Butler, G.P.; Orpana, H.M.; Wiens, A.J. By your own two feet. Factors associated with active transportation in Canada. Can. J. Public Heal. 2007, 98, 259–264. [Google Scholar]
- Owen, N.; Humpel, N.; Leslie, E.; Bauman, A.; Sallis, J.F. Understanding environmental influences on walking: Review and research agenda. Am. J. Prev. Med. 2004, 27, 67–76. [Google Scholar] [CrossRef] [PubMed]
- Booth, M.L.; Owen, N.; Bauman, A.; Clavisi, O.; Leslie, E. Social-cognitive and perceived environment influences associated with physical activity in older Australians. Prev. Med. 2000, 31, 15–22. [Google Scholar] [CrossRef]
- Saelens, B.E.; Handy, S.L. Built environment correlates of walking: A review. Med. Sci. Sports Exerc. 2008, 40, 550–566. [Google Scholar] [CrossRef]
- Handy, S.L.; Boarnet, M.G.; Ewing, R.; Killingsworth, R.E. How the built environment affects physical activity: Views from urban planning. Am. J. Prev. Med. 2002, 23, 64–73. [Google Scholar] [CrossRef]
- McCormack, G.; Giles-Corti, B.; Lange, A.; Smith, T.; Martin, K.; Pikora, T. An update of recent evidence of the relationship between objective and self-report measures of the physical environment and physical activity behaviours. J. Sci. Med. Sport 2004, 7, 81–92. [Google Scholar] [CrossRef]
- Charreire, H.; Weber, C.; Chaix, B.; Salze, P.; Casey, R.; Banos, A.; Badariotti, D.; Kesse-Guyot, E.; Hercberg, S.; Simon, C.; et al. Identifying built environmental patterns using cluster analysis and GIS: Relationships with walking, cycling and body mass index in French adults. Int. J. Behav. Nutr. Phys. Act. 2012, 9, 1–11. [Google Scholar] [CrossRef] [PubMed]
- Saelens, B.E.; Sallis, J.F.; Black, J.B.; Chen, D. Neighborhood-Based Differences in Physical Activity: An Environment Scale Evaluation. Am. J. Public Health 2003, 93, 1552–1558. [Google Scholar] [CrossRef] [PubMed] [Green Version]
- Panter, J.R.; Jones, A.P.; van Sluijs, E.M.F.; Griffin, S.J. Europe PMC Funders Group Attitudes, social support and environmental perceptions as predictors of active commuting behaviour in school children. J. Epidemiol. Community Health 2010, 64, 41–48. [Google Scholar] [CrossRef] [PubMed]
- Maisel, J.L. Impact of Older Adults’ Neighborhood Perceptions on Walking Behavior. J. Aging Phys. Act. 2016, 24, 247–255. [Google Scholar] [CrossRef]
- Chiang, Y.C.; Sullivan, W.; Larsen, L. Measuring neighborhood walkable environments: A comparison of three approaches. Int. J. Environ. Res. Public Health 2017, 14, 1–12. [Google Scholar] [CrossRef]
- Sugiyama, T.; Leslie, E.; Giles-Corti, B.; Owen, N. Associations of neighbourhood greenness with physical and mental health: Do walking, social coherence and local social interaction explain the relationships? J. Epidemiol. Community Health 2008, 62, e9. [Google Scholar] [CrossRef]
- Corazza, M.V.; Di Mascio, P.; Moretti, L. Managing sidewalk pavement maintenance: A case study to increase pedestrian safety. J. Traffic Transp. Eng. 2016, 3, 203–214. [Google Scholar] [CrossRef] [Green Version]
- Ewing, R.; Schroeer, W.; Greene, W. School location and student travel. Transp. Res. Rec. 2004, 1895, 55–63. [Google Scholar] [CrossRef]
- Davidson, K.K.; Lawson, C.T. Do attributes in the physical environment influence children’s physical activity? A review of the literature. Int. J. Behav. Nutr. Phys. Act. 2006, 3, 1–17. [Google Scholar]
- Gomez, J.E.; Johnson, B.A.; Selva, M.; Sallis, J. Violent crime and outdoor physical activity among inner-city youth. Prev. Med. 2004, 39, 876–881. [Google Scholar] [CrossRef] [PubMed]
- Rahman, M.T. Detection of land use/land cover changes and urban sprawl in Al-Khobar, Saudi Arabia: An analysis of multi-temporal remote sensing data. ISPRS Int. J. Geo-Inf. 2016, 5, 15. [Google Scholar] [CrossRef]
- Aina, Y.A.; Merwe, J.H.V.; Alshuwaikhat, H.M. Urban Spatial Growth and Land Use Change in Riyadh: Comparing Spectral Angle Mapping and Band Ratioing Techniques. In Proceedings of the Academic Track of the 2008 Free and Open Source Software for Geospatial (FOSS4G) Conference, Incorporating the GISSA 2008 Conference, Cape Town, South Africa, 29 September–3 October 2008; pp. 51–57. [Google Scholar]
- Rahman, M.T.; Aldosary, A.; Nahiduzzaman, K.M.; Reza, I. Vulnerability of flash flooding in Riyadh, Saudi Arabia. Nat. Hazards 2016, 84, 1807–1830. [Google Scholar] [CrossRef]
- Alrashed, F.; Asif, M. Trends in Residential Energy Consumption in Saudi Arabia with Particular Reference to the Eastern Province. J. Sustain. Dev. Energy, Water Environ. Syst. 2014, 2, 376–387. [Google Scholar] [CrossRef] [Green Version]
- Alhubashi, H.H. Housing Sector in Saudi Arabia: A Study of Challenge and Opportunities of Homeownership for the Middle and Low Income; Polytechnic University of Cataonia: Barcelona, Spain, 2012. [Google Scholar]
- Rahman, M.T.; Aldosary, A.S.; Mortoja, M.G. Modeling Future Land Cover Changes and Their Effects on the Land Surface Temperatures in the Saudi Arabian Eastern Coastal City of Dammam. Land 2017, 6, 36. [Google Scholar] [CrossRef]
- Dehwah, A.; Asif, M.; Rahman, M.T. Prospects of PV application in unregulated building rooftops in developing countries: A perspective from Saudi Arabia. Energy Build. 2018, 171, 76–87. [Google Scholar] [CrossRef]
- Rahman, M.T. Examining and modelling the determinants of the rising land surface temperatures in arabian desert cities: An example from Riyadh, Saudi Arabia. J. Settlements Spat. Plan. 2018, 9, 1–10. [Google Scholar] [CrossRef]
- Aljoufie, M.; Zuidgeest, M.; Brussel, M.; Maarseveen, M.V. Spatial–temporal analysis of urban growth and transportation in Jeddah City, Saudi Arabia. Cities 2013, 31, 57–68. [Google Scholar] [CrossRef]
- Algadhi, S.; Mufti, R.; Malick, D. Estimating the Total Number of Vehicles Active on the Road in Saudi Arabia. J. King Abdulaziz Univ. Eng. Sci. 2002, 14, 3–28. [Google Scholar] [CrossRef]
- Almahamood, M.; Scharnhorst, E.; Carstensen, T.A.; Jorgenses, G.; Schulze, O. Mapping the gendered city: Investigating the socio-cultural influence on the practice of walking and the meaning of walkscapes among young Saudi adults in Riyadh. J. Urban Des. 2017, 22, 229–248. [Google Scholar] [CrossRef]
- Al-Ghamdi, A.S. Pedestrian-vehicle crashes and analytical techniques for stratified contingency tables. Accid. Anal. Prev. 2002, 34, 205–214. [Google Scholar] [CrossRef]
- Shokry, H.; Maksoud, R. Improving Walkability within Existing Urban Design. In Proceedings of the 3rd International Conference on Liveable Cities—A Joint Conference with International Conference on Engineering, Innovation & Technology (ICLC2015 & EIT2015), Kuching, Malaysia, 15–17 August 2015; pp. 1–11. [Google Scholar]
- Dhahran Population. Available online: http://population.city/saudi-arabia/dhahran/ (accessed on 26 November 2018).
- World Weather and Climate Information. Average Weather in Al-Khobar, Saudi Arabia. Available online: http://www.weather-and-climate.com/average-monthly-Rainfall-Temperature-Sunshine,al-khobar,Saudi-Arabia (accessed on 5 November 2014).
- Myint, S.W. An exploration of spatial dispersion, pattern, and association of socio-economic functional units in an urban system. Appl. Geogr. 2008, 28, 168–188. [Google Scholar] [CrossRef]
- Chebat, J.C.; Gélinas-Chebat, C.; Therrien, K. Gender-related wayfinding time of mall shoppers. J. Bus. Res. 2008, 61, 1076–1082. [Google Scholar] [CrossRef]
- McLeod, K. WHERE WE RIDE: Analysis of Bicycling in American Cities; The League of American Bicyclists: Washington D. C., WA, USA, 2013. [Google Scholar]
- Nabielek, K.; Hamers, D.; Evers, D. Cities in Europe: Facts and Figures on Cities and Urban Areas; PBL Netherlands Environmental Assessment Agency: The Hague, The Netherlands, 2016. [Google Scholar]
- Friedman, L. Here Are The States Where The Most People Walk Or Bike To Work. Available online: http://www.businessinsider.com/here-are-the-states-where-the-most-people-walk-or-bike-to-work-2014-7 (accessed on 15 November 2018).
- Kitchen, P.; Williams, A.; Chowhan, J. Walking to work in Canada: Health benefits, socio-economic characteristics and urban-regional variations. BMC Public Health 2011, 11, 212. [Google Scholar] [CrossRef] [PubMed]
- Cravo, V.S.; Cohen, J.E. The impact of weather on transit revenue in New York City. In Proceedings of the Proceedings of the 88th Annual Meeting of the Transportation Research Board, Transportation Research Board of National Academies, Washington, DC, USA, 11–15 January 2009. [Google Scholar]
- Clarke, P.; Hirsch, J.A.; Melendez, R.; Winters, M.; Gould, J.S.; Ashe, M.; Furst, S.; McKay, H. Snow and Rain Modify Neighbourhood Walkability for Older Adults. Can. J. Aging 2017, 36, 159–169. [Google Scholar] [CrossRef] [Green Version]
- Yang, Y.; Roux, A.V.; Auchincloss, A.H.; Rodriguez, D.A.; Brown, D.G. Exploring walking differences by socioeconomic status using a spatial agent-based model. Heal. Place 2012, 18, 96–99. [Google Scholar] [CrossRef] [Green Version]
- Laker, L. Where is the World’s Most Walkable City? Available online: https://www.theguardian.com/cities/2017/sep/12/walkable-city-worlds-most-new-york-melbourne-fes-el-bali (accessed on 18 November 2018).
- Budds, D. The Hidden Inequality Of America’s Street Design. Available online: https://www.fastcodesign.com/3067055/the-hidden-inequality-of-americas-street-design (accessed on 21 November 2018).
- Ovstedal, L.; Ryeng, E.O. Understanding pedestrian comfort in European Cities: How to improve walking conditions? In Proceedings of the European Transport Conference, Cambridge, UK, 9–11 September 2002. [Google Scholar]
- Shaaban, K.; Muley, D.; Elnashar, D. Evaluating the effect of seasonal variations on walking behaviour in a hot weather country using logistic regression. Int. J. Urban Sci. 2017, 1–10. [Google Scholar] [CrossRef]


| Type of Facility | Number of Facility | Observed Mean Distance (m) | Mean Random Distance (m) | NNI | Distribution Pattern |
|---|---|---|---|---|---|
| Laundries | 9 | 39.17 | 493.72 | 0.08 | Clustered |
| Misc. Commercial Facilities | 71 | 30.97 | 175.78 | 0.18 | Clustered |
| Coffee Shops & Restaurants | 38 | 57.37 | 240.28 | 0.24 | Clustered |
| Supermarket & Grocery Stores | 10 | 228.10 | 468.39 | 0.49 | Random |
| Pharmacies | 5 | 362.82 | 662.40 | 0.55 | Random |
| Banks & ATMs | 14 | 221.50 | 395.86 | 0.56 | Random |
| Hair Salons | 8 | 294.26 | 523.67 | 0.56 | Random |
| Schools | 13 | 315.56 | 410.80 | 0.77 | Random |
| Gas Stations | 5 | 771.56 | 662.40 | 1.16 | Dispersed |
| Mosques | 27 | 357.15 | 285.05 | 1.25 | Dispersed |
| Type of Facility | Threshold Distance (m) | Minimum Number of Facility per Hotspot | Number of Hotspots Produced | Number of Facilities per Hotspot |
|---|---|---|---|---|
| Coffee Shops & Restaurants | 500 | 5 | 3 | 8, 5, and 10 |
| Laundries | 1000 | 5 | 1 | 7 |
| Miscellaneous Commercial Facilities | 1000 | 5 | 2 | 7 and 50 |
| Type of Facility | Statistics of Distances (in meters) | |||
|---|---|---|---|---|
| Minimum | Maximum | Mean | Standard Deviation | |
| Mosques | 3 | 1153 | 242 | 140 |
| Schools | 5 | 1333 | 430 | 240 |
| Miscellaneous Commercial Facilities | 2 | 1832 | 576 | 383 |
| Banks & ATMs | 3 | 1862 | 590 | 368 |
| Coffee Shops & Restaurants | 7 | 1830 | 596 | 380 |
| Supermarket & Grocery Stores | 4 | 1807 | 649 | 356 |
| Hair Salons | 8 | 1932 | 663 | 378 |
| Laundries | 6 | 1956 | 670 | 383 |
| Gas Stations | 18 | 2206 | 807 | 458 |
| Pharmacies | 5 | 2431 | 963 | 607 |
| Basic Needs Classification | Gender | Age in Years | ||||||
|---|---|---|---|---|---|---|---|---|
| Male n = 138 | Female n = 62 | <20 n = 28 | 21-30 n = 98 | 31-40 n = 25 | 41-50 n = 30 | 51-60 n = 9 | >60 n = 10 | |
| Grocery | 83.33 | 69.35 | 82.1 | 90.8 | 84.0 | 70.0 | 11.1 | 30.0 |
| Recreation | 71.01 | 38.71 | 60.7 | 78.6 | 64.0 | 36.7 | 0.0 | 10.0 |
| Banking | 31.16 | 11.29 | 17.9 | 26.5 | 44.0 | 23.3 | 0.0 | 10.0 |
| School & Employment | 40.58 | 22.58 | 53.6 | 37.8 | 24.0 | 30.0 | 11.1 | 20.0 |
| Others | 43.48 | 27.42 | 42.9 | 36.7 | 32.0 | 43.3 | 22.2 | 60.0 |
| Basic Needs Classification | Mode of Transport (Percentage of Total Sampled Respondents) | |||
|---|---|---|---|---|
| Private Vehicle | Public Transport | Biking | Walking | |
| Grocery | 95.5 | 9.1 | 9.1 | 59.1 |
| Recreation | 94.1 | 0 | 11.8 | 64.7 |
| Banking | 100 | 0 | 0 | 57.1 |
| School & Employment | 88.9 | 11.1 | 11.1 | 66.7 |
| Reason for not Willing to Walk | Gender | |
|---|---|---|
| Male | Female | |
| Hot and humid weather | 36.3 | 32.4 |
| Poorly designed sidewalk | 15.6 | 8.7 |
| Sidewalk is discontinuous | 14.2 | 20.2 |
| Unsafe road crossing | 15.9 | 16.8 |
| Design not suitable for walking | 8.4 | 0 |
| Narrow sidewalk | 0 | 12.7 |
| Sidewalk occupied by other establishments | 9.5 | 9.2 |
© 2019 by the authors. Licensee MDPI, Basel, Switzerland. This article is an open access article distributed under the terms and conditions of the Creative Commons Attribution (CC BY) license (http://creativecommons.org/licenses/by/4.0/).
Share and Cite
Rahman, M.T.; Nahiduzzaman, K.M. Examining the Walking Accessibility, Willingness, and Travel Conditions of Residents in Saudi Cities. Int. J. Environ. Res. Public Health 2019, 16, 545. https://doi.org/10.3390/ijerph16040545
Rahman MT, Nahiduzzaman KM. Examining the Walking Accessibility, Willingness, and Travel Conditions of Residents in Saudi Cities. International Journal of Environmental Research and Public Health. 2019; 16(4):545. https://doi.org/10.3390/ijerph16040545
Chicago/Turabian StyleRahman, Muhammad Tauhidur, and Kh. Md. Nahiduzzaman. 2019. "Examining the Walking Accessibility, Willingness, and Travel Conditions of Residents in Saudi Cities" International Journal of Environmental Research and Public Health 16, no. 4: 545. https://doi.org/10.3390/ijerph16040545