Global Need for Physical Rehabilitation: Systematic Analysis from the Global Burden of Disease Study 2017


Abstract
1. Introduction
- How large are the estimated world’s YLDs (i.e., YLD counts, YLDs rates per 100,000 peole, and age-standardized YLD rates) likely benefiting from physical rehabilitation in 2017?
- What is the percentage of the world’s YLDs likely benefiting from physical rehabilitation relative to total YLDs?
- Did any of these estimates change significantly over time (i.e., since 1990)? If so, by how much? and, finally,
- Did any of those trends differ across countries of varying income levels?
2. Methods
2.1. Study Design
2.2. Data Selection
2.3. Measures and Data Extraction:
- YLD Counts: Nominal amount of YLDs;
- YLD Rates: YLDs per 100,000 people, i.e., adjusted for population size only;
- Age-standardized YLD Rates: YLD values adjusted for both population size and ageing;
- Percentage of YLDs Benefiting from Physical Rehabilitation: The proportion of YLDs from conditions likely benefiting from physical rehabilitation among total YLDs, provided in percent values.
2.4. Data Analysis
3. Results
4. Discussion
Limitations
5. Conclusions
Supplementary Materials
Author Contributions
Funding
Conflicts of Interest
Appendix A
- A
- On the side of Over-Estimation, we ended up Including the sequelae (i.e., YLDs) from:
- All Cardiovascular (“causes”):
- All Chronic Respiratory Diseases (“causes”):
- All Neonatal Conditions (“causes”).○ We include all neonatal conditions, including “Hemolytic diseases and other neonatal jaundice”. For instance, although frequently benign, neonatal jaundice can become severe and lead to encephalopathy and neurodevelopment impairments [49]. Hence, sequalae (i.e., YLDs) from this condition would be amenable to physical rehabilitation. Overall, sequalae from neonatal conditions would likely lead to some form of physical, neurological or motor impairments or delays that are amenable to physical rehabilitation, although we acknowledge that they might not be present in all cases and therefore the possibility of some error on side of overestimation.
- Alzheimer’s Disease and other Dementias.○ A wide scope of mental, cognitive as well as physical impairments and rehabilitation needs are associated with these conditions, which progress to affect the activities of daily living (ADLs) and mobility, inclusively from deconditioning. Evidence points out that exercise programs may at least improve the ability to perform ADLs in people with dementia, as in the following examples:Therapeutic interventions that include aerobic and strengthening exercises may help improve independence in ADLs and improve physical performance in people with Alzheimer’s Disease [50]. Strong evidence also supports the benefits of occupation-based interventions and physical exercise for adults with Alzheimer’s Disease and related major neurocognitive disorders [51]. Some evidence hints that physical activity can even improve or slow down decreases in cognitive functioning [52,53]. Even though a Cochrane review in 2015 found no evidence of benefit from exercise on cognition, neuropsychiatric symptoms, or depression, benefits in ADLs were found [54]. Finally, another systematic review hints that preliminary support exists for the effectiveness of physical therapy and exercise interventions in patients with Huntington’s Disease [55].Overall, the inclusion of these conditions can lead to an over-estimation of YLDs amenable to physical rehabilitation as the severity and respective disability weights of these conditions also account for cognitive and mental health needs.
- Autism Spectrum Disorder:○ Even though psychosocial dysfunction might be dominant, sensory-processing and motor impairments are prevalent and might be addressed by physical rehabilitation approaches [29,30,31,32,33,34,35], yet these impairments are not always present and psychosocial disfunction is often dominant. This means that YLDs from this condition are also germane to other forms of rehabilitative or habilitative interventions—therefore, the possible over-estimation of physical rehabilitation needs from YLDs that came from this condition.
- B
- On the side of Under-Estimation, we ended up Excluding the sequelae (i.e., YLDs) from:
- Tuberculosis:○ Although physical impairments might come as sequalae of this condition, we only found a study protocol for a scoping review on the subject [56], whose findings may inform a further systematic review to explore the effectiveness of rehabilitation strategies used to address physical impairments and activity limitations in people with this infection. At today’s level of synthesized evidence, we did not include this condition.
- Malaria:○ We did not find a strong, recent body of evidence systematically reviewed regarding the effect of physical or even cognitive rehabilitation interventions, even though cognitive impairments are prevalent sequelae in a sub-set of people with malaria and rehabilitative solutions have been proposed, including physical therapy and speech therapy [57]. Malaria is pointed out as one of the possible causes of the disproportionate, high prevalence of cerebral palsy in low-income countries [58]. While that consequence would be amenable to physical rehabilitation, we did not find a systematic study or review on that linkage, inclusively detailing the proportion of cases with sequalae from malaria that lead to cerebral palsy. Therefore, we did not include YLDs from this condition.
- Other Neglected Tropical Diseases (apart from Leprosy and Zika Virus):○ For Zika Virus and Leprosy we have found reviews or overviews on the likely benefit of physical rehabilitation approaches [59,60,61]. All other conditions in this category were not included, given the lack of identified research or reviews of research focused on the rehabilitation of those conditions.
- Epilepsy:
- Migraine:○ There is a body of evidence supporting the benefits of physical therapy for migraine and other headaches, but the methodological shortcomings reduce the confidence in the results [64]. Besides, physical therapy in migraine is more controversial than in tension-type headaches (TTH), since migraine pathogenesis involves activation of sub-cortical structures and the trigemino-vascular system, whereas pathogenesis of TTH is more associated with musculoskeletal disorders, e.g., muscle pain [65]. Finally, we have found systematically reviewed information supporting specific types of physical therapy interventions for TTH [66]. Hence, we have included TTH, but not migraine, even though it cannot be ruled out the effectiveness of physical therapy across headache conditions.
- Attention Deficit Hyperactivity Disorder:○ Even though occupational therapy interventions can have positive impacts in children’s participation and executive functions [67], the cognitive-functional scope of the intervention only partly relates with physical rehabilitation, and we did not find any systematic reviews supporting the benefit of interventions within the realm of physical rehabilitation for this condition.
- Diabetes○ Even at the 5th level of the GBD hierarchy, the one with higher detail, we do not have the data for amputation as a consequence of diabetes, for example in contrast with kidney diseases. In these circumstances, we altogether exclude YLDs from diabetes to avoid many false positives in terms of physical rehabilitation need, notably from kidney and eye impairments.
- All mental health conditions and substance abuse.
- Maternal, Urological, or Gynecological or conditions.○ Even though there is a body of literature pointing out that physical therapy can be useful on strengthening the pelvic floor muscles and reducing related incontinence (versus no treatments) or even reduce vestibulodynia [70,71], the underlying evidence base, for example on the chronic pelvic pain and incontinence (when added to another active treatment) still is considered insufficient [72,73,74,75]. Finally, it was complex to depict which are the GBD “causes” resulting in those symptoms, and there are no GBD “impairments” for example about incontinence. So, we altogether have excluded the maternal, urological or gynecological diseases, even though some might generate YLDs eventually amenable to physical rehabilitation.
- Nutritional deficiencies:○ Sequalae from nutritional deficiencies can be many and varied. Therefore, some of the YLDs can be amenable to physical rehabilitation while many others not. For instance, even though Iodine Deficiency can lead to fatigue and that can be possibly addressed by physical rehabilitation, it often leads to more significant sequalae in terms of mental development [76,77]. We avoided the inclusion of conditions from which we can expect a high rate of YLDs not amenable to physical rehabilitation.
- Unspecific conditions such as “Other Non-communicable diseases”, “Effect of different environmental factors” and “Complications following therapeutic procedures”○ In some cases, these unspecific conditions might lead to physical rehabilitation needs (e.g., hemorrhage after neurosurgery that leads to spinal cord damage) or not (e.g., wound infection after surgery). In a conservative approach, we opt not to include too many false positives.
- Physical rehabilitation needs from deconditioning in turn arising from non-specific causes (e.g., hospital-associated deconditioning), or even physical rehabilitation needs arising from senescence, i.e., with no need for an underlying disease or injury.
References
- Chatterji, S.; Byles, J.; Cutler, D.; Seeman, T.; Verdes, E. Health, functioning, and disability in older adults—Present status and future implication. Lancet 2015, 385, 563–575. [Google Scholar] [CrossRef]
- World Health Organization and World Bank. World Report on Disability; WHO: Geneva, Switzerland, 2011. [Google Scholar]
- World Health Organization. World Report on Ageing and Health; WHO: Geneva, Switzerland, 2015. [Google Scholar]
- GBD 2016 DALYs and HALE Collaborators. Global, regional, and national disability-adjusted life-years (DALYs) for 333 diseases and injuries and healthy life expectancy (HALE) for 195 countries and territories, 1990–2016: A systematic analysis for the Global Burden of Disease Study 2016. Lancet 2017, 390, 1260–1344. [Google Scholar] [CrossRef]
- GBD 2016 Disease and Injury Incidence and Prevalence Collaborators. Global, regional, and national incidence, prevalence, and years lived with disability for 328 diseases and injuries for 195 countries, 1990–2016: A systematic analysis for the Global Burden of Disease Study 2016. Lancet 2017, 390, 1211–1259. [Google Scholar] [CrossRef]
- GBD 2017 Disease and Injury Incidence and Prevalence Collaborators. Global, regional, and national incidence, prevalence, and years lived with disability for 354 diseases and injuries for 195 countries and territories, 1990–2017: A systematic analysis for the Global Burden of Disease Study 2017. Lancet 2018, 392, 1789–1858. [Google Scholar] [CrossRef]
- World Health Organization. Rehabilitation 2030: A Call for Action. The Need to Scale up Rehabilitation; WHO: Geneva, Switzerland, 2017; Available online: http://www.who.int/disabilities/care/NeedToScaleUpRehab.pdf?ua=1 (accessed on 12 July 2018).
- Gupta, N.; Castillo-Laborde, C.; Landry, M.D. Health-related rehabilitation services: Assessing the global supply of and need for human resources. BMC Health Serv. Res. 2011, 11, 276. [Google Scholar] [CrossRef]
- Haagsma, J.A.; Graetz, N.; Bolliger, I.; Naghavi, M.; Higashi, H.; Mullany, E.C.; Abera, S.F.; Abraham, J.P.; Adofo, K.; Alsharif, U.; et al. The global burden of injury: Incidence, mortality, disability-adjusted life years and time trends from the Global Burden of Disease study 2013. Inj. Prev. 2016, 22, 3–18. [Google Scholar] [CrossRef]
- March, L.; Smith, E.U.; Hoy, D.G.; Cross, M.J.; Sanchez-Riera, L.; Blyth, F.; Buchbinder, R.; Vos, T.; Woolf, A.D. Burden of disability due to musculoskeletal (MSK) disorders. Best Pract. Res. Clin. Rheumatol. 2014, 28, 353–366. [Google Scholar] [CrossRef]
- Hoy, D.; March, L.; Brooks, P.; Blyth, F.; Woolf, A.; Bain, C.; Williams, G.; Smith, E.; Vos, T.; Barendregt, J.; et al. The global burden of low back pain: Estimates from the Global Burden of Disease 2010 study. Ann. Rheum. Dis. 2014, 73, 968–974. [Google Scholar] [CrossRef]
- Whiteford, H.A.; Ferrari, A.J.; Degenhardt, L.; Feigin, V.; Vos, T. Global burden of disease attributable to mental and substance use disorders: Findings from the Global Burden of Disease Study 2010. PLoS ONE 2015, 10, e0116820. [Google Scholar] [CrossRef]
- GBD 2015 Neurological Disorders Collaborator Group. Global, regional, and national burden of neurological disorders during 1990–2015: A systematic analysis for the Global Burden of Disease Study 2015. Lancet Neurol. 2017, 16, 877–897. [Google Scholar] [CrossRef]
- Global Burden of Diseases, Injuries and Risk Factors Study 2013 and Stroke Experts Writing Group. Global burden of stroke and risk factors in 188 countries, during 1990–2013: A systematic analysis for the Global Burden of Disease Study 2013. Lancet Neurol. 2016, 15, 913–924. [Google Scholar] [CrossRef]
- Roth, G.A.; Johnson, C.; Abajobir, A.; Abd-Allah, F.; Abera, S.F.; Abyu, G.; Ahmed, M.; Aksut, B.; Alam, T.; Alam, K.; et al. Global, Regional, and National Burden of Cardiovascular Diseases for 10 Causes, 1990 to 2015. J. Am. Coll. Cardiol. 2017, 70, 1–25. [Google Scholar] [CrossRef] [PubMed]
- GBD 2015 Chronic Respiratory Disease Collaborators. Global, regional, and national deaths, prevalence, disability-adjusted life years, and years lived with disability for chronic obstructive pulmonary disease and asthma, 1990–2015: A systematic analysis for the Global Burden of Disease Study 2015. Lancet Respir. Med. 2017, 5, 691–706. [Google Scholar] [CrossRef]
- Global Burden of Disease Cancer Collaboration. Global, Regional, and National Cancer Incidence, Mortality, Years of Life Lost, Years Lived with Disability, and Disability-Adjusted Life-years for 32 Cancer Groups, 1990 to 2015: A Systematic Analysis for the Global Burden of Disease Study. JAMA Oncol. 2017, 3, 524–548. [Google Scholar] [CrossRef] [PubMed]
- GBD 2015 HIV Collaborators. Estimates of global, regional, and national incidence, prevalence, and mortality of HIV, 1980–2015: The Global Burden of Disease Study 2015. Lancet HIV 2016, 3, e361–e387. [Google Scholar] [CrossRef]
- Jesus, T.S.; Koh, G.; Landry, M.; Ong, P.; Green, P.; Lopes, A.; Hoenig, H. Finding the “Right-Size” Physical Therapy Workforce: International Perspective Across 4 Countries. Phys. Ther. 2016, 96, 1597–1609. [Google Scholar] [CrossRef] [PubMed]
- Jesus, T.S. Systematic Reviews and Clinical Trials in rehabilitation: Comprehensive analyses of publication trends. Arch. Phys. Med. Rehabil. 2016, 97, 1853–1862.e2. [Google Scholar] [CrossRef] [PubMed]
- Kamper, S.J.; Moseley, A.M.; Herbert, R.D.; Maher, C.G.; Elkins, M.R.; Sherrington, C. 15 years of tracking physiotherapy evidence on PEDro, where are we now? Br. J. Sports Med. 2015, 49, 907–909. [Google Scholar] [CrossRef]
- Yamato, T.P.; Arora, M.; Stevens, M.L.; Elkins, M.R.; Moseley, A.M. Quality, language, subdiscipline and promotion were associated with article accesses on Physiotherapy Evidence Database (PEDro). Physiotherapy 2018, 104, 122–128. [Google Scholar] [CrossRef]
- Meyer, T.; Gutenbrunner, C.; Bickenbach, J.; Cieza, A.; Melvin, J.; Stucki, G. Towards a conceptual description of rehabilitation as a health strategy. J. Rehabil. Med. 2011, 43, 765–769. [Google Scholar] [CrossRef]
- Krug, E.; Cieza, A. Strengthening health systems to provide rehabilitation services. Bull. World Health Organ. 2017, 95, 167. [Google Scholar] [CrossRef]
- Jesus, T.S.; Bright, F.; Kayes, N.; Cott, C.A. Person-centred rehabilitation: What exactly does it mean? Protocol for a scoping review with thematic analysis towards framing the concept and practice of person-centred rehabilitation. BMJ Open 2016, 6, e011959. [Google Scholar] [CrossRef]
- Jesus, T.S.; Landry, M.D.; Dussault, G.; Fronteira, I. Human Resources for Health (and Rehabilitation): Six Rehab-Workforce Challenges for the Century. Hum. Resour. Health 2017, 15, 8. [Google Scholar] [CrossRef]
- NIH Medical Rehabilitation Coordinating Committee. National Institutes of Health Research Plan on Rehabilitation: NIH Medical Rehabilitation Coordinating Committee. Phys. Ther. 2017, 97, 104–407. [Google Scholar]
- Gutenbrunner, C.; Meyer, T.; Melvin, J.; Stucki, G. Towards a conceptual description of Physical and Rehabilitation Medicine. J. Rehabil. Med. 2011, 43, 760–764. [Google Scholar] [CrossRef]
- Downey, R.; Rapport, M.J. Motor activity in children with autism: A review of current literature. Pediatr. Phys. Ther. 2012, 24, 2–20. [Google Scholar] [CrossRef]
- Bhat, A.N.; Landa, R.J.; Galloway, J.C. Current perspectives on motor functioning in infants, children, and adults with autism spectrum disorders. Phys. Ther. 2011, 91, 1116–1129. [Google Scholar] [CrossRef]
- Srinivasan, S.M.; Pescatello, L.S.; Bhat, A.N. Current perspectives on physical activity and exercise recommendations for children and adolescents with autism spectrum disorders. Phys. Ther. 2014, 94, 875–889. [Google Scholar] [CrossRef]
- Lim, Y.H.; Partridge, K.; Girdler, S.; Morris, S.L. Standing Postural Control in Individuals with Autism Spectrum Disorder: Systematic Review and Meta-analysis. J. Autism Dev. Disord. 2017, 47, 2238–2253. [Google Scholar] [CrossRef]
- Weitlauf, A.S.; Sathe, N.; McPheeters, M.L.; Warren, Z.E. Interventions Targeting Sensory Challenges in Autism Spectrum Disorder: A Systematic Review. Pediatrics 2017, 139, e20170347. [Google Scholar] [CrossRef]
- Watling, R.; Hauer, S. Effectiveness of Ayres Sensory Integration® and Sensory-Based Interventions for People with Autism Spectrum Disorder: A Systematic Review. Am. J. Occup. Ther. 2015, 69, 6905180030p1–6905180030p12. [Google Scholar] [CrossRef]
- Kindregan, D.; Gallagher, L.; Gormley, J. Gait deviations in children with autism spectrum disorders: A review. Autism Res. Treat. 2015, 2015, 741480. [Google Scholar] [CrossRef]
- Sibilitz, K.L.; Berg, S.K.; Tang, L.H.; Risom, S.S.; Gluud, C.; Lindschou, J.; Kober, L.; Hassager, C.; Taylor, R.S.; Zwisler, A.D. Exercise-based cardiac rehabilitation for adults after heart valve surgery. Cochrane Database Syst. Rev. 2016, 3, CD010876. [Google Scholar] [CrossRef]
- Risom, S.S.; Zwisler, A.D.; Johansen, P.P.; Sibilitz, K.L.; Lindschou, J.; Gluud, C.; Taylor, R.; Svendsen, J.H.; Berg, S.K. Exercise-based cardiac rehabilitation for adults with atrial fibrillation. Cochrane Database Syst. Rev. 2017, 2, CD01119. [Google Scholar] [CrossRef]
- Taylor, R.S.; Sagar, V.A.; Davies, E.J.; Briscoe, S.; Coats, A.J.; Dalal, H.; Lough, F.; Rees, K.; Singh, S. Exercise-based rehabilitation for heart failure. Cochrane Database Syst. Rev. 2014, 4, CD003331. [Google Scholar] [CrossRef]
- Anderson, L.; Nguyen, T.T.; Dall, C.H.; Burgess, L.; Bridges, C.; Taylor, R.S. Exercise-based cardiac rehabilitation in heart transplant recipients. Cochrane Database Syst. Rev. 2017, 4, CD012264. [Google Scholar] [CrossRef]
- Anderson, L.; Taylor, R.S. Cardiac rehabilitation for people with heart disease: An overview of Cochrane systematic reviews. Cochrane Database Syst. Rev. 2014, 12, CD011273. [Google Scholar]
- Anderson, L.; Thompson, D.R.; Oldridge, N.; Zwisler, A.D.; Rees, K.; Martin, N.; Taylor, R.S. Exercise-based cardiac rehabilitation for coronary heart disease. Cochrane Database Syst. Rev. 2016, 1, CD00180. [Google Scholar]
- Price, K.J.; Gordon, B.A.; Bird, S.R.; Benson, A.C. A review of guidelines for cardiac rehabilitation exercise programmes: Is there an international consensus? Eur. J. Prev. Cardiol. 2016, 23, 1715–1733. [Google Scholar] [CrossRef]
- Xia, T.L.; Huang, F.Y.; Peng, Y.; Huang, B.T.; Pu, X.B.; Yang, Y.; Chai, H.; Chen, M. Efficacy of Different Types of Exercise-Based Cardiac Rehabilitation on Coronary Heart Disease: A Network Meta-analysis. J. Gen. Intern. Med. 2018, 33, 2201–2209. [Google Scholar] [CrossRef]
- Shields, G.E.; Wells, A.; Doherty, P.; Heagerty, A.; Buck, D.; Davies, L.M. Cost-effectiveness of cardiac rehabilitation: A systematic review. Heart 2018, 104, 1403–1410. [Google Scholar] [CrossRef]
- Puhan, M.A.; Gimeno-Santos, E.; Cates, C.J.; Troosters, T. Pulmonary rehabilitation following exacerbations of chronic obstructive pulmonary disease. Cochrane Database Syst. Rev. 2016, 12, CD005305. [Google Scholar] [CrossRef]
- McCarthy, B.; Casey, D.; Devane, D.; Murphy, K.; Murphy, E.; Lacasse, Y. Pulmonary rehabilitation for chronic obstructive pulmonary disease. Cochrane Database Syst. Rev. 2015, 2, CD003793. [Google Scholar] [CrossRef]
- Dale, M.T.; McKeough, Z.J.; Troosters, T.; Bye, P.; Alison, J.A. Exercise training to improve exercise capacity and quality of life in people with non-malignant dust-related respiratory diseases. Cochrane Database Syst. Rev. 2015, 11, CD009385. [Google Scholar] [CrossRef]
- Dowman, L.; Hill, C.J.; Holland, A.E. Pulmonary rehabilitation for interstitial lung disease. Cochrane Database Syst. Rev. 2014, 10, CD006322. [Google Scholar] [CrossRef]
- Olusanya, B.O.; Kaplan, M.; Hansen, T.W.R. Neonatal hyperbilirubinaemia: A global perspective. Lancet Child Adolesc. Health 2018, 2, 610–620. [Google Scholar] [CrossRef]
- Rao, A.K.; Chou, A.; Bursley, B.; Smulofsky, J.; Jezequel, J. Systematic review of the effects of exercise on activities of daily living in people with Alzheimer’s disease. Am. J. Occup. Ther. 2014, 68, 50–56. [Google Scholar] [CrossRef]
- Smallfield, S.; Heckenlaible, C. Effectiveness of Occupational Therapy Interventions to Enhance Occupational Performance for Adults with Alzheimer’s Disease and Related Major Neurocognitive Disorders: A Systematic Review. Am. J. Occup. Ther. 2017, 71, 7105180010p1–7105180010p9. [Google Scholar] [CrossRef]
- Du, Z.; Li, Y.; Li, J.; Zhou, C.; Li, F.; Yang, X. Physical activity can improve cognition in patients with Alzheimer’s disease: A systematic review and meta-analysis of randomized controlled trials. Clin. Interv. Aging 2018, 13, 1593–1603. [Google Scholar] [CrossRef]
- Phillips, C.; Baktir, M.A.; Das, D.; Lin, B.; Salehi, A. The Link Between Physical Activity and Cognitive Dysfunction in Alzheimer Disease. Phys. Ther. 2015, 95, 1046–1060. [Google Scholar] [CrossRef]
- Forbes, D.; Forbes, S.C.; Blake, C.M.; Thiessen, E.J.; Forbes, S. Exercise programs for people with dementia. Cochrane Database Syst. Rev. 2015, 15, CD006489. [Google Scholar] [CrossRef]
- Fritz, N.E.; Rao, A.K.; Kegelmeyer, D.; Kloos, A.; Busse, M.; Hartel, L.; Carrier, J.; Quinn, L. Physical Therapy and Exercise Interventions in Huntington’s Disease: A Mixed Methods Systematic Review. J. Huntingt. Dis. 2017, 6, 217–235. [Google Scholar] [CrossRef]
- Van Aswegen, H.; Roos, R. Physical impairments and activity limitations experienced by people with tuberculosis: A scoping review protocol. JBI Database Syst. Rev. Implement. Rep. 2015, 15, 49–54. [Google Scholar] [CrossRef]
- Bangirana, P.; Idro, R.; John, C.C.; Boivin, M.J. Rehabilitation for cognitive impairments after cerebral malaria in African children: Strategies and limitations. Trop. Med. Int. Health 2006, 11, 1341–1349. [Google Scholar] [CrossRef]
- Kakooza-Mwesige, A.; Andrews, C.; Peterson, S.; Wabwire Mangen, F.; Eliasson, A.C.; Forssberg, H. Prevalence of cerebral palsy in Uganda: A population-based study. Lancet Glob. Health 2017, 5, e1275–e1282. [Google Scholar] [CrossRef]
- Landry, M.D.; Raman, S.R.; Kennedy, K.; Bettger, J.P.; Magnusson, D. Zika Virus (ZIKV), Global Public Health, Disability, and Rehabilitation: Connecting the Dots. Phys. Ther. 2017, 97, 275–279. [Google Scholar]
- Wim Brandsma, J. Rehabilitation of leprosy-affected people: An overview. Clin. Dermatol. 2016, 34, 66–69. [Google Scholar] [CrossRef]
- Van Brakel, W.; Cross, H.; Declercq, E.; Deepak, S.; Lockwood, D.; Saunderson, P.; Smith, W.C.; Batty, J.; Nahodilova, L.; Soutar, D.; et al. Review of leprosy research evidence (2002–2009) and implications for current policy and Practice–ILEP Technical Commission. Lepr. Rev. 2010, 81, 228–275. [Google Scholar]
- Farina, E.; Raglio, A.; Giovagnoli, A.R. Cognitive rehabilitation in epilepsy: An evidence-based review. Epilepsy Res. 2015, 109, 210–218. [Google Scholar] [CrossRef]
- Barr, W. Cognitive Rehabilitation for Epilepsy: What Do We Really Know? Epilepsy Curr. 2016, 16, 87–88. [Google Scholar] [CrossRef]
- Luedtke, K.; Allers, A.; Schulte, L.H.; May, A. Efficacy of interventions used by physiotherapists for patients with headache and migraine-systematic review and meta-analysis. Cephalalgia 2016, 36, 474–492. [Google Scholar] [CrossRef]
- Fernández-de-Las-Peñas, C.; Cuadrado, M.L. Physical therapy for headaches. Cephalalgia 2016, 36, 1134–1142. [Google Scholar] [CrossRef]
- Espí-López, G.V.; Arnal-Gómez, A.; Arbós-Berenguer, T.; González, Á.A.; Vicente-Herrero, T. Effectiveness of Physical Therapy in Patients with Tension-type Headache: Literature Review. J. Jpn. Phys. Ther. Assoc. 2014, 17, 31–38. [Google Scholar] [CrossRef]
- Hahn-Markowitz, J.; Berger, I.; Manor, I.; Maeir, A. Impact of the Cognitive-Functional (Cog-Fun) Intervention on Executive Functions and Participation Among Children with Attention Deficit Hyperactivity Disorder: A Randomized Controlled Trial. Am. J. Occup. Ther. 2017, 71, 7105220010p1–7105220010p9. [Google Scholar] [CrossRef]
- Cooney, G.M.; Dwan, K.; Greig, C.A.; Lawlor, D.A.; Rimer, J.; Waugh, F.R.; McMurdo, M.; Mead, G.E. Exercise for depression. Cochrane Database Syst. Rev. 2013, 9, CD004366. [Google Scholar]
- Schuch, F.B.; Vancampfort, D.; Richards, J.; Rosenbaum, S.; Ward, P.B.; Stubbs, B. Exercise as a treatment for depression: A meta-analysis adjusting for publication bias. J. Psychiatr. Res. 2016, 77, 42–51. [Google Scholar] [CrossRef]
- Morin, M.; Carroll, M.S.; Bergeron, S. Systematic Review of the Effectiveness of Physical Therapy Modalities in Women with Provoked Vestibulodynia. Sex. Med. Rev. 2017, 5, 295–322. [Google Scholar] [CrossRef]
- Dumoulin, C.; Cacciari, L.P.; Hay-Smith, E.J.C. Pelvic floor muscle training versus no treatment, or inactive control treatments, for urinary incontinence in women. Cochrane Database Syst. Rev. 2018, 10, CD005654. [Google Scholar] [CrossRef]
- Ayeleke, R.O.; Hay-Smith, E.J.; Omar, M.I. Pelvic floor muscle training added to another active treatment versus the same active treatment alone for urinary incontinence in women. Cochrane Database Syst. Rev. 2015, 11, CD010551. [Google Scholar] [CrossRef]
- Zhang, F.W.; Wei, F.; Wang, H.L.; Pan, Y.Q.; Zhen, J.Y.; Zhang, J.X.; Yang, K.H. Does pelvic floor muscle training augment the effect of surgery in women with pelvic organ prolapse? A systematic review of randomized controlled trials. Neurourol. Urodyn. 2016, 35, 666–674. [Google Scholar] [CrossRef]
- Fuentes-Márquez, P.; Cabrera-Martos, I.; Valenza, M.C. Physiotherapy interventions for patients with chronic pelvic pain: A systematic review of the literature. Physiother. Theory Pract. 2018. [Google Scholar] [CrossRef]
- Klotz, S.G.; Schön, M.; Ketels, G.; Löwe, B.; Brünahl, C.A. Physiotherapy management of patients with chronic pelvic pain (CPP): A systematic review. Physiother. Theory Pract. 2018. [Google Scholar] [CrossRef]
- Redman, K.; Ruffman, T.; Fitzgerald, P.; Skeaff, S. Iodine Deficiency and the Brain: Effects and Mechanisms. Crit. Rev. Food Sci. Nutr. 2016, 56, 2695–2713. [Google Scholar] [CrossRef]
- Niwattisaiwong, S.; Burman, K.D.; Li-Ng, M. Iodine deficiency: Clinical implications. Cleve Clin. J. Med. 2017, 84, 236–244. [Google Scholar] [CrossRef]
- Kortebein, P. Rehabilitation for hospital-associated deconditioning. Am. J. Phys. Med. Rehabil. 2009, 88, 66–77. [Google Scholar] [CrossRef]
- Galloza, J.; Castillo, B.; Micheo, W. Benefits of Exercise in the Older Population. Phys. Med. Rehabil. Clin. N. Am. 2017, 28, 659–669. [Google Scholar] [CrossRef]
- Burstein, R.; Fleming, T.; Haagsma, J.; Salomon, J.A.; Vos, T.; Murray, C.J.L. Estimating distributions of health state severity for the Global Burden of Disease study. Popul. Health Metr. 2015, 13, 31. [Google Scholar] [CrossRef]
- Salomon, J.A.; Haagsma, J.A.; Davis, A.; de Noordhout, C.M.; Polinder, S.; Havelaar, A.H.; Cassini, A.; Devleesschauwer, B.; Kretzschmar, M.; Speybroeck, N.; et al. Disability weights for the Global Burden of Disease 2013. Lancet Glob. Health 2015, 3, e712–e723. [Google Scholar] [CrossRef]
- United Nations. World Population Prospects: Key Findings & Advance Tables; UN: New York, NY, USA, 2017; Available online: https://esa.un.org/unpd/wpp/Publications/Files/WPP2017_KeyFindings.pdf (accessed on 11 February 2018).
- Kamenov, K.; Mills, J.A.; Chatterji, S.; Cieza, A. Needs and unmet needs for rehabilitation services: A scoping review. Disabil. Rehabil. 2018, in press. [Google Scholar] [CrossRef]
- Bright, T.; Wallace, S.; Kuper, H. A Systematic Review of Access to Rehabilitation for People with Disabilities in Low- and Middle-Income Countries. Int. J. Environ. Res. Public Health 2018, 5, 2165. [Google Scholar] [CrossRef]
- World Health Organization. Rehabilitation 2030: A Call for Action. Meeting Report; WHO: Geneva, Switzerland, 2017; Available online: http://www.who.int/disabilities/care/rehab-2030/en/ (accessed on 21 March 2018).
- Magnusson, D.; Sweeney, F.; Landry, M. Provision of rehabilitation services for children with disabilities living in low- and middle-income countries: A scoping review. Disabil. Rehabil. 2017, in press. [Google Scholar] [CrossRef]
- Kuper, H.; Hanefeld, J. Debate: Can we achieve universal health coverage without a focus on disability? BMC Health Serv. Res. 2018, 18, 738. [Google Scholar] [CrossRef]
- Fehling, M.; Nelson, B.D.; Venkatapuram, S. Limitations of the Millennium Development Goals: A literature review. Glob. Public Health 2013, 8, 1109–1122. [Google Scholar] [CrossRef]
- Participant Working Group of the Dar es Salaam Seventh International Conference on Birth Defects and Disabil. Prevention of Congenital Disorders and Care of Affected Children: A Consensus Statement. JAMA Pediatr. 2016, 170, 790–793. [Google Scholar] [CrossRef]
- Bright, T.; Felix, L.; Kuper, H.; Polack, S. Systematic review of strategies to increase access to health services among children over five in low- and middle-income countries. Trop. Med. Int. Health 2018, 23, 476–507. [Google Scholar] [CrossRef]
- Nixon, S.; Cameron, C.; Mweshi, M.; Nkandu, E.M.; Okidi, C.; Tattle, S.; Yates, T. “It Is an Eye-Opener That There Is a Relationship between Rehabilitation and HIV”: Perspectives of Physiotherapists and Occupational Therapists in Kenya and Zambia on the Role of Rehabilitation with Adults and Children Living with HIV. Physiother. Can. 2016, 68, 290–297. [Google Scholar] [CrossRef]
- Stevens, M.; Kirsh, B.; Nixon, S.A. Rehabilitation interventions for children living with HIV: A scoping review. Disabil. Rehabil. 2014, 36, 865–874. [Google Scholar] [CrossRef] [PubMed]
- Martins, S.C.; Pontes-Neto, O.M.; Alves, C.V.; de Freitas, G.R.; Filho, J.O.; Tosta, E.D.; Cabral, N.L. Past, present, and future of stroke in middle-income countries: The Brazilian experience. Int. J. Stroke 2013, 8 (Suppl. A), 106–111. [Google Scholar] [CrossRef]
- Yan, L.L.; Li, C.; Chen, J.; Miranda, J.J.; Luo, R.; Bettger, J.; Zhu, Y.; Feigin, V.; O’Donnell, M.; Zhao, D.; et al. Prevention, management, and rehabilitation of stroke in low- and middle-income countries. eNeurologicalSci 2016, 2, 21–30. [Google Scholar] [CrossRef]
- Furlan, A.D.; Irvin, E.; Munhall, C.; Giraldo-Prieto, M.; Fullerton, L.; McMaster, R.; Danak, S.; Costante, A.; Pitzul, K.; Bhide, R.P.; et al. Rehabilitation service models for people with physical and/or mental disability living in low- and middle-income countries: A systematic review. J. Rehabil. Med. 2018, 50, 487–498. [Google Scholar] [CrossRef]
- Sureshkumar, K.; Murthy, G.V.S.; Kuper, H. Protocol for a randomised controlled trial to evaluate the effectiveness of the ‘Care for Stroke’ intervention in India: A smartphone-enabled, carer-supported, educational intervention for management of disabilities following stroke. BMJ Open 2018, 8, e020098. [Google Scholar] [CrossRef] [PubMed]
- Rawstorn, J.C.; Gant, N.; Direito, A.; Beckmann, C.; Maddison, R. Telehealth exercise-based cardiac rehabilitation: A systematic review and meta-analysis. Heart 2016, 102, 1183–1192. [Google Scholar] [CrossRef] [PubMed]
- Hossain, M.S.; Harvey, L.A.; Rahman, M.A.; Bowden, J.L.; Islam, M.S.; Taylor, V.; Muldoon, S.; Herbert, R.D. A pilot randomised trial of community-based care following discharge from hospital with a recent spinal cord injury in Bangladesh. Clin. Rehabil. 2017, 31, 781–789. [Google Scholar] [CrossRef] [PubMed]
- ATTEND Collaborative Group. Family-led rehabilitation after stroke in India (ATTEND): A randomised controlled trial. Lancet 2017, 390, 588–599. [Google Scholar] [CrossRef]
- GBD 2017 DALYs and HALE Collaborators. Global, regional, and national disability-adjusted life-years (DALYs) for 359 diseases and injuries and healthy life expectancy (HALE) for 195 countries and territories, 1990–2017: A systematic analysis for the Global Burden of Disease Study 2017. Lancet 2018, 392, 1859–1922. [Google Scholar] [CrossRef]
- Mills, T.; Marks, E.; Reynolds, T.; Cieza, A. Rehabilitation: Essential along the Continuum of Care. In Disease Control Priorities: Improving Health and Reducing Poverty, 3rd ed.; Gelband, H., Horton, S., Jha, P., Laxminarayan, R., Mock, C.N., Nugent, R., Eds.; The International Bank for Reconstruction and Development; The World Bank: Washington, DC, USA, 2017. [Google Scholar]
- United Nations. Disability-Inclusive Sustainable Development Goals. Available online: http://www.un.org/disabilities/documents/sdgs/disability_inclusive_sdgs.pdf (accessed on 20 July 2018).
- Tebbutt, E.; Brodmann, R.; Borg, J.; MacLachlan, M.; Khasnabis, C.; Horvath, R. Assistive products and the Sustainable Development Goals (SDGs). Glob. Health 2016, 12, 79. [Google Scholar] [CrossRef]
- Howard-Wilsher, S.; Irvine, L.; Fan, H.; Shakespeare, T.; Suhrcke, M.; Horton, S.; Poland, F.; Hooper, L.; Song, F. Systematic overview of economic evaluations of health-related rehabilitation. Disabil. Health J. 2016, 9, 11–25. [Google Scholar] [CrossRef]
- Lima de Melo Ghisi, G.; Pesah, E.; Turk-Adawi, K.; Supervia, M.; Lopez Jimenez, F.; Grace, S.L. Cardiac Rehabilitation Models around the Globe. J. Clin. Med. 2018, 7, 260. [Google Scholar] [CrossRef]
- Pesah, E.; Supervia, M.; Turk-Adawi, K.; Grace, S.L. A Review of Cardiac Rehabilitation Delivery Around the World. Prog. Cardiovasc. Dis. 2017, 60, 267–280. [Google Scholar] [CrossRef]
- Turk-Adawi, K.; Sarrafzadegan, N.; Grace, S.L. Global availability of cardiac rehabilitation. Nat. Rev. Cardiol. 2014, 10, 586–596. [Google Scholar] [CrossRef]
- Grace, S.L.; Turk-Adawi, K.I.; Contractor, A.; Atrey, A.; Campbell, N.; Derman, W.; Melo Ghisi, G.L.; Oldridge, N.; Sarkar, B.K.; Yeo, T.J.; et al. Cardiac rehabilitation delivery model for low-resource settings. Heart 2016, 102, 1449–1455. [Google Scholar] [CrossRef]
- McPherson, A.; Durham, J.; Richards, N.; Gouda, H.; Rampatige, R.; Whittaker, M. Strengthening health information systems for disability-related rehabilitation in LMICs. Health Policy Plan. 2017, 32, 384–394. [Google Scholar] [CrossRef]
- Trani, J.F.; Babulal, G.M.; Bakhshi, P. Development and Validation of the 34-Item Disability Screening Questionnaire (DSQ-34) for Use in Low and Middle Income Countries Epidemiological and Development Surveys. PLoS ONE 2015, 10, e0143610. [Google Scholar] [CrossRef]
- Oberhauser, C.; Chatterji, S.; Sabariego, C.; Cieza, A. Development of a metric for tracking and comparing population health based on the minimal generic set of domains of functioning and health. Popul. Health Metr. 2016, 14, 19. [Google Scholar] [CrossRef]
- Higashi, H.; Barendregt, J.J.; Kassebaum, N.J.; Weiser, T.G.; Bickler, S.W.; Vos, T. Burden of injuries avertable by a basic surgical package in low- and middle-income regions: A systematic analysis from the Global Burden of Disease 2010 Study. World J. Surg. 2015, 39, 1–9. [Google Scholar] [CrossRef]
- Bickler, S.; Higashi, H.; Kassebaum, N.; Weiser, D.; Chang, D.; Barendregt, J.; Noormahomed, E.; Vos, T. Global Burden of Surgical Conditions. In Essential Surgery: Disease Control Priorities, 3rd ed.; Debas, H.T., Ed.; The International Bank for Reconstruction and Development; The World Bank: Washington, DC, USA, 2015; Volume 1. [Google Scholar]
- Rose, J.; Weiser, T.G.; Hider, P.; Wilson, L.; Gruen, R.L.; Bickler, S.W. Estimated need for surgery worldwide based on prevalence of diseases: A modelling strategy for the WHO Global Health Estimate. Lancet Glob. Health 2015, 3 (Suppl. 2), S13–S20. [Google Scholar] [CrossRef]
- Marcenes, W.; Kassebaum, N.J.; Bernabé, E.; Flaxman, A.; Naghavi, M.; Lopez, A.; Murray, C.J. Global burden of oral conditions in 1990–2010: A systematic analysis. J. Dent. Res. 2013, 92, 592–597. [Google Scholar] [CrossRef]


| Causes |
|---|
| Communicable, Maternal, Neonatal or Nutritional: |
| • HIV/AIDs |
| • Leprosy; Zika |
| • Meningitis, Encephalitis; Tetanus |
| • Neonatal Disorders |
| Non-Communicable |
| • Neoplasms |
| • Cardiovascular Diseases (includes Stroke) |
| • Chronic Respiratory Diseases |
| • Neurological disorders, except Epilepsy and Migraine (tension-type headaches included) |
| • Autism Spectrum Disorder |
| • Musculoskeletal conditions (includes Low back Pain and Neck Pain) |
| • Congenital Birth Defects, except Urogenital and Digestive |
| Injuries (nature of the) |
| • Amputations |
| • Burns |
| • Fractures, except skull |
| • Head Injuries |
| • Spinal Injuries |
| • Minor Injuries: muscle and tendon injuries, including sprains and strains lesser dislocations; Open wound(s) |
| • Dislocation of hip; Dislocation of knee; and Dislocation of shoulder |
| • Asphyxiation |
| • Crush injury; Nerve Injury; Severe Chest Injury |
| • Multiple fractures, dislocations, crashes, wounds, pains, and strains |
| Impairments (from the non-selected “causes” combined) |
| • Heart Failure |
| • Guillain-Barré Syndrome |
| Causes |
|---|
| Communicable, Maternal, Neonatal or Nutritional: |
| • Neonatal Disorders—only the Neonatal Encephalopathy due to Birth Asphyxia and Trauma |
| Non-communicable |
| • Stroke |
| • Neurological disorders, except Epilepsy, Dementia and Migraine |
| • Musculoskeletal conditions (includes Low back Pain and Neck Pain) |
| • Congenital Birth Defects—only Neuro Tube Defects + Congenital Musculoskeletal and Limb Anomalies |
| Injuries (nature of the) |
| • All of those in Table 1 |
| Location/Item | # 1990 | # 2017 | % Change (1990–2017) | Regression Model Type | r2 | b Coefficient | 95% CI | 99% CI |
|---|---|---|---|---|---|---|---|---|
| YLD Counts, Millions | ||||||||
| World | 206 | 343 | 66.2% | Linear | 0.99 | 5.10 * | 4.88–5.32 | 4.80–5.40 |
| High-Income | 58 | 79 | 37.4% | Linear | 0.99 | 0.81 * | 0.77–0.84 | 0.76–0.86 |
| Upper Middle-Income | 76 | 123 | 62.1% | Linear | 0.99 | 1.78 * | 1.69–1.87 | 1.66–1.90 |
| Lower Middle-Income | 62 | 119 | 90.4% | Linear | 0.99 | 2.10 * | 2.02–2.19 | 1.99-2.22 |
| Low-Income | 10 | 21 | 111.5% | Linear | 1 | 0.39 * | 0.38–0.40 | 0.38–0.41 |
| YLD Rates | ||||||||
| World | 3825 | 4488 | 17.3% | Linear | 0.96 | 25.7 * | 23.7–27.7 | 23.0–28.4 |
| High-Income | 5748 | 6643 | 15.6% | Linear | 0.98 | 33.1 * | 31.1–35.1 | 30.4–35.8 |
| Upper Middle-Income | 3594 | 4669 | 29.9% | Linear | 0.96 | 42.6 * | 39.3–46.0 | 38.1–47.2 |
| Lower Middle-Income | 3233 | 3806 | 17.7% | Linear | 0.96 | 21.6 * | 19.9–23.2 | 19.3–23.8 |
| Low-Income | 2977 | 3112 | 4.5% | Logarithmic | 0.50 | 2.5 ** | 0.40–4.55 | −0.33–5.28 |
| Age-Standardized YLD Rates | ||||||||
| World | 4377 | 4334 | −1.0% | Logarithmic | 0.22 | −0.62 | −2.13–0.89 | −2.66–1.42 |
| High-Income | 5007 | 4872 | −2.7% | Logarithmic | 0.86 | −5.36 * | −6.76–(−3.96) | −7.26–(−3.47) |
| Upper Middle-Income | 4106 | 4080 | −0.6% | Linear | 0.04 | 1.34 | −1.38–4.06 | −2.33–5.02 |
| Lower Middle-Income | 4262 | 4314 | 1.2% | Linear | 0.46 | 2.33 * | 1.26–3.40 | 0.89–3.78 |
| Low-Income | 4189 | 4276 | 2.1% | Logarithmic | 0.15 | 0.29 | −3.29–3.87 | −4.55–5.14 |
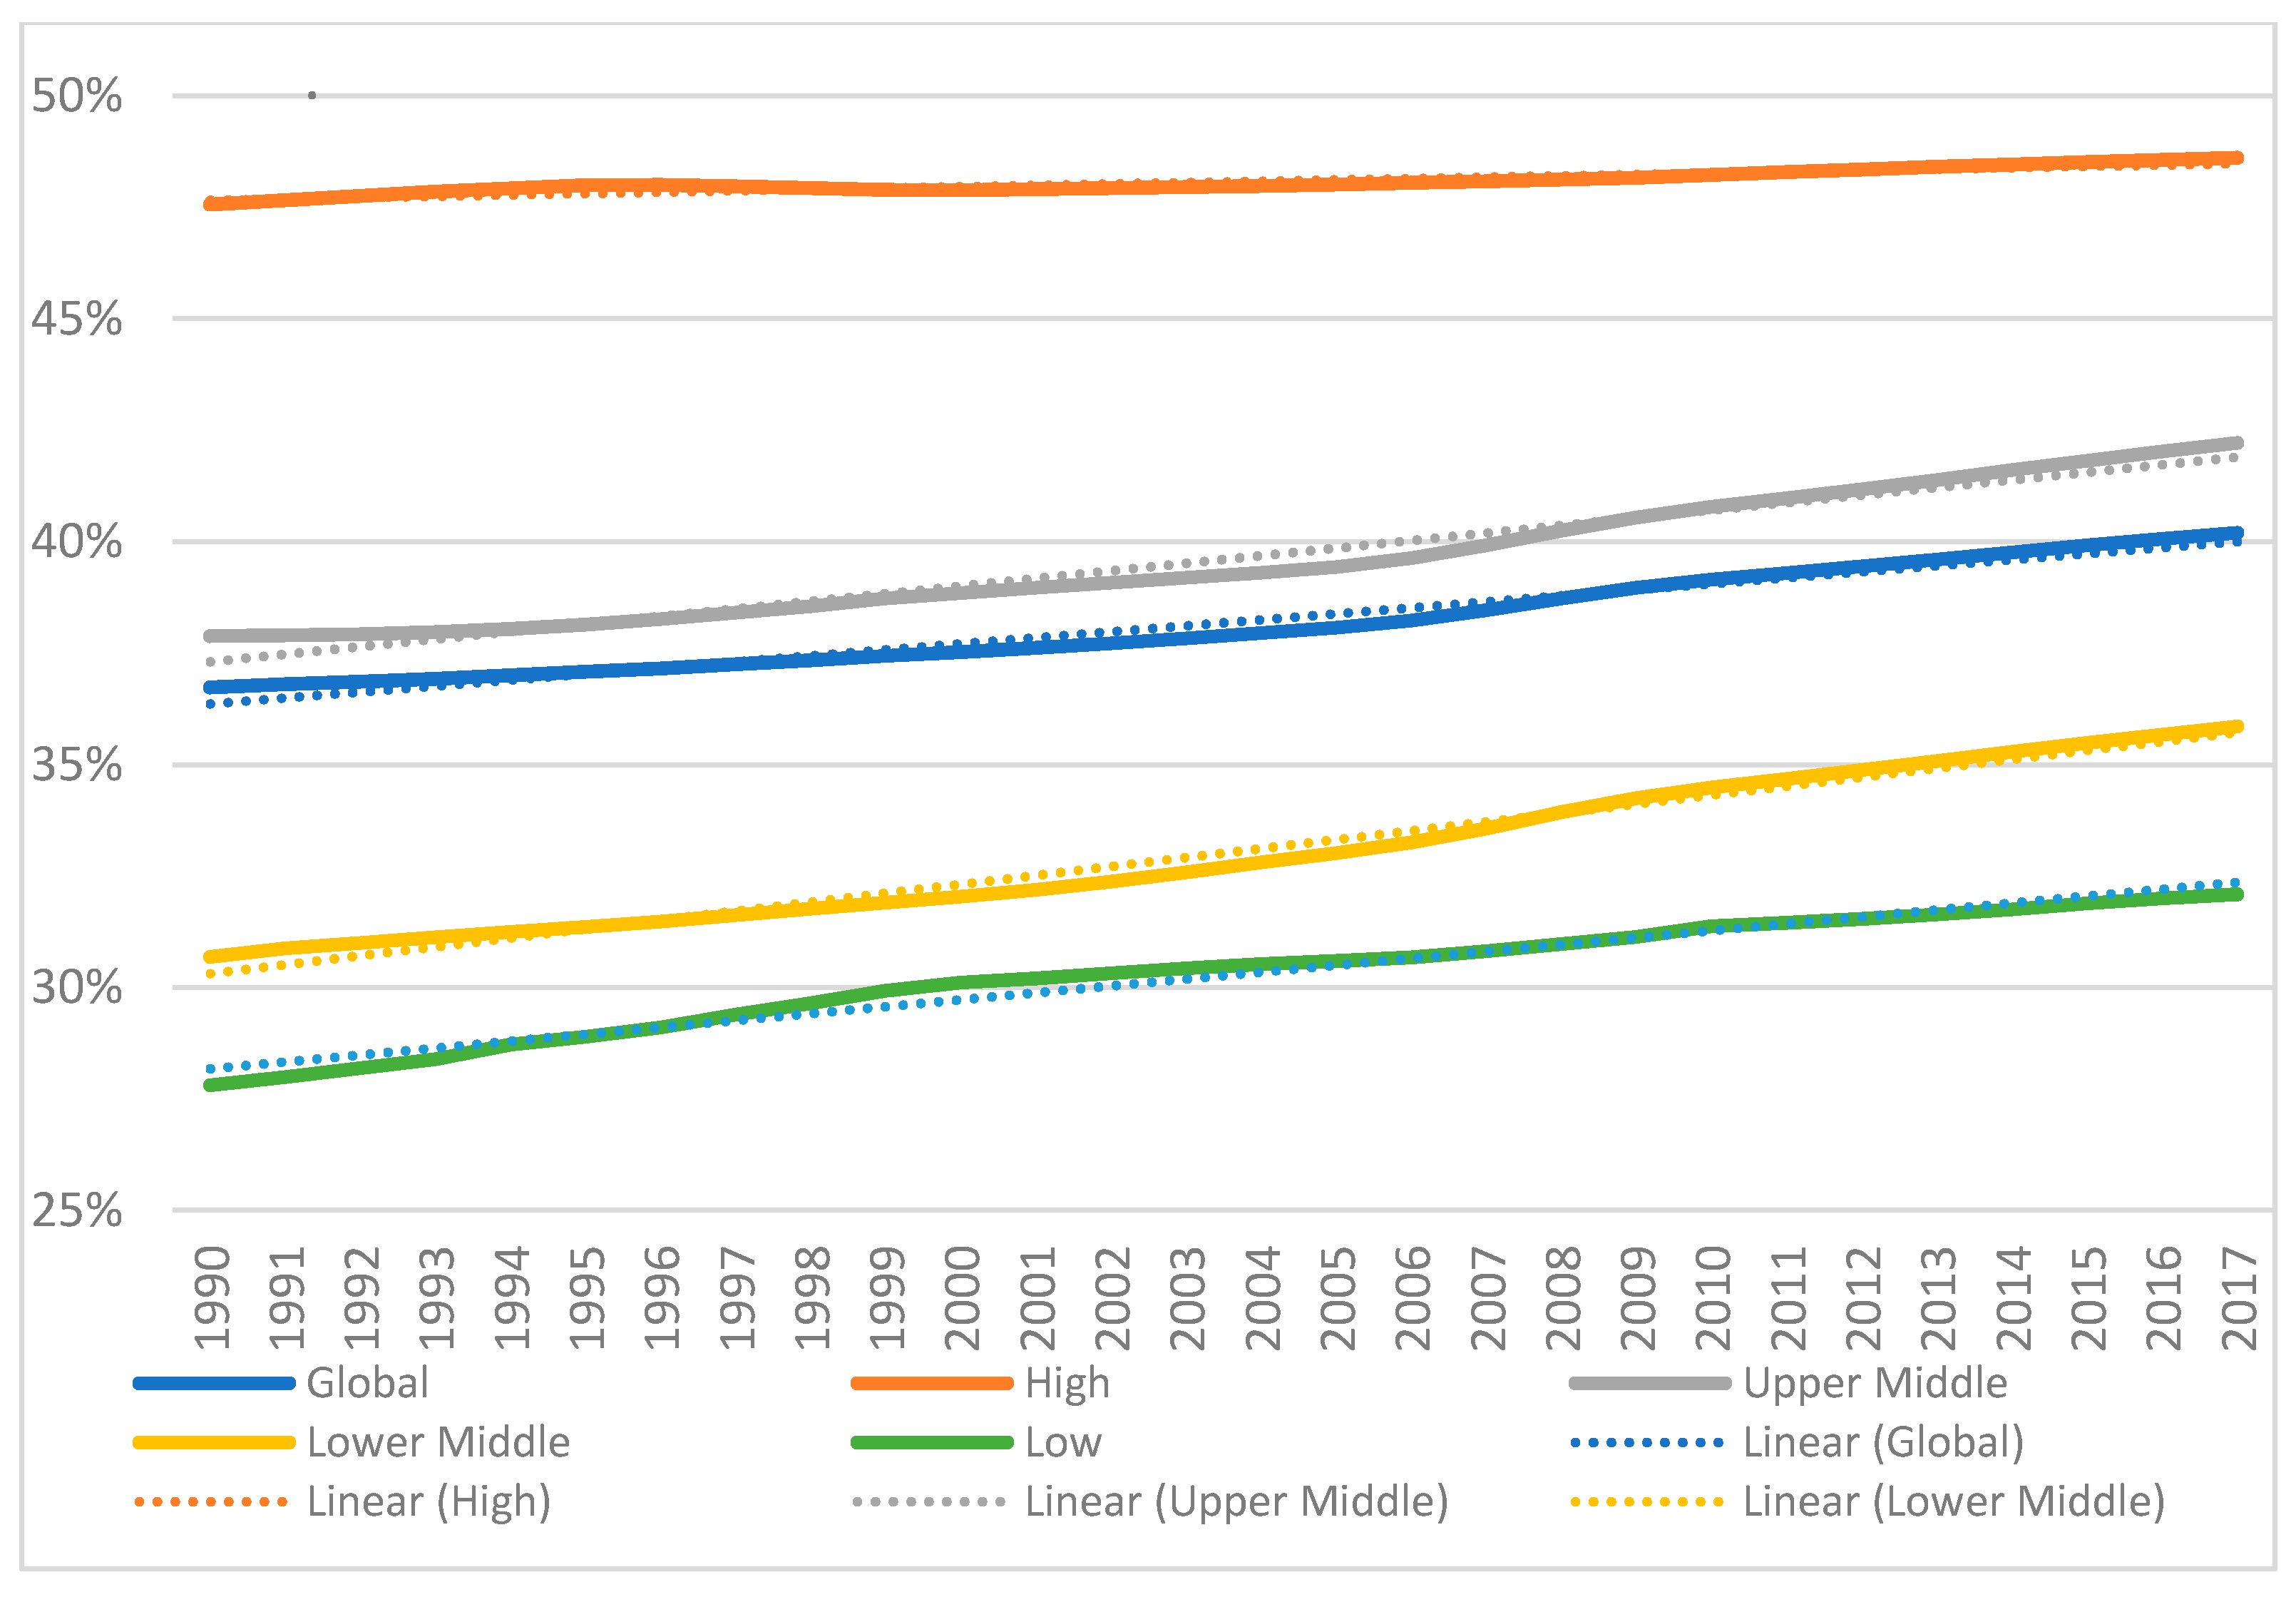
| % of YLDs Benefiting from Physical Rehabilitation (among Total YLDs) | ||||||||
| World | 36.7% | 40.2% | 9.5% | Linear | 0.97 | 0.135 * | 0.125–0.145 | 0.122–0.148 |
| High-Income | 47.6% | 48.6% | 2.2% | Linear | 0.87 | 0.030 * | 0.026–0.035 | 0.024–0.037 |
| Upper Middle-Income | 37.9% | 42.2% | 11.4% | Linear | 0.97 | 0.170 * | 0.157–0.183 | 0.153–0.187 |
| Lower Middle-Income | 30.7% | 35.9% | 16.8% | Linear | 0.98 | 0.200 * | 0.189–0.211 | 0.185–0.215 |
| Low-Income | 27.8% | 32.1% | 15.4% | Linear | 0.97 | 0.155 * | 0.145–0.165 | 0.141–0.169 |
| Location/Item | # 1990 | # 2017 | % Change (1990–2017) | Regression Type: Best Fit | r2 | b Coefficient | 95% CI | 99% CI |
|---|---|---|---|---|---|---|---|---|
| YLD Counts, Millions | ||||||||
| World | 135 | 225 | 66.6% | Linear | 0.99 | 3.32 * | 3.18–3.43 | 3.13–3.51 |
| High-Income | 40.3 | 54.7 | 35.6% | Linear | 0.99 | 0.52 * | 0.50–0.55 | 0.49–0.56 |
| Upper Middle-Income | 49.7 | 82.8 | 66.5% | Linear | 0.99 | 1.24 * | 1.19–1.29 | 1.17–1.31 |
| Lower Middle-Income | 38.8 | 73.9 | 90.6% | Linear | 0.99 | 1.30 * | 1.24–1.36 | 1.22–1.38 |
| Low-Income | 5.9 | 12.5 | 113.6% | Linear | 0.98 | 0.24 * | 0.23–0.25 | 0.22–0.26 |
| YLD Rates | ||||||||
| World | 2506 | 2942 | 17.4% | Linear | 0.96 | 16.6 * | 15.3–17.8 | 14.8–18.3 |
| High-Income | 4030 | 4597 | 14.1% | Linear | 0.97 | 19.7 * | 18.3–21.1 | 17.8–21.6 |
| Upper Middle-Income | 2356 | 3143 | 33.4% | Linear | 0.98 | 30.8 * | 28.9–32.6 | 28.3–33.2 |
| Lower Middle-Income | 2009 | 2367 | 17.8% | Linear | 0.98 | 13.2 * | 12.0–14.4 | 11.6–14.9 |
| Low-Income | 1776 | 1875 | 5.6% | Linear | 0.68 | 3.08 * | 2.22–3.94 | 1.92–4.24 |
| Age-Standardized YLD Rates | ||||||||
| World | 2863 | 2812 | −1.8% | Logarithmic | 0.61 | −1.64 * | −2.66–(−0.61) | −3.02–(−0.25) |
| High-Income | 3504 | 3397 | −3.1% | Logarithmic | 0.83 | −5.25 * | −6.48–(−4.02) | −6.92–(−3.59) |
| Upper Middle-Income | 2664 | 2677 | 0.5% | Linear | 0.18 | 1.72 ** | 0.23–3.22 | −0.30–3.75 |
| Lower Middle-Income | 2657 | 2665 | 0.3% | Linear | 0.03 | 0.38 | −0.44–1.20 | −0.72–1.48 |
| Low-Income | 2564 | 2656 | 3.6% | Linear | 0.82 | 3.33 * | 2.70–3.95 | 2.48–4.17 |
| % of YLDs Benefiting from Physical Rehabilitation (among Total YLDs) | ||||||||
| World | 24.1% | 26.4% | 9.5% | Linear | 0.97 | 0.085 * | 0.079–0.092 | 0.077–0.094 |
| High-Income | 33.3% | 33.6% | 0.9% | Linear | 0.12 | 0.005 | −0.011–0.0005 | −0.013–0.003 |
| Upper Middle-Income | 24.8% | 28.4% | 14.4% | Linear | 0.99 | 0.137 * | 0.131–0.143 | 0.129–0.145 |
| Lower Middle-Income | 19.1% | 22.3% | 16.8% | Linear | 0.97 | 0.122 * | 0.113–0.131 | 0.110–0.134 |
| Low-Income | 16.6% | 19.4% | 16.5% | Linear | 0.95 | 0.107 * | 0.097–0.117 | 0.093–0.120 |
© 2019 by the authors. Licensee MDPI, Basel, Switzerland. This article is an open access article distributed under the terms and conditions of the Creative Commons Attribution (CC BY) license (http://creativecommons.org/licenses/by/4.0/).
Share and Cite
Jesus, T.S.; Landry, M.D.; Hoenig, H. Global Need for Physical Rehabilitation: Systematic Analysis from the Global Burden of Disease Study 2017. Int. J. Environ. Res. Public Health 2019, 16, 980. https://doi.org/10.3390/ijerph16060980
Jesus TS, Landry MD, Hoenig H. Global Need for Physical Rehabilitation: Systematic Analysis from the Global Burden of Disease Study 2017. International Journal of Environmental Research and Public Health. 2019; 16(6):980. https://doi.org/10.3390/ijerph16060980
Chicago/Turabian StyleJesus, Tiago S., Michel D. Landry, and Helen Hoenig. 2019. "Global Need for Physical Rehabilitation: Systematic Analysis from the Global Burden of Disease Study 2017" International Journal of Environmental Research and Public Health 16, no. 6: 980. https://doi.org/10.3390/ijerph16060980
APA StyleJesus, T. S., Landry, M. D., & Hoenig, H. (2019). Global Need for Physical Rehabilitation: Systematic Analysis from the Global Burden of Disease Study 2017. International Journal of Environmental Research and Public Health, 16(6), 980. https://doi.org/10.3390/ijerph16060980