1. Introduction
Water, sanitation, and hygiene (WASH) are fundamental for human health and quality of life on both the individual and societal levels. However, globally 663 million people, predominantly in the global south, still lack adequate access to reliable water supplies [
1]. In 2015, the United Nations (UN) published the 17 Sustainable Development Goals (SDGs) for 2030 as a more people-centered, expanded version of its Millennium Development Goals established in 2000 [
2]. The SDGs focus the importance of WASH as a facet of international progress and development by incorporating “Clean Water and Sanitation” as its sixth primary goal [
3]. The World Health Organization (WHO) defines water access in accordance with the SDGs, stating basic water access is having a water source within 1 km or a 30 min round trip; yet millions around the globe do not meet this international standard for basic access [
4,
5].
Lack of access to water has many well-known impacts at the individual level. The most common disease associated with a lack of clean water sources is diarrheal disease from enteric pathogens such as
E. coli and
E. hystolitica [
6,
7]. Other known morbidities include stunting and wasting [
8], premature birth, and low infant birth weight [
9]. Moreover, the provision of basic access to improved water sources has a profound impact on the social dynamics of certain populations, influencing education rates, gender equality, and intergenerational economic development [
10,
11]. Globally, there is a distinct accessibility difference between urban and rural populations, with rural regions often facing more neglect from development programs [
12] and having less improved water sources overall [
13]. This urban–rural divide is compounded by differences in water accessibility on the basis of socioeconomic status. Wealth is known to be a significant confounder in studies investigating water access, with access increasing with increasing wealth [
9,
14,
15]. It is clear that WASH is deeply rooted in environmental justice, and limiting these inequities should be a focus when considering issues of water accessibility.
Nepal is an extremely diverse nation, consisting of multiple ethnicities, cultures, and languages, along with having considerable differences in population densities, topography, natural resources, and weather patterns [
16]. A landlocked country of nearly 30 million people, it is one of the poorest and least developed nations in the world [
17]. Its international status as one of the most slowly developing countries demands attention toward its WASH status in the face of the 2015 Sustainable Development Goals. Nepal is considered a greatly water-insecure nation, likely exacerbated by its complex geophysical landscape and high regional variation [
18].
In the last two decades, the Nepali government has made significant strides toward improving the WASH status in communities throughout the nation. However, progress has predominantly been concentrated within more urban areas of the country. As 80% of the Nepali population is known to reside in rural regions, this urban prioritization of WASH leaves the majority of the country’s people out of primary consideration. Shrestha et al. reported that 25% of survey respondents residing in rural districts had no adequate sanitation infrastructure, and over 50% of the respondents claimed to have limited access to suitable water [
19]. In alignment with global trends, the rural–urban divide and resulting socioeconomic disparities in Nepal contribute to WASH-based inequalities. Nationwide cross-sectional studies have indicated that it is the nation’s poorest communities, primarily found in the rural periphery of the country, who face the greatest barriers to water access [
20].
Socioeconomic status is a significant indicator for water accessibility, with the poorest people being at higher risk for reduced access to improved sources. However, these studies have been primarily conducted at the national level with respect to the wide heterogeneity of socioeconomic status across village, district, and city lines with little attention to the diversity of wealth and accessibility even within specific rural communities. While the value of larger cross-sectional studies cannot be ignored, it is equally important to recognize the inherent heterogeneities that exist within single communities. This study aimed to bolster community empowerment, which could often be lost in broader studies. An intention of this study was to work with the community to document local information that could then be used to assess and address the results of local interventions. Moreover, very few studies have incorporated direct research-based advice for reasonable solutions that can be implemented within a relatively short time frame, once again empowering the particular community at hand to take control of the well-being of its own members. For these reasons, we determined whether there is a relationship between relative household wealth and access to improved water sources, to assess WASH inequalities at the intra-community level.
2. Materials and Methods
2.1. Data Collection
From 2016, students from the organization GlobeMed at Berkeley have been in a committed, collaborative partnership with the Department of Community Programs (DCP) of Dhulikhel Hospital, an adjunct of Kathmandu University in Nepal. The action-oriented partnership is focused on developing sustainable WASH practices and resources to the rural regions of Nepal through the department’s 18 outreach centers. Specifically, students of GlobeMed at Berkeley have been involved in the development projects of the Bolde outreach village in the Kathmandu valley. In June of 2018, data were collected by members of the DCP from 72 school children in grades 6–8 at the two secondary schools in Bolde. Data included in this 2018 exploratory analysis included anthropometric measurements and stool samples in order to determine the impacts of unimproved water and inadequate nutrition on individual health. These measures and samples were analyzed by the DCP and contributed to the secondary data analysis reported here.
In June of 2019, surveys were conducted at village households to assess family-level contributions to water access, sanitation, and hygiene in Bolde. We included the same cohort of students, which includes the entire village population of grades 7–9 (n = 72), for the sake of consistency with prior research and familiarity with the Department of Community Programs. As this study was performed in a small rural community, our convenience sample accounted for over 15% of the study population (n = 470 households). All 72 of the students who were included in the survey study lived in different households and were within walking distance of the school they attended. Informed consent was gained from all participating household representatives in the study by the DCP. Consent was also given by secondary school principals to interact with students and their families on school grounds as necessary.
Survey answers were collected using handheld tablets with the software CommCare (Dimagi, Cambridge, MA, USA) [
21] due to the ubiquity of CommCare within Nepali research teams, including those at Dhulikhel Hospital, thus making it an ideal software program in terms of its ease of use and translatability to local programs. The handheld tablets simplified location tracking and made it possible to immediately download respondent answers into a central server.
There were two data collection teams, each consisting of two GlobeMed student interns and one hired data collector/translator. Prior to data collection, the teams practiced collaborative rehearsal in order to ensure cross-surveyor consistency and reduce interviewer bias. Both groups met with secondary school principals to confirm the location of the students’ households. Because many households were spread far apart and walking was the only means of transportation, households were organized into local clusters to maximize the number of household visits that could be completed each day. No maps were available in such a rural village region, so travel to each household was reliant upon the general directions indicated by the principals and based on the word of mouth of community members. Upon arrival at the household, data collection teams obtained consent and proceeded with the survey (conducted with the child’s mother or another caregiver if the mother was not available). The data collectors conversed with the household caregivers in Nepali to obtain survey answers, while student interns (upon earning consent) took notes and observations about the water sources, building materials, and hygiene products present in the visible vicinity.
2.2. Data Analysis
To determine whether intracommunity wealth differences are related to water access we chose to explore the socioeconomic information and ‘walk time to water source’ variables as the exposure and outcome variables, respectively. Walk time to water was self-reported by respondents as part of the administered household survey. Overall socioeconomic status, assessed as ‘relative wealth’, was determined through the construction of a wealth index so that the socioeconomic variation between households within the Bolde community could be assessed. Many public health studies have indicated that a wealth index is a fair proxy for household wealth when no data on household income is available [
22,
23,
24]. This was the case of this particular community, as the majority of village residents worked as subsistence farmers and thus did not have a formal, standard, easily measurable quantitative income. Creating a wealth index made it possible to observe the relative socioeconomic position of households within a particular community, while also allowing us to recognize the specific needs of rural communities as opposed to their urban counterparts [
23]. In terms of the outcome variable, time to obtain water was used as an indicator of household water access, in accordance with the United Nation’s Sustainable Development Goals’ inclusion of “walking time to water” as a crucial contributor to water accessibility [
3]. This decision is also based on the knowledge that the time necessary to reach a household’s given water source has direct impacts on the quantities of water the water bearer is able to collect and the household’s overall health [
24]. There are two relevant methods for wealth index construction available to be used in the context of this project: raw asset sums, or an analytical compilation of various weighted wealth indicators. While calculating the raw sums of material assets would likely have been simpler, it would not comprehensively encapsulate the regionally specific values with respect to particular items [
25]. Thus, the wealth index constructed for this study incorporated multiple household components, including personal material assets, building materials, type of household energy source, type of household water source, livestock owned, and household sanitation facilities (
Figure 1). This data, when compiled into a single index, provided more comprehensive insights into the relative wealth of a given household within the context of its own community.
All relevant wealth data were first deconstructed into binary codes (0 if the household did not have a particular item, and 1 for if it had an item) for each particular asset (See
Table 1).
Of course, certain types of assets are inherently worth higher economic value than others. Therefore, we incorporated principal component analysis (PCA) to construct community-relevant weighted values. The PCA method weighs particular items in terms of their relevant value within a single setting, with the least common items having the higher values and more common items having lower values. The combined effect of these weighted items provided a more realistic assessment of a household’s status [
26,
27]. The PCA values of the specific items included in the wealth index were assigned to designated items and materials based on prior cross-sectional data from the Nepal 2016 Demographic Health Survey (see
Supplementary Materials Table S1). This cross-sectional survey data mathematically determined the weights of household items within both urban and rural settings [
28]. Once all weights were assigned to the binary output of each respective item, each surveyed household had its index components added together; the weighted sum of each household was considered its relative wealth index. All households were numerically ranked based on wealth index and then categorically divided into quintiles for further analysis.
The wealth index took the form of a normal distribution, with a minimum, maximum, mean, and standard deviation of −0.63, 1.21, −0.12, and 0.37, respectively, indicating heterogeneity (or an adequate range in wealth in the community to assess this characteristic in relation to water access). A correlation matrix (scaled −1 to 1) was generated for the wealth index, to determine whether any variables should be dropped. The World Food Program’s Vulnerability Assessment and Mapping Guidance Paper on wealth index construction indicates that investigators should use a correlation threshold of 0.9 when determining whether to remove variables from the index [
29]. We elected to use an even more conservative threshold of 0.8. Our correlation matrix did not indicate that any variables were highly correlated and warrant removal from the wealth index.Both relative wealth and water collection times were then designated into binary categorical bins. For the purposes of this analysis, the binary was designated across the division between the second and third quintiles. In other words, the surveyed Bolde households that fell within the bottom 40% of the ranked relative wealth indices were assigned to the low relative wealth category, and all others assigned to the non-low wealth category.
For water retrieval time, a threshold of 30 min was chosen. This was determined in accordance with the UN Sustainable Development Goals [
3]. With the binary dependent and independent variables in place, RStudio (R Foundation for Statistical Computing, Vienna, Austria) was used to run a Fisher’s exact test of independence to investigate a potential relationship between low relative wealth within a given rural community and access to water as designated by water retrieval time. In order to account for potential confounding between the “water source” wealth index component and our outcome variable (water retrieval time), we removed the “water source” factor from the wealth index when performing the statistical analysis. The “water source” factor remained as part of the comprehensive wealth index for use in the geospatial analysis of our project.
2.3. Geospatial Suitability Analysis
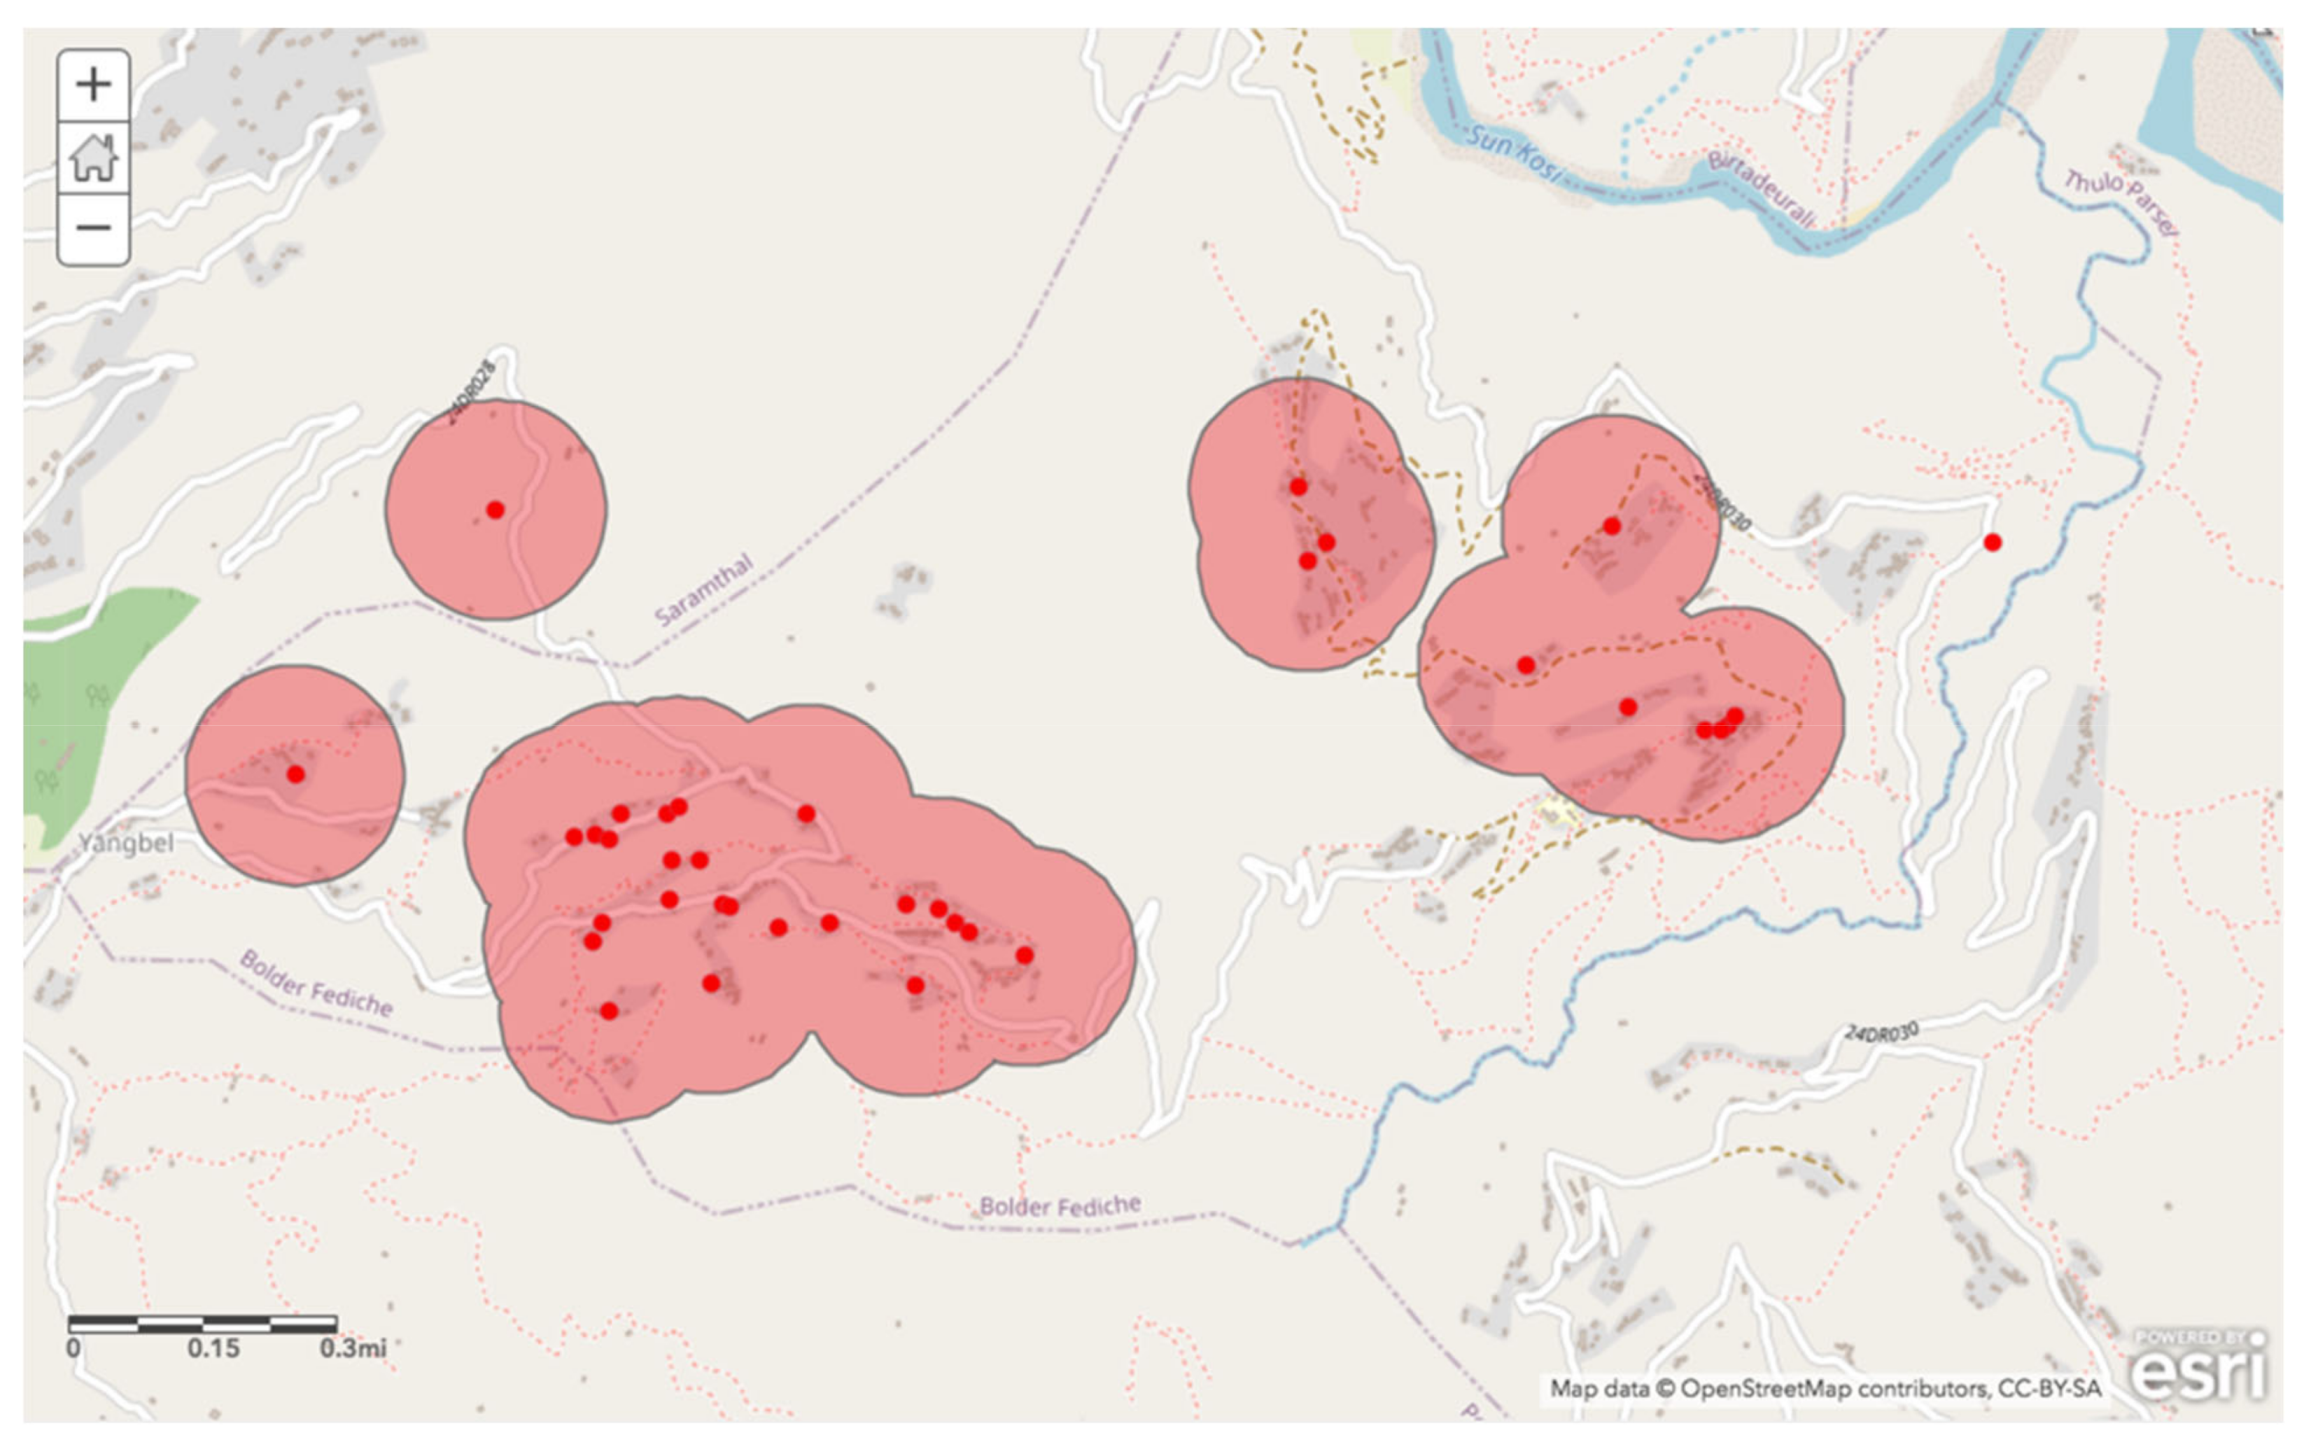
We employed a geospatial information system (GIS) to determine optimal locations for a future public tap to be built in the Bolde region. When household surveys were conducted, the location of each household was collected via the internal GPS on the devise used to collect answers to the survey. This location data were uploaded into ArcGIS Online (ESRI, Redlands, CA, USA) to determine suitable sites for future construction of a community well to lessen local water access barriers.
Three location characteristics were included in the suitability analysis: (1) walking distance to water, (2) current household with existing private or shared taps, and (3) relative wealth (based on the index described above). Each factor was used to create an individual map layer, which were then combined (overlaid) to determine regions of overlap where all criteria were satisfied.
Within the context of the SDG’s, an inclusive 30 min threshold of round-trip walking distance to water was used as the first layer. The 72 households surveyed were divided into the same binary categories as used in the statistical analysis, and only households that had travel times greater than 30 min were included in this layer. Once these locations were uploaded to ArcGIS, we estimated the area that could be reachable within 15 min (to fit the 30 min round trip standard). The program took into account proximity to existing roads and walkways as well as slope to provide locally informed and accurate estimates for travel time.
The second criterion incorporated into the geospatial analysis was that households without access to a private courtyard or shared tap be prioritized. To do this, the general location data was filtered by household water source; those that listed “private tap” or “shared tap with neighbors” were excluded from this map layer. The remaining households were then organized into location-based clusters to find the most central and easily accessible areas. We created a buffer area of 200 m around the clusters. This ensured that those households that currently did not have immediately available taps on the premises would have access to new source.
The final criteria addressed the environmental justice implications of the impact of household wealth on water access. To reduce any socioeconomic and public health inequalities within the community of interest, a third layer was added to introduce the wealth index data (described above) into the mapping analysis. The location data was stratified by wealth index quintile, with only the lowest 40% included in this map layer so that the poorest community members would be prioritized and included in the consideration of the suitable sites of new source construction. The ArcGIS software’s proximity analysis tool was used to determine the area reachable within a 10 min round trip walk time. A 10 min threshold was chosen to tighten the bounds of optimal locations, as a 30 min round trip threshold for this layer was not specific enough to allow for the successful identification of particular sites.
Once all three individual map layers were constructed, they were combined to determine potential locations for the construction of a new well. Therefore, the new well would cater to households that currently had much longer water collection times, did not have a tap in close proximity, and belonged to the poorest members of the community.
4. Discussion
Based on the Fisher’s exact test, there was no evidence of an association between wealth and access to water. This lack of association was surprising due to knowledge about the level of water inaccessibility in the area, as well as surveyor anecdotal evidence on the socioeconomic heterogeneity among households in the village of Bolde. This result may be attributed to the small sample size of village households included in the study. However, to prevent the further isolation of the most economically vulnerable (and the body of evidence indicating socioeconomic status as a confounder for water access), these households were still prioritized in the geospatial suitability analysis for future public tap installation. Our finding also contradicts the trends put forth by prior studies assessing the impacts of socioeconomic status on water access at the intercommunity, national, and global level [
14,
15,
20] likely for the same reasons.
Other studies have constructed wealth indices based on income, but in cases where ‘income’ is hard to assess (such as for members of our study population, who are primarily subsistence farmers), indices are commonly constructed using household assets. There are two commonly used methods of wealth index construction based in asset possession: raw asset sums or weighted asset sums. We chose to use the latter because of its relevance in a given setting, in our case a rural Nepali context; raw asset sums do not necessarily take regional context into account, and thus would not be as useful in a community case study. Moreover, this method will be more easily replicated by future community-based studies due to localized asset data publicly available through the Demographic Health Survey. It is possible that our unexpected results could be attributed to the method of wealth assessment. Based on work by others, the choice was made to use prior national principal component analysis data to provide weighted measures for comprehensive contributors to overall household wealth [
26]. However, other options for wealth index construction, such as raw sums of personal assets, may have been less expensive and easier to construct and analyze [
25]. Doing so may have led to different overall results indicating a potentially different relationship. Even with the unexpected result provided by the data analysis segment of the study, this finding did not inhibit the spatial analysis approach.
The most prominent strength of this study was the focus on and inclusion of the community members. One way that this was realized was through the continuity of the individuals included in the study sample. The same school children (grades 6−8) included in the 2018 anthropometric study were included in the 2019 household surveys (now in grades 7−9). This not only allowed for consistency in terms of maintaining a single subject population but also showed the participants that their participation was valued and central to the WASH development of their community. Community trust was also prioritized through communication with and input from village leaders, such as the guidance and consent of the secondary school principals. Additionally, the reliance on word-of-mouth directions from neighbors as well as the hiring of Nepali data collectors and translators helped to ensure that community members felt valued, safe, and supported when participating in the household surveys. We used the results of the wealth-based analysis, as well as other known characteristics regarding household water access, to provide a forward-thinking possible plan of action to isolate ideal locations for improved water sources, maximizing accessibility for those most disadvantaged within the community.
The primary challenge that remains at the conclusion of this study is that steps will be taken to ensure that the most sustainable and community-endorsed infrastructure, (i.e., improved water sources), will be incorporated into development plans. This study has identified ideal locations on the basis of individual household characteristics and wealth data, but some questions remain. For example, future development must consider what type of improved water source is most ideal at each location—a public tap or standpipe, a tube well or borehole, or a protected dug well. This decision will likely rely on community preferences, hydrology, physical feasibility, and building costs. Specifically, researchers and rural development teams should seek community input for the final site of construction through partnerships with Village Development Council leadership. The Bolde VDC will be able to provide feedback to the community and insights regarding ideal sites for future wells with the help of the geospatial analyses and maps generated in this study. There will also be a need to ensure that any public improved water source addresses remaining inequities between those households that utilize it, for example, ensuring that social status within the community does not garner greater access to a new source.


