Screening Model for Estimating Undiagnosed Diabetes among People with a Family History of Diabetes Mellitus: A KNHANES-Based Study

 , , , , and
Abstract
:1. Introduction
2. Materials and Methods
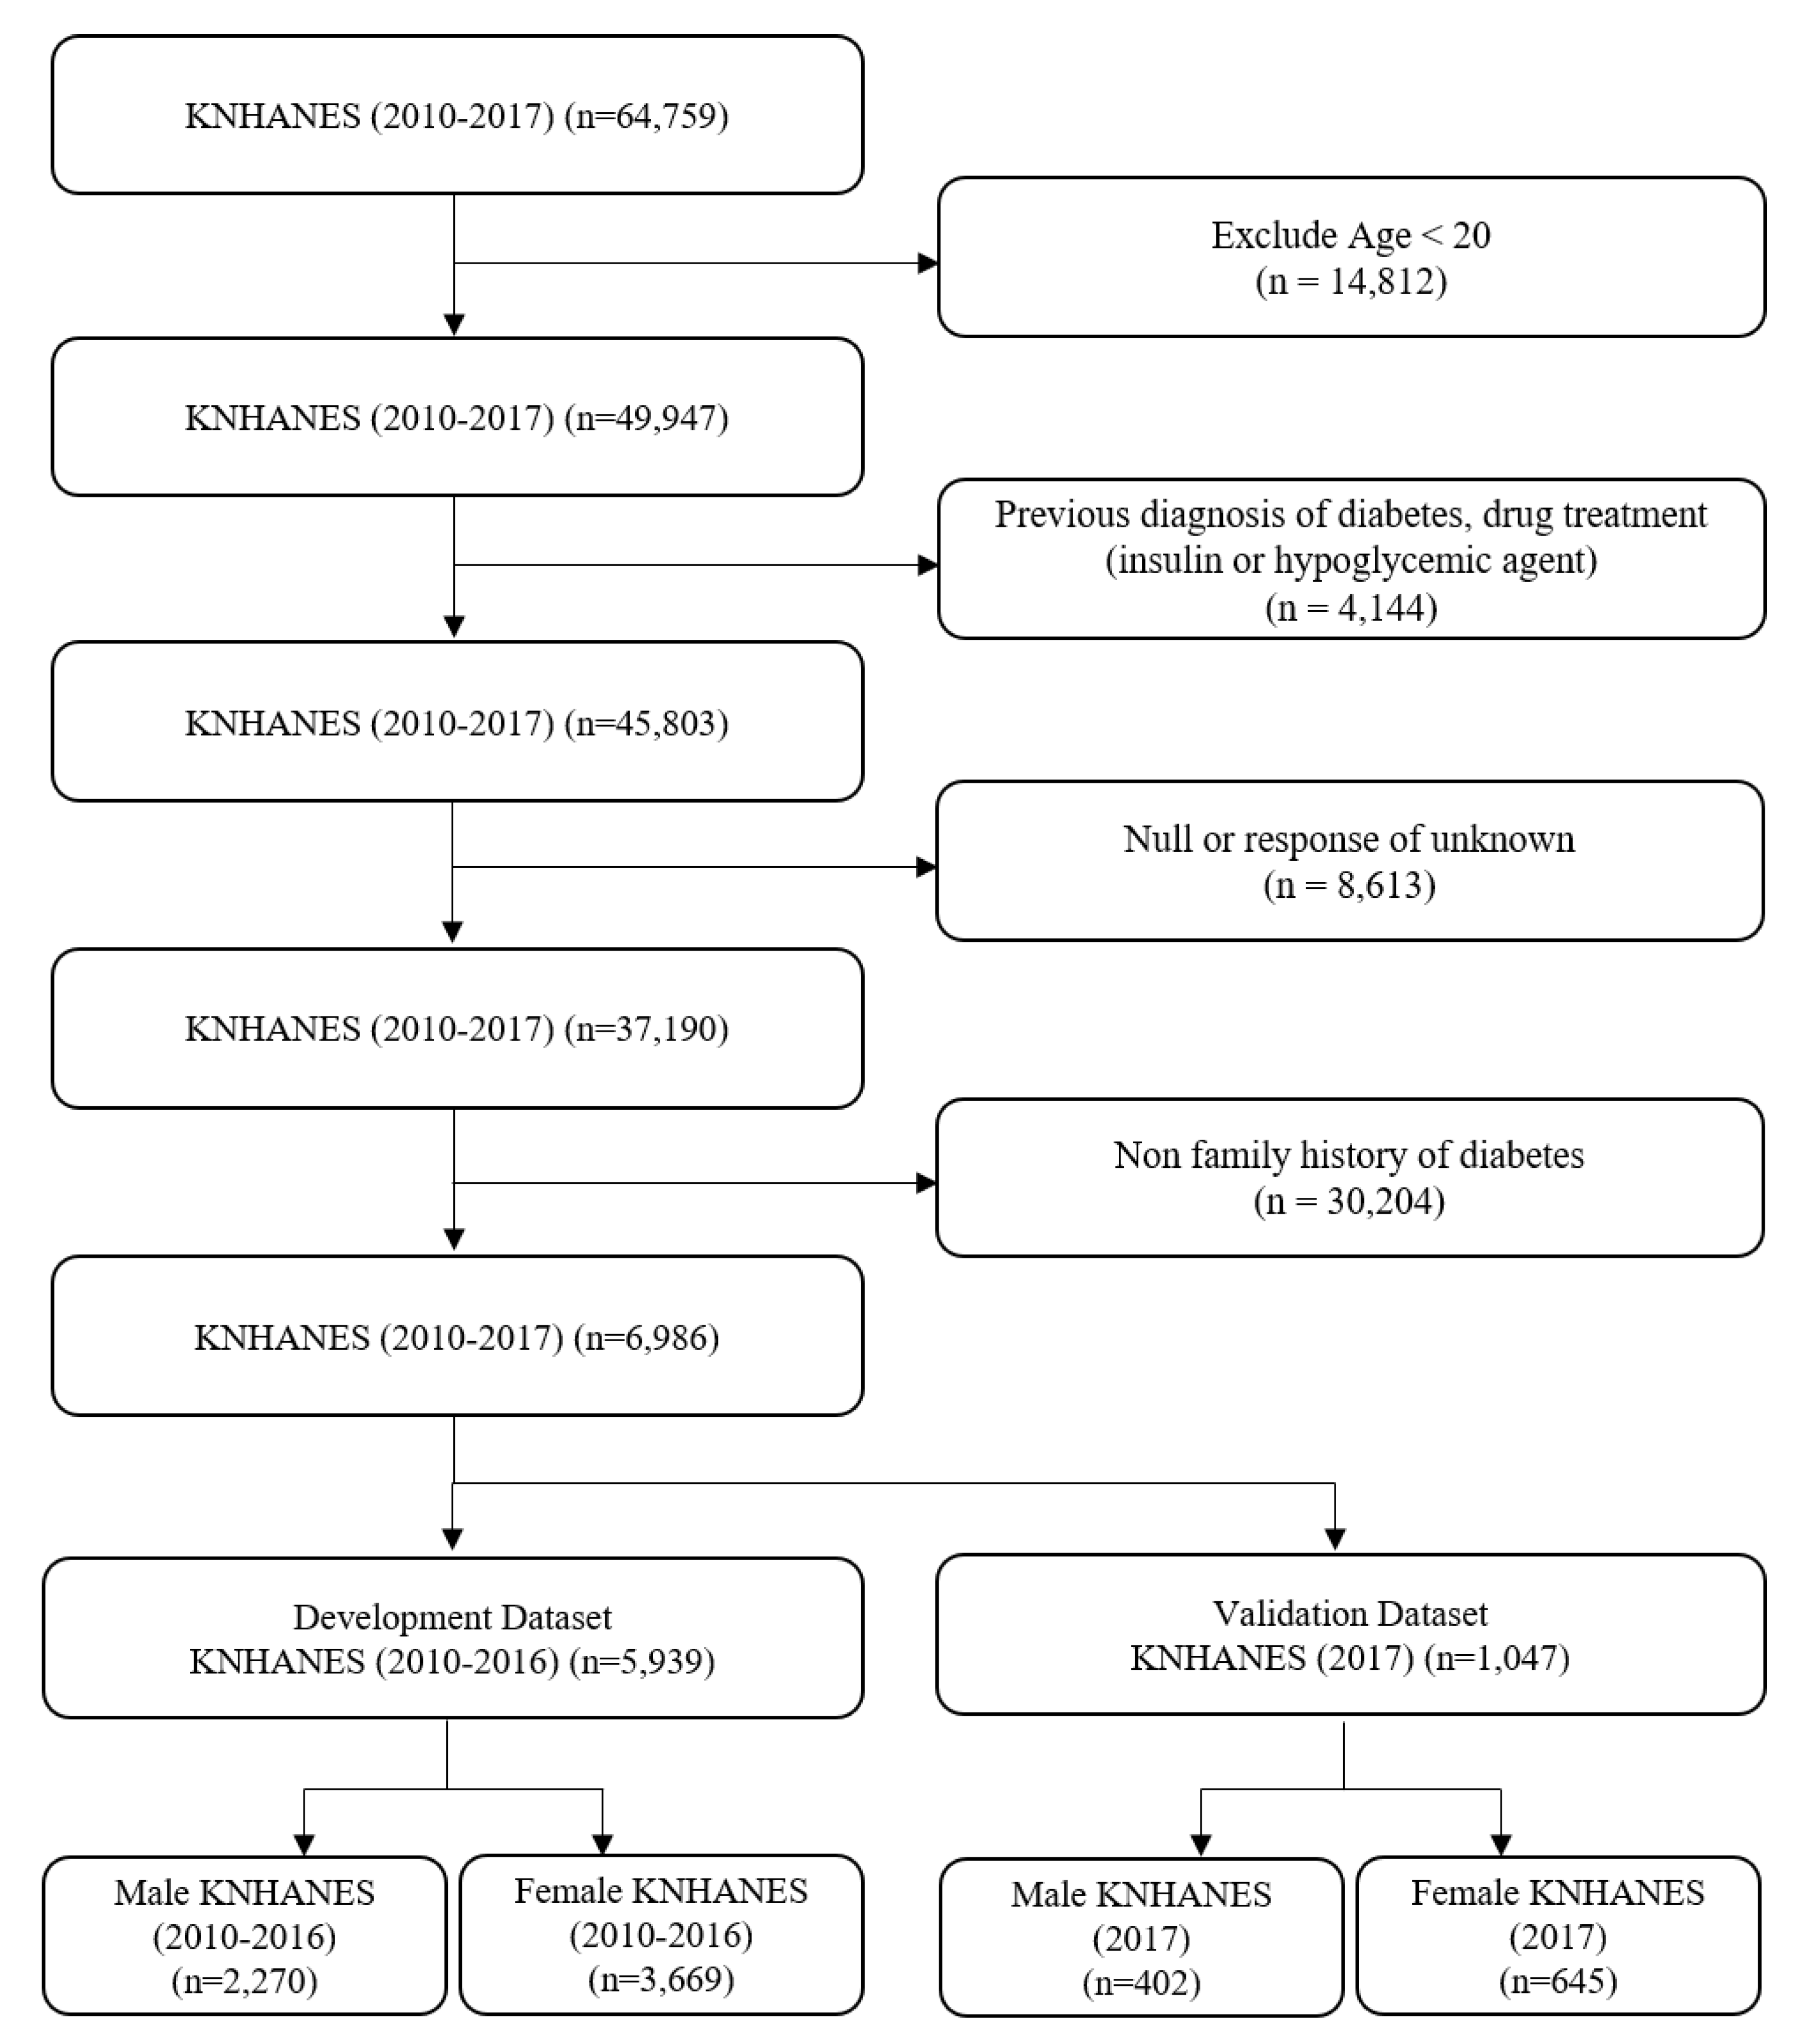
2.1. Study Design
2.2. Definition of Terminology
2.3. Statistical Analyses
3. Results
3.1. Comparison of Basic Characteristics between Non-FHD Group and FHD Group
3.2. Comparison of Basic Characteristics between Male and Female Participants in the FHD Group
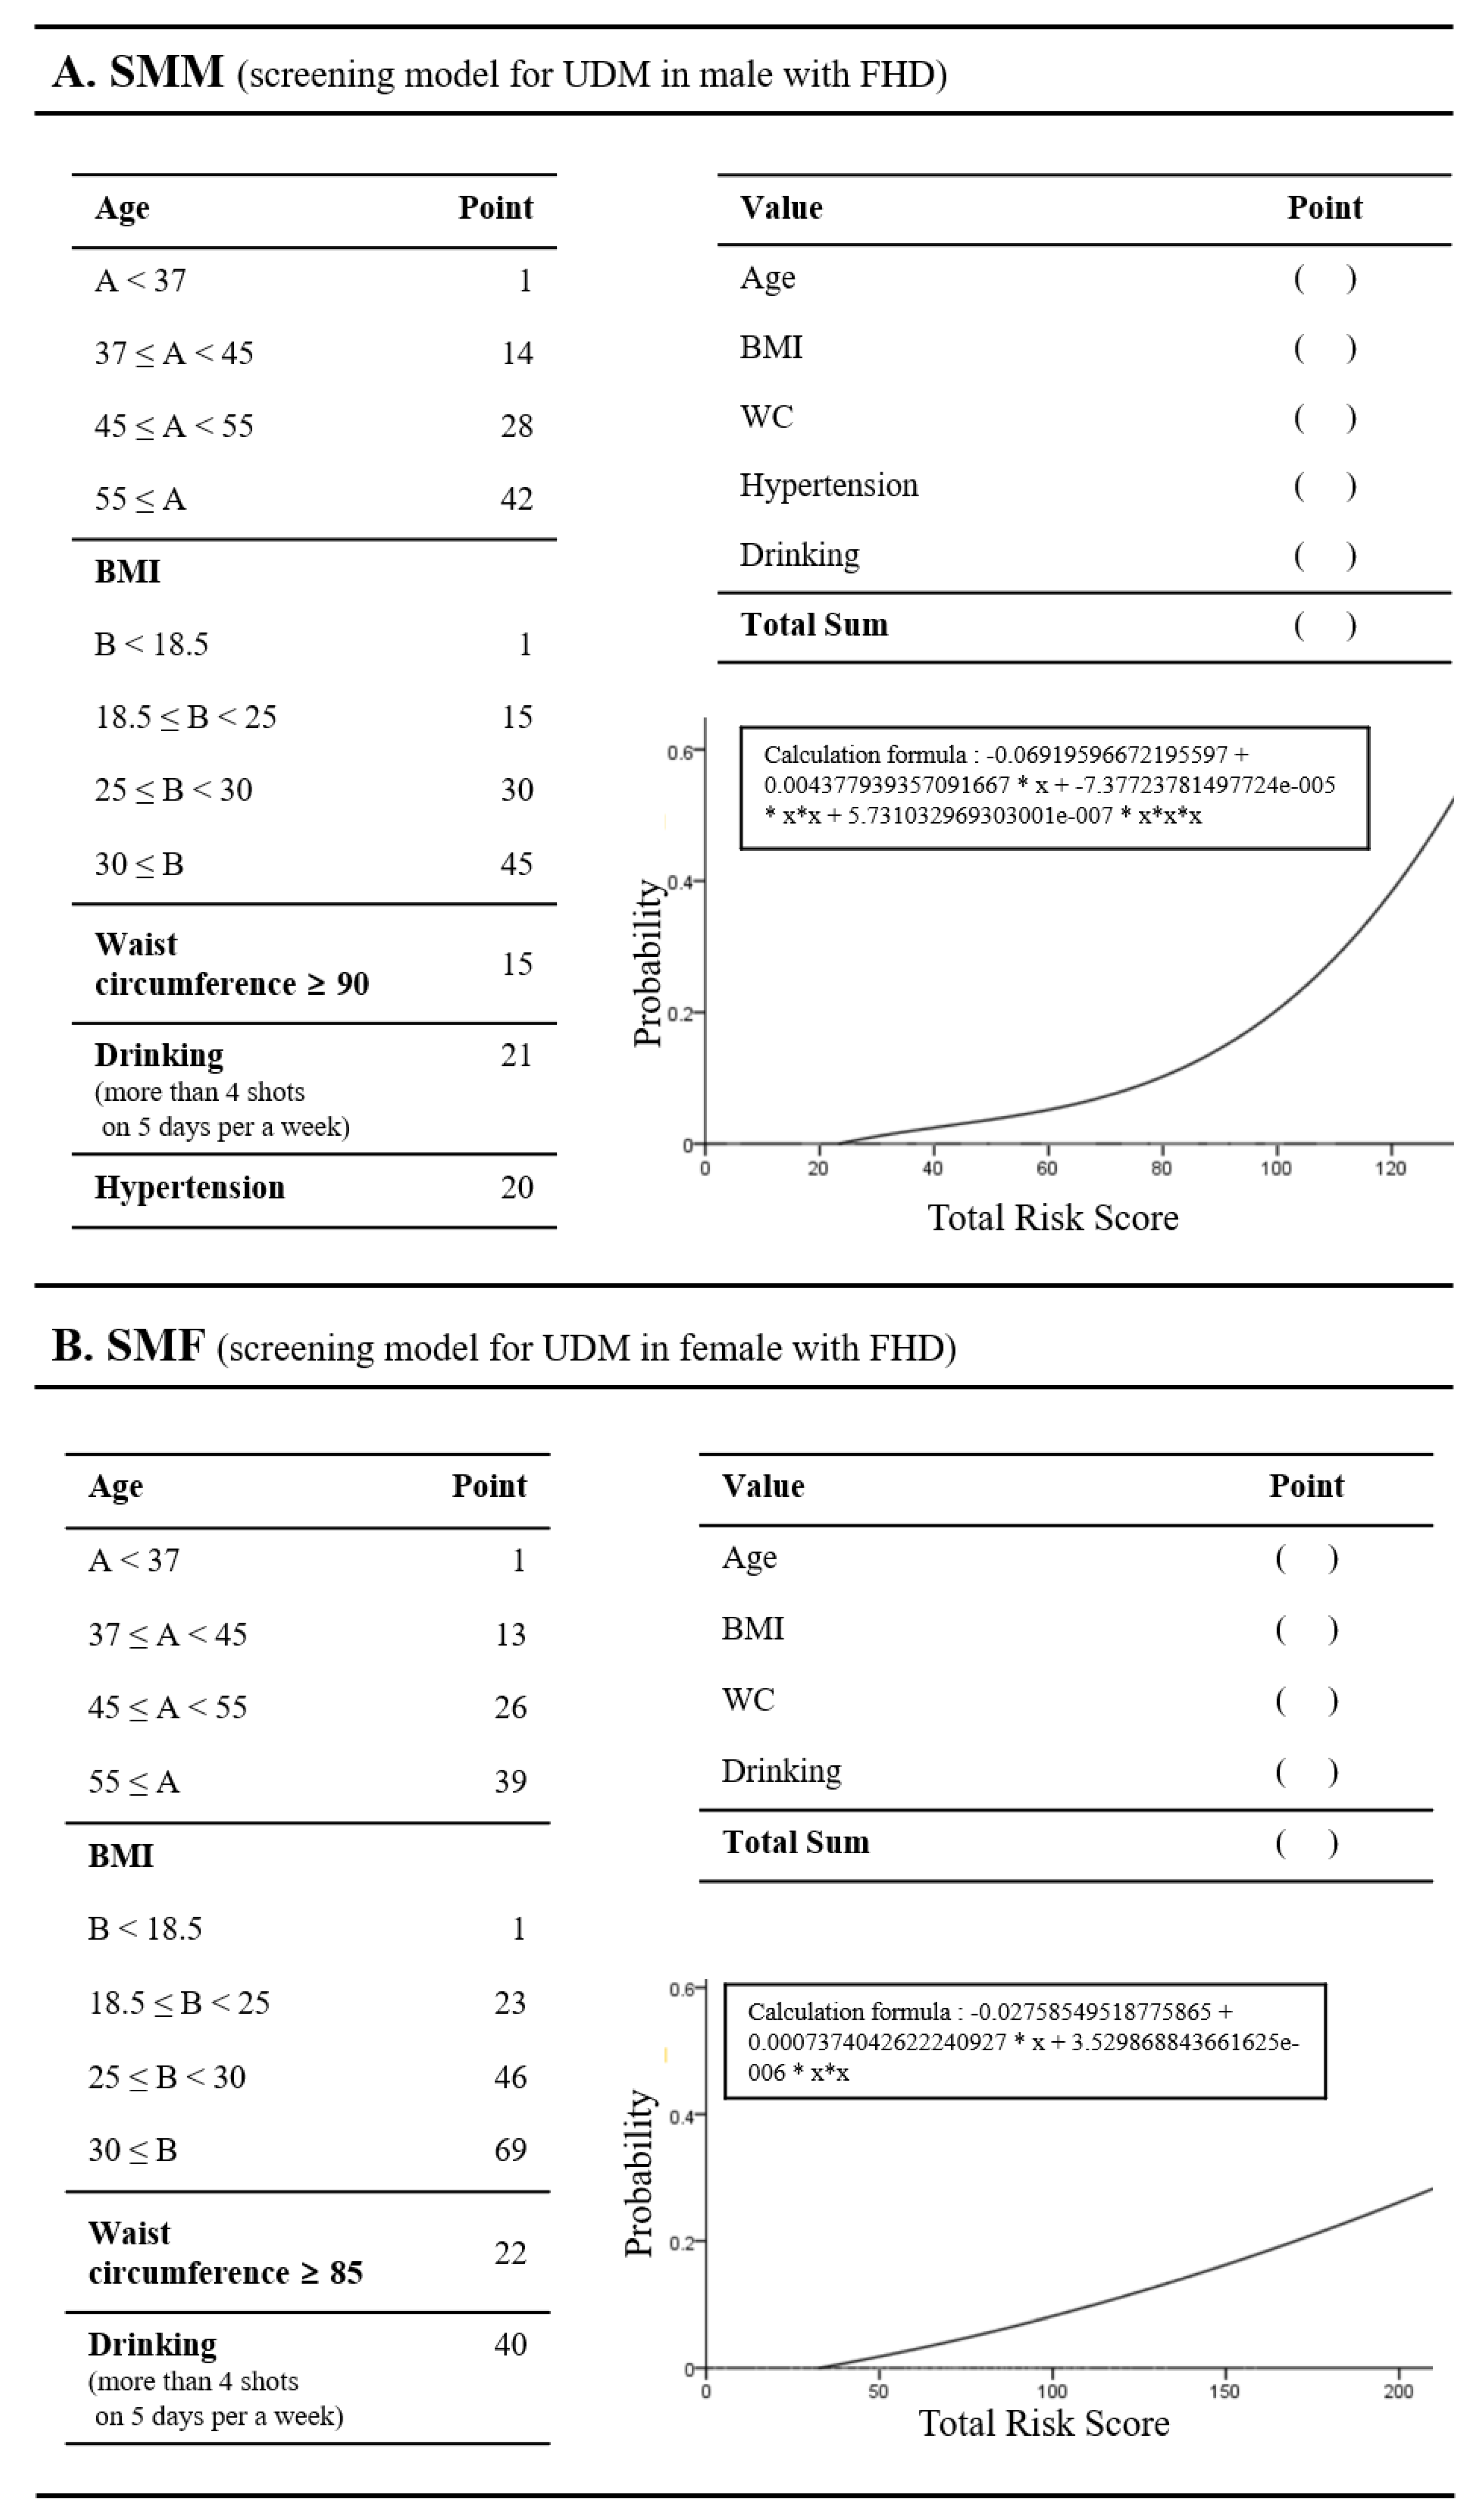
3.3. Screening Model Development and Performance Evaluation
4. Discussion
5. Conclusions
Author Contributions
Funding
Acknowledgments
Conflicts of Interest
Data Sharing Statement
Appendix A

| Variable | Non-FHD (n = 6986) | FHD (n = 6986) | p-Value |
|---|---|---|---|
| Demographic characteristics | |||
| Age (years) | 46.3 ± 15.3 | 46.5 ± 13 | 0.37 |
| Body mass index (kg/m2) | 23.9 ± 3.53 | 24 ± 3.5 | 0.08 |
| Weight (kg) | 63.5 ± 12.2 | 64.2 ± 12.3 | 0.00 |
| Height (Cm) | 163 ± 9.22 | 163 ± 8.9 | 0.00 |
| Waist circumference (Cm) | 81.1 ± 10.2 | 81.4 ± 9.9 | 0.06 |
| Female (%) | 62.3 | 61.8 | 0.5 |
| Social Factors | |||
| Hospital visit rate (%) | 84.5 | 84.7 | 0.74 |
| Stress (%) | 0.00 | ||
| High | 4.3 | 4.7 | |
| Mid-high | 23.0 | 23.8 | |
| Mid-low | 58.9 | 59.7 | |
| Low | 13.8 | 11.8 | |
| Depression (%) | 9.0 | 8.3 | 0.14 |
| Lifestyle Factors | |||
| Drinking (%) | 3.9 | 4.2 | 0.39 |
| Current Smoking (%) | 18.5 | 20.1 | 0.02 |
| Previous Smoking (%) | 17.1 | 17.4 | 0.59 |
| Walking (%) | 33.1 | 31.9 | 0.13 |
| Weight training (%) | 25.4 | 25.2 | 0.85 |
| Clinical Factors | |||
| Systolic blood pressure (mmHg) | 117 ± 16.3 | 116 ± 15.7 | 0.02 |
| Diastolic blood pressure (mmHg) | 75.9 ± 10.3 | 76.2 ± 10.2 | 0.16 |
| Total cholesterol (mg/dL) | 191 ± 36 | 194 ± 35.6 | <0.001 |
| High density lipoprotein ST2 (mg/dL) | 51.5 ± 12.3 | 51.2 ± 12.3 | 0.08 |
| Triglyceride (mg/dL) | 127 ± 93.2 | 135 ± 101 | <0.001 |
| Low density lipoprotein cholesterol (mg/dL) | 114 ± 32.3 | 116 ± 32.3 | 0.00 |
| Hemoglobin (g/dL) | 14 ± 1.58 | 14 ± 1.6 | 0.45 |
| Hematocrit (%) | 42 ± 4.2 | 42.2 ± 4.2 | 0.06 |
| Blood urea nitrogen (mg/dL) | 13.8 ± 4.04 | 13.9 ± 4 | 0.19 |
| Creatinine (mg/dL) | 0.81 ± 0.23 | 0.81 ± 0.3 | 0.68 |
| Fasting glucose (mg/dL) | 94.9 ± 15.1 | 97.7 ± 19.4 | <0.001 |
| Hypertension (%) | 16.8 | 13.8 | <0.001 |
| Impaired fasting glucose (%) | 21.6 | 26.1 | <0.001 |
| Undiagnosed diabetes (%) | 2.6 | 4.5 | <0.001 |
| Variable | Non-FHD (n = 30,204) | FHD (n = 6986) | p-Value | Adjusted p-Value * |
|---|---|---|---|---|
| Demographic characteristics | ||||
| Age (years) | 49.9 ± 16.3 | 46.5 ± 13.0 | 0.01 | 0.01 |
| Body mass Index (kg/m2) | 23.6 ± 3.4 | 24.0 ± 3.5 | 0.01 | 0.01 |
| Weight (kg) | 62.7 ± 11.8 | 64.2 ± 12.3 | 0.01 | 0.01 |
| Height (m) | 1.63 ± 0.1 | 1.63 ± 0.1 | 0.01 | 0.01 |
| Waist circumference (m) | 0.80 ± 0.1 | 0.81 ± 0.1 | 0.01 | 0.01 |
| Female (%) | 56.6 | 61.8 | 0.01 | 0.01 |
| Social Factors | ||||
| Hospital visit rate (%) | 42.4 | 82.4 | 0.69 | 0.77 |
| Stress (%) | 0.01 | 0.01 | ||
| High | 4.2 | 4.7 | ||
| Mid-high | 21.4 | 23.8 | ||
| Mid-low | 58.2 | 59.7 | ||
| Low | 16.2 | 11.8 | ||
| Depression (%) | 9.5 | 4.7 | 0.01 | 0.01 |
| Lifestyle Factors | ||||
| Drinking (%) | 4.5 | 4.2 | 0.29 | 0.34 |
| Current Smoking (%) | 19.2 | 20.1 | 0.08 | 0.1 |
| Previous Smoking (%) | 20.7 | 17.4 | 0.01 | 0.01 |
| Walking (%) | 33.6 | 31.9 | 0.01 | 0.01 |
| Weight training | 25.1 | 25.2 | 0.84 | 0.87 |
| Clinical Factors | ||||
| Systolic blood pressure (mmHg) | 118.6 ± 17.0 | 116.5 ± 15.7 | 0.01 | 0.01 |
| Diastolic blood pressure (mmHg) | 75.8 ± 10.3 | 76.2 ± 10.2 | 0.01 | 0.01 |
| Total cholesterol (mg/dL) | 191.4 ± 35.8 | 194.2 ± 35.7 | 0.01 | 0.01 |
| High density lipoprotein ST2 (mg/dL) | 51.1 ± 12.3 | 51.2 ± 12.3 | 0.84 | 0.87 |
| Triglyceride (mg/dL) | 128.3 ± 91.9 | 134.9 ± 100.6 | 0.01 | 0.01 |
| Low density lipoprotein cholesterol (mg/dL) | 114.6 ± 32.3 | 116.0± 32.3 | 0.01 | 0.01 |
| Hemoglobin (g/dL) | 14.0±1.6 | 14.0 ± 1.6 | 0.17 | 0.21 |
| Hematocrit (%) | 42.2 ± 4.2 | 42.2 ± 4.2 | 0.98 | 0.98 |
| Blood urea nitrogen (mg/dL) | 14.3 ± 4.4 | 13.9 ± 4.0 | 0.01 | 0.01 |
| Creatinine (mg/dL) | 0.83 ± 0.2 | 0.80 ± 0.3 | 0.01 | 0.01 |
| Fasting glucose (mg/dL) | 95.2 ± 14.3 | 97.7 ± 19.4 | 0.01 | 0.01 |
| Hypertension (%) | 20.3 | 13.8 | 0.01 | 0.01 |
| Impaired fasting glucose (%) | 23.1 | 26.1 | 0.01 | 0.01 |
| Undiagnosed diabetes (%) | 2.7 | 4.5 | 0.01 | 0.01 |
| Variable | Male (n = 2672) | Female (n = 4314) | p-Value |
|---|---|---|---|
| Demographic characteristics | |||
| Age (years) | 46.0 ± 12.9 | 46.9 ± 13.1 | 0.01 |
| Body mass index (kg/m2) | 24.7 ± 3.3 | 23.6 ± 3.4 | 0.01 |
| Weight (kg) | 72.7 ± 11.8 | 59.0 ± 9.4 | 0.01 |
| Height (m) | 1.71 ± 0.1 | 1.58 ± 0.1 | 0.01 |
| Waist circumference (m) | 0.86 ± 0.1 | 0.79 ± 0.1 | 0.01 |
| Social Factors | |||
| Hospital visit rate | 87.3 | 83.1 | 0.01 |
| Stress | 0.10 | ||
| High | 4.0 | 5.2 | |
| Mid-high | 24.4 | 23.4 | |
| Mid-low | 59.7 | 59.8 | |
| Low | 12.0 | 11.6 | |
| Depression | 5.0 | 10.3 | 0.01 |
| Lifestyle Factors | |||
| Drinking (%) | 9.3 | 1.1 | 0.01 |
| Current Smoking (%) | 43.3 | 5.7 | 0.01 |
| Previous Smoking (%) | 35.9 | 6.1 | 0.01 |
| Walking (%) | 34.5 | 30.3 | 0.01 |
| Weight training (%) | 35.1 | 19.1 | 0.01 |
| Clinical Factors | |||
| Systolic blood pressure (mmHg) | 119.8 ± 14.1 | 114.4 ± 16.3 | 0.01 |
| Diastolic blood pressure (mmHg) | 79.9 ± 10.0 | 73.8 ± 9.6 | 0.01 |
| Total cholesterol (mg/dL) | 195.4 ± 35.1 | 193.4 ± 36.0 | 0.03 |
| High density lipoprotein ST2 (mg/dL) | 46.6 ± 10.9 | 54.0 ± 12.2 | 0.01 |
| Triglyceride (mg/dL) | 170.5 ± 125.4 | 112.9 ± 73.4 | 0.01 |
| Low density lipoprotein cholesterol (mg/dL) | 114.7 ± 33.5 | 116.9 ± 31.5 | 0.01 |
| Hemoglobin (g/dL) | 15.4 ± 1.1 | 13.1 ± 1.2 | 0.01 |
| Hematocrit (%) | 45.9 ± 3.1 | 39.9 ± 3.1 | 0.01 |
| Blood urea nitrogen (mg/dL) | 14.7 ± 3.9 | 13.3 ± 4.0 | 0.01 |
| Creatinine (mg/dL) | 0.9 ± 0.3 | 0.7 ± 0.2 | 0.01 |
| Fasting glucose (mg/dL) | 101.0 ± 22.5 | 95.6 ± 16.8 | 0.01 |
| Hypertension (%) | 15.1 | 13.0 | 0.02 |
| Impaired fasting glucose (%) | 33.2 | 21.7 | 0.01 |
| Undiagnosed diabetes (%) | 6.4 | 3.4 | 0.01 |
| People | |||
|---|---|---|---|
| Variable | B | Odds (95% CI) | p-Value |
| Age | 0.21 | 1.24 (1.08–1.42) | 0.00 |
| WC | 0.68 | 1.98 (1.72–2.28) | 0.00 |
| Hypertension | 0.56 | 1.75 (1.29–2.38) | 0.00 |
| Drinking | 0.94 | 2.55 (1.71–3.82) | 0.00 |

References
- World Health Organization. Global Report on Diabetes. 2016. Available online: https://apps.who.int/iris/handle/10665/204871 (accessed on 5 January 2020).
- World Health Organization. Classification of Diabetes Mellitus. 2019. Available online: https://apps.who.int/iris/handle/10665/325182 (accessed on 5 April 2020).
- Becker, D.; Insel, R. Screening, staging, and naming of presymptomatic type 1 diabetes. Pediatr. Diabetes 2018, 19, 7–10. [Google Scholar] [CrossRef] [PubMed]
- Yoo, W.S.; Kim, J.H.; Lee, M.Y.; Chung, H.K. Early detection of asymptomatic coronary artery disease in patients with type 2 diabetes mellitus. Korean J. Intern. Med. 2009, 24, 183–189. [Google Scholar] [CrossRef]
- Katsarou, A.; Gudbjörnsdottir, S.; Rawshani, A.; Dabelea, D.; Bonifacio, E.; Anderson, B.J.; Jacobsen, L.M.; Schatz, D.A.; Lernmark, Å. Type 1 diabetes mellitus. Nat. Rev. Dis. Primers 2017, 3, 17016. [Google Scholar] [CrossRef]
- Youn, H.J. Early Detection of Asymptomatic Coronary Artery Disease in Patients with Type 2 Diabetes Mellitus. Korean J. Intern. Med. 2009, 24, 180–182. [Google Scholar] [CrossRef] [PubMed]
- Kim, M.J.; Lim, N.K.; Choi, S.J.; Park, H.Y. Hypertension is an independent risk factor for type 2 diabetes: The Korean genome and epidemiology study. Hypertens. Res. 2015, 38, 783–789. [Google Scholar] [CrossRef] [PubMed]
- Zhou, H.; Li, Y.; Liu, X.; Xu, F.; Li, L.; Yang, K.; Qian, X.; Liu, R.; Bie, R.; Wang, C. Development and evaluation of a risk score for type 2 diabetes mellitus among middle-aged Chinese rural population based on the RuralDiab Study. Sci. Rep. 2017, 7, 42685. [Google Scholar] [CrossRef] [PubMed] [Green Version]
- Ryu, K.S.; Lee, S.W.; Batbaatar, E.; Lee, J.W.; Choi, K.S.; Cha, H.S. A deep learning model for estimation of patients with undiagnosed diabetes. Appl. Sci. 2020, 10, 421. [Google Scholar] [CrossRef] [Green Version]
- Glumer, C.; Carstensen, B.; Sandbaek, A.; Lauritzen, T.; Jorgensen, T.; Borch-Johnsen, K. A Danish diabetes risk score for targeted screening: The Inter99 Study. Diabetes Care 2004, 27, 727–733. [Google Scholar] [CrossRef] [Green Version]
- Lee, Y.H.; Bang, H.; Kim, C.H.; Kim, H.M.; Park, S.W.; Kim, D.J. A simple screening score for diabetes for the Korean population: Development, validation, and comparison with other scores. Diabetes Care 2012, 35, 1723–1730. [Google Scholar] [CrossRef] [Green Version]
- Katulanda, P.; Hill, N.R.; Stratton, I.; Sheriff, R.; De Silva, S.D.N.; Matthews, D.R. Development and validation of a diabetes risk score for screening undiagnosed diabetes in Sri Lanka (SLDRISK). BMC Endocr. Disord. 2016, 16, 42. [Google Scholar] [CrossRef] [Green Version]
- Heikes, K.E.; Eddy, D.M.; Arondekar, B.; Schlessinger, L. Diabetes risk calculator: A simple tool for detecting undiagnosed diabetes and pre-diabetes. Diabetes Care 2008, 31, 1040–1045. [Google Scholar] [CrossRef] [PubMed] [Green Version]
- Aekplakorn, W.; Bunnag, P.; Woodward, M.; Sritara, P.; Cheepudomwit, S.; Yamwong, S.; Yipintsoi, T.; Rajatanavin, R. A risk score for predicting incident diabetes in the Thai population. Diabetes Care 2006, 29, 1872–1877. [Google Scholar] [CrossRef] [PubMed] [Green Version]
- Nanri, A.; Nakagawa, T.; Kuwahara, K.; Yamamoto, S.; Honda, T.; Okazaki, H.; Uehara, A.; Yamamoto, M.; Miyamoto, T.; Kochi, T.; et al. Development of Risk Score for Predicting 3-Year Incidence of Type 2Diabetes: Japan Epidemiology Collaboration on Occupational Health Study. PLoS ONE 2015, 10, e0142779. [Google Scholar] [CrossRef] [PubMed]
- Gao, W.G.; Dong, Y.H.; Pang, Z.C.; Nan, H.R.; Wang, S.J.; Ren, J.; Zhang, L.; Tuomilehto, J.; Qiao, Q. A simple Chinese risk score for undiagnosed diabetes. Diabetic Med. 2010, 27, 274–281. [Google Scholar] [CrossRef]
- Baan, C.A.; Ruige, J.B.; Stolk, R.P.; Witteman, J.C.; Dekker, J.M.; Heine, R.J.; Feskens, E.J. Performance of a predictive model to identify undiagnosed diabetes in a health care setting. Diabetes Care 1999, 22, 213–219. [Google Scholar] [CrossRef] [Green Version]
- Yang, Q.; Liu, T.; Valdez, R.; Moonesinghe, M.; Khoury, M.J. Improvements in ability to detect undiagnosed diabetes by using information on family history among adults in the United States. Am. J. Epidemiol. 2010, 171, 1079–1089. [Google Scholar] [CrossRef]
- The Seventh Korea National Health and Nutrition Examination Survey (KNHANES V-II) 2017, Korea Centers for Disease Control and Prevention. Available online: https://knhanes.cdc.go.kr (accessed on 1 November 2020).
- World Health Organization. Regional Office for the Western Pacific. The Asia-Pacific Perspective: Redefining Obesity and its Treatment. Sydney: Health Communications Australia. 2000. Available online: https://apps.who.int/iris/handle/10665/206936 (accessed on 18 October 2020).
- International Diabetes Federation. IDF Diabetes Atlas, 6th Edition. 2013. Available online: https://www.idf.org/e-library/epidemiology-research/diabetes-atlas/19-atlas-6th-edition.html (accessed on 18 October 2020).
- Sattar, N.; Rawshani, A.; Franzén, S.; Rawshani, A.; Svensson An Rosengren, A.; Darren, K.M.; Eliasson, B.; Gudbjörnsdottir, S. Age at Diagnosis of Type 2 Diabetes Mellitus and Associations with Cardiovascular and Mortality Risks: Findings from the Swedish National Diabetes Registry. Circulation 2019, 139, 2228–2237. [Google Scholar] [CrossRef]
- Vazquez, G.; Duval, S.; Jacobs, D.R., Jr.; Silventoinen, K. Comparison of body mass index, waist circumference and waist/hip ratio in predicting incident diabetes: A meta-analysis. Epidemiol. Rev. 2007, 29, 115–128. [Google Scholar] [CrossRef] [Green Version]
- Siren, R.; Eriksson, J.G.; Vanhanen, H. Waist circumference a good indicator of future risk for type 2 diabetes and cardiovascular disease. BMC Public Health 2012, 12, 63. [Google Scholar] [CrossRef]
- Janiszewski, P.M.; Janssen, I.; Ross, R. Does Waist Circumference Predict Diabetes and Cardiovascular Disease beyond Commonly Evaluated Cardiometabolic Risk Factors? Diabetes Care 2007, 30, 3105–3109. [Google Scholar] [CrossRef] [Green Version]
- Steiner, J.L.; Crowell, K.T.; Lang, C.H. Impact of alcohol on glycemic control and insulin action. Biomolecules 2016, 5, 2223. [Google Scholar] [CrossRef] [PubMed] [Green Version]
- Baliunas, D.O.; Taylor, B.J.; Irving, H.; Roerecke, M.; Patra, J.; Mohapatra, S.; Rehm, J. Alcohol as a Risk Factor for Type 2 Diabetes: A Systematic Review and Meta-Analysis. Diabetes Care 2009, 32, 2123–2132. [Google Scholar] [CrossRef] [PubMed] [Green Version]
- Criqui, M.; Beatrice, H.; Golomb, A. Should Patients with Diabetes Drink to Their Health? JAMA 1999, 282, 279. [Google Scholar] [CrossRef] [PubMed]
- Koppes, L.L.; Dekker, J.M.; Hendriks, H.F.; Bouter, L.M.; Heine, R.J. Moderate alcohol consumption lowers the risk of type 2 diabetes: A meta-analysis of prospective observational studies. Diabetes Care 2005, 28, 719–725. [Google Scholar] [CrossRef] [PubMed] [Green Version]
- Gray, N.; Picone, G.; Sloan, F.; Yashkin, A. Relation between BMI and diabetes mellitus and its complications among US older adults. South Med. J. 2015, 108, 29–36. [Google Scholar] [CrossRef] [PubMed] [Green Version]
- Hu, F.B.; Manson, J.E.; Stampfer, M.J.; Colditz, G.; Liu, S.; Solomon, C.G. Willett WC. Diet, lifestyle, and the risk of type 2 diabetes mellitus in women. Obstet. Gynecol. Surv. 2002, 57, 162–164. [Google Scholar] [CrossRef] [Green Version]
- Ford, E.S.; Williamson, D.F.; Liu, S. Weight change and diabetes incidence: Findings from a national cohort of US adults. Am. J. Epidemiol. 1997, 146, 214–222. [Google Scholar] [CrossRef]
- Gregg, E.W.; Cadwell, B.L.; Cheng, Y.J.; Cowie, C.C.; Williams, D.E.; Geiss, L.; Engelgau, M.M.; Vinicor, F. Trends in the Prevalence and Ratio of Diagnosed to Undiagnosed Diabetes According to Obesity Levels in the U.S. Diabetes Care 2004, 27, 2806–2812. [Google Scholar] [CrossRef] [Green Version]
- Ohishi, M. Hypertension with diabetes mellitus: Physiology and pathology. Hypertens. Res. 2018, 41, 389–393. [Google Scholar] [CrossRef]
- Lee, S.W.; Kim, H.C.; Lee, J.M.; Yun, Y.M.; Lee, J.Y.; Suh, I. Association between changes in systolic blood pressure and incident diabetes in a community-based cohort study in Korea. Hypertens. Res. 2017, 40, 710–716. [Google Scholar] [CrossRef]
- Landsberg, L.; Molitch, M. Diabetes and hypertension: Pathogenesis, prevention and treatment. Clin. Exp. Hypertens. 2004, 26, 621–628. [Google Scholar] [CrossRef] [PubMed]
- Cheung, B.M.; Wat, N.M.; Tso, A.W.; Tam, S.; Thomas, G.N.; Leung, G.M. Association between raised blood pressure and dysglycemia in Hong Kong Chinese. Diabetes Care 2008, 31, 1889–1981. [Google Scholar] [CrossRef] [PubMed] [Green Version]
- Fagot-Campagna, A.; Balkau, B.; Simon, D.; Ducimetière, P.; Eschwège, E. Is insulin an independent risk factor for hypertension? The Paris Prospective Study. Int. J. Epidemiol. 1997, 26, 542–550. [Google Scholar] [CrossRef] [PubMed] [Green Version]
- August, P.; Oparil, S. Hypertension in women. J. Clin. Endocrinol. Metab. 1999, 84, 1862–1866. [Google Scholar] [CrossRef]
- Burt, V.L.; Whelton, P.; Roccella, E.J.; Brown, C.; Cutler, J.A.; Higgins, M.; Labarthe, D. Prevalence of hypertension in the US adult population: Results of the Third National Health and Nutrition Examination Survey, 1988–1991. Hypertension 1995, 25, 305–313. [Google Scholar] [CrossRef]
- Sandberg, K.; Ji, H. Sex differences in primary hypertension. Biol. Sex Differ. 2012, 3. [Google Scholar] [CrossRef] [Green Version]


| Variable | Non-FHD (n = 30,204) | FHD (n = 6986) | p-Value |
|---|---|---|---|
| Demographic characteristics | |||
| Age (years) | 49.9 ± 16.3 | 46.5 ± 13.0 | 0.01 |
| Body mass index (kg/m2) | 23.6 ± 3.4 | 24.0 ± 3.5 | 0.01 |
| Weight (kg) | 62.7 ± 11.8 | 64.2 ± 12.3 | 0.01 |
| Height (m) | 1.63 ± 0.1 | 1.63 ± 0.1 | 0.01 |
| Waist circumference (m) | 0.80 ± 0.1 | 0.81 ± 0.1 | 0.01 |
| Female (%) | 56.6 | 61.8 | 0.01 |
| Social Factors | |||
| Hospital visit rate (%) | 42.4 | 82.4 | 0.69 |
| Stress (%) | 0.01 | ||
| High | 4.2 | 4.7 | |
| Mid-high | 21.4 | 23.8 | |
| Mid-low | 58.2 | 59.7 | |
| Low | 16.2 | 11.8 | |
| Depression (%) | 9.5 | 4.7 | 0.01 |
| Lifestyle Factors | |||
| Drinking (%) | 4.5 | 4.2 | 0.29 |
| Current Smoking (%) | 19.2 | 20.1 | 0.08 |
| Previous Smoking (%) | 20.7 | 17.4 | 0.01 |
| Walking (%) | 33.6 | 31.9 | 0.01 |
| Weight training | 25.1 | 25.2 | 0.84 |
| Clinical Factors | |||
| Systolic blood pressure (mmHg) | 118.6 ± 17.0 | 116.5 ± 15.7 | 0.01 |
| Diastolic blood pressure (mmHg) | 75.8 ± 10.3 | 76.2 ± 10.2 | 0.01 |
| Total cholesterol (mg/dL) | 191.4 ± 35.8 | 194.2 ± 35.7 | 0.01 |
| High density lipoprotein ST2 (mg/dL) | 51.1 ± 12.3 | 51.2 ± 12.3 | 0.84 |
| Triglyceride (mg/dL) | 128.3 ± 91.9 | 134.9 ± 100.6 | 0.01 |
| Low density lipoprotein cholesterol (mg/dL) | 114.6 ± 32.3 | 116.0 ± 32.3 | 0.01 |
| Hemoglobin (g/dL) | 14.0 ± 1.6 | 14.0 ± 1.6 | 0.17 |
| Hematocrit (%) | 42.2 ± 4.2 | 42.2 ± 4.2 | 0.98 |
| Blood urea nitrogen (mg/dL) | 14.3 ± 4.4 | 13.9 ± 4.0 | 0.01 |
| Creatinine (mg/dL) | 0.83 ± 0.2 | 0.80 ± 0.3 | 0.01 |
| Fasting glucose (mg/dL) | 95.2 ± 14.3 | 97.7 ± 19.4 | 0.01 |
| Hypertension (%) | 20.3 | 13.8 | 0.01 |
| Impaired fasting glucose (%) | 23.1 | 26.1 | 0.01 |
| Undiagnosed diabetes (%) | 2.7 | 4.5 | 0.01 |
| Male and Female Combined | |||
|---|---|---|---|
| Variable | B | Odds (95% CI) | p-Value |
| Age | 0.35 | 1.42 (1.27–1.60) | 0.01 |
| Male | 0.68 | 1.97 (1.54–2.52) | 0.01 |
| Body mass index | 0.95 | 2.59 (2.18–3.07) | 0.01 |
| Waist circumference | 0.76 | 2.14 (1.87–2.45) | 0.01 |
| Hypertension | 1.12 | 3.07 (2.34–4.02) | 0.01 |
| Drinking | 1.26 | 3.53 (2.39–5.21) | 0.01 |
| Current Smoking | 0.30 | 1.35 (1.02–1.79) | 0.04 |
| Previous Smoking | 0.48 | 1.62 (1.22–2.16) | 0.01 |
| Walking | −0.16 | 0.85 (0.65–1.12) | 0.25 |
| Weight training | −0.19 | 0.83 (0.62–1.11) | 0.20 |
| Hospital visit rate | 0.06 | 1.06 (0.75–1.51) | 0.73 |
| Stress | −0.02 | 0.98 (0.82–1.16) | 0.80 |
| Depression | −0.12 | 0.89 (0.55–1.44) | 0.64 |
| Male | |||
| Age | 0.41 | 1.51 (1.28–1.78) | 0.01 |
| Body mass index | 0.56 | 1.75 (1.36–2.25) | 0.01 |
| Waist circumference | 0.87 | 2.38 (1.70–3.35) | 0.01 |
| Hypertension | 1.13 | 3.08 (2.13–4.46) | 0.01 |
| Drinking | 0.92 | 2.51 (1.62–3.89) | 0.01 |
| Current Smoking | −0.12 | 0.89 (0.63–1.25) | 0.50 |
| Previous Smoking | 0.28 | 1.32 (0.94–1.86) | 0.11 |
| Walking | −0.10 | 0.90 (0.63–1.29) | 0.58 |
| Weight training | −0.28 | 0.75 (0.52–1.08) | 0.13 |
| Hospital visit rate | 0.05 | 0.95 (0.57–1.59) | 0.86 |
| Stress | 0.01 | 1.01 (0.79–1.28) | 0.96 |
| Depression | 0.86 | 0.42 (0.13–1.35) | 0.15 |
| Female | |||
| Age | 0.37 | 1.45 (1.22–1.72) | 0.01 |
| Body mass index | 1.26 | 3.53 (2.77–4.50) | 0.01 |
| Waist Circumference | 1.80 | 6.04 (4.15–8.79) | 0.01 |
| Hypertension | 1.08 | 2.94 (1.97–4.40) | 0.01 |
| Drinking | 1.54 | 4.65 (1.78–12.16) | 0.01 |
| Current Smoking | 0.14 | 1.15 (0.55–2.38) | 0.72 |
| Previous Smoking | −0.23 | 0.80 (0.35–1.84) | 0.60 |
| Walking | −0.32 | 0.73 (0.48–1.11) | 0.73 |
| Weight training | −0.46 | 0.63 (0.37–1.07) | 0.09 |
| Hospital visit rate | 0.04 | 1.04 (0.64–1.69) | 0.88 |
| Stress | 0.05 | 1.05 (0.82–1.36) | 0.70 |
| Depression | 0.32 | 1.38 (0.81–2.37) | 0.24 |
| Male and Female Combined | |||
|---|---|---|---|
| Variable | B | Odds (95% CI) | p-Value |
| Age | 0.25 | 1.28 (1.12–1.46) | 0.01 |
| Male | 0.30 | 1.35 (1.02–1.79) | 0.03 |
| Body mass index | 0.55 | 1.74 (1.36–2.23) | 0.01 |
| Waist circumference | 0.38 | 1.46 (1.21–1.76) | 0.01 |
| Drinking | 0.86 | 2.37 (1.56–3.60) | 0.01 |
| Hypertension | 0.56 | 1.76 (1.30–2.37) | 0.01 |
| Male | |||
| Age | 0.36 | 1.43 (1.20–1.71) | 0.01 |
| Body mass index | 0.40 | 1.50 (1.06–2.12) | 0.02 |
| Waist circumference | 0.45 | 1.58 (1.01–2.46) | 0.05 |
| Drinking | 0.78 | 2.18 (1.38–3.42) | 0.01 |
| Hypertension | 0.70 | 2.02 (1.36–3.01) | 0.01 |
| Female | |||
| Age | 0.26 | 1.30 (1.09–1.55) | 0.01 |
| Body mass index | 0.86 | 2.37 (1.67–3.35) | 0.01 |
| Waist circumference | 0.83 | 2.29 (1.36–3.86) | 0.01 |
| Drinking | 1.40 | 4.07 (1.44–11.55) | 0.01 |
| SMP | ||||||||
| Point | Sensitivity | Specificity | PPV | NPV | PIR | NIR | Youden | AUC |
| 45 | 95.8 | 23.2 | 5.7 | 99.1 | 1.25 | 0.18 | 19.0 | 72.9 |
| 57 | 87.5 | 47.8 | 7.5 | 98.8 | 1.68 | 0.26 | 35.3 | 72.9 |
| 98 | 50.0 | 76.2 | 9.2 | 96.9 | 2.10 | 0.66 | 26.2 | 72.9 |
| SMM | ||||||||
| 46 | 100 | 23.9 | 8.3 | 100 | 1.31 | 0.00 | 23.9 | 76.23 |
| 60 | 92.3 | 48.1 | 11 | 98.9 | 1.78 | 0.16 | 40.4 | 76.23 |
| 75 | 65.4 | 71.0 | 13.5 | 96.7 | 2.26 | 0.49 | 36.4 | 76.23 |
| SMF | ||||||||
| 38 | 100 | 13.8 | 3.9 | 100 | 1.16 | 0.00 | 13.8 | 77.94 |
| 59 | 86.4 | 51.0 | 5.9 | 99.1 | 1.76 | 26.7 | 37.4 | 77.94 |
| 82 | 68.2 | 76.4 | 9.3 | 98.6 | 2.89 | 41.6 | 44.6 | 77.94 |
Publisher’s Note: MDPI stays neutral with regard to jurisdictional claims in published maps and institutional affiliations. |
© 2020 by the authors. Licensee MDPI, Basel, Switzerland. This article is an open access article distributed under the terms and conditions of the Creative Commons Attribution (CC BY) license (http://creativecommons.org/licenses/by/4.0/).
Share and Cite
Ryu, K.S.; Kang, H.Y.J.; Lee, S.W.; Park, H.W.; You, N.Y.; Kim, J.H.; Hwangbo, Y.; Choi, K.S.; Cha, H.S. Screening Model for Estimating Undiagnosed Diabetes among People with a Family History of Diabetes Mellitus: A KNHANES-Based Study. Int. J. Environ. Res. Public Health 2020, 17, 8903. https://doi.org/10.3390/ijerph17238903
Ryu KS, Kang HYJ, Lee SW, Park HW, You NY, Kim JH, Hwangbo Y, Choi KS, Cha HS. Screening Model for Estimating Undiagnosed Diabetes among People with a Family History of Diabetes Mellitus: A KNHANES-Based Study. International Journal of Environmental Research and Public Health. 2020; 17(23):8903. https://doi.org/10.3390/ijerph17238903
Chicago/Turabian StyleRyu, Kwang Sun, Ha Ye Jin Kang, Sang Won Lee, Hyun Woo Park, Na Young You, Jae Ho Kim, Yul Hwangbo, Kui Son Choi, and Hyo Soung Cha. 2020. "Screening Model for Estimating Undiagnosed Diabetes among People with a Family History of Diabetes Mellitus: A KNHANES-Based Study" International Journal of Environmental Research and Public Health 17, no. 23: 8903. https://doi.org/10.3390/ijerph17238903