Article

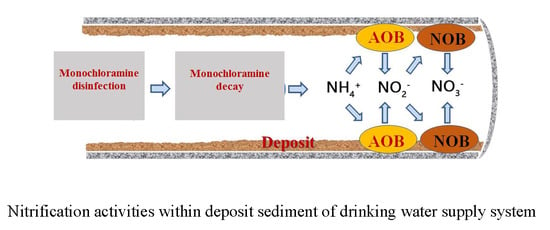
Chloramine Disinfection-Induced Nitrification Activities and Their Potential Public Health Risk Indications within Deposits of a Drinking Water Supply System

1
School of Civil Engineering, Suzhou University of Science and Technology, Suzhou 215000, China
2
School of Environmental Science and Engineering, Jiangsu Key Laboratory of Environmental Science and Technology, Suzhou University of Science and Technology, Suzhou 215009, China
3
Key Laboratory of Cleaner Production and Comprehensive Utilization of Resources, China National Light Industry, Department of Environmental Science and Engineering, Beijing Technology and Business University, Beijing 100037, China
*
Author to whom correspondence should be addressed.
Int. J. Environ. Res. Public Health 2020, 17(3), 772; https://doi.org/10.3390/ijerph17030772
Submission received: 25 December 2019 / Revised: 20 January 2020 / Accepted: 22 January 2020 / Published: 26 January 2020
(This article belongs to the Special Issue Water and Health)

Abstract

:
Microsensors were applied to study the diffusion reaction and activity of a nitrogen species of deposit sediment from a drinking water supply system. Microprofiles of dissolved oxygen (DO), NH4+-N, NO3-N, and NO2N in the sediment indicated that the DO concentration decreased from the highest at the sediment surface to zero at the bottom of the sediment. Similarly, with the increase of depth, NH4+-N initially increased rapidly and then decreased slowly, while the concentration of NO3-N reached a maximum at around 6000 μm and then decreased to about 0.1 mg·L−1 near the bottom of the sediment. Almost no change was observed for NO2-N. The decrease of NH4+-N and DO corresponded well with the increase of NO3-N. Furthermore, based on a consumption and production rate analysis, DO has always been consumed; the NH4+-N consumption rate increased rapidly within 0–1000 μm, reaching about 14 mg·L−1·S−1·10−9. A small amount of NH4+-N was produced in 2000–6000 μm, which could be attributed to denitrification activity. There was no change deeper than 6000 μm, while NO3-N was produced at a depth between 0 and 6000 μm and was consumed in the deeper zone. At the depth of 9000 μm, the NO3-N consumption reached a maximum of 5 mg·L−1·S−1·10−9. The consumption of DO and NH4+-N, which corresponded with the production of NO3-N in a specific microscale range within the sediment, demonstrated nitrification and denitrification activities. In addition, the time required for the diffusion of only DO, NH4+-N, NO3-N, and NO2-N was estimated as 14 days; however, in the practical, even after 60 days of operation, there was still a continuous reaction, which provided further evidence towards microbial activities within the sediment.

Graphical Abstract

1. Introduction

Various water quality problems in water supply networks remain a huge challenge for water supply industries around the world. Due to the concerns with disinfection by-products (DBPs) and stringent limits on DBPs in drinking water systems, more and more water plants are using chloramine as a secondary disinfectant instead of chlorine disinfection. For example, many water treatment plants in the United States have gradually shifted from chlorine disinfection to chloramine disinfection in order to meet the requirements of the disinfection/DBPs regulations. Several European countries also use chloramine as a final disinfectant. This aspect has led to different public health issues, with a request for derogations from the water quality standards [1,2]. However, water supply systems using chloramine disinfection generally have water quality problems that are caused by biological nitrification [3,4]. Firstly, due to the decay of chloramine, ammonia nitrogen will be released into the water, and incomplete nitrification will lead to the accumulation of nitrite nitrogen, which brings about potential human health hazards [5,6]. Secondly, biological nitrification can promote the growth of ammonia-oxidizing bacteria (AOB) and nitrite-oxidizing bacteria (NOB) and promote the formation of pipe network biofilm or sediment, providing a more proper environment for the large-scale reproduction of bacteria and thereby reducing the biological stability of drinking water [7,8]. In addition, nitrification will consume a large amount of dissolved oxygen, lower the pH value, and accelerate pipeline corrosion, resulting in "red water" problems [9].
Although the control of nitrification in drinking water piping networks has attracted widespread public attention, most current research focuses on the macroscopic control of nitrification in pipe networks, including the formation of pipe network biofilm and the factors that influence nitrification. Water treatment plants typically control the growth of bacteria in the pipe network by adding chlorine and maintaining a certain amount of residual chlorine at the ends of the pipe network. However, maintaining the amount of residual chlorine in the water distribution network does not necessarily control the growth and reproduction of bacteria in the biofilm or sediment of the pipe network. LeChevallier [10] found that even with sufficient residual chlorine (3 mg·L−1), the growth and change in activity of biofilm in a pipe network system cannot be effectively controlled. On the one hand, the rate of chloramine decay in the presence of biofilm is about half of that in tap water [11], and the presence of the biofilm leads to a decrease in the disinfectant molecules that can diffuse into the interior of the biofilm. On the other hand, nitrifying bacteria are widely propagated in the distribution network of drinking water disinfected by chloramine [12,13,14]. The formation of biofilms or sediments in the pipeline and a large number of nutrients in the pipe network that can be used by nitrifying bacteria are beneficial to the survival of nitrifying bacteria in a water supply system disinfected with chloramine. Nitrifying bacteria in the attached state are much more (2 to 100 times) resistant to disinfectants than nitrifying bacteria in the suspended state [15]. These precipitations or sediments provide a habitat for the growth and reproduction of nitrifying bacteria, and the nitrifying bacteria are protected by sediments to avoid the inactivation of disinfectants [16,17].
In order to control nitrification and decrease the interaction of AOB in the water and AOB in the biofilm of the pipe wall [18], researchers have investigated factors that affect nitrification activities, including pH, water temperature, chloramine concentration, ammonia nitrogen concentration, organic matter in the water, the hydraulic retention time of the pipe network, the pipeline’s properties, biofilm of the pipe wall, and the disinfection process [19,20,21,22,23,24]. Other researchers have studied the diversity of nitrifying bacteria in the network from the perspective of microbial characteristics, and have also studied the relationship between different bacteria and disinfectant concentration [25]. Studies [26] have shown that the presence of AOB is almost undetectable in water that is treated with chloramine in water plants. However, using molecular biology techniques to analyze the community structure of nitrifying bacteria, it was found that the dominant community in the ammonia-oxidizing bacteria population (Nm. Oligotropha) exists at the end of the pipe network. Some other studies have used microelectrodes to analyze the distribution of chemical parameters in the biofilm of drinking water networks. De Beer has developed chlorine microelectrodes and used them to measure the chlorine permeability of biofilms [27]; Lee and Pressman et al. prepared a chlorine microelectrode that can be used to measure chloramines in biofilms, and studied the penetration of free chlorine and chloramines into biofilms by free chlorine and chloramine microelectrodes [28,29,30,31].
Based on previous research, it can be seen that these relationships between nitrifying bacteria and disinfectants hidden in the biofilm or sediment of the pipe network are not clear. Little research has been conducted into the biological nitrification activities or the diffusion of nitrogen species in the microscopic environment of the pipe network. Thus, studies on the diffusion reaction and nitrification biological activities in the microenvironment of the pipe network have high theoretical value and practical significance for ensuring water supply safety.
In this study, we analyzed the diffusion of nitrogen species and nitrification activities in the microscopic environment of sediments in water supply networks. Microsensors with tip diameters as small as several micrometers were used to obtain the concentration profiles of characteristic parameters, including ammonia nitrogen, nitrate, nitrite, and dissolved oxygen, in the vertical direction of the sediment’s microenvironment. The concentration distribution of the nitrogen species in the sediment’s microenvironment and its relationship with biological nitrification activities may be linked.

2. Materials and Methods

2.1. Sample Preparation

A deposit sediment sample (provided by Wuxi Zhongqiao Drinking Water Treatment Plant, Jiangsu Province, China) with a size of 2 cm (20,000 µm) was placed in a sterilized glass cup with dimensions of 6 cm (diameter) × 6 cm (depth). Disinfectant monochloramine (4 mg·L−1) was continuously flowing into the reactor, and the flow rate was kept at 4 mL·min−1. The reactor was operated at room temperature (21–23 °C) under steady-state conditions (pH 8.0, 5 mM boric acid/sodium hydroxide buffer solution, a 4 mL·min−1 flowrate, and 4 mgCl2·L−1 monochloramine). Microsensor profiles of dissolved oxygen (DO), NH4+-N, NO3-N, and NO2-N were measured.

2.2. Microsensor Fabrication

A combined amperometric O2 microsensor was developed based on previous studies [32,33,34]. Calibration of the O2 microsensor was performed with N2 and pure O2. Information on the fabrication and calibration of the NH4+-N, NO3N, and NO2-N microsensors can be found in [35,36].

2.3. Microsensor Measurements

Each microsensor was calibrated before and after measurements. During measurements, microsensors were mounted on a micro-manipulator (Model M3301R, World Precision Instruments, Inc., Sarasota FL, USA). Firstly, the microsensor’s tip was placed above the water cap of the reactor. Through controlling the micro-manipulator, the microsensor was moved towards the sediment surface, which was observed through the microscope (Model: Stemi SV11, Carl Zeiss, Jena, Germany). The step size of 100 to 200 μm was selected with enough resolution for the 2 cm sediment measurement.

2.4. Flux Calculation

Production and consumption rates of DO, NH4+-N, NO3-N, and NO2-N were calculated based on Fick’s second law of diffusion [37,38,39], which is shown in the following equation:
C ( z , t ) t = D s × 2 C ( z , t ) z 2 R ( z ) + P ( z )
where C(d,t) stands for the concentration at time t and depth d, Ds represents the diffusion coefficient, R is the consumption rate, and P is the production rate.
Assuming that the reaction was at a steady state:
C ( d , t ) t = 0
Equation (l) can be rewritten as:
A c t i v i t y ( d ) = D z × 2 C ( d , t ) z 2 = R ( d ) P ( d )
where A(d) is the activity at depth z. A negative A(d) value reflects net production activity and a positive A(d) reflects net consumption activity. The concentration profiles were analyzed mathematically by means of a discrete version of Fick’s first law:
J ( d + 1 / 2 Δ d ) = D d C ( d + Δ d ) C ( d ) Δ d
where J(d+1/2∆d) is the flux at the depth between two data points, C is the concentration, and ∆d is the vertical distance between the two data points.
The D (diffusion coefficient) of NH4+, NO3, and DO was 1.38−10−5 cm2∙s−1, 1.23 × 10⁻⁵ cm2∙s−1, and 2.09 × 10⁻⁵ cm2·s−1, respectively [40]. A flux profile was derived from the concentration profile using Equation (4). The activity profile was then derived from the flux profile:
A ( d ) = [ J ( d 1 / 2 Δ d ) J ( d + 1 / 2 Δ d ) ] Δ d

2.5. Diffusion Analysis

In order to investigate the chemical diffusion rate within the sediment, a simple case with the assumption that no reactions were occurring and a nonlinear equation [41] was used to simulate the chemical diffusion time within the sediment. The determination of the expected time of chemical diffusion was calculated based on the following:
C C 0 C 1 C 0 = 1 4 π n = 0 ( 1 ) n 2 n + 1 e x p { D ( 2 n + 1 ) 2 π 2 t 4 l 2 } c o s ( ( 2 n + 1 ) π x 2 l )
In Equation (6), l is the sediment depth and diffusion length. d represents the distance above an impermeable base; for example, d is defined as 0 μm at the bottom of the sediment, and d equals 20,000 μm at the sediment surface. C represents the concentration at location d, C0 is the concentration in the liquid layer, C1 is the constant concentration in the bulk water and is equivalent to Cs, D is the diffusion coefficient, and t represents time.
In the case that only diffusion occurs within the sediment—for example, if chemicals are diffusing from the liquid layer into the sediment—C0 should be zero, so Equation (6) can be written as C C 0 C 1 C 0 = C C 1 = C C s . If chemicals are diffusing from the sediment into the liquid layer, C0 is a known value and the surface concentration is assumed to be zero, C1 = Cs = 0, and thus Equation (6) can be rewritten to Equation (7), which was implemented in R software to obtain the estimated diffusion time.
C C 0 C 1 C 0 = C C 0 C 0 = C C 0 + 1

3. Results and Discussion

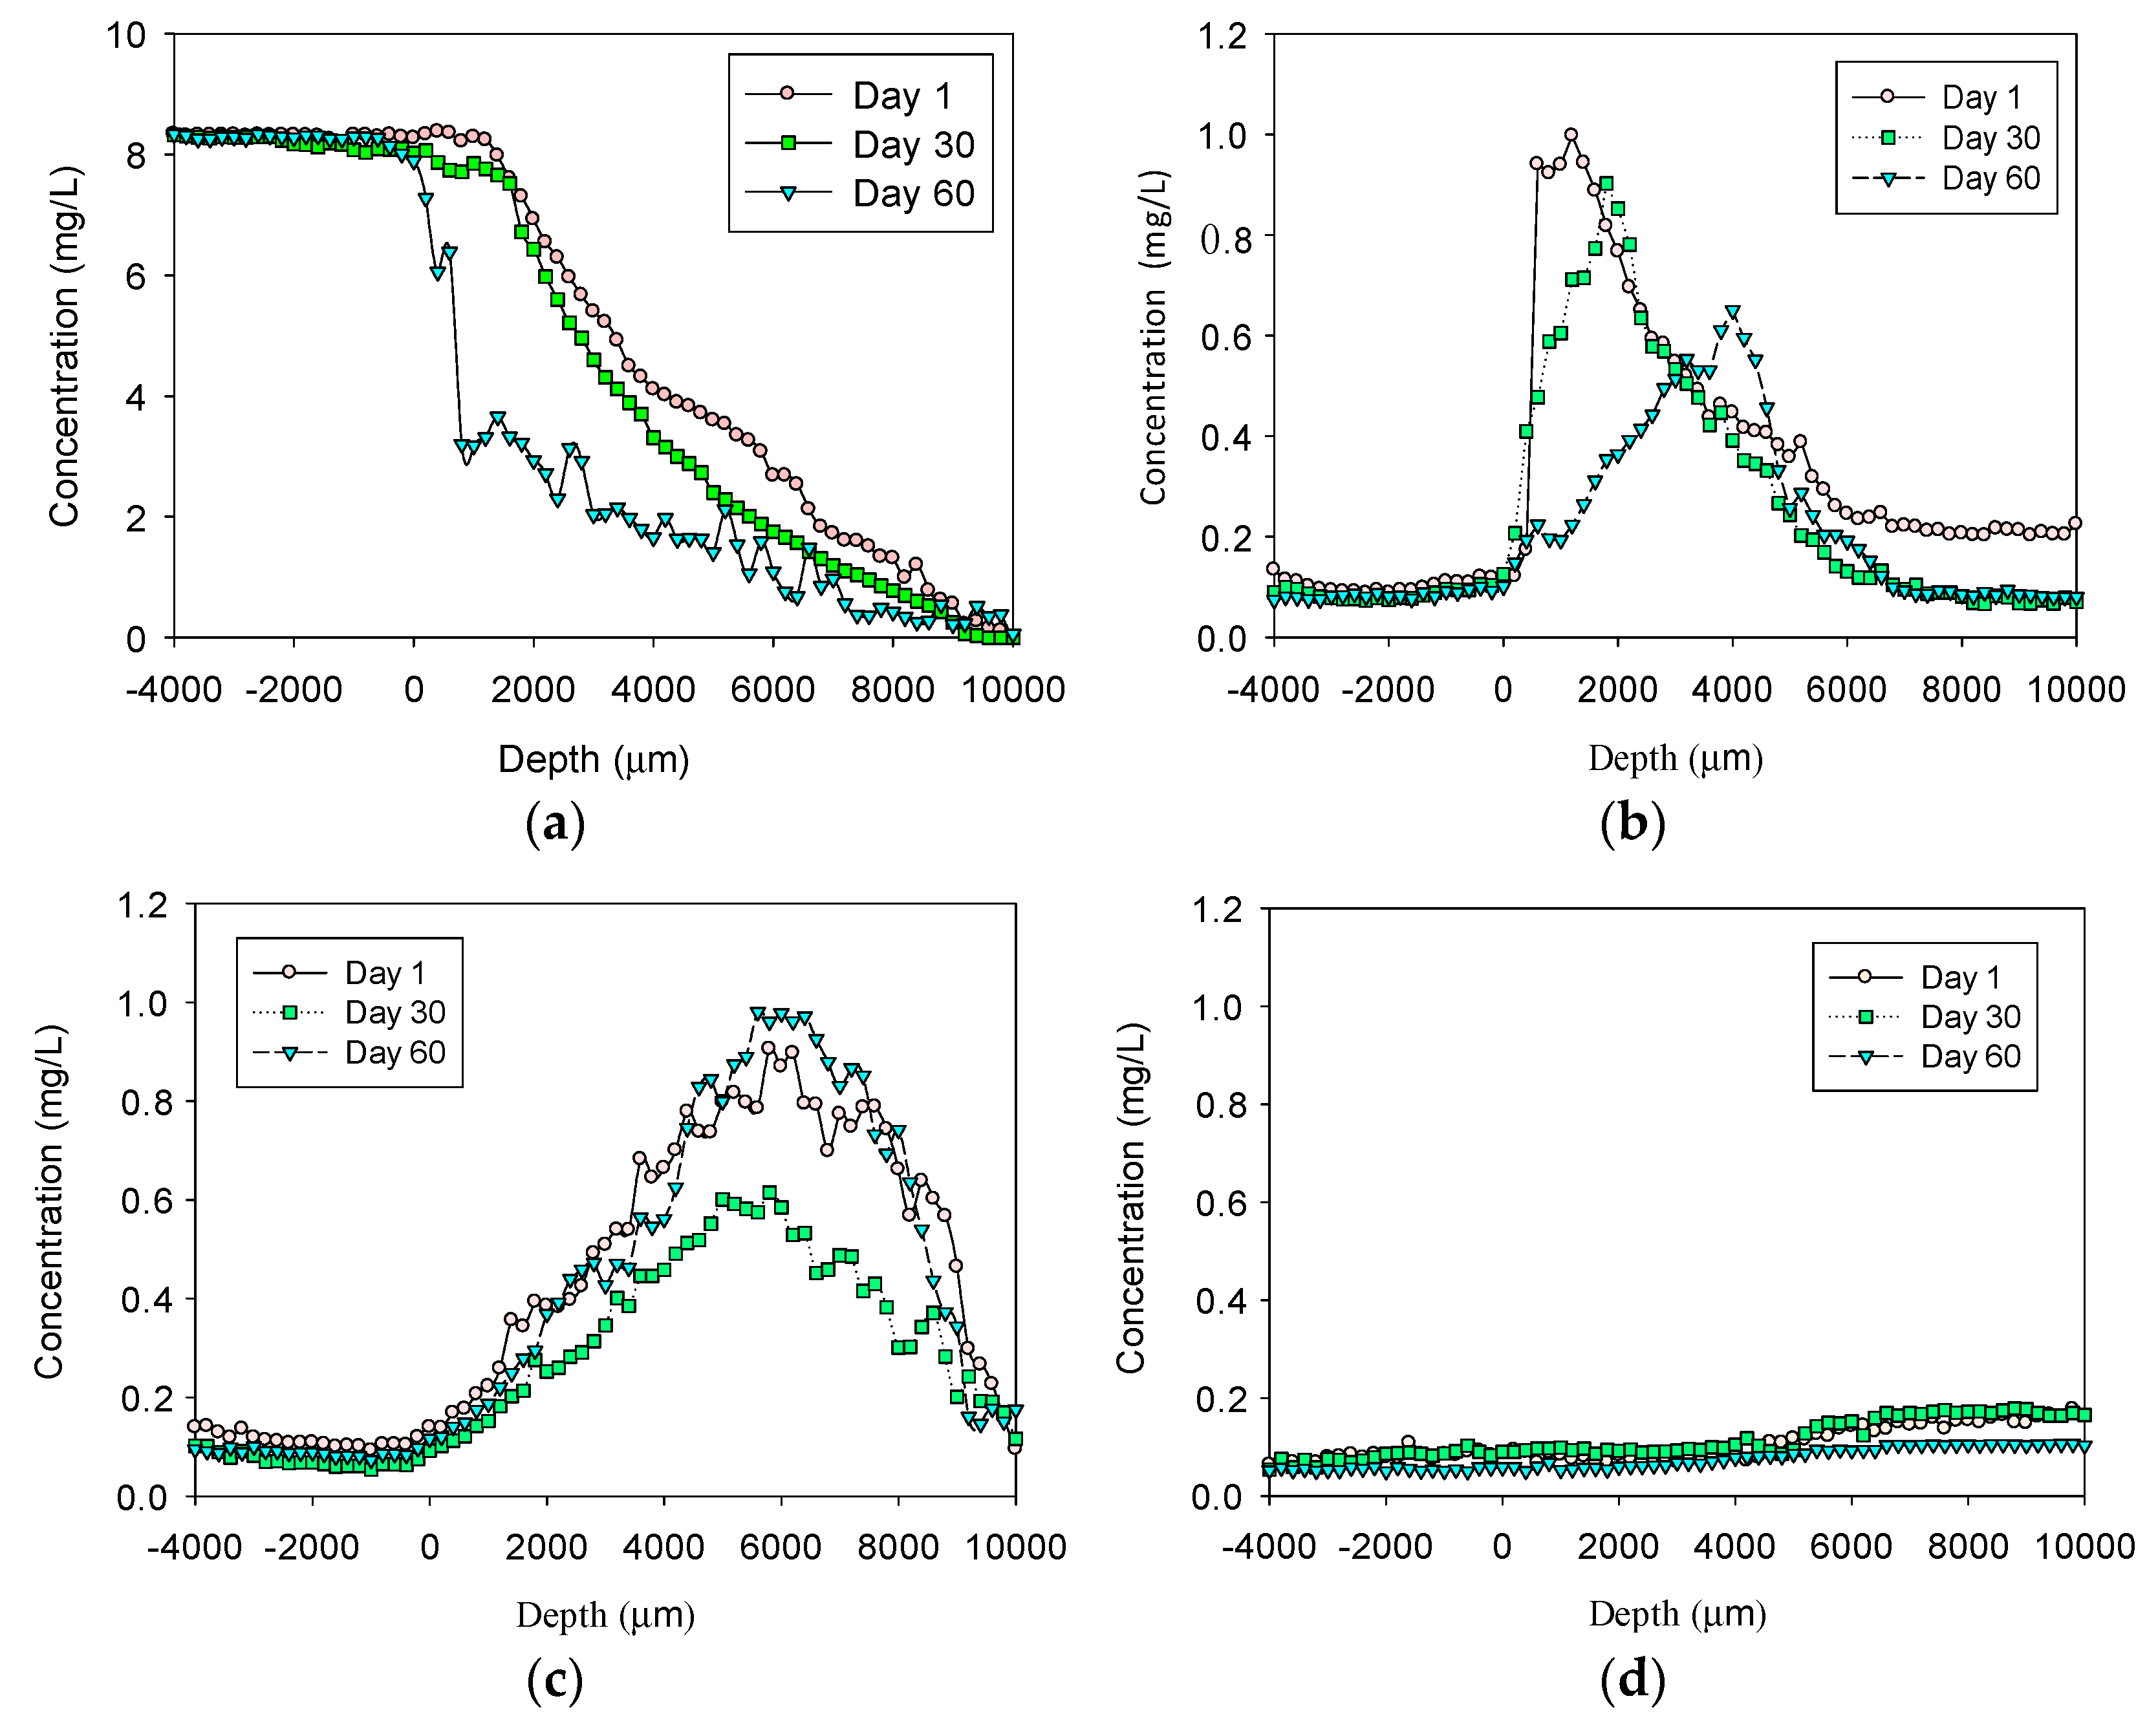
3.1. Microsensor Measurements of DO and Nitrogen Species

Microsensor profiles of DO, NH4+-N, NO3-N, and NO2-N in the sediment are shown in Figure 1. It can be seen in Figure 1a) that the DO concentration decreased from the highest value near the sediment surface to zero near the bottom of the sediment. For example, at Day 1, at 6000 μm below the interface between the water and the sediment, the DO value dropped from 8.3 mg·L−1 to about 2.68 mg·L−1; at Day 30, at the same depth of 6000 μm, the DO dropped to 1.75 mg·L−1; at Day 60, at the same depth of 6000 μm, the DO became 1 mg·L−1. At Day 60, within 1000 μm, the DO dropped sharply to about 3.18 mg·L−1 and continuously decreased to 1.09 mg·L−1 at 6000 μm, indicating a rapid consumption of DO and potential oxidation activity. Meanwhile, the concentration of NH4+-N (Figure 1b) initially increased rapidly and then decreased slowly. The microsensor profile’s tendency for Day 1 and Day 30 were similar; the NH4+-N concentration reached a maximum of approximately 1.0 mg·L−1 at around 2000 μm below the interface and then decreased to zero near the bottom of the sediment. At Day 60, the maximum value decreased from about 0.6 mg·L−1 to about 0.2 mg·L−1 around 6000 μm before slowly decreasing. Correspondingly, the concentration profiles of NO3-N (Figure 1c) increased first and then decreased, indicating the production of nitrate due to nitrification. They then decreased to the deeper zone of the sediment, where DO was less than 2 mg·L−1, which could be attributed to denitrification activity. There was no significant change for NO2-N (Figure 1d).

3.2. Estimation of Production and Consumption Rates

Figure 2 shows the net specific consumption and production rates of DO, NH4+-N, NO3-N, and NO2-N. As seen in Figure 2a, DO was consumed across the whole sediment sample, and the consumption of DO decreased gradually with the increase of depth. NH4+-N consumption (Figure 2b) increased rapidly within 0–1000 μm, and reached about 14 mg·L−1·S−1·10−9 at 200 μm. A small amount of NH4+-N was produced at 2000–6000 μm, which may be attributed to denitrification, while NO3-N was produced in the range of 0–6000 μm and consumed in the range of 6000–10,000 μm (Figure 2c). At the depth of 9000 μm, the consumption rate reached a maximum value of 5 mg·L−1·S−1·10−9. The consumption and production of NH4+-N and NO3-N directly reflect that nitrification occurred in the oxic zone of the sediment, while denitrification was expected in the anoxic area in the deeper zone. Almost no change was observed for NO2-N, as shown in Figure 2d, which indicates that full nitrification occurred within the sediment.

3.3. Diffusion Analysis

When considering the diffusion and reaction of nitrogen species within the sediment, it is quite important to estimate the diffusion time through the sediment without reactions. In the case of diffusion only and using water diffusion coefficients for each chemical, the model estimated the times required for reaching the surface or bottom of the sediment, as shown in Figure 3. It is noted that almost no nitrite nitrogen was produced or detected by the microsensors; therefore, only ammonium nitrogen and nitrate nitrogen diffusion were simulated in the present study.
For example, the diffusion time required for 8.3 mg·L−1 of DO within the sediment and for 1.5 mg·N·L−1 of ammonium or nitrate both were estimated as seven days. A measurable concentration of DO, ammonium nitrogen, and nitrate nitrogen at the bottom of the sediment would be expected after approximately six hours. Complete diffusion of these chemicals out of the sediment would also be expected to be accomplished after approximately seven days (one week).
It is noted that diffusion occurred through the pores of sediment in the practical; therefore, the diffusion coefficient values in sediment (Ds) were usually estimated as twice that in water. As a result, the required diffusion time would be twice that needed in the water phase. Therefore, a measurable concentration of DO, ammonium nitrogen, and nitrate nitrogen at the bottom of the sediment would be expected after approximately 12 hours. Full diffusion of these chemicals out of the sediment was expected to finish after approximately 14 days (two weeks). Compared to the microsensor profiles shown in Figure 1, it is obvious that not only did diffusion occur within the sediment, for example in Figure 1a, but even after six months, there remained around 6 mg·L−1 of DO at the interface of the sediment, and, as shown in Figure 1c, nitrate was always present but did not diffuse out of the sediment at either Day 30 or Day 60, demonstrating active biological reactions within the sediment.

4. Conclusions

Microelectrodes of DO, NH4+-N, NO3-N, and NO2-N were successfully used to obtain the gradient profiles within precipitated deposits from a drinking water supply system. The decrease and consumption of DO and NH4+-N accompanied by the increase and production of NO3-N indicated nitrification activities within the sediment deposit. Nitrification tended to occur within the oxic zone of the sediment, while denitrification occurred in the deeper anoxic zone. The complete diffusion of DO and nitrogen species was not observed, which indicated that microbial functions were active. A measurable concentration of DO, NH4+-N, and NO3-N at the bottom of the sediment would be expected after approximately 12 hours, and full diffusion would occur after approximately 14 days. The present study contributes to our understanding of nitrification activities within the microenvironment of sediment deposits, allowing for a better understanding of biochemical mechanisms in drinking water supply networks. The microbial activities remained active even after several months’ disinfection, which indicated the potential for public health risks and water safety issues within drinking water supply systems. Future studies on the release of chemicals or microorganisms from deposits into the water phase need to be performed. Further studies need to be conducted for the strategic control of biological stability. In practice, it is necessary to perform regular inspections and cleaning of the deposits from the distribution networks to avoid public health risks due to the potential release of microorganisms from deposits into the water phase.

Author Contributions

All authors contributed significantly to this article. X.L. analyzed the data and wrote the manuscript. H.L. contributed to the revision of the paper. N.D. substantially contributed to the conception and design of the work. All authors have read and agreed to the published version of the manuscript.

Funding

This research was funded by the National Nature Science Foundation of China (Grant No. 51708381); the Natural Science Foundation of Jiangsu Province (Grant No. BK20181466); the Open Research Fund Program of Key Laboratory of Cleaner Production and Integrated Resource Utilization of China National Light Industry (Grant No. CP-2018-YB1), the People’s Livelihood Projects of the Suzhou Science and Technology Bureau (Grant No. SS2019028); the Environmental Protection Project from the Suzhou Ecological and Environmental Protection Bureau (Grant No. B201903); the Entrepreneurship and Innovation Project from Jiangsu Province (Grant No. 491911202); Research Innovation Funding from Suzhou University of Science and Technology, Jiangsu Province (Grant Nos. 331711203 and 331711105).

Acknowledgments

The authors appreciate the funding by the National Nature Science Foundation of China (Grant No. 51708381); the Natural Science Foundation of Jiangsu Province (Grant No. BK20181466); the Open Research Fund Program of Key Laboratory of Cleaner Production and Integrated Resource Utilization of China National Light Industry (Grant No. CP-2018-YB1), the People’s Livelihood Projects of the Suzhou Science and Technology Bureau (Grant No. SS2019028); the Environmental Protection Project from the Suzhou Ecological and Environmental Protection Bureau (Grant No. B201903); the Entrepreneurship and Innovation Project from Jiangsu Province (Grant No. 491911202); Research Innovation Funding from Suzhou University of Science and Technology, Jiangsu Province (Grant Nos. 331711203 and 331711105), and the Jiangsu Province Joint Education Program High-Standard Example Project.

Conflicts of Interest

The authors declare that they have no conflict of interest regarding the publication of this paper.

References

  1. Azara, A.; Castiglia, A.; Piana, A.; Masia, M.D.; Palmieri, A.; Arru, B.; Maida, G.; Dettori, M. Derogation from drinking water quality standards in Italy according to the European Directive 98/83/EC and the Legislative Decree 31/2001—A look at the recent past. Ann. Ig. 2018, 30, 517–526. [Google Scholar]
  2. Dettori, M.; Azara, A.; Loria, E.; Piana, A.; Masia, M.D.; Palmieri, A.; Cossu, A.; Castiglia, P. Population distrust of drinking water safety. Community outrage analysis, prediction and management. Int. J. Environ. Res. Public Health 2019, 16, 1004. [Google Scholar] [CrossRef] [PubMed] [Green Version]
  3. Rak, J.R.; Pietrucha-Urbanik, K. An approach to determine risk indices for drinking water–study investigation. Sustainability 2019, 11, 3189. [Google Scholar] [CrossRef] [Green Version]
  4. Pietrucha-Urbanik, K.; Żelazko, A. Approaches to assess water distribution failure. Period Polytech-Civ. 2017, 61, 632–639. [Google Scholar] [CrossRef] [Green Version]
  5. Zhao, L.L.; Li, X.; Yang, Y.L.; Luo, J.H.; Li, G.B.; Wang, C.H. Advances of nitrification studies in drinking water distribution system. China Water Wastew. 2012, 28, 24–28. (In Chinese) [Google Scholar]
  6. Zhou, L.L. Biofilm and Nitrification Control in Water Supply System. Ph.D. Thesis, Harbin Institute of Technology, Harbin, China, 2010. (In Chinese). [Google Scholar]
  7. Prest, E.I.; Hammes, F.; van Loosdrecht, M.C.M.; Vrouwenvelder, J.S. Biological stability of drinking water: controlling factors, methods, and challenges. Front. Microbiol. 2016, 7, 1–24. [Google Scholar] [CrossRef]
  8. Sun, H.F.; Shi, B.Y.; Wang, D.S. Characteristics of biofilm formed on the wall of drinking water supply piping system and its impact on water quality. China Water Wastew. 2011, 27, 40–45. (In Chinese) [Google Scholar]
  9. Zhang, X.Y.; Liu, W.J.; Gao, S.H.; Zhang, L. Simulation impact of piping material and residual chlorine on biofilm formation in drinking water distribution system. China Environ. Sci. 2006, 26, 303–306. (In Chinese) [Google Scholar]
  10. LeChevallier, M.W.; Lowry, C.D.; Lee, R.G. Disinfecting biofilm in a model distribution system. J. Am. Water Work. Ass. 1990, 82, 8799. [Google Scholar] [CrossRef]
  11. LeChevallier, M.W.; Cawthon, C.D.; Lee, R.G. Factors promoting survival of bacteria in chlorinated water supplies. Appl. Environ. Microb. 1988, 54, 649–654. [Google Scholar] [CrossRef] [Green Version]
  12. AWWAF. Fundamentals and Control of Nitrification in Chloraminated Drinking Water Distribution Systems (AWWA Manual M56); American Water Works Association: Denver, CO, USA, 2006. [Google Scholar]
  13. Wahman, D.G.; Pressman, J.G. Nitrification in chloraminated drinking water distribution systems: factors affecting occurrence. Compreh. Water Qual. Purif. 2014, 2, 283–294. [Google Scholar]
  14. Zhang, Y.; Love, N.; Edwards, M. Nitrification in drinking water systems. Crit. Rev. Environ. Sci. Technol. 2009, 39, 153–208. [Google Scholar] [CrossRef]
  15. Zhou, L.L.; Liu, W.J.; Zhang, Y.J. Comparison of activity between attached bacteria and suspended bacteria in drinking water distribution system. China Water Wastew. 2007, 23, 37–40. (In Chinese) [Google Scholar]
  16. Chiao, T.H.; Clancy, T.M.; Pinto, A.; Xi, C.; Raskin, L. Differential resistance of drinking water bacterial populations to monochloramine disinfection. Environ. Sci. Technol. 2014, 48, 4038–4047. [Google Scholar] [CrossRef]
  17. Cochran, W.; McFeters, G.; Stewart, P. Reduced susceptibility of thin Pseudomonas aeruginosa biofilms to hydrogen peroxide and monochloramine. J. Appl. Microbiol. 2000, 88, 22–30. [Google Scholar] [CrossRef] [Green Version]
  18. van der Wielen, P.W.J.J.; Lut, M.C. Distribution of microbial activity and specific microorganisms across sediment size fractions and pipe wall biofilm in a drinking water distribution system. Water Sci. Technol. Water Sup. 2016, 16, 896–904. [Google Scholar] [CrossRef]
  19. Reagan, J.M. Microbial Ecology of Nitrification in Chloraminated Drinking Water Distribution Systems. Ph.D. Thesis, University of Wisconsin, Madison, WI, USA, 2001. [Google Scholar]
  20. Wang, J.; Yu, J. Nitrification and Its Control Strategies in Water Supply System. Master’s Thesis, Hunan University, Changsha, China, 2009. (In Chinese). [Google Scholar]
  21. Zhang, Y.G.; Zhou, L.L.; Li, W.Y. Nitrification in chloraminated drinking water distribution system and its control. China Water Wastew. 2008, 24, 6–9. (In Chinese) [Google Scholar]
  22. Zhang, Y.; Zhou, L.; Zeng, G. Impact of total organic carbon and chlorine to ammonia ratio on nitrification in a bench-scale drinking water distribution system. Front. Environ. Sci. Eng. 2010, 4, 430–437. [Google Scholar] [CrossRef]
  23. Zhou, L.L.; Zhang, Y.J.; Li, G.B. Effect of pipe material and low level disinfectants on biofilm development in a simulated drinking water distribution system. J. Zhejiang Univ. Sci. A 2009, 10, 725–731. (In Chinese) [Google Scholar] [CrossRef]
  24. Zhou, L.L.; Zhou, Y.G.; Ye, H.X. Controlling Effect of Chloramines, and Chlorite on Nitrification in Simulated Drinking Water Distribution System. J. Hunan Univ. 2012, 39, 69–73. (In Chinese) [Google Scholar]
  25. Lu, J.; Struewing, I.; Yelton, S.; Ashbolt, N. Molecular survey of occurrence and quantity of Legionella spp., Mycobacterium spp., Pseudomonas aeruginosa and amoeba hosts in municipal drinking water storage tank sediments. J. Appl. Microbiol. 2015, 119, 278–288. [Google Scholar] [CrossRef] [PubMed]
  26. Regan, J.M.; Harrington, G.W.; Baribeau, H. Diversity of nitrifying bacteria in full-scale chloraminated distribution systems. Water Res. 2003, 37, 197–205. [Google Scholar] [CrossRef]
  27. de Beer, D.; Srinivasan, R.; Stewart, P.S. Direct measurement of chorine penetration into biofilms during disinfection. Appl. Environ. Microbiol. 1994, 60, 4339–4344. [Google Scholar] [CrossRef] [PubMed] [Green Version]
  28. Lee, W.H.; Pressman, J.G.; Wahman, D.G.; Bishop, P.L. Characterization and application of a chlorine microelectrode for measuring monochloramine within a biofilm. Sens. Actuat. B Chem. 2010, 145, 734–742. [Google Scholar] [CrossRef]
  29. Lee, W.H.; Wahman, D.G.; Bishop, P.L.; Pressman, J.G. Free chlorine and monochloramine application to nitrifying biofilm: Comparison of biofilm penetration, activity, and viability. Environ. Sci. Technol. 2011, 45, 1412–1419. [Google Scholar] [CrossRef]
  30. Lee, W.H.; Wahman, D.G.; Pressman, J.G. Monochloramine sensative amperometric microelectrode: Optimization of gold, platimum, and carbon fiber sensing materials for removal of dissolved oxygen interference. Ionics 2015, 21, 2663–2674. [Google Scholar] [CrossRef]
  31. Pressman, J.G.; Lee, W.H.; Bishop, P.L.; Wahman, D.G. Effect of free ammonia concentration on monochloramine penetration within a nitrifying biofilm and its effect on activity, viability, and recovery. Water Res. 2012, 46, 882–894. [Google Scholar] [CrossRef]
  32. Lu, R.; Yu, T. Fabrication and evaluation of an oxygen microelectrode applicable to environmental engineering and science. J. Environ. Eng. Sci. 2002, 1, 225–235. [Google Scholar] [CrossRef]
  33. Liu, H.; Tan, S.; Sheng, Z.; Liu, Y.; Yu, T. Bacterial community structure and activity of sulfate reducing bacteria in a membrane aerated biofilm analyzed by microsensor and molecular techniques. Biotechnol. Bioeng. 2014, 111, 2155–2162. [Google Scholar] [CrossRef]
  34. Tan, S.Y.; Yu, T.; Shi, H.C. Microsensor determination of multiple microbial processes in an oxygen-based membrane aerated biofilm. Water Sci. Technol. 2014, 69, 909–914. [Google Scholar] [CrossRef]
  35. Liu, H.; Tan, S.; Yu, T.; Liu, Y. Sulfate reducing bacterial community and in situ activity in mature fine tailings analyzed by real time qPCR and microsensor. J. Environ. Sci. China 2016, 44, 141–147. [Google Scholar] [CrossRef] [PubMed]
  36. Liu, H.; Wahman, D.G.; Pressman, J.G. Penetration and activity of monochloramine and free chlorine in sediment from drinking water storage tank. Environ. Sci. Technol. 2019, 53, 9352–9360. [Google Scholar] [CrossRef] [PubMed]
  37. Lorenzen, J.; Larsen, L.H.; Kjaer, T.; Revsbech, N. Biosensor determination of the microscale distribution of nitrate, nitrate assimilation, nitrification, and denitrification in a diatominhabited freshwater sediment. Appl. Environ. Microb. 1998, 64, 3264–3269. [Google Scholar] [CrossRef] [Green Version]
  38. Meyer, R.L.; Kjar, T.; Revsbech, N.P. Use of NOx- micorsensors to estimate the activity of sediment nitrification and NOx- consumption along an estuarine salinity, nitrate, and light gradient. Aquat. Microb. Ecol. 2001, 26, 181–193. [Google Scholar] [CrossRef]
  39. Okabe, S.; Ito, T.; Satoh, H. Analyses of spatial distribution of sulphate reducing bacteria and their activity in aerobic wastewater biofilms. Appl. Microbiol. Biot. 1999, 65, 5107–5116. [Google Scholar]
  40. Kreft, J.U.; Picioreanu, C.; Wimpenny, J.W.; van Loosdrecht, M.C. Individual-based modeling of biofilms. Microbiology 2001, 147, 2897–2912. [Google Scholar] [CrossRef] [PubMed] [Green Version]
  41. Crank, J. The Mathematics of Diffusion, 2nd ed.; Oxford University Press: London, UK, 1975. [Google Scholar]
Figure 1. Microsensor profiles within the 10,000 μm sediment layer: (a) dissolved oxygen (DO); (b) NH4+-N; (c) NO3-N; and (d) NO2-N.
Ijerph 17 00772 g001
Figure 2. Activity profiles (a positive value represents consumption while a negative value represents production) of: (a) DO; (b) NH4+-N; (c) NO3-N; and (d) NO2-N.
Ijerph 17 00772 g002
Figure 3. Simulated time required for diffusion into the sediment: (a) DO; and (b) NH4+-N and NO3N. Simulated time required for diffusion out of the sediment: (c) DO; and (d) NH4+-N and NO3-N.
Ijerph 17 00772 g003

