

Long-Term Effects of a Kinematic Bikefitting Method on Pain, Comfort, and Fatigue: A Prospective Cohort Study
 , , ,
, , ,  , and
, and
Abstract
:Highlights
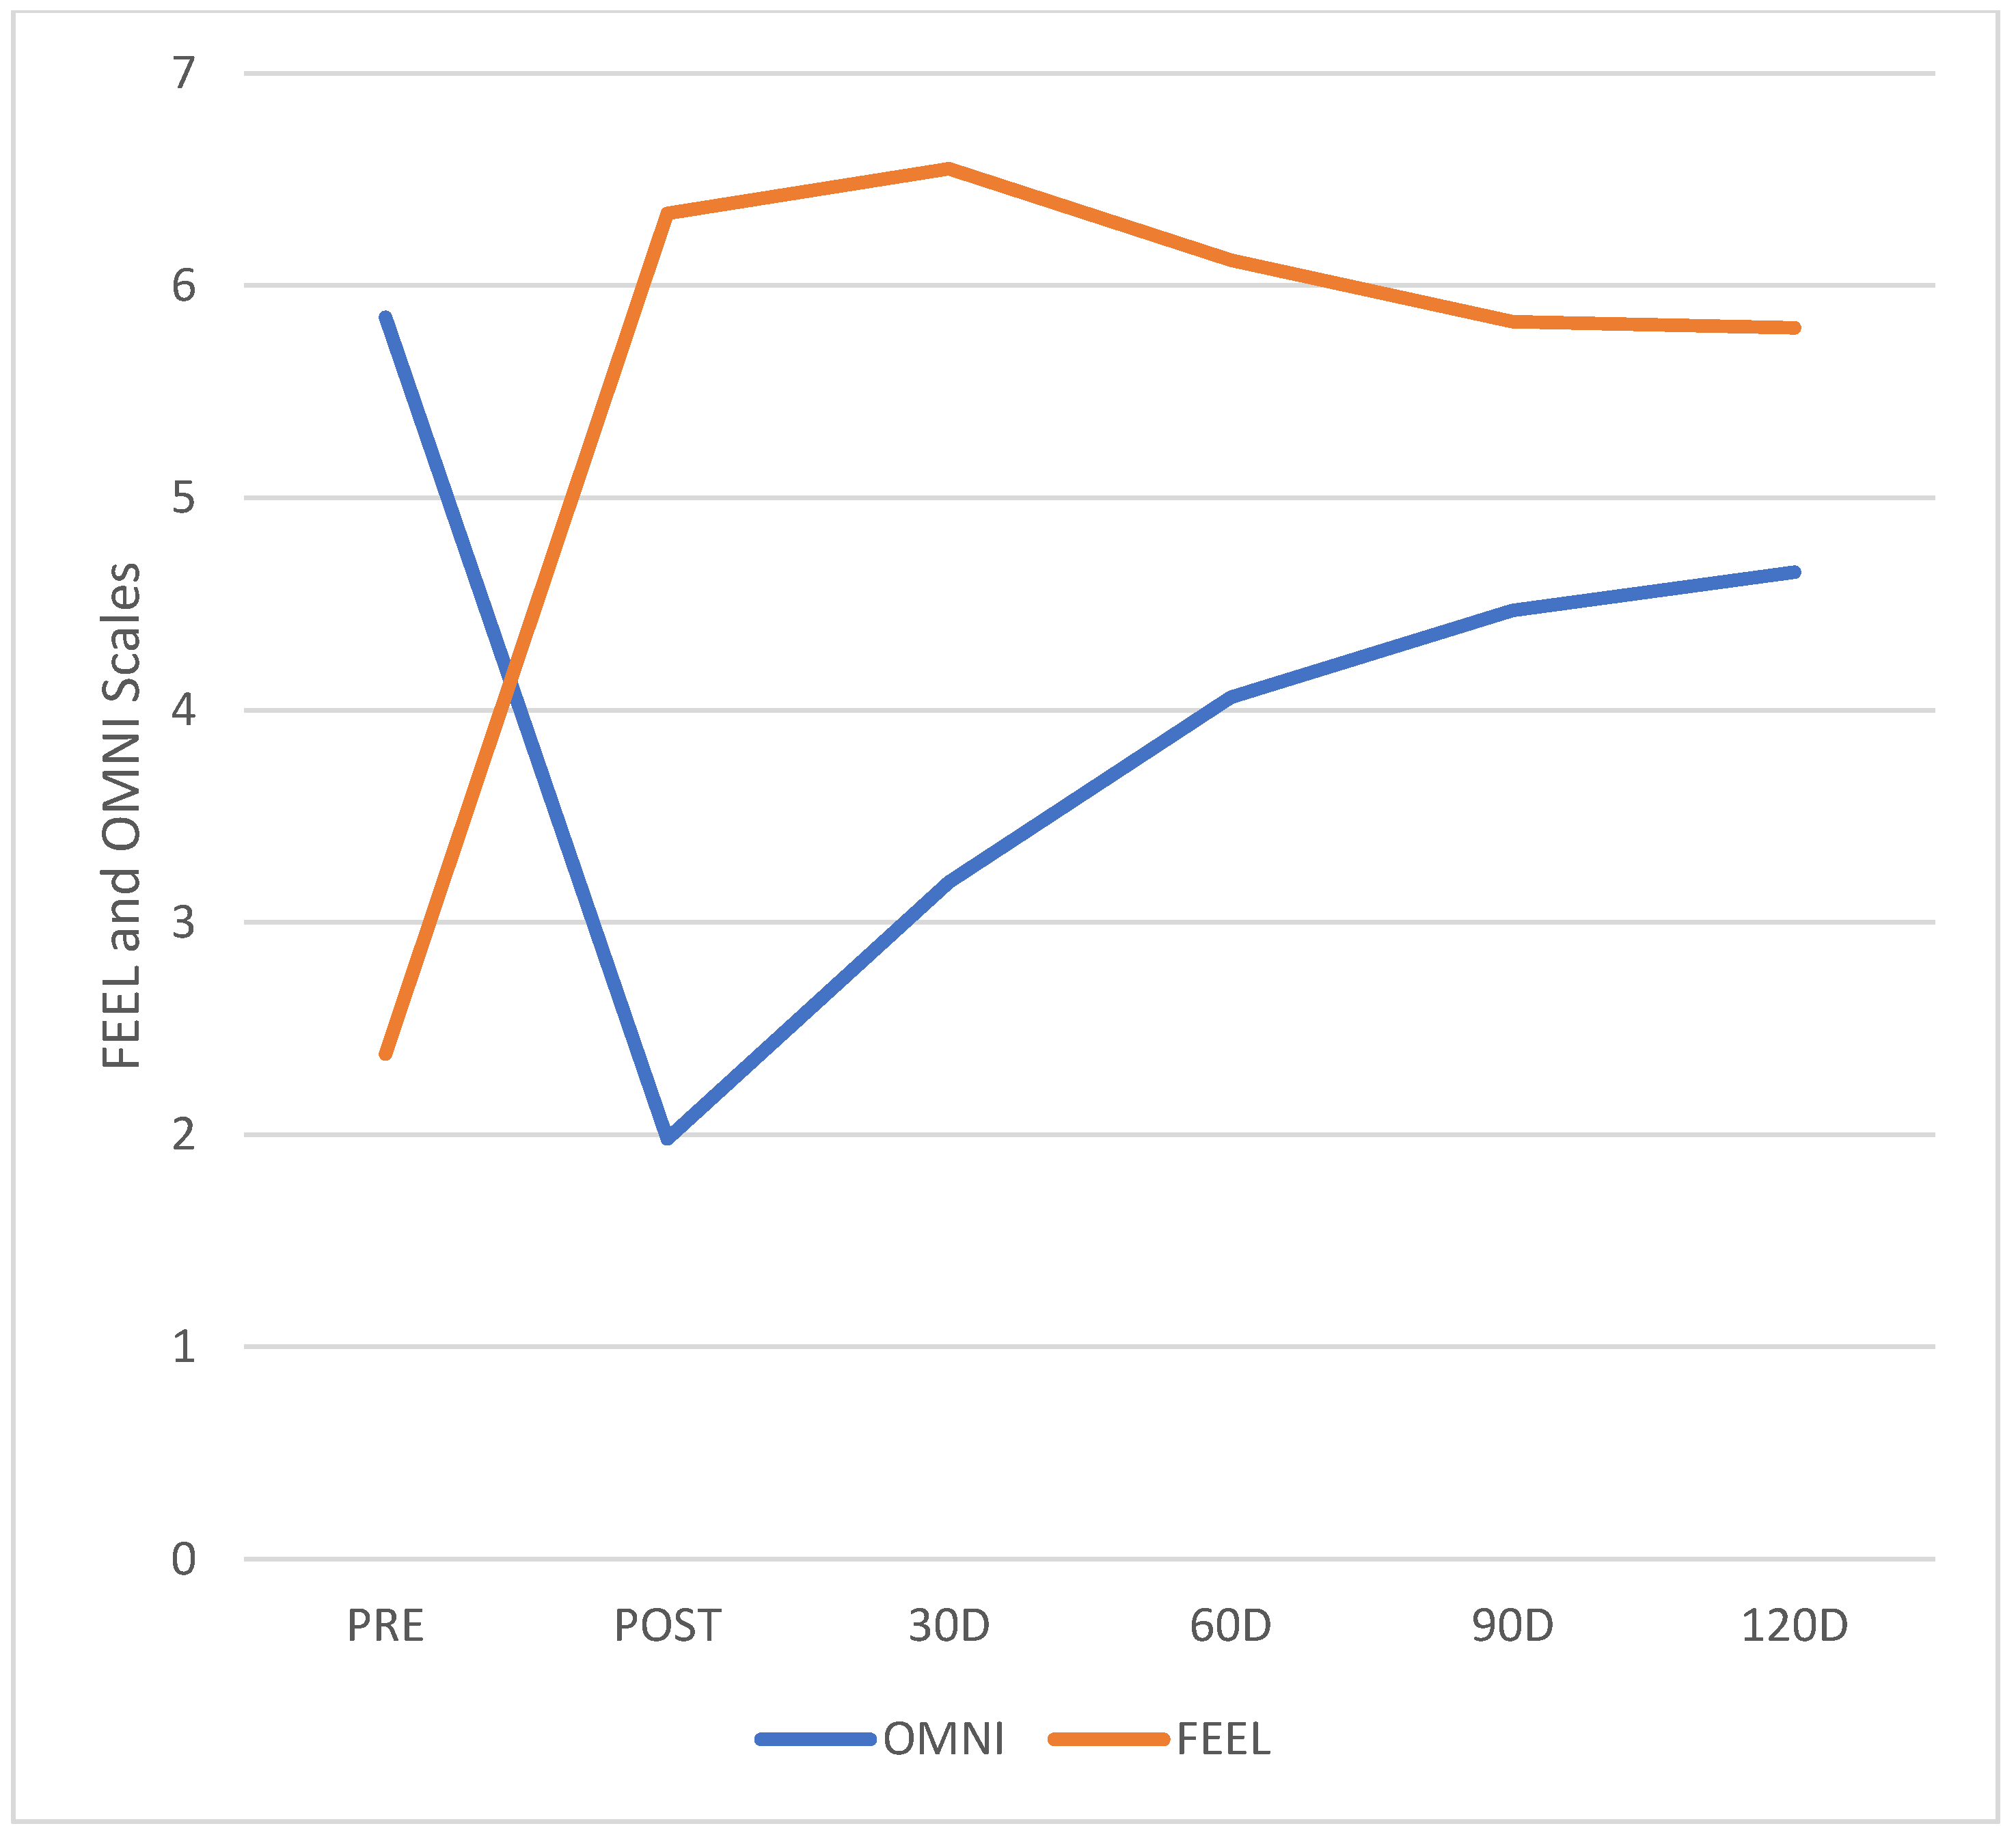
- Pain and comfort levels improved after bikefit and remained stable through 4 months.
- Even with discrete increase after 3 months, fatigue levels remained significantly lower.
- Ergonomic adjustments through bikefitting improves riding experience for a long period of time, and it can contribute to increase cycling adhesion.
- With increased riding comfort and reduced pain, participants showed increased fatigue and mileage levels, indicating increased sports practice.
Abstract
1. Introduction
2. Methods
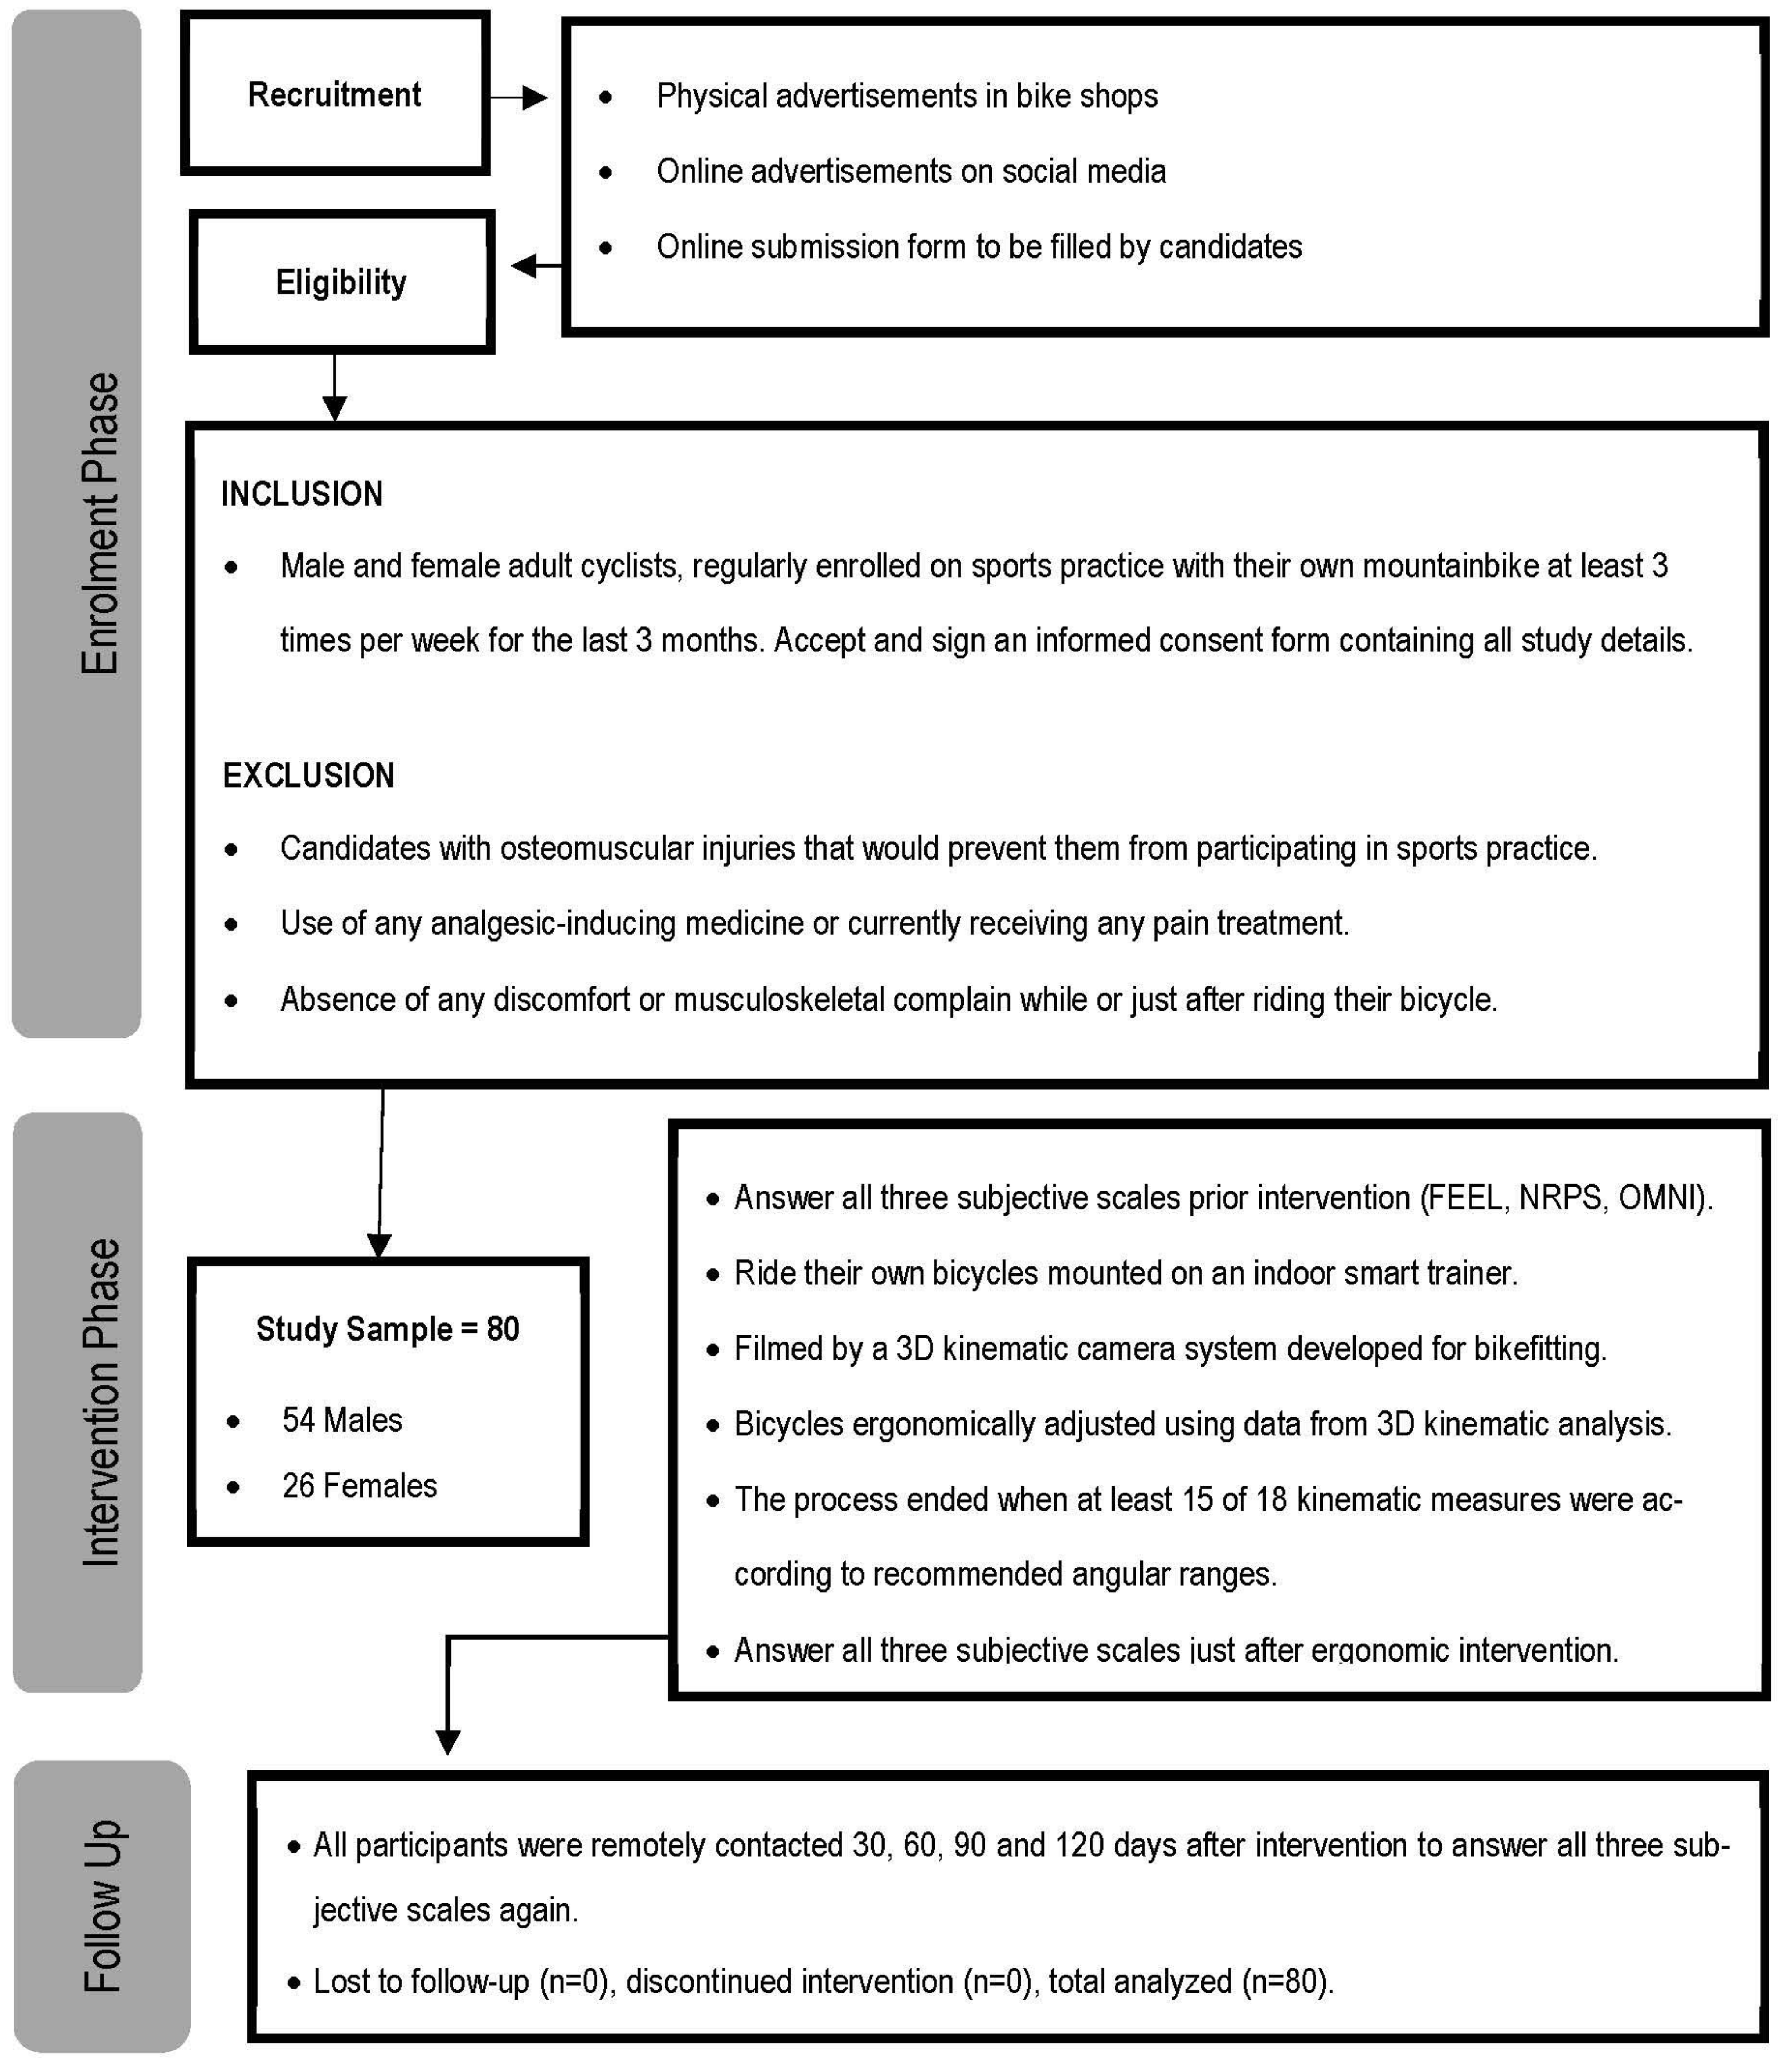
2.1. Design
2.2. Participants
2.3. Instruments
2.4. Intervention Procedures
2.5. Data Analysis
3. Results
4. Discussion
5. Conclusions
Author Contributions
Funding
Institutional Review Board Statement
Informed Consent Statement
Conflicts of Interest
References
- Priego Quesada, J.I.; Kerr, Z.Y.; Bertucci, W.M.; Carpes, F.P. A Retrospective International Study on Factors Associated with Injury, Discomfort and Pain Perception among Cyclists. PLoS ONE 2019, 14, e0211197. [Google Scholar] [CrossRef]
- Streisfeld, G.M.; Bartoszek, C.; Creran, E.; Inge, B.; Mcshane, M.D.; Johnston, T. Relationship between Body Positioning, Muscle Activity, and Spinal Kinematics in Cyclists with and Without Low Back Pain: A Systematic Review. Sports Health Multidiscip. Approach 2017, 9, 75–79. [Google Scholar] [CrossRef]
- Bini, R.; Daly, L.; Kingsley, M. Changes in Body Position on the Bike during Seated Sprint Cycling: Applications to Bike Fitting. Eur. J. Sport Sci. 2020, 20, 35–42. [Google Scholar] [CrossRef]
- Ward, B. A Narrative Review of Bike Fitting Issues Affecting Female Road Cyclists: Implications for Injury and Performance. J. Sci. Med. Sport 2017, 20, e70–e71. [Google Scholar] [CrossRef]
- Yantzer, B.; Madera, C. Combining Bike Fit, Mobility and Flexibility to Increase Functional on-Bike Performance. Perform. Cond. Cycl. 2003, 9, 11–12. [Google Scholar]
- Priego Quesada, J.I.; Perez-Soriano, P.; Gabriel Lucas-Cuevas, A.; Salvador Palmer, R.; Cibrian Ortiz de Anda, R.M. Effect of Bike-Fit in the Perception of Comfort, Fatigue and Pain. J. Sport. Sci. 2017, 35, 1459–1465. [Google Scholar] [CrossRef]
- Holliday, W.; Swart, J. Anthropometrics, Flexibility and Training History as Determinants for Bicycle Configuration. Sports Med. Health Sci. 2021, 3, 93–100. [Google Scholar] [CrossRef] [PubMed]
- Priego Quesada, J.I.; Kerr, Z.Y.; Bertucci, W.M.; Carpes, F.P. The Association of Bike Fitting with Injury, Comfort, and Pain during Cycling: An International Retrospective Survey. Eur. J. Sport Sci. 2018, 19, 842–849. [Google Scholar] [CrossRef] [PubMed]
- Park, J.; Abdel-Aty, M.; Lee, J.; Lee, C. Developing Crash Modification Functions to Assess Safety Effects of Adding Bike Lanes for Urban Arterials with Different Roadway and Socio-Economic Characteristics. Accid. Anal. Prev. 2015, 74, 179–191. [Google Scholar] [CrossRef]
- Dinsdale, N.; Dinsdale, N. Modern-day bikefitting can offer proactive therapists new opportunities. Sport. Dyn. 2014, 39, 25–32. [Google Scholar]
- Kronisch, R.L. How to Fit a Mountain Bike. Physician Sportsmed. 1998, 26, 71–72. [Google Scholar] [CrossRef]
- Bini, R.R.; Hume, P.A.; Croft, J. Cyclists and Triathletes Have Different Body Positions on the Bicycle. Eur. J. Sport Sci. 2014, 14, S109–S115. [Google Scholar] [CrossRef] [PubMed]
- Bini, R.; Hume, P.A.; Croft, J.L. Effects of Bicycle Saddle Height on Knee Injury Risk and Cycling Performance. Sport. Med. 2011, 41, 463–476. [Google Scholar] [CrossRef] [PubMed]
- Bini, R.R.; Hume, P.A.; Lanferdini, F.J.; Vaz, M.A. Effects of Moving Forward or Backward on the Saddle on Knee Joint Forces during Cycling. Phys. Ther. Sport 2013, 14, 23–27. [Google Scholar] [CrossRef]
- Bini, R.R.; Tamborindeguy, A.C.; Mota, C.B. Effects of Saddle Height, Pedaling Cadence, and Workload on Joint Kinetics and Kinematics during Cycling. J. Sport Rehabil. 2010, 19, 301–314. [Google Scholar] [CrossRef]
- Bini, R.R.; Daly, L.; Kingsley, M. Muscle Force Adaptation to Changes in Upper Body Position during Seated Sprint Cycling. J. Sport. Sci. 2019, 37, 2270–2278. [Google Scholar] [CrossRef]
- Quesada, J.I.P.; Kerr, Z.Y.; Bertucci, W.M.; Carpes, F.P. The Categorization of Amateur Cyclists as Research Participants: Findings from an Observational Study. J. Sport. Sci. 2018, 36, 2018–2024. [Google Scholar] [CrossRef] [PubMed]
- Srinivasan, J.; Balasubramanian, V. Low Back Pain Evaluation for Cyclist Using SEMG: A Comparative Study between Bicyclist and Aerobic Cyclist. In Proceedings of the 13th International Conference on Biomedical Engineering, Singapore, 3–6 December 2008; Volume 23, pp. 1140–1143. [Google Scholar]
- Johnston, T.E.; Baskins, T.A.; Koppel, R.V.; Oliver, S.A.; Stieber, D.J.; Hoglund, L.T. The influence of extrinsic factors on knee biomechanics during cycling: A systematic review of the literature. Int. J. Sport. Phys. Ther. 2017, 12, 1023–1033. [Google Scholar] [CrossRef] [PubMed] [Green Version]
- McLean, B. Cycling Knee Injuries. Aust. Triathlete 1996, 3, 62–63. [Google Scholar]
- Tinel, R.; Batista Faleiro; Davi Veiga, T.; da Silva Schulz, R.; Adelmiro Ferreira Mendes Franco, B.; Daltro, G. Prevalence and Causes of Non-Traumatic Knee Injuries in Cyclists: A Systematic Review. Int. J. Med. Sci. Clin. Invent. 2017, 4. [Google Scholar] [CrossRef]
- Balthazaar, B. The Effect of Shoe/Pedal Interface Position on Overuse Knee Injuries during Cycling. Australas. J. Podiatr. Med. 2000, 34, 118–124. [Google Scholar]
- Asplund, C.; Barkdull, T.; Weiss, B.D. Genitourinary Problems in Bicyclists. Curr. Sport. Med. Rep. 2007, 6, 333–339. [Google Scholar] [CrossRef]
- Panara, K.; Masterson, J.M.; Savio, L.F.; Ramasamy, R. Adverse Effects of Common Sports and Recreational Activities on Male Reproduction. Eur. Urol. Focus 2019, 5, 1146–1151. [Google Scholar] [CrossRef] [PubMed] [Green Version]
- Laursen, P.B.; Shing, C.M.; Tennant, S.C.; Prentice, C.M.; Jenkins, D.G. A Comparison of the Cycling Performance of Cyclists and Triathletes. J. Sport. Sci. 2003, 21, 411–418. [Google Scholar] [CrossRef] [PubMed]
- Too, D. Biomechanics of Cycling and Factors Affecting Performance. Sports Med. 1990, 10, 286–302. [Google Scholar] [CrossRef]
- Ashe, M.C.; Scroop, G.C.; Frisken, P.I.; Amery, C.A.; Wilkins, M.A.; Khan, K.M. Body Position Affects Performance in Untrained Cyclists. Br. J. Sport. Med. 2003, 37, 441–444. [Google Scholar] [CrossRef] [Green Version]
- Scoz, R.D.; Amorim, C.F.; Espindola, T.; Santiago, M.; Mendes, J.J.B.; de Oliveira, P.R.; Ferreira, L.M.A.; Brito, R.N. Discomfort, Pain and Fatigue Levels of 160 Cyclists after a Kinematic Bike-Fitting Method: An Experimental Study. BMJ Open Sport Exerc. Med. 2021, 7, e001096. [Google Scholar] [CrossRef]
- Motheral, B.; Brooks, J.; Clark, M.A.; Crown, W.H.; Davey, P.; Hutchins, D.; Martin, B.C.; Stang, P. A Checklist for Retrospective Database Studies—Report of the ISPOR Task Force on Retrospective Databases. Value Health 2003, 6, 90–97. [Google Scholar] [CrossRef] [Green Version]
- Von Elm, E.; Altman, D.G.; Egger, M.; Pocock, S.J.; Gøtzsche, P.C.; Vandenbroucke, J.P. The Strengthening the Reporting of Observational Studies in Epidemiology (STROBE) Statement: Guidelines for Reporting Observational Studies. Lancet 2007, 370, 1453–1457. [Google Scholar] [CrossRef] [Green Version]
- Harriss, D.J.; MacSween, A.; Atkinson, G. Ethical Standards in Sport and Exercise Science Research: 2020 Update. Int. J. Sport. Med. 2019, 40, 813–817. [Google Scholar] [CrossRef] [Green Version]
- Navalta, J.W.; Stone, W.J.; Lyons, T.S. Ethical Issues Relating to Scientific Discovery in Exercise Science. Int. J. Exerc. Sci. 2019, 12, 1–8. [Google Scholar] [PubMed]
- Faul, F.; Erdfelder, E.; Lang, A.-G.; Buchner, A. G*Power 3: A Flexible Statistical Power Analysis Program for the Social, Behavioral, and Biomedical Sciences. Behav. Res. Methods 2007, 39, 175–191. [Google Scholar] [CrossRef] [PubMed]
- Adams, R. Revised Physical Activity Readiness Questionnaire. Can. Fam. Phys. 1999, 45, 992. [Google Scholar]
- Scoz, R.D.; Espindola, T.R.; Santiago, M.F.; de Oliveira, P.R.; Alves, B.M.O.; Ferreira, L.M.A.; Amorim, C.F. Validation of a 3D Camera System for Cycling Analysis. Sensors 2021, 21, 4473. [Google Scholar] [CrossRef]
- Hardy, C.J.; Rejeski, W.J. Not What, but How One Feels: The Measurement of Affect during Exercise. J. Sport Exerc. Psychol. 1989, 11, 304–317. [Google Scholar] [CrossRef]
- Utter, A.C.; Kang, J.; Nieman, D.C.; Dumke, C.L.; McAnulty, S.R. Validation of Omni Scale of Perceived Exertion during Prolonged Cycling. Med. Sci. Sport. Exerc. 2006, 38, 780–786. [Google Scholar] [CrossRef]
- Robertson, R.J.; Goss, F.L.; Metz, K.F. Perception of Physical Exertion during Dynamic Exercise: A Tribute to Professor Gunnar A. V. Borg. Percept. Mot. Ski. 1998, 86, 183–191. [Google Scholar] [CrossRef]
- Da Silva, V.S.; Vieira, M.F.S.; da Silva, V.S.; Vieira, M.F.S. International Society for the Advancement of Kinanthropometry (ISAK) Global: International Accreditation Scheme of the Competent Anthropometrist. Rev. Bras. Cineantropometria Amp. Desempenho Hum. 2020, 22, 3–78. [Google Scholar] [CrossRef]
- Ansley, L.; Cangley, P. Determinants of “Optimal” Cadence during Cycling. Eur. J. Sport Sci. 2009, 9, 61–85. [Google Scholar] [CrossRef]
- Wassertheil, S.; Cohen, J. Statistical Power Analysis for the Behavioral Sciences. Biometrics 1970, 26, 588. [Google Scholar] [CrossRef] [Green Version]
- Stoop, R.; Hohenauer, E.; Vetsch, T.; Deliens, T.; Clijsen, R. Acute Injuries in Male Elite and Amateur Mountain Bikers: Results of a Survey. J. Sports Sci. Med. 2019, 18, 207–212. [Google Scholar] [PubMed]
- Schwenk, T. Bike Seat Tilt Reduces Low-Back Pain. Sports Phys. Ther. Sect. 2000, 28, 23–24. [Google Scholar] [CrossRef]
- Chaudhari, A.M.; Lindenfeld, T.N.; Andriacchi, T.P.; Hewett, T.E.; Riccobene, J.; Myer, G.D.; Noyesm, F.R. Knee and Hip Loading Patterns at Different Phases in the Menstrual Cycle: Implications for the Gender Difference in Anterior Cruciate Ligament Injury Rates. Am. J. Sport. Med. 2007, 35, 793–800. [Google Scholar] [CrossRef] [PubMed]
- Chen, C.-C.; Chen, Y.-C.; Chen, M.-Y. Study the Effects of EMG, HR, RPE and Low Back Pain in Different Exercise Bikes Riding Positions. In Proceedings of the IMETI 2009—2nd International Multi-Conference on Engineering and Technological Innovation, Proceedings, Orlando, FL, USA, 10–13 July 2009; Volume 1, pp. 293–297. [Google Scholar]
- Joseph, S.; Johar, M.S.N.M.; Ganason, R. Anterior knee pain (patellar tendonitis) management and modification in bike fitting for a track cyclist. Int. Symp. Biomech. Sport. Conf. Proc. Arch. 2012, 30, 290–293. [Google Scholar]
- Leavitt, T.G.; Vincent, H.K. Simple Seat Height Adjustment in Bike Fitting Can Reduce Injury Risk. Curr. Sports Med. Rep. 2016, 15, 130. [Google Scholar] [CrossRef]
- Asplund, C.; St Pierre, P. Knee pain and bicycling: Fitting concepts for clinicians. Physician Sportsmed. 2004, 32, 23–30. [Google Scholar] [CrossRef]
- Asplund, C.; Webb, C.; Barkdull, T. Neck and Back Pain in Bicycling. Curr. Sport. Med. Rep. 2005, 4, 271–274. [Google Scholar] [CrossRef]
- Bailey, M.; Maillardet, F.; Messenger, N. Kinematics of Cycling in Relation to Anterior Knee Pain and Patellar Tendinitis. J. Sports Sci. 2003, 21, 649. [Google Scholar] [CrossRef]
- Condevaux, B. Cycling knee pain prevention. Perform. Cond. Cycl. 2004, 10, 12. [Google Scholar]
- Srinivasan, J.; Balasubramanian, V. Low Back Pain and Muscle Fatigue Due to Road Cycling-An SEMG Study. J. Bodyw. Mov. Ther. 2007, 11, 260–266. [Google Scholar] [CrossRef]


| Participants (n = %) | |
|---|---|
| Male (n = %) | 54 = 67.5% |
| Female (n = %) | 26 = 32.5% |
| Total (n = %) | 80 = 100% |
| Age (years) | 39.03 ± 5.11 |
| Height (cm) | 173.83 ± 7.82 |
| Wingspan (cm) | 174.68 ± 8.01 |
| Body mass (kg) | 76.96 ± 11.68 |
| BMI (kg/m2) | 25.35 ± 2.65 |
| Familiarity with Current Bicycle (n = %) | |
| 6 to 12 Months | 36 = 45.0% |
| 13 to 18 Months | 11 = 13.8% |
| 19 to 24 Months | 14 = 17.5% |
| 25+ Months | 19 = 23.8% |
| Training Volume (n = %) | |
| 60–120 km/month | 3 = 3.8% |
| 121–240 km/month | 16 = 20.0% |
| 241–480 km/month | 21 = 26.3% |
| 481–800 km/month | 19 = 23.8% |
| 800+ km/month | 21 = 23.6% |
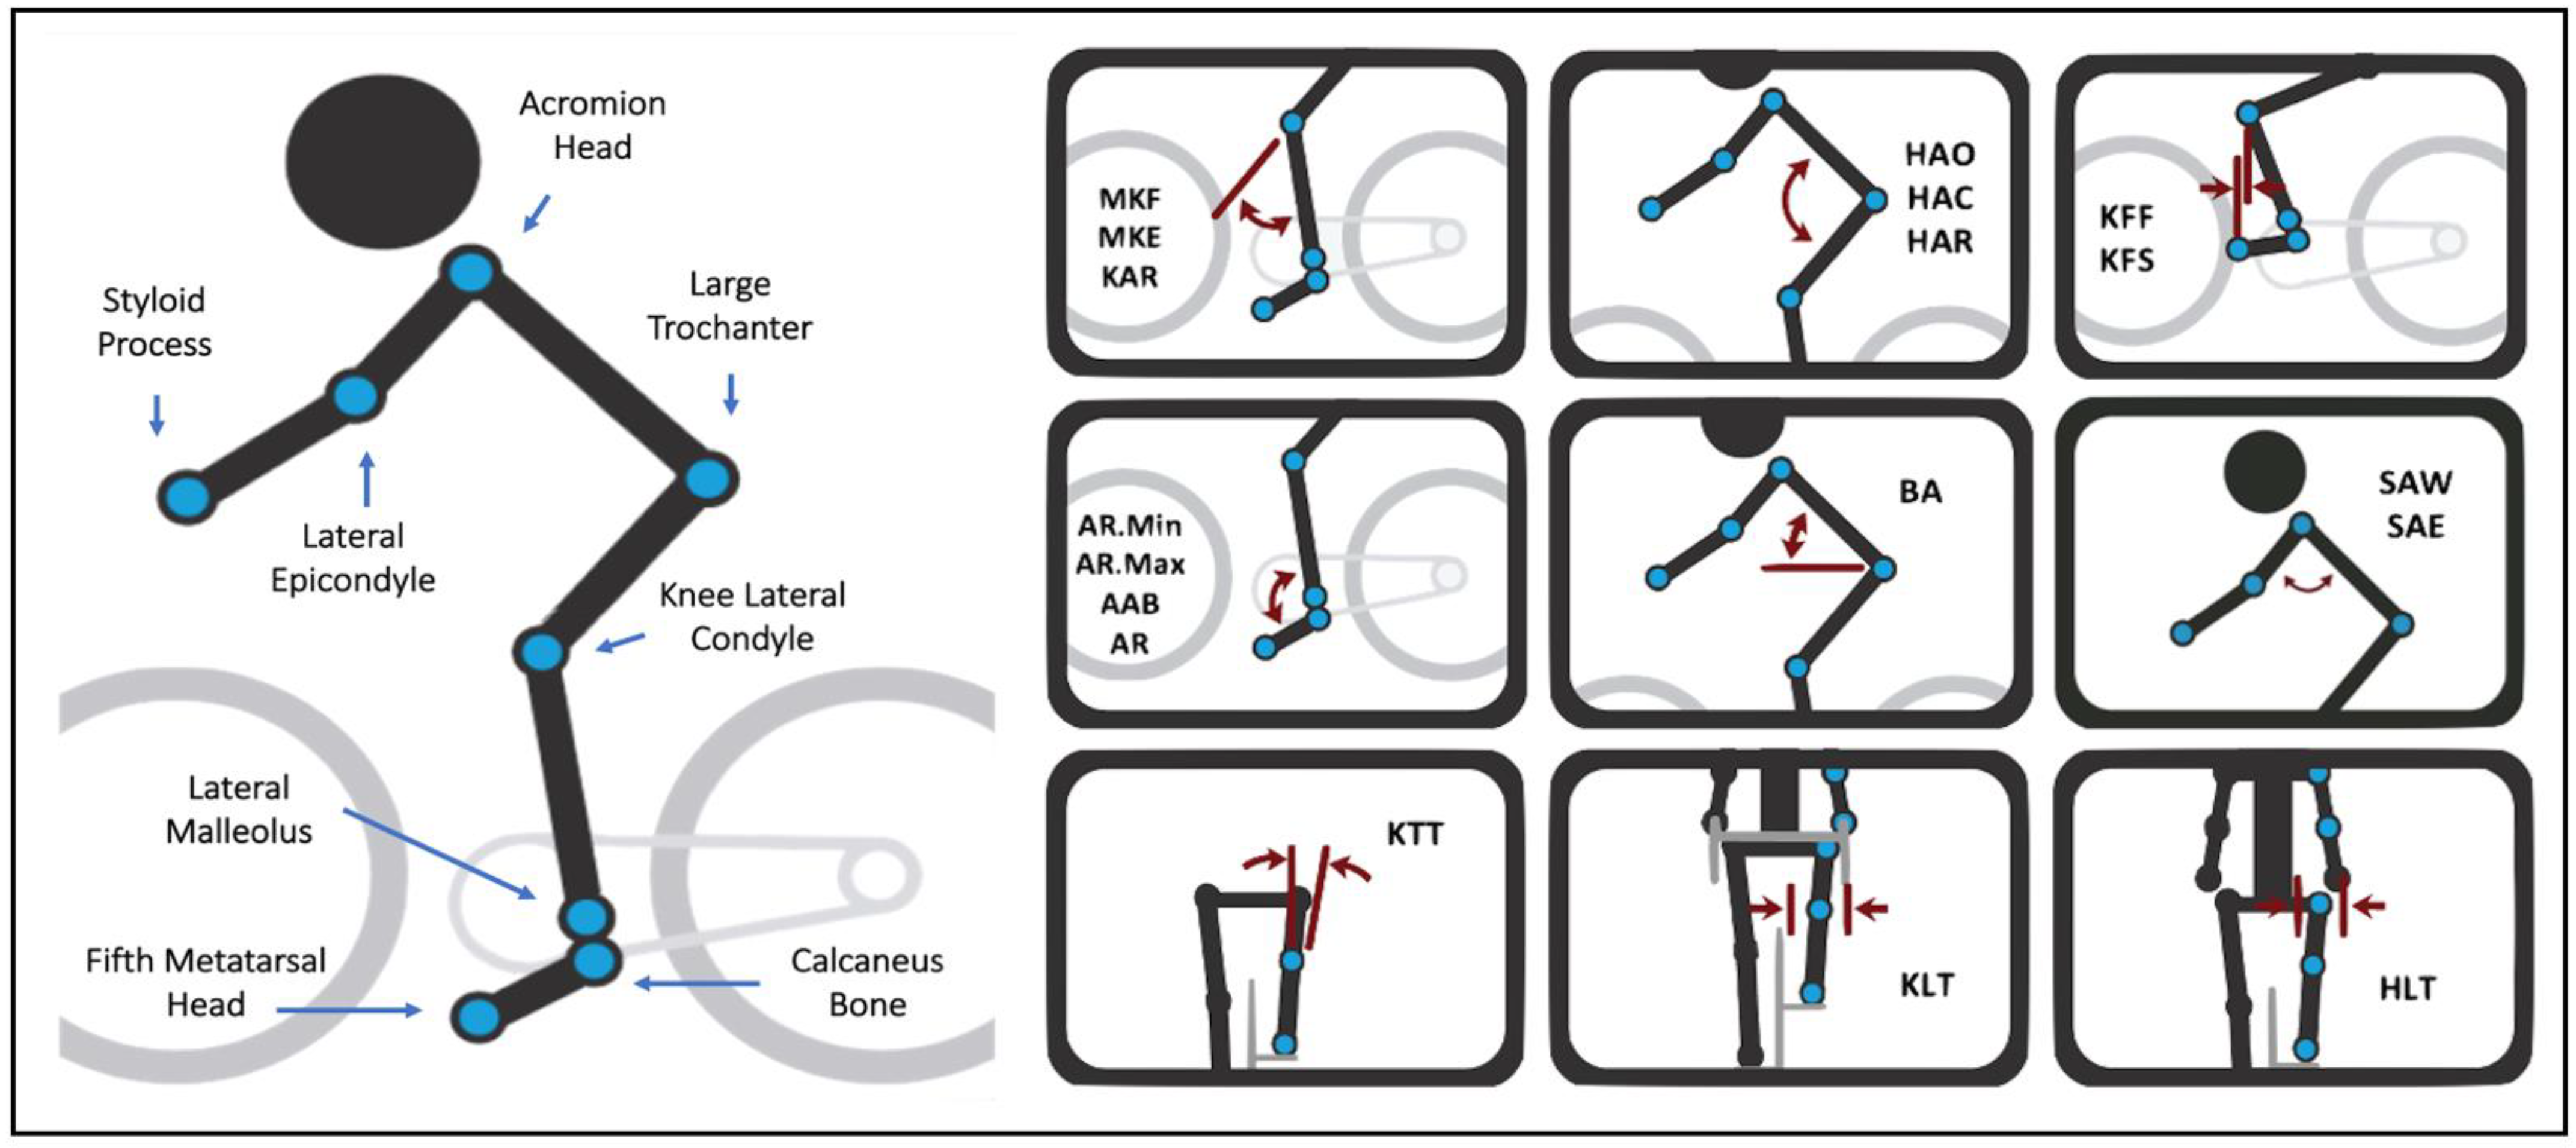
| Measurement | Abbreviation | Angular Range | Description |
|---|---|---|---|
| Ankle minimum | AR.Min | 65 to 75 | Maximum dorsiflexion at any point in the pedal stroke defined by the knee-ankle line and the heel-foot line. |
| Ankle maximum | AR.Max | 90 to 100 | Maximum plantarflexion at any point in the pedal stroke defined by the knee-ankle line and the heel-foot line. |
| Ankle range | AR | 20 to 30 | The difference between ankle maximum and ankle minimum. |
| Ankle angle at bottom | AAB | 90 to 100 | The ankle angle at the bottom of the pedal stroke (180 degrees). |
| Maximum knee flexion | MKF | 107 to 113 | Maximum flexion of the knee joint at any point in the pedal stroke defined by the hip-knee line and the knee-ankle line. |
| Maximum knee extension | MKE | 32 to 42 | Maximum extension of the knee joint at any point in the pedal stroke defined by the hip-knee line and the knee-ankle line. |
| Knee angle range | KAR | 70 to 75 | The difference between knee angle flexion and knee angle extension. |
| Knee forward of foot | KFF | −10 to 10 | The fore/aft offset of the knee marker relative to the foot marker captured at the forward part of the pedal stroke (3 o’clock or 90 degrees down). A negative number indicates a knee that is aft of neutral. |
| Knee forward of spindle | KFS | −35 to −5 | The fore/aft offset of the knee marker relative to the pedal spindle at 3 o’clock in the pedal stroke (90 degrees in the downstroke). |
| Knee travel tilt | KTT | −2 to 4 | The frontal plane angle of the tracing created by the moving knee marker with respect to vertical. A positive number indicates a knee that tracks away from the bike in the upstroke. A negative number represents a knee that tracks towards the bike in the upstroke. See the front view of the knee path for a visual representation of this measurement. |
| Knee lateral travel | KLT | 5 to 36 | The magnitude of the lateral movement of the knee. |
| Hip angle closed | HAC | 66 to 76 | The most closed angle of the hip joint defined by the knee, hip, and shoulder marker. |
| Hip angle open | HAO | 110 to 120 | The most open angle of the hip joint defined by the knee, hip, and shoulder marker. |
| Hip angle range | HAR | 40 to 45 | The difference between hip angle open and closed. |
| Hip lateral travel | HLT | 5 to 20 | The magnitude of the lateral movement of the hip |
| Back angle | BA | 50 to 65 | The angle of the back relative to the horizon defined by the hip and shoulder marker |
| Shoulder angle to wrist | SAW | 65 to 75 | The angle of the shoulder joint defined by the hip, shoulder, and wrist markers. |
| Shoulder angle to elbow | SAE | 60 to 70 | The angle of the shoulder joint defined by the hip, shoulder, and elbow markers. |
| Variable | Mean | SD | SE |
|---|---|---|---|
| NRPS.HW.Pre | 1.88 | 1.26 | 0.14 |
| NRPS.HW.Post | 0.05 | 0.22 | 0.02 |
| NRPS.HW.30 Days | 0.19 | 0.20 | 0.8 |
| NRPS.HW.60 Days | 0.23 | 0.18 | 0.05 |
| NRPS.HW.90 Days | 0.41 | 0.31 | 0.11 |
| NRPS.HW.120 Days | 0.53 | 0.40 | 0.21 |
| NRPS.NS.Pre | 2.24 | 1.69 | 0.19 |
| NRPS.NS.Post | 0.10 | 0.44 | 0.05 |
| NRPS.NS.30 Days | 0.16 | 0.35 | 0.06 |
| NRPS.NS.60 Days | 0.21 | 0.51 | 0.09 |
| NRPS.NS.90 Days | 0.44 | 0.67 | 0.11 |
| NRPS.NS. 120 Days | 0.62 | 0.79 | 0.23 |
| NRPS.BH.Pre | 2.53 | 2.06 | 0.23 |
| NRPS.BH.Post | 0.21 | 0.63 | 0.07 |
| NRPS.BH.30 Days | 0.25 | 0.37 | 0.11 |
| NRPS.BH.60 Days | 0.27 | 0.41 | 0.16 |
| NRPS.BH.90 Days | 0.30 | 0.43 | 0.13 |
| NRPS.BH.120 Days | 0.51 | 0.62 | 0.15 |
| NRPS.GP.Pre | 2.29 | 1.73 | 0.19 |
| NRPS.GP.Post | 0.24 | 0.75 | 0.08 |
| NRPS.GP.30 Days | 0.29 | 0.88 | 0.11 |
| NRPS.GP.60 Days | 0.35 | 0.98 | 0.14 |
| NRPS.GP.90 Days | 0.44 | 1.05 | 0.12 |
| NRPS.GP.120 Days | 0.69 | 1.12 | 0.22 |
| NRPS.KT.Pre | 1.56 | 1.96 | 0.22 |
| NRPS.KT.Post | 0.10 | 0.44 | 0.05 |
| NRPS.KT.30 Days | 0.15 | 0.32 | 0.10 |
| NRPS.KT.60 Days | 0.22 | 0.40 | 0.14 |
| NRPS.KT.90 Days | 0.53 | 0.68 | 0.15 |
| NRPS.KT.120 Days | 0.71 | 0.99 | 0.22 |
| NRPS.AF.Pre | 1.44 | 1.04 | 0.12 |
| NRPS.AF.Post | 0.05 | 0.35 | 0.04 |
| NRPS.AF.30 Days | 0.00 | 0.00 | 0.00 |
| NRPS.AF.60 Days | 0.00 | 0.00 | 0.00 |
| NRPS.AF.90 Days | 0.00 | 0.00 | 0.00 |
| NRPS.AF.120 Days | 0.00 | 0.00 | 0.00 |
| FEEL.Pre | 2.38 | 1.63 | 0.18 |
| FEEL.Post | 6.34 | 1.74 | 0.19 |
| FEEL.30 Days | 6.55 | 2.46 | 0.23 |
| FEEL.60 Days | 6.12 | 2.38 | 0.20 |
| FEEL.90 Days | 5.83 | 2.35 | 0.25 |
| FEEL.120 Days | 5.80 | 2.29 | 0.21 |
| OMNI.Pre | 5.85 | 1.21 | 0.14 |
| OMNI.Post | 1.98 | 1.49 | 0.17 |
| OMNI.30 Days | 3.19 | 1.16 | 0.33 |
| OMNI.60 Days | 4.06 | 1.21 | 0.27 |
| OMNI.90 Days | 4.47 | 1.48 | 0.30 |
| OMNI.120 Days | 4.65 | 1.74 | 0.41 |
| Paired Samples t-Test | Statistic | p | Mean Difference | SE Difference | 95% CI | Cohen’s d Effect Size | 95% CI | |||
|---|---|---|---|---|---|---|---|---|---|---|
| Lower | Upper | Lower | Upper | |||||||
| NRPS.HW.Pre | NRPS.HW.120D | 6.10 | <0.001 * | 0.83 | 0.14 | 0.56 | 1.09 | 0.68 | 0.44 | 0.92 |
| NRPS.NS.Pre | NRPS.NS.120D | 6.53 | <0.001 * | 1.14 | 0.17 | 0.79 | 1.48 | 0.73 | 0.48 | 0.98 |
| NRPS.BH.Pre | NRPS.BH.IG.Post | 6.48 | <0.001 * | 1.31 | 0.20 | 0.91 | 1.72 | 0.72 | 0.48 | 0.97 |
| NRPS.GP.Pre | NRPS.GP.IG.Post | 5.12 | <0.001 * | 0.95 | 0.19 | 0.58 | 1.32 | 0.57 | 0.33 | 0.81 |
| NRPS.KT.Pre | NRPS.KT.IG.Post | 6.98 | <0.001 * | 1.46 | 0.21 | 1.05 | 1.88 | 0.78 | 0.53 | 1.03 |
| NRPS.AF.Pre | NRPS.AF.IG.Post | 3.16 | 0.002 * | 0.39 | 0.12 | 0.14 | 0.63 | 0.35 | 0.13 | 0.58 |
| FEEL.Pre | FEEL.IG.Post | −10.52 | <0.001 * | −2.96 | 0.28 | −3.52 | −2.40 | −1.18 | −1.46 | −0.89 |
| OMNI.Pre | OMNI.IG.Post | 17.83 | <0.001 * | 3.48 | 0.20 | 3.09 | 3.86 | 1.99 | 1.61 | 2.37 |
Publisher’s Note: MDPI stays neutral with regard to jurisdictional claims in published maps and institutional affiliations. |
© 2022 by the authors. Licensee MDPI, Basel, Switzerland. This article is an open access article distributed under the terms and conditions of the Creative Commons Attribution (CC BY) license (https://creativecommons.org/licenses/by/4.0/).
Share and Cite
Scoz, R.D.; de Oliveira, P.R.; Santos, C.S.; Pinto, J.R.; Melo-Silva, C.A.; de Júdice, A.F.T.; Mendes, J.J.B.; Ferreira, L.M.A.; Amorim, C.F. Long-Term Effects of a Kinematic Bikefitting Method on Pain, Comfort, and Fatigue: A Prospective Cohort Study. Int. J. Environ. Res. Public Health 2022, 19, 12949. https://doi.org/10.3390/ijerph191912949
Scoz RD, de Oliveira PR, Santos CS, Pinto JR, Melo-Silva CA, de Júdice AFT, Mendes JJB, Ferreira LMA, Amorim CF. Long-Term Effects of a Kinematic Bikefitting Method on Pain, Comfort, and Fatigue: A Prospective Cohort Study. International Journal of Environmental Research and Public Health. 2022; 19(19):12949. https://doi.org/10.3390/ijerph191912949
Chicago/Turabian StyleScoz, Robson Dias, Paulo Rui de Oliveira, Cleyton Salvego Santos, Júlia Ribeiro Pinto, Cesar Augusto Melo-Silva, André Filipe Teixeira de Júdice, José João Baltazar Mendes, Luciano Maia Alves Ferreira, and César Ferreira Amorim. 2022. "Long-Term Effects of a Kinematic Bikefitting Method on Pain, Comfort, and Fatigue: A Prospective Cohort Study" International Journal of Environmental Research and Public Health 19, no. 19: 12949. https://doi.org/10.3390/ijerph191912949