
Input-Output Efficiency of Water-Energy-Food and Its Driving Forces: Spatial-Temporal Heterogeneity of Yangtze River Economic Belt, China


Abstract
:1. Introduction
2. Methods
2.1. The Super-SBM Model
2.2. Spatial Autocorrelation
2.2.1. Global Moran’s I (GMI)
2.2.2. Local Moran’s I
2.3. Spatial Econometric Model
3. Indicators Selection and Data Processing
3.1. Nexus Analysis of Index
3.1.1. Input Indicators
3.1.2. Output Indicators
3.2. Data Processing
- (1)
- According to the GDP deflator released by the National Bureau of Statistics, prices in 2008 are used as the base period to convert the total social fixed asset investment and regional GDP into real prices to increase the comparability of data.
- (2)
- The six indicators, CO2 emissions, SO2 emissions, oxynitride, smoke (or dust) emissions, sewage emissions, and general industrial solid waste production, are selected as indicators to measure the environmental pollution situation. First, normalize the different types of indicators and then use the arithmetic mean method to construct the environmental pollution index. The standardized treatment method is as follows:
- (1)
4. Results Analysis
4.1. Spatial-Temporal Characteristics of the IOE-WEF in YREB
4.1.1. Time Evolution of the IOE-WEF in YREB
- (1)
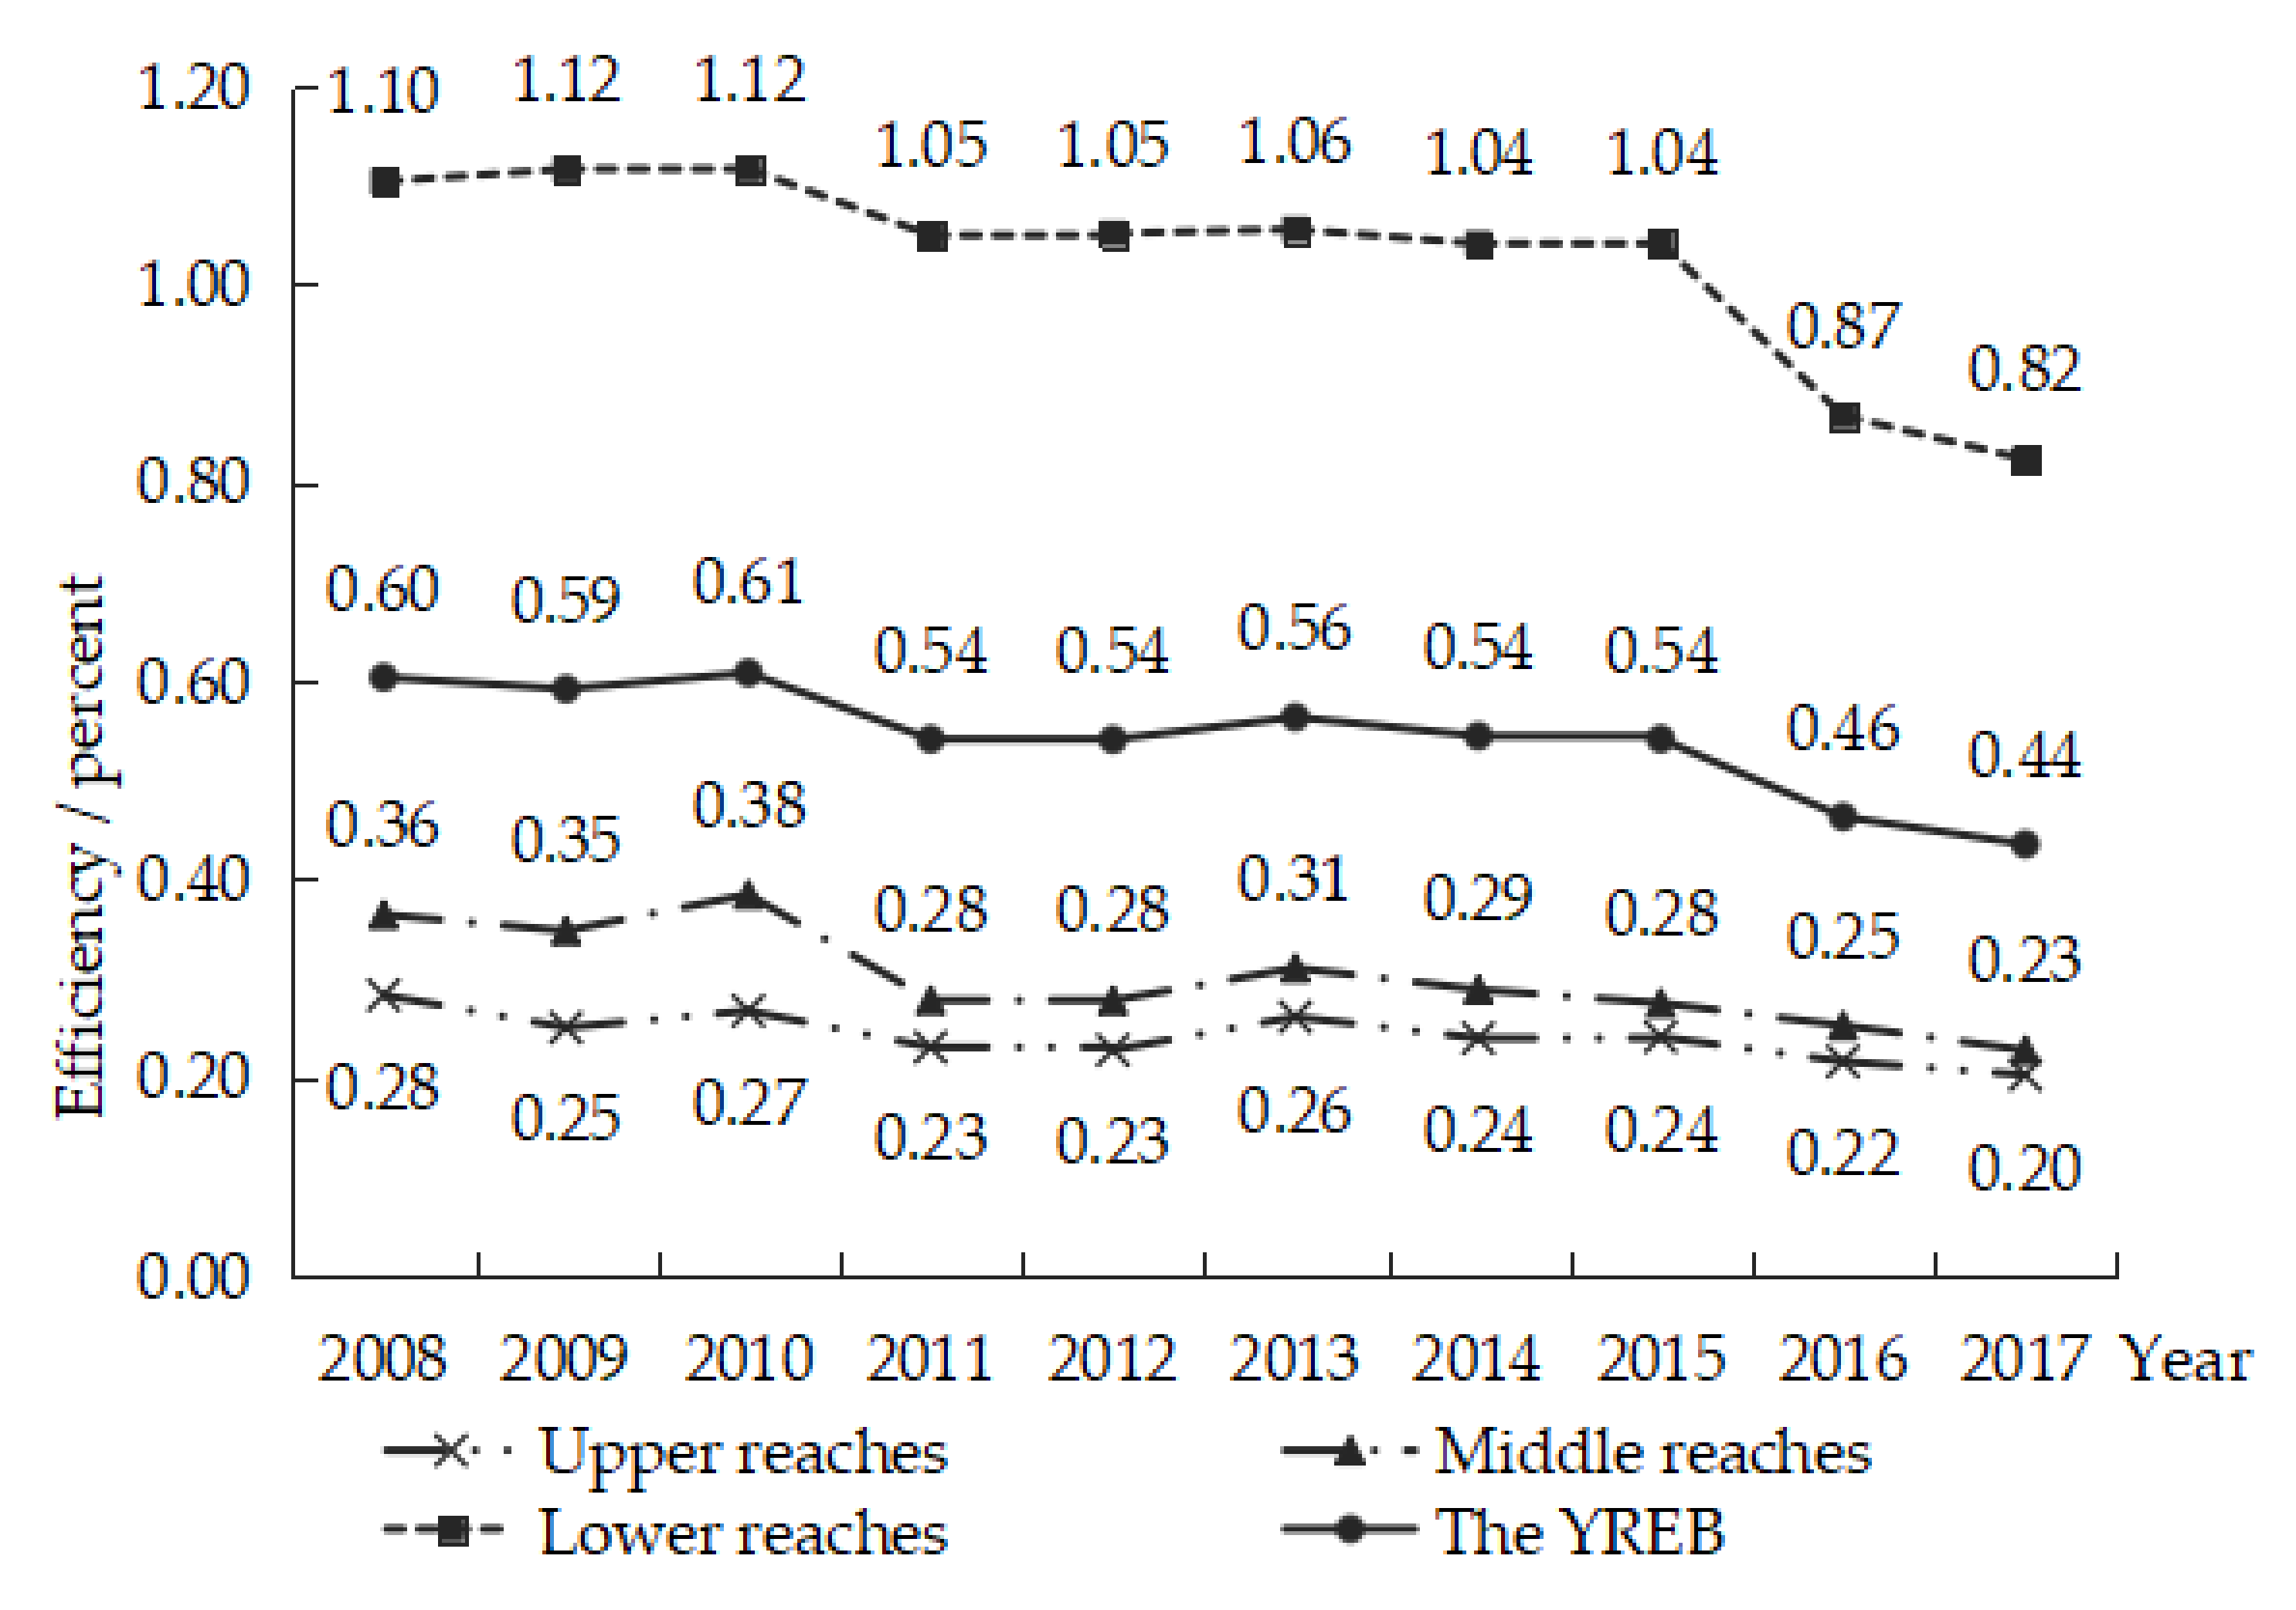
- The IOE-WEF in YREB was relatively low. The average value of IOE-WEF in YREB fluctuated in the range of [0.4–0.6], which did not reach DEA efficiency. It indicated that the comprehensive resource management and industrial-scale needed to be improved in the YREB. Regionally, the efficiency values of the upper reaches fluctuated in the range of [0.2–0.3], and the efficiency values of the middle reaches fluctuated in the range of [0.2–0.4]; neither of them was DEA effective, while the efficiency value of the lower reaches was higher than that of the upper reaches and middle reaches. The efficiency value of the lower reaches reached DEA efficiency from 2008 to 2015 and had an obvious downward trend from 2016 to 2017.
- (2)
- The IOE-WEF in YREB displayed a fluctuating downward pattern when considering the undesirable outputs. In Figure 1, the IOE-WEF all had an obvious downward trend from 2008 to 2017. It shows that during this period, the development of the YREB presented the characteristics of extensive economy and resource utilization mode. It should be noted that the efficiency values of the lower reaches showed a significant downward trend during 2016–2017. The main cause of this situation is that the IOE-WEF of Zhejiang province decreased significantly from 2016 to 2017, which reduced the average efficiency level of the lower reaches.
4.1.2. Spatial Characteristics of the IOE-WEF in YREB
- (1)
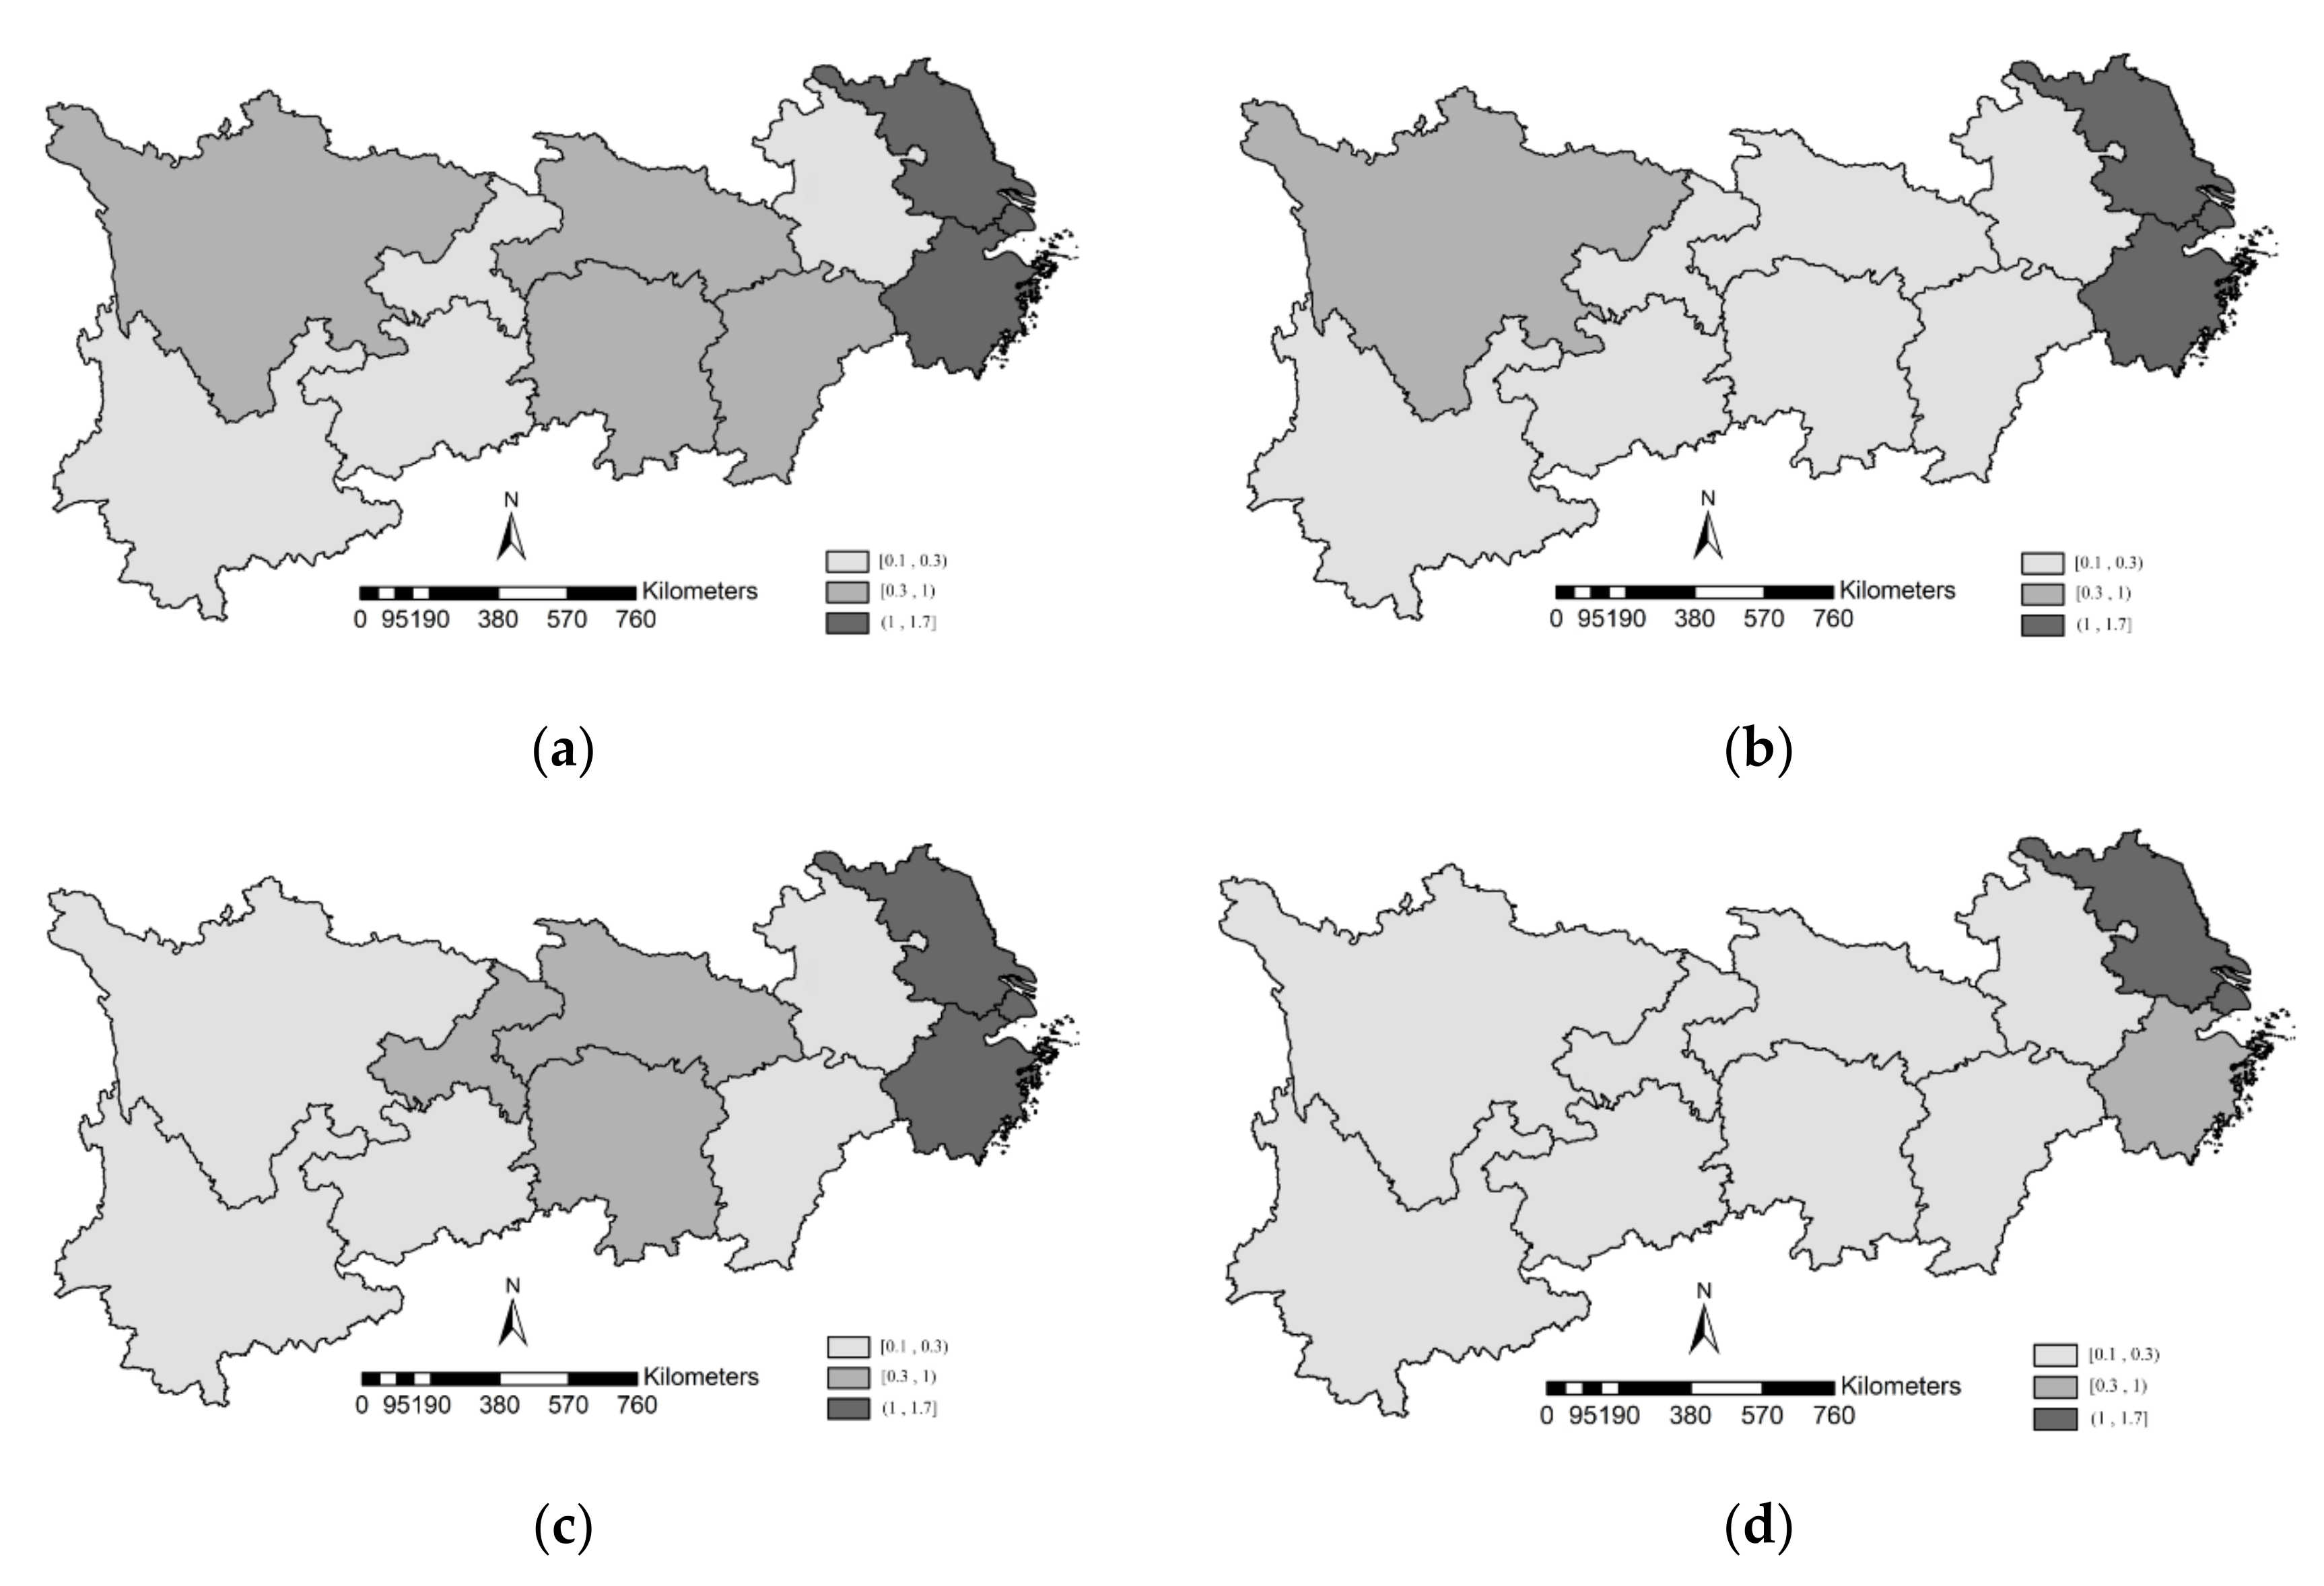
- In Figure 2, the spatial characteristics of the IOE-WEF in YREB was uneven, and the efficiency values of the three sub-regions of YREB were along with “the lower reaches > the middle reaches > the upper reaches”. Actually, in Figure 2, the IOE-WEF in the upper and middle reaches of the YREB were generally low, and the efficiency values in both reaches dropped to the low-efficiency zone over time. Sichuan, Hubei, Hunan, and Jiangxi provinces declined from the medium efficiency zone to the low-efficiency zone over time.
- (2)
- The upper reaches of the YREB are rich in natural resources with a large water flow gap, and most of the water-energy resources are concentrated in the upper reaches. However, the extensive economic growth mode based on agriculture and animal husbandry causes serious soil erosion and damage to the ecological system in the upper reaches. In addition, silt and pollutants from the upper reaches of the river flow through the middle and lower reaches, affecting the ecological environment of the middle and lower reaches of the YREB. Therefore, relying on the consumption of large amounts of resources to promote economic development is an unsustainable way of development, and the upper reaches of the YREB still need to be improved in terms of industrial layout and rational allocation of resources.
- (3)
- The IOE-WEF of Jiangsu province and Shanghai city have been high, while Zhejiang province dropped to the medium efficiency zone in 2017, as shown in Figure 2d. Actually, in Zhejiang, from 2013 to 2017, the growth rate of fixed-asset investment was higher than that of the regional GDP province. Especially in 2016, fixed asset investment in Zhejiang province increased by 9.6%, while regional GDP only increased by 9.0% year on year, indicating that the economic growth of Zhejiang province was more dependent on fixed capital investment. Therefore, the IOE-WEF of Zhejiang province showed a downward trend, with a significant decline in 2016 and 2017.
- (4)
- Anhui province has been in the low-efficiency zone. Although Anhui province is in the lower reaches of YREB and adjacent to the developed coastal areas, its IOE-WEF has not benefited from the radiation effect of Jiangsu province and Zhejiang province, and the IOE-WEF has been in an inefficient state.
4.2. Spatial Correlation Analysis of the IOE-WEF in YREB
- (1)
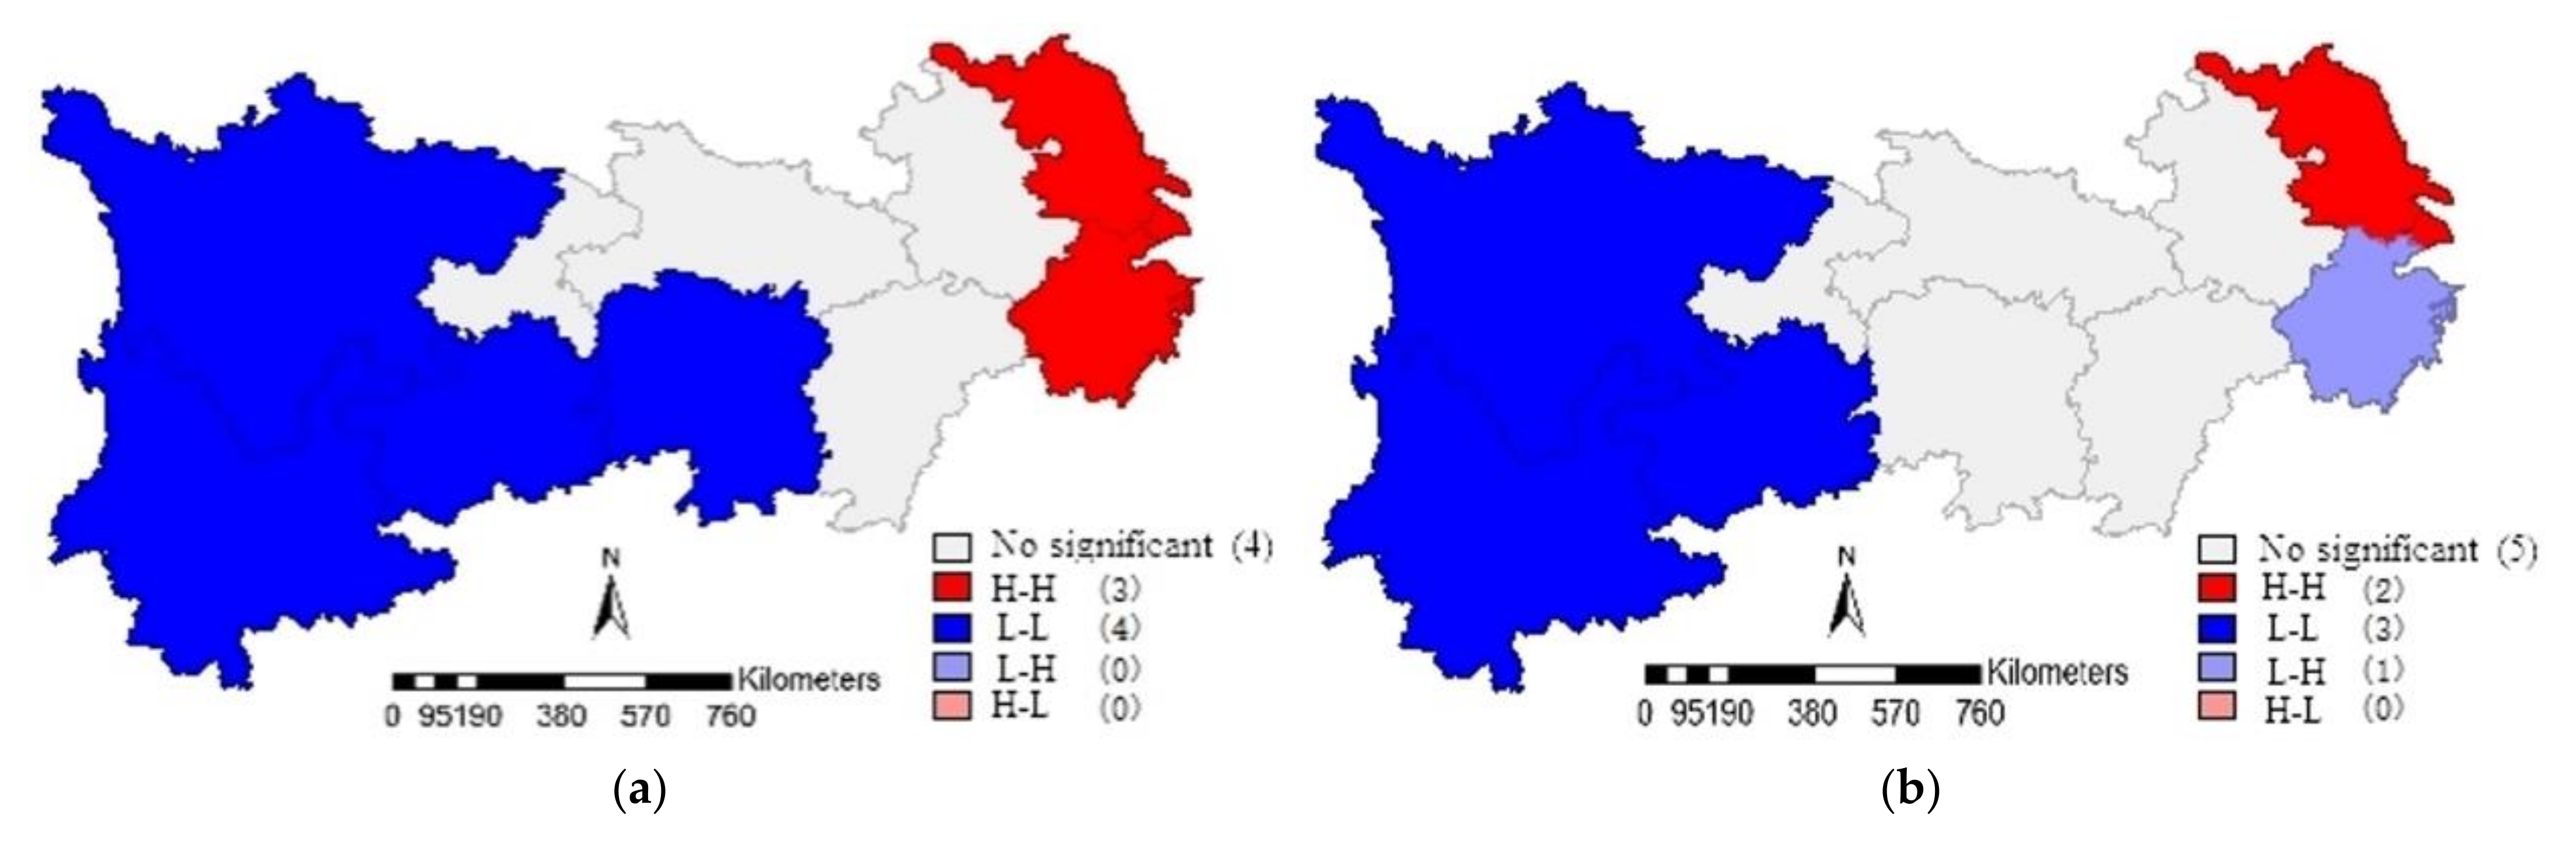
- In Figure 3, the spatial aggregation types of the IOE-WEF in the YREB were mainly “high-high” and “low-low”. The “high-high” clustering type occurred in the lower reaches of the YREB, while the “low-low” clustering type occurred in the upper reaches of the YREB.
- (2)
- Actually, in 2008, seven provinces passed the significance test, among which Jiangsu, Shanghai, and Zhejiang were “high-high” clusters, while Sichuan, Yunnan, Guizhou, and Hunan were “low-low” clusters.
- (3)
- In 2017, six provinces passed the significance test, with Jiangsu and Shanghai as “high-high” clusters, Zhejiang as “low-high” clusters, and Sichuan, Yunnan, and Guizhou as “low-low” clusters.
- (4)
- Combined with LISA aggregation maps of other years, it could be seen that Jiangsu, Shanghai, and Zhejiang were basically stable in “high-high” aggregation areas, and the IOE-WEF between provinces had a positive spatial spillover effect.
- (5)
- Under the promotion of integration policy of the Yangtze River Delta, the Yangtze River Delta region has continued to cooperate and exchange, forming a good situation of mutual promotion and coordinated development. However, Anhui province, as a member of the Yangtze River Delta region, has not shown a significant spatial aggregation effect, so it still needs to strengthen the exchange and cooperation with other provinces further.
- (6)
- Sichuan and Yunnan were basically stable in the “low-low” aggregation area, the two provinces with large tourism resources are adjacent to each other and have similar types and richness of resources. For the past few years, with the development of the economy, the demand for resources in the two provinces has greatly increased; coupled with the weak consciousness of government and residents to save, their ecological environment has been damaged to varying degrees.
4.3. Analysis of Driving Forces of IOE-WEF
4.3.1. Variable Selection and Indicator Description
- (1)
- Environmental regulation (ER). Environmental regulation was represented by the proportion of industrial pollution control investment in GDP. From one side, due to the pressure of environmental regulation, the government and companies would invest more resources in environmental protection and waste treatment, which would help improve the technical level of resource utilization and pollutant treatment. On the other side, environmental regulation might increase the production cost of government and enterprises, which was not conducive to the improvement of IOE-WEF.
- (2)
- Industrial structure (IS). The industrial structure was characterized by the proportion of tertiary industry. Industrial structure has a crucial influence on the IOE-WEF.
- (3)
- Government support (GS). Government support was characterized by the proportion of fiscal expenditure on science and education. Government expenditure on science and education helps to promote social progress and improve the overall quality of the population, which in turn improves the IOE-WEF.
- (4)
- Mechanization level (ML). The level of mechanization directly affects the efficiency of agricultural production; the higher the level of agricultural mechanization, the more efficient the use of resources.
- (5)
- Technological innovation (TI). Technological innovation was represented by the number of patents granted, the progress of scientific and technological level can contribute to the improvement of enterprise production efficiency and pollution control level.
4.3.2. Selection of Spatial Econometric Model
- (1)
- The regression coefficient of environmental regulation was significantly positive, showing that environmental regulation had a significant contribution to the IOE-WEF of YREB. The increase of investment in industrial pollution treatment implied that more capital, technology, and talents would flow into industrial pollutant treatment, which could not only improve the utilization efficiency of WEF through recycling, but also contribute to ecological, environmental protection.
- (2)
- The regression coefficient of technological innovation was prominently positive, revealing that technological progress had a significant contribution to the IOE-WEF. With the increase in the number of patents granted, more and more patents were transformed into advanced technologies and productivity, which greatly improved the utilization efficiency of WEF.
- (3)
- The regression coefficient of the industrial structure was notably negative, indicating that industrial structure had a negative impact on IOE-WEF. At present, the tertiary industry in the YREB is still dominated by high-consumption industries such as wholesale and retail, restaurants, and accommodation and has not yet fully realized the transformation and upgrading to high-tech service industries [63]. Optimizing the industrial structure and improving the IOE-WEF still need to be improved.
- (4)
- The regression coefficient of mechanization level was markedly negative, illustrating that mechanization level had a significant negative effect on the IOE-WEF. The reason might be that agricultural production is still dominated by small-scale family operations in China, with less use of large and medium-sized agricultural machinery. In addition, with the outflow of a large amount of agricultural population and the reduction of arable land, fewer and fewer people are engaged in agricultural production, and a large number of agricultural machinery are abandoned.
- (5)
- The regression coefficient of government support was not significant. It demonstrated that the effect of government support on IOE-WEF was not significant, which was different from the results of [39]. The reason might be that the difference in government support between the region and the adjacent region made the spillover effect smaller. In addition, it took a certain amount of time for the cultivation of talents and the overall improvement of the quality of residents. Therefore, there might be a time lag in the improvement of the IOE-WEF by the input of science and education. Scholars believed that excessive support from the government would disrupt the market order and reduce the efficiency of resource allocation and utilization. In addition, excessive support from the local government would attract the surrounding production factors to the local area and hinder the development of surrounding areas [64,65].
- (6)
- The regression coefficient ρ of spatial lag term of the explained variable was 0.887, and was significantly non-zero, which verified the spatial correlation of IOE-WEF in adjacent regions of YREB, that was, for every 1% increase of IOE-WEF in the adjacent areas, the IOE-WEF in the region would increase by 0.887%.
5. Conclusions
- (1)
- From the aspects of time series, the IOE-WEF in YREB was relatively low. The average value of the IOE-WEF in YREB fluctuated in the range of [0.4–0.6], which did not reach DEA efficiency. Regionally, the efficiency values of the upper and lower reaches in the YREB were low, and neither of them was DEA effective. What is more, the IOE-WEF in YREB displayed a fluctuating downward pattern when considering the undesirable outputs. Especially in 2016 and 2017, the efficiency values of the lower reaches showed a significant downward trend.
- (2)
- The spatial distribution of IOE-WEF in YREB was uneven, and the efficiency values of the three sub-regions of YREB were “the lower reaches> the middle reaches > the upper reaches”. Sichuan, Hubei, Hunan, and Jiangxi provinces declined from the medium efficiency zone to the low-efficiency zone over time. The IOE-WEF of Jiangsu province and Shanghai city have been at a high level, while Zhejiang province dropped to the medium efficiency zone in 2017, and Anhui province has been in the low-efficiency zone.
- (3)
- The IOE-WEF of YREB had a prominently positive spatial correlation, and its spatial aggregation effect is gradually weakening. The Moran’s I measurement results were all positive, and all passed the 1% significance test from 2008 to 2017. In 2010, the Global Moran’s I of IOE-WEF in the YREB reached its maximum, illustrating that the spatial aggregation effect of IOE-WEF in the YREB was the strongest in 2010. Then the GMI showed a decreasing trend. By the local auto-correlation test, the spatial aggregation types of the IOE-WEF in the YREB were mainly “high-high” and “low-low”, and the “high-high” clustering type occurred in the lower reaches of the YREB, while the “low-low” clustering type occurred in the upper reaches of the YREB.
- (4)
- The improvement of environmental regulation and technological innovation was the key to promoting the IOE-WEF of YREB. The improvement of industrial structure, government support, and mechanization level had not yet become an effective help to promote the improvement of IOE-WEF of YREB. In addition, the role of government support of IOE-WEF in the YREB was not yet obvious. Finally, the IOE-WEF of YREB has an obvious spatial spillover effect, and the optimization of IOE-WEF in adjacent regions also has a positive effect on the local area.
Author Contributions
Funding
Institutional Review Board Statement
Informed Consent Statement
Data Availability Statement
Conflicts of Interest
References
- Chakraborty, I.; Maity, P. COVID-19 Outbreak: Migration, Effects on Society, Global Environment and Prevention. Sci. Total Environ. 2020, 728, 138882. [Google Scholar] [CrossRef]
- Fulzele, R.; Fulzele, V.; Dharwal, M. Mapping the Impact of COVID-19 Crisis on the Progress of Sustainable Development Goals (SDGs)—A Focus on Global Environment and Energy Efficiencies. Mater. Today Proc. 2021, in press. [Google Scholar] [CrossRef] [PubMed]
- He, J.; Li, Z.; Zhang, X.; Wang, H.; Dong, W.; Chang, S.; Ou, X.; Guo, S.; Tian, Z.; Gu, A.; et al. Comprehensive Report on China’s Long-Term Low-Carbon Development Strategies and Pathways. Chin. J. Popul. Resour. Environ. 2020, 18, 263–295. [Google Scholar] [CrossRef]
- United Nations. The Paris Agreement. 2015. Available online: https://www.un.org/zh/climatechange/paris-agreement (accessed on 9 November 2021).
- Qiu, S.; Lei, T.; Yao, Y.; Wu, J.; Bi, S. Impact of High-Quality-Development Strategy on Energy Demand of East China. Energy Strategy Rev. 2021, 38, 100699. [Google Scholar] [CrossRef]
- NDC Registry. In Proceedings of the United Nations Framework Convention on Climate Change, New York, NY, USA, 14–15 June 2018; Available online: https://unfccc.int/process-and-meetings/the-paris-agreement/nationally-determined-contributions-ndcs/nationally-determined-contributions-ndcs#eq-4 (accessed on 9 November 2021).
- Intergovernmental Panel on Climate Change. The Fifth Assessment Report: Summary for Policymakers; IPPC: Geneva, Switzerland, 2014. [Google Scholar]
- SCPRC. The State Council of the People‘s Republic of China (Scprc). Injecting China’s Power into the Response to Climate Change. 2020. Available online: http://www.scio.gov.cn/m/zfbps/32832/Document/1715506/1715506.htm (accessed on 10 November 2021).
- Jiang, Y.; Lin, L.; Chen, L.; Ni, H.; Ge, W.; Cheng, H.; Zhai, G.; Wang, G.; Ban, Y.; Li, Y.; et al. An Overview of the Resources and Environment Conditions and Major Geological Problems in the Yangtze River Economic Zone, China. China Geol. 2018, 1, 435–449. [Google Scholar] [CrossRef]
- Xi, J.P. Speech at the Symposium on Promoting the Development of the Yangtze River Economic Belt. Soc. Forum 2019, 34, 5–9. [Google Scholar]
- The State Council of the People’S Republic of China. The State Council’s Advisory Recommendations on Promoting the Yangtze River Economic Belt Development Based on the Golden Watercourse. Sci. Bull. 2014, 62, 648–651. (In Chinese) [Google Scholar]
- Kong, Y.; He, W.; Yuan, L.; Zhang, Z.; Gao, X.; Zhao, Y.; Mulugeta Degefu, D. Decoupling Economic Growth From Water Consumption in the Yangtze River Economic Belt, China. Ecol. Indic. 2021, 123, 107344. [Google Scholar] [CrossRef]
- Bai, N.R.; Yan, Q.M.; He, C.P.; Qu, F.Y. Research on high-quality development of the Yangtze River Economic Belt. Macroecon. Manag. 2020, 62, 67–74. [Google Scholar]
- Fang, C.D.; Cheng, J.H.; Zhao, P.D. Temporal and spatial evolution of Mineral-Economic-Environment coordination degree in the Yangtze River Economic Belt under the Great Protection Strategy. Chin. J. Popul. Resour. Environ. 2019, 29, 65–73. [Google Scholar]
- Wu, C.Q.; Deng, M.L. Agglomeration Features and Influencing Factors of High Energy-consuming Industries in the Yangtze River Economic Belt. Sci. Technol. Prog. Policy 2018, 35, 67–74. [Google Scholar]
- Hoff, H. Understanding the Nexus. In Background Paper for the Bonn 2011 Conference: The Water Energy and Food Security Nexus; Stockholm Environment Institute: Stockholm, Sweden, 2011. [Google Scholar]
- Xu, X.; Yang, G.; Tan, Y.; Liu, J.; Hu, H. Ecosystem Services Trade-Offs and Determinants in China’s Yangtze River Economic Belt From 2000 to 2015. Sci. Total Environ. 2018, 634, 1601–1614. [Google Scholar] [CrossRef] [PubMed]
- Lu, D.D. Conservation of the Yangtza River and sustainable development of the Yangtze River Economic Belt: An understanding of General Secretary Xi Jinping’s important instructions and suggestions for their implementation. Acta Geogr. Sin. 2018, 73, 1829–1836. [Google Scholar]
- Wang, H.M.; Hong, J.; Liu, G. Simulation research on different policies of regional green development under the nexus of water-energy-food. Chin. J. Popul. Resour. Environ. 2019, 29, 74–84. [Google Scholar]
- Chang, Y.; Xia, P.; Wang, J.P. Overview of water-energy-food nexus and its enlightenment to China. Water Resour. Dev. Res. 2016, 5, 67–70. [Google Scholar]
- Bahri, M. Analysis of the Water, Energy, Food and Land Nexus Using the System Archetypes: A Case Study in the Jatiluhur Reservoir, West Java, Indonesia. Sci. Total Environ. 2020, 716, 137025. [Google Scholar] [CrossRef] [PubMed]
- Ibrahim, M.D.; Ferreira, D.C.; Daneshvar, S.; Marques, R.C. Transnational Resource Generativity: Efficiency Analysis and Target Setting of Water, Energy, Land, and Food Nexus for OECD Countries. Sci. Total Environ. 2019, 697, 134017. [Google Scholar] [CrossRef] [PubMed]
- De Loë, R.C.; James, J. Patterson. Rethinking Water Governance: Moving Beyond Water-Centric Perspectives in a Connected and Changing World. Nat. Resour. J. 2017, 57, 75–100. [Google Scholar]
- Ringler, C.; Bhaduri, A.; Lawford, R. The Nexus across Water, Energy, Land and Food (WELF): Potential for Improved Resource Use Efficiency? Curr. Opin. Env. Sust. 2013, 5, 617–624. [Google Scholar] [CrossRef]
- Howarth, C.; Monasterolo, I. Understanding Barriers to Decision Making in the UK Energy-Food-Water Nexus: The Added Value of Interdisciplinary Approaches. Environ. Sci. Policy 2016, 61, 53–60. [Google Scholar] [CrossRef] [Green Version]
- Venghaus, S.; Hake, J.F. Nexus Thinking in Current EU Policies–the Interdependencies Among Food, Energy and Water Resources. Environ. Sci. Policy 2018, 90, 183–192. [Google Scholar] [CrossRef]
- Feng, C.; Qu, S.; Jin, Y.; Tang, X.; Liang, S.; Chiu, A.S.F.; Xu, M. Uncovering Urban Food-Energy-Water Nexus Based on Physical Input-Output Analysis: The Case of the Detroit Metropolitan Area. Appl. Energy 2019, 252, 113422. [Google Scholar] [CrossRef]
- Xiao, Z.; Yao, M.; Tang, X.; Sun, L. Identifying Critical Supply Chains: An Input-Output Analysis for Food-Energy-Water Nexus in China. Ecol. Model. 2019, 392, 31–37. [Google Scholar] [CrossRef]
- Ghafoori Kharanagh, S.; Banihabib, M.E.; Javadi, S. An MCDM-based Social Network Analysis of Water Governance to Determine Actors’ Power in Water-Food-Energy Nexus. J. Hydrol. 2020, 581, 124382. [Google Scholar] [CrossRef]
- Wu, N.; Xu, Y.; Liu, X.; Wang, H.; Herrera-Viedma, E. Water–Energy–Food Nexus Evaluation with a Social Network Group Decision Making Approach Based on Hesitant Fuzzy Preference Relations. Appl. Soft Comput. 2020, 93, 106363. [Google Scholar] [CrossRef]
- Elham Bakhshianlamouki, S.M.P.K.; Sušnik, J. A System Dynamics Model to Quantify the Impacts of Restoration Measures On. Sci. Total Environ. 2019, 708, 134874. [Google Scholar] [CrossRef]
- Ravar, Z.; Zahraie, B.; Sharifinejad, A.; Gozini, H.; Jafari, S. System Dynamics Modeling for Assessment of Water–Food–Energy Resources Security and Nexus in Gavkhuni Basin in Iran. Ecol. Indic. 2020, 108, 105682. [Google Scholar] [CrossRef]
- Han, D.; Yu, D.; Cao, Q. Assessment on the Features of Coupling Interaction of the Food-Energy-Water Nexus in China. J. Clean. Prod. 2020, 249, 119379. [Google Scholar] [CrossRef]
- Li, C.Y.; Zhang, S.Q. Chinese provincial water-energy-food coupling coordination degree and influencing factors research. Chin. J. Popul. Resour. Environ. 2020, 30, 120–128. [Google Scholar]
- Li, G.J.; Huang, D.H.; Li, Y.L. Evaluation on the efficiency of the input and output of water-energy-food in different regions of China. Comp. Econ. Soc. Syst. 2017, 3, 138–148. [Google Scholar]
- Chen, J.; Ding, T.; Wang, H.; Yu, X. Research on Total Factor Productivity and Influential Case Study on Inner Mongolia, China. Int. J. Environ. Res. Public Health 2019, 16, 3051. [Google Scholar] [CrossRef] [PubMed] [Green Version]
- Sun, C.Z.; Hao, S.; Zhao, L.S. Spatial-temporal differentiation characteristics of water resources-energy-food nexus system efficiency in China. Water Resour. Prot. 2021, 37, 61–68. [Google Scholar]
- Zhou, L.M.; Xie, X.H.; Zhu, Z.D.; Wang, L.X.; Wu, J.Y. Input-output efficiency of agricultural resources based on the water-energy-food nexus. J. Agric. Resour. Environ. 2020, 37, 875–881. [Google Scholar]
- Zhang, J.J.; Wang, W.S.; Li, Y. Regional Water-Energy-Food Green Efficiency, Regional Heterogeneity and Influencing Factors. China Environ. Sci. 2021, 29, 1–14. [Google Scholar]
- Chen, Z.X.; Zhang, S.Q.; Li, C.Y. Research on Inter provincial Water-Energy-Food Comprehensive Utilization Efficiency in China. J. Shandong Univ. Sci. Technol. (Soc. Sci.) 2021, 23, 84–93. [Google Scholar]
- Tang, L.; He, G. How to Improve Total Factor Energy Efficiency? An Empirical Analysis of the Yangtze River Economic Belt of China. Energy 2021, 235, 121375. [Google Scholar] [CrossRef]
- Yang, B.; Wang, Z.; Zou, L.; Zou, L.; Zhang, H. Exploring the Eco-Efficiency of Cultivated Land Utilization and its Influencing Factors in China’s Yangtze River Economic Belt, 2001–2018. J. Environ. Manag. 2021, 294, 112939. [Google Scholar] [CrossRef]
- Pan, Z.W.; Li, Z.X.; Xu, C.H. Environmental regulation and efficiency improvement of regional green water resources—Empirical analysis based on the Yangtze River Economic Belt. World Surv. Res. 2020, 33, 10–17. [Google Scholar]
- Zhao, P.; Zeng, L.; Lu, H.; Zhou, Y.; Hu, H.; Wei, X. Green Economic Efficiency and its Influencing Factors in China From 2008 to 2017: Based On the super-SBM Model with Undesirable Outputs and Spatial Dubin Model. Sci. Total Environ. 2020, 741, 140026. [Google Scholar] [CrossRef]
- Li, H.; Fang, K.; Yang, W.; Wang, D.; Hong, X. Regional Environmental Efficiency Evaluation in China: Analysis Based On the Super-SBM Model with Undesirable Outputs. Math. Comput. Model. 2013, 58, 1018–1031. [Google Scholar] [CrossRef]
- Tone, K. Dealing with Undesirable Outputs in DEA: A Slacks-Based Measure (SBM) Approach. N. Am. Product. Workshop 2004, 2004, 44–45. [Google Scholar]
- Andersen, P.; Petersen, N.C. A Procedure for Ranking Efficient Units in Data Envelopment Analysis. Manag. Sci. 1993, 39, 1261–1264. [Google Scholar] [CrossRef]
- Tone, K. A Slacks-Based Measure of Super-Efficiency in Data Envelopment Analysis. Eur. J. Oper. Res. 2002, 143, 32–41. [Google Scholar] [CrossRef] [Green Version]
- Moran, P.A.P. The Interpretation of Statistical Maps. J. R. Stat. Soc. Ser. B 1948, 10, 243–251. [Google Scholar] [CrossRef]
- Anselin, L. Local Indicators of Spatial Association—LISA. Geogr. Anal. 1995, 27, 93–115. [Google Scholar] [CrossRef]
- Batty, M.; Longley, P. Analytical GIS: The Future. Spatial Analysis: Modelling in a GIS Environment; Wiley: New York, NY, USA, 1996; pp. 345–352. [Google Scholar]
- Xu, Z.; Yao, L. Opening the Black Box of Water-Energy-Food Nexus System in China: Prospects for Sustainable Consumption and Security. Environ. Sci. Policy 2022, 127, 66–76. [Google Scholar] [CrossRef]
- Feng, W.B.; Wu, G.H. Try to discuss the basic characteristic of natural resource system. Territ. Nat. Resour. Study 1993, 35, 111–121. [Google Scholar]
- Rodríguez-Merchan, V.; Ulloa-Tesser, C.; Baeza, C.; Casas-Ledón, Y. Evaluation of the Water–Energy Nexus in the Treatment of Urban Drinking Water in Chile through Exergy and Environmental Indicators. J. Clean. Prod. 2021, 317, 128494. [Google Scholar] [CrossRef]
- Liu, S.Y.; Wang, Z.Y.; Han, M.Y.; Wang, G.D.; Hayat, T.; Chen, G.Q. Energy-Water Nexus in Seawater Desalination Project: A Typical Water Production System in China. J. Clean. Prod. 2021, 279, 123412. [Google Scholar] [CrossRef]
- Hua, E.; Wang, X.; Engel, B.A.; Qian, H.; Sun, S.; Wang, Y. Water Competition Mechanism of Food and Energy Industries in WEF Nexus: A Case Study in China. Agr. Water Manag. 2021, 254, 106941. [Google Scholar] [CrossRef]
- Tapia, J.F.D.; Samsatli, S.; Doliente, S.S.; Martinez-Hernandez, E.; Ghani, W.A.B.W.; Lim, K.L.; Shafri, H.Z.M.; Shaharum, N.S.N.B. Design of Biomass Value Chains that are Synergistic with the Food–Energy–Water Nexus: Strategies and Opportunities. Food Bioprod. Process. 2019, 116, 170–185. [Google Scholar] [CrossRef]
- Bender, M.H. Potential Conservation of Biomass in the Production of Synthetic Organics. Resour. Conserv. Recycl. 2000, 30, 49–58. [Google Scholar] [CrossRef]
- Scardigno, A. New Solutions to Reduce Water and Energy Consumption in Crop Production: A Water–Energy–Food Nexus Perspective. Curr. Opin. Environ. Sci. Health 2020, 13, 11–15. [Google Scholar] [CrossRef]
- Huang, D.; Shen, Z.; Sun, C.; Li, G. Shifting from Production-Based to Consumption-Based Nexus Governance: Evidence from an Input–Output Analysis of the Local Water-Energy-Food Nexus. Water Resour. Manag. 2021, 35, 1673–1688. [Google Scholar] [CrossRef]
- Chen, S.Y. The pattern and economic explanation of China’s carbon emission intensity fluctuation. J. World Econ. 2011, 34, 124–143. [Google Scholar]
- Yang, Q.; Liu, H.J. Regional difference decomposition and influence factors of China’s carbon dioxide emissions. J. Quant. Tech. Econ. 2012, 29, 36–49. [Google Scholar]
- Wang, K.; Wu, M.; Sun, Y.; Shi, X.; Sun, A.; Zhang, P. Resource Abundance, Industrial Structure, and Regional Carbon Emissions Efficiency in China. Resour. Policy 2019, 60, 203–214. [Google Scholar] [CrossRef]
- Wang, S.; Zhao, D.; Chen, H. Government Corruption, Resource Misallocation, and Ecological Efficiency. Energy Econ. 2020, 85, 104573. [Google Scholar] [CrossRef]
- Song, M.; Jin, P. Regional Protection, Resource Misallocation and Environmental Welfare Performance. Econ. Res. J. 2016, 57, 410–429. [Google Scholar]

| Indicator Type | Indicators | Variable | Indicator Unit |
|---|---|---|---|
| Input indicators | Resource inputs | Water consumption | 108 m3 |
| Energy consumption | 104 tce | ||
| Consumption of chemical fertilizer | 104 Ton | ||
| Consumption of agricultural plastic film | 104 Ton | ||
| Total sown area of crops | 104 hectare | ||
| Labor input | Employment population | 104 person | |
| Capital inputs | Fixed assets investment | 108 yuan | |
| Desirable outputs | Economic benefits | Regional GDP | 108 yuan |
| Undesirable outputs | Environmental costs | Environmental pollution index | % |
| Year | Moran’s I | Z Value | Prob. |
|---|---|---|---|
| 2008 | 0.611 | 3.961 | 0.003 |
| 2009 | 0.608 | 3.953 | 0.002 |
| 2010 | 0.620 | 4.029 | 0.002 |
| 2011 | 0.610 | 4.011 | 0.002 |
| 2012 | 0.606 | 4.007 | 0.002 |
| 2013 | 0.593 | 3.942 | 0.002 |
| 2014 | 0.585 | 3.945 | 0.002 |
| 2015 | 0.583 | 3.920 | 0.002 |
| 2016 | 0.417 | 3.561 | 0.002 |
| 2017 | 0.366 | 3.382 | 0.002 |
| Driving Forces Classification | Driving Forces | Variable | Variable Symbol |
|---|---|---|---|
| Environment | Environmental regulation | Environmental pollution control investment /GDP | ER |
| Socio-economy | Industrial structure | Value-added of tertiary industry/GDP | IS |
| Government support | Science and education expenditures/fiscal expenditures | GS | |
| Mechanization level | Total power of agricultural machinery | ML | |
| Technology | Technology innovation | Number of patents granted | TI |
| Test | LM-Lag | Robust LM-Lag | LM-Error | Robust LM-Error |
|---|---|---|---|---|
| LM | 30.559 *** | 4.934 ** | 26.724 *** | 1.100 |
| p-value | 0.000 | 0.026 | 0.000 | 0.294 |
| Variable | Coef. | Std. Err. | t | p > |t| |
|---|---|---|---|---|
| In(ER) | 0.115 *** | 0.028 | 4.168 | 0.000 |
| In(IS) | −0.234 * | 0.129 | −1.816 | 0.069 |
| In(GS) | −0.159 | 0.116 | −1.378 | 0.168 |
| In(ML) | −0.0776 *** | 0.022 | −3.540 | 0.000 |
| In(TI) | 0.067 *** | 0.015 | 4.384 | 0.000 |
| ρ | 0.887 *** | |||
| δ2 | 0.019 | |||
| Log-likelihood | 37.578 | |||
| Hausman | 140.83 *** |
Publisher’s Note: MDPI stays neutral with regard to jurisdictional claims in published maps and institutional affiliations. |
© 2022 by the authors. Licensee MDPI, Basel, Switzerland. This article is an open access article distributed under the terms and conditions of the Creative Commons Attribution (CC BY) license (https://creativecommons.org/licenses/by/4.0/).
Share and Cite
Ge, M.; Yu, K.; Ding, A.; Liu, G. Input-Output Efficiency of Water-Energy-Food and Its Driving Forces: Spatial-Temporal Heterogeneity of Yangtze River Economic Belt, China. Int. J. Environ. Res. Public Health 2022, 19, 1340. https://doi.org/10.3390/ijerph19031340
Ge M, Yu K, Ding A, Liu G. Input-Output Efficiency of Water-Energy-Food and Its Driving Forces: Spatial-Temporal Heterogeneity of Yangtze River Economic Belt, China. International Journal of Environmental Research and Public Health. 2022; 19(3):1340. https://doi.org/10.3390/ijerph19031340
Chicago/Turabian StyleGe, Min, Kaili Yu, Ange Ding, and Gaofeng Liu. 2022. "Input-Output Efficiency of Water-Energy-Food and Its Driving Forces: Spatial-Temporal Heterogeneity of Yangtze River Economic Belt, China" International Journal of Environmental Research and Public Health 19, no. 3: 1340. https://doi.org/10.3390/ijerph19031340