
Prevalence and Risk Factors of Metabolic-Associated Fatty Liver Disease among 73,566 Individuals in Beijing, China


Abstract
:1. Introduction
2. Methods
2.1. Study Population and Data Collection
2.2. Blood Collection and Testing
2.3. Transient Elastography
2.4. Diagnostic Criteria
2.4.1. MAFLD
2.4.2. BMI
2.4.3. Hypertension and DM
2.5. Statistical Analysis
3. Results
3.1. Characteristics of Study Population
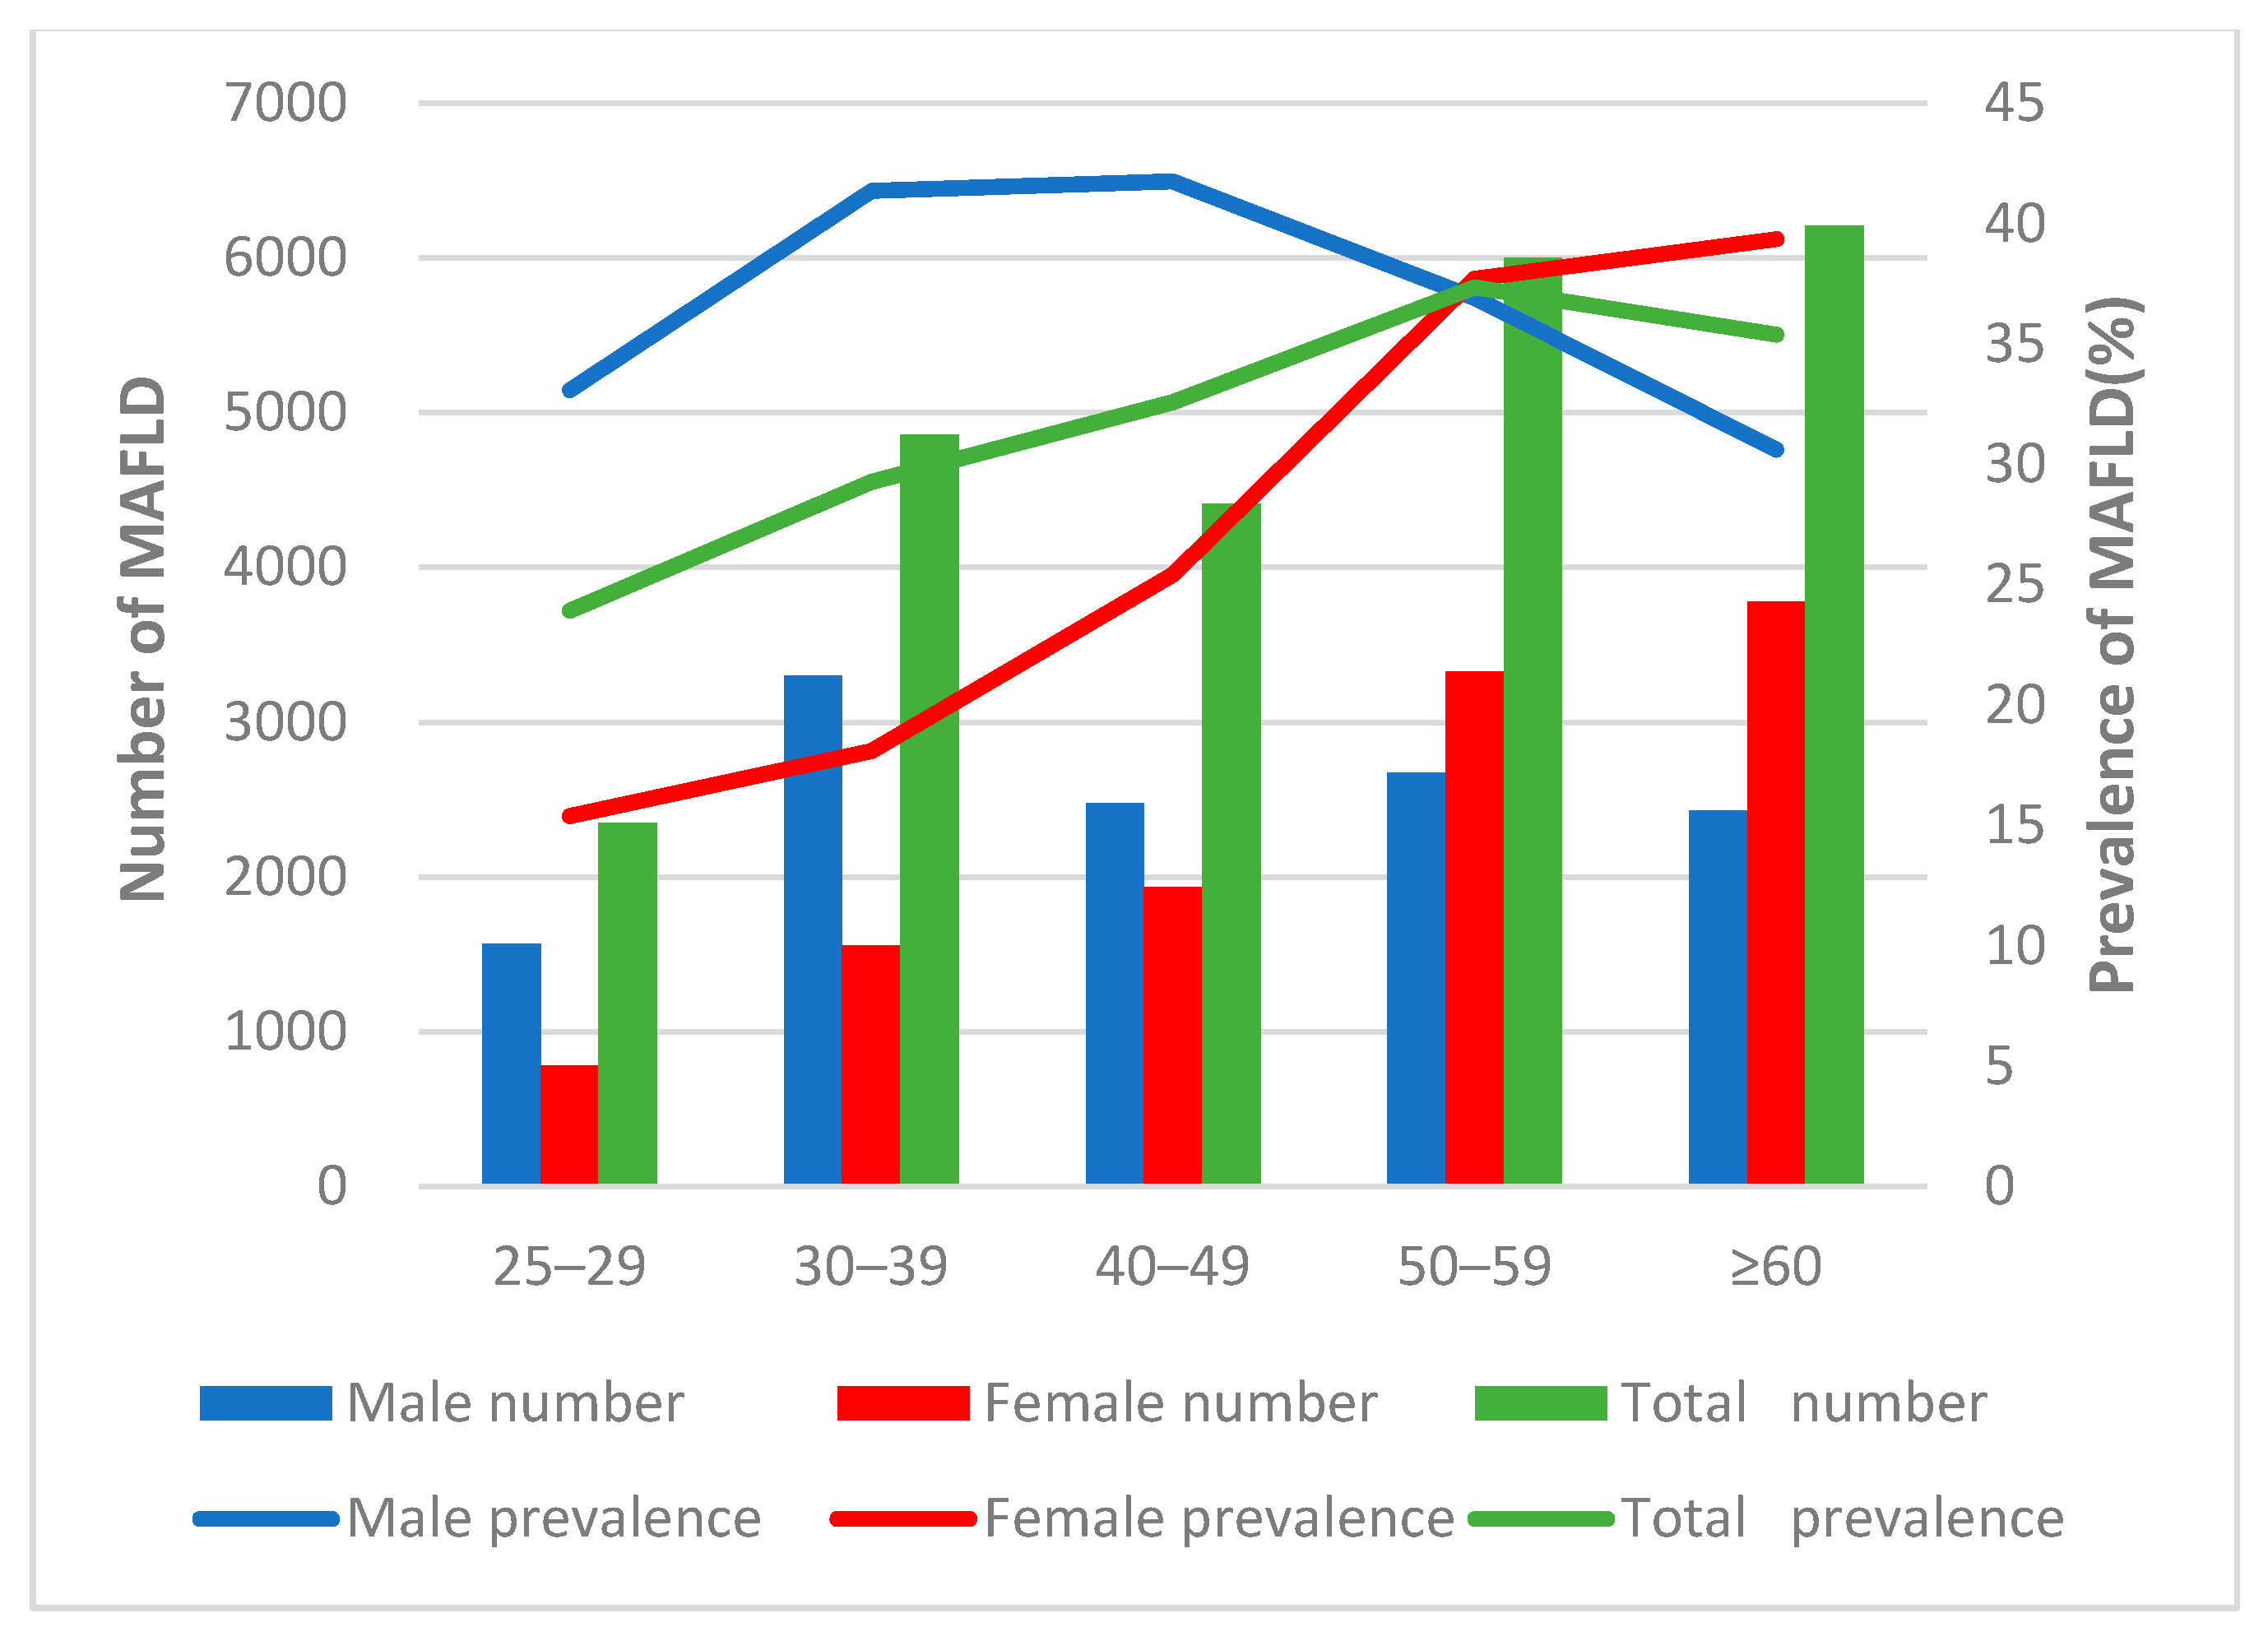
3.2. Age and Gender-Specific Prevalence of MAFLD
3.3. Comparison of Blood Parameters among MAFLD and Non-MAFLD Participants
3.4. Factors Associated with Fatty Liver MAFLD
3.5. Comparison of the Blood Parameters between MAFLD Participants with Different BMI
4. Discussion
5. Conclusions
Author Contributions
Funding
Institutional Review Board Statement
Informed Consent Statement
Acknowledgments
Conflicts of Interest
References
- Eslam, M.; Newsome, P.N.; Sarin, S.K.; Anstee, Q.M.; Targher, G.; Romero-Gomez, M.; Zelber-Sagi, S.; Wong, V.W.-S.; Dufour, J.-F.; Schattenberg, J.M.; et al. A new definition for metabolic dysfunction-associated fatty liver disease: An inter-national expert consensus statement. J. Hepatol. 2020, 73, 202–209. [Google Scholar] [CrossRef] [PubMed]
- Li, Z.; Xue, J.; Chen, P.; Chen, L.; Yan, S.; Liu, L. Prevalence of nonalcoholic fatty liver disease in mainland of China: A meta-analysis of published studies. J. Gastroenterol. Hepatol. 2014, 29, 42–51. [Google Scholar] [CrossRef] [PubMed]
- Liu, C.-J. Prevalence and risk factors for non-alcoholic fatty liver disease in Asian people who are not obese. J. Gastroenterol. Hepatol. 2012, 27, 1555–1560. [Google Scholar] [CrossRef]
- Younossi, Z.M.; Koenig, A.B.; Abdelatif, D.; Fazel, Y.; Henry, L.; Wymer, M. Global epidemiology of nonalcoholic fatty liver disease-Meta-analytic assessment of prevalence, incidence, and outcomes. Hepatology 2016, 64, 73–84. [Google Scholar] [CrossRef] [PubMed] [Green Version]
- Yang, C.; Yang, S.; Xu, W.; Zhang, J.; Fu, W.; Feng, C. Association between the hyperuricemia and nonalcoholic fatty liver disease risk in a Chinese population: A retrospective cohort study. PLoS ONE 2017, 12, e0177249. [Google Scholar] [CrossRef] [PubMed]
- Qu, Y.; Song, Y.-Y.; Chen, C.-W.; Fu, Q.-C.; Shi, J.-P.; Xu, Y.; Xie, Q.; Yang, Y.-F.; Zhou, Y.-J.; Li, L.-P.; et al. Diagnostic Performance of FibroTouch Ultrasound Attenuation Parameter and Liver Stiffness Measurement in Assessing Hepatic Steatosis and Fibrosis in Patients With Nonalcoholic Fatty Liver Disease. Clin. Transl. Gastroenterol. 2021, 12, e00323. [Google Scholar] [CrossRef]
- Zhou, J.; Zhou, F.; Wang, W.; Zhang, X.; Ji, Y.; Zhang, P.; She, Z.; Zhu, L.; Cai, J.; Li, H. Epidemiological Features of NAFLD From 1999 to 2018 in China. Hepatol. 2020, 71, 1851–1864. [Google Scholar] [CrossRef] [PubMed]
- Chris, E.; Quentin, M.A.; Maria, T.A.; Bantel, H.; Bellentani, S.; Caballeria, J.; Colombo, M.; Craxi, A.; Crespo, J.; Day, C.P.; et al. Modeling NAFLD disease burden in China, France, Germany, Italy, Japan, Spain, United Kingdom, and United States for the period 2016. J. Hepatol. 2018, 69, 896–904. [Google Scholar]
- Lu, Z.-Y.; Shao, Z.; Li, Y.-L.; Wulasihan, M.; Chen, X.-H. Prevalence of and risk factors for non-alcoholic fatty liver disease in a Chinese population: An 8-year follow-up study. World J. Gastroenterol. 2016, 22, 3663–3669. [Google Scholar] [CrossRef] [PubMed]
- Li, H.; Guo, M.; An, Z.; Meng, J.; Jiang, J.; Song, J.; Wu, W. Prevalence and Risk Factors of Metabolic Associated Fatty Liver Disease in Xinxiang, China. Int. J. Environ. Res. Public Health 2020, 17, 1818. [Google Scholar] [CrossRef] [Green Version]
- Fan, J.-G. Epidemiology of alcoholic and nonalcoholic fatty liver disease in China. J. Gastroenterol. Hepatol. 2013, 28 (Suppl. S1), 11–17. [Google Scholar] [CrossRef]
- Chen, Y.-L.; Li, H.; Li, S.; Xu, Z.; Tian, S.; Wu, J.; Liang, X.-Y.; Li, X.; Liu, Z.-L.; Xiao, J.; et al. Prevalence of and risk factors for metabolic associated fatty liver disease in an urban population in China: A cross-sectional comparative study. BMC Gastroenterol. 2021, 21, 212. [Google Scholar] [CrossRef] [PubMed]
- Wong, V.W.-S.; Chu, W.; Wong, G.L.-H.; Chan, R.; Chim, A.M.-L.; Ong, A.; Yeung, D.K.-W.; Yiu, K.K.-L.; Chu, S.H.-T.; Woo, J.; et al. Prevalence of non-alcoholic fatty liver disease and advanced fibrosis in Hong Kong Chinese: A population study using proton-magnetic resonance spectroscopy and transient elastography. Gut 2011, 61, 409–415. [Google Scholar] [CrossRef]
- Chen, C.-H.; Huang, M.-H.; Yang, J.-C.; Nien, C.-K.; Yang, C.-C.; Yeh, Y.-H.; Yueh, S.-K. Prevalence and Risk Factors of Nonalcoholic Fatty Liver Disease in an Adult Population of Taiwan: Metabolic Significance of Nonalcoholic Fatty Liver Disease in Nonobese Adults. J. Clin. Gastroenterol. 2006, 40, 745–752. [Google Scholar] [CrossRef]
- Eslam, M.; Sanyal, A.J.; George, J. International consensus P: MAFLD: A consensus-driven proposed nomenclature for metabolic associated fatty liver disease. Gastroenterology 2020, 158, 1999–2014.e1. [Google Scholar] [CrossRef]
- Ylse, G.G.; Guadalupe, P.R.; Ramos, M.H.; Uribe, M.; Méndez-Sánchez, N. Prevalence of non alcoholic fatty liver disease in premenopausal, postmenopausal and polycystic ovary syndrome women. The role of estrogens. Ann. Hepatol. 2010, 9, 402–409. [Google Scholar]
- Sookoian, S.; Castano, G.O.; Pirola, C.J. Modest alcohol consumption decreases the risk of non-alcoholic fatty liver disease: A me-ta-analysis of 43,175 individuals. Gut 2014, 63, 530–532. [Google Scholar] [CrossRef] [PubMed]
- Yamamura, S.; Eslam, M.; Kawaguchi, T.; Tsutsumi, T.; Nakano, D.; Yoshinaga, S.; Takahashi, H.; Anzai, K.; George, J.; Torimura, T. MAFLD identifies patients with significant hepatic fibrosis better than NAFLD. Liver Int. 2020, 40, 3018–3030. [Google Scholar] [CrossRef]
- Mitchell, T.; Jeffrey, G.P.; de Boer, B.; MacQuillan, G.; Garas, G.; Ching, H.; Hamdorf, J.; Adams, L.A. Type and Pattern of Alcohol Consumption is Associated With Liver Fibrosis in Patients With Non-alcoholic Fatty Liver Disease. Am. J. Gastroenterol. 2018, 113, 1484–1493. [Google Scholar] [CrossRef] [PubMed]
- Weng, G.; Dunn, W. Effect of alcohol consumption on nonalcoholic fatty liver disease. Transl. Gastroenterol. Hepatol. 2019, 4, 70. [Google Scholar] [CrossRef]
- Feng, R.-N.; Du, S.-S.; Wang, C.; Li, Y.-C.; Liu, L.-Y.; Guo, F.-C.; Sun, C.-H. Lean-non-alcoholic fatty liver disease increases risk for metabolic disorders in a normal weight Chinese population. World J. Gastroenterol. 2014, 20, 17932–17940. [Google Scholar] [CrossRef] [PubMed]
- Semmler, G.; Wernly, S.; Bachmayer, S.; Wernly, B.; Schwenoha, L.; Huber-Schönauer, U.; Stickel, F.; Niederseer, D.; Aigner, E.; Datz, C. Nonalcoholic Fatty Liver Disease in Lean Subjects: Associations With Metabolic Dysregulation and Cardiovascular Risk—A Single-Center Cross-Sectional Study. Clin. Transl. Gastroenterol. 2021, 12, e00326. [Google Scholar] [CrossRef] [PubMed]

| Variable | Total (%) | Non-MAFLD (%) | MAFLD (%) | p |
|---|---|---|---|---|
| N | 73,566 | 23,832 | 49,734 | |
| Gender | ||||
| Male | 33,840 (46.00) | 21,388 (60.20) | 12,452 (36.80) | <0.001 |
| Female | 39,726 (54.00) | 28,346 (71.35) | 11,380 (28.65) | |
| Age group | ||||
| 25–29 | 9816 (13.34) | 7467 (76.07) | 2349 (23.93) | <0.001 |
| 30–39 | 16,589 (22.54) | 11,731 (70.72) | 4858 (29.28) | |
| 40–49 | 13,545 (18.41) | 9132 (67.42) | 4413 (32.58) | |
| 50–59 | 16,071 (21.85) | 10,068 (62.65) | 6003 (37.35) | |
| ≥60 | 17,545 (23.85) | 11,336 (64.61) | 6209 (35.39) | |
| Residence | ||||
| Rural | 32,381 (44.02) | 28,014 (68.02) | 13,171 (31.98) | 0.007 |
| City | 41,185 (55.98) | 21,720 (67.08) | 10,661 (32.92) | |
| Education | ||||
| Middle school | 30,796 (41.86) | 19,798 (64.29) | 10,998 (35.71) | <0.001 |
| High school | 17,913 (24.35) | 11,944 (66.68) | 5969 (33.32) | |
| Undergraduate | 22,222 (30.21) | 15,854 (71.34) | 6368 (28.66) | |
| Graduate | 2635 (3.58) | 2138 (81.14) | 497 (18.86) | |
| BMI | ||||
| Normal | 19,867 (27.00) | 19,143 (96.36) | 724 (3.64) | <0.001 |
| Overweight | 14,722 (20.00) | 12,710 (86.33) | 2012 (13.67) | |
| Obese | 38,977 (52.98) | 17,881 (45.88) | 21,096 (54.12) | |
| Hypertension | ||||
| No | 49,795 (67.69) | 13,437 (73.02) | 36,358 (26.98) | <0.001 |
| Yes | 23,771 (32.3) | 10,395 (56.27) | 13,376 (43.73) | |
| DM | ||||
| No | 64,515 (87.70) | 19,128 (70.35) | 45,387 (29.65) | <0.001 |
| Yes | 9051 (12.30) | 4704 (48.03) | 4347 (51.97) |
| Blood Parameters | All | MAFLD | Non-MAFLD | p |
|---|---|---|---|---|
| Waist-to-hip ratio | 0.87 ± 0.71 | 0.91 ± 0.06 | 0.86 ± 0.07 | <0.001 |
| ALT (IU/L) | 22.35 ± 19.78 | 29.62 ± 25.92 | 18.87 ± 14.80 | <0.001 |
| AST(IU/L) | 22.12 ± 12.99 | 24.58 ± 16.29 | 20.94 ± 10.86 | <0.001 |
| TP (g/L) | 77.74 ± 4.90 | 78.17 ± 4.91 | 77.53 ± 4.88 | <0.001 |
| ALB (g/L) | 48.70 ± 3.17 | 48.60 ± 3.28 | 48.75 ± 3.11 | <0.001 |
| TBIL (umol/L) | 12.36 ± 5.17 | 12.20 ± 5.22 | 12.43 ± 5.14 | <0.001 |
| DBIL (umol/L) | 3.62 ± 1.79 | 3.53 ± 1.83 | 3.66 ± 1.77 | <0.001 |
| IBIL (umol/L) | 8.74 ± 3.78 | 8.68 ± 3.82 | 8.77 ± 3.75 | 0.001 |
| ALP (IU/L) | 86.08 ± 26.55 | 91.15 ± 26.56 | 83.65 ± 26.20 | <0.001 |
| GGT (IU/L) | 31.61 ± 37.35 | 41.33 ± 42.32 | 26.95 ± 33.73 | <0.001 |
| TBA (umol/L) | 3.82 ± 4.29 | 4.08 ± 4.64 | 3.70 ± 4.10 | <0.001 |
| CHE (IU/L) | 8326.54 ± 1550.40 | 9021.44 ± 1472.02 | 7993.57 ± 1474.81 | <0.001 |
| PA (g/L) | 0.29 ± 0.05 | 0.30 ± 0.05 | 0.28 ± 0.05 | <0.001 |
| TG (umol/L) | 1.66 ± 1.69 | 2.26 ± 2.23 | 1.37 ± 1.26 | <0.001 |
| FPG (mmol/L)) | 5.96 ± 1.81 | 6.40 ± 2.11 | 5.75 ± 1.60 | <0.001 |
| CHOL (mmo/L) | 5.07 ± 1.02 | 5.23 ± 1.06 | 4.99 ± 0.99 | <0.001 |
| HDL-C (mmo/L) | 1.38 ± 0.33 | 1.26 ± 0.29 | 1.43 ± 0.34 | <0.001 |
| LDL-C (mmo/L) | 2.96 ± 0.84 | 3.14 ± 0.85 | 2.87 ± 0.82 | <0.001 |
| HbA1c (%) | 5.56 ± 0.98 | 5.81 ± 1.14 | 5.44 ± 0.88 | <0.001 |
| RBC× (1012/L) | 4.71 ± 0.46 | 4.82 ± 0.46 | 4.66 ± 0.45 | <0.001 |
| HGB (g/L) | 135.89 ± 15.30 | 139.11 ± 14.92 | 134.34 ± 15.25 | 0.018 |
| HCT (%) | 0.40 ± 0.04 | 0.41 ± 0.04 | 0.39 ± 0.04 | 0.012 |
| MCV (fl) | 84.71 ± 4.59 | 84.48 ± 4.27 | 84.82 ± 4.73 | <0.001 |
| MCH (pg) | 28.91 ± 3.47 | 28.91 ± 4.58 | 28.90 ± 2.78 | 0.002 |
| MCHC (g/L) | 340.95 ± 35.77 | 341.94 ± 53.71 | 340.48 ± 22.57 | 0.68 |
| RDW (%) | 0.11 ± 0.01 | 0.11 ± 0.01 | 0.11 ± 0.01 | 0.001 |
| PLT (×109/L) | 218.14 ± 55.25 | 219.93 ± 58.53 | 217.28 ± 53.59 | <0.001 |
| PDW (%) | 0.20 ± 0.01 | 0.20 ± 0.01 | 0.20 ± 0.01 | 0.003 |
| MPV (fl) | 6.40 ± 1.12 | 6.40 ± 1.11 | 6.41 ± 1.13 | 0.41 |
| PCT (%) | 0.14 ± 0.05 | 0.14 ± 0.07 | 0.14 ± 0.04 | <0.001 |
| WBC (×109/L) | 6.35 ± 1.66 | 6.75 ± 1.70 | 6.15 ± 1.60 | <0.001 |
| LYM (×109/L) | 2.15 ± 0.66 | 2.29 ± 0.68 | 2.08 ± 0.64 | <0.001 |
| MONO (×109/L) | 0.40 ± 0.16 | 0.42 ± 0.16 | 0.39 ± 0.16 | <0.001 |
| NEU (×109/L) | 3.60 ± 1.25 | 3.83 ± 1.27 | 3.50 ± 1.23 | <0.001 |
| EOS (×109/L) | 0.14 ± 0.14 | 0.15 ± 0.16 | 0.13 ± 0.13 | <0.001 |
| BASO (×109/L) | 0.06 ± 0.05 | 0.06 ± 0.06 | 0.06 ± 0.05 | <0.001 |
| AFP (ng/mL) | 3.50 ± 9.49 | 3.66 ± 16.13 | 3.43 ± 2.91 | 0.06 |
| Alcohol_consumption (g) | 6.62 ± 22.13 | 8.07 ± 24.83 | 5.93 ± 20.68 | <0.001 |
| LSM (Kpa) | 6.53 ± 2.83 | 7.41 ± 3.17 | 6.10 ± 2.55 | <0.001 |
| UAP (dB/m) | 230.14 ± 38.33 | 275.04 ± 25.46 | 208.62 ± 20.81 | <0.001 |
| Variables | Coefficient | Standard Error | Odds Ratio (95%CI) | p Value |
|---|---|---|---|---|
| Gender | ||||
| Female | Ref. | |||
| Male | 0.39 | 0.02 | 1.47 (1.43–1.52) | <0.001 |
| Age group | ||||
| 25–29 | Ref. | 0.011 | ||
| 30–39 | 0.25 | 0.03 | 1.29 (1.21–1.36) | <0.001 |
| 40–49 | 0.36 | 0.03 | 1.43 (1.34–1.52) | <0.001 |
| 50–59 | 0.53 | 0.03 | 1.69 (1.59–1.80) | <0.001 |
| ≥60 | 0.42 | 0.03 | 1.52 (1.42–1.62) | <0.001 |
| Residence | ||||
| Rural | Ref. | |||
| City | 0.05 | 0.02 | 1.06 (1.02–1.09) | 0.003 |
| Education | ||||
| Middle school | 0.71 | 0.06 | 2.03 (1.82–2.26) | <0.001 |
| High school | 0.64 | 0.05 | 1.89 (1.70–2.10) | <0.001 |
| Undergraduate | 0.52 | 0.05 | 1.69 (1.52–1.87) | <0.001 |
| Graduate | Ref. | 0.15 |
| Variables | Lean/Normal Weight MAFLD (%) | Overweight MAFLD (%) | Obese MAFLD (%) | Non-MAFLD (%) | p |
|---|---|---|---|---|---|
| N | 724 (0.98) | 2012 (2.74) | 21,096 (28.68) | 49,734 (67.60) | |
| Age group | |||||
| 25–29 | 115 (15.88) | 205 (10.19) | 2029 (9.62) | 7467 (15.01) | <0.001 |
| 30–39 | 148 (20.44) | 404 (20.08) | 4306 (20.41) | 11,731 (23.59) | |
| 40–49 | 111 (15.33) | 372 (18.49) | 3930 (18.63) | 9132 (18.36) | |
| 50–59 | 148 (20.44) | 483 (24.01) | 5372 (25.46) | 10,068 (20.24) | |
| ≥60 | 202 (27.90) | 548 (27.24) | 5459 (25.88) | 11,336 (22.79) | |
| Gender | |||||
| Male | 272 (37.57) | 1019 (50.65) | 11,161 (52.91) | 21,388 (43.00) | <0.001 |
| Female | 452 (62.43) | 993 (49.35) | 9935 (47.09) | 28,346 (56.99) | |
| Hypertension (%) | |||||
| No | 515 (71.13) | 1352 (67.20) | 11,570 (54.85) | 36,358 (73.10) | <0.001 |
| Yes | 209 (28.87) | 660 (32.80) | 9526 (45.15) | 13,376 (26.90) | |
| Diabetes DM (%) | |||||
| No | 635 (87.71) | 1649 (81.96) | 16,844 (79.84) | 45,387 (91.26) | <0.001 |
| Yes | 89 (12.29) | 363 (18.04) | 4252 (20.16) | 4347 (8.74) | |
| Waist circumference (cm) | 80.17 ± 7.53 a | 85.36 ± 6.60 ab | 95.604 ± 8.88 abc | 82.17 ± 9.73 abc | <0.001 |
| Hip circumference (cm) | 93.90 ± 5.41 a | 96.94 ± 5.38 ab | 104.78 ± 7.17 abc | 95.96 ± 6.97 abc | <0.001 |
| ALT (IU/L) | 23.78 ± 44.53 a | 25.43 ± 17.39 ab | 30.22 ± 25.67 abc | 18.87 ± 14.80 abc | <0.001 |
| AST (IU/L) | 23.96 ± 30.30 a | 23.33 ± 15.79 b | 24.72 ± 15.63 bc | 20.94 ± 10.86 abc | <0.001 |
| TP (g/L) | 78.30 ± 4.93 a | 78.41 ± 4.89 bc | 78.15 ± 4.91 bc | 77.53 ± 4.88 abc | <0.001 |
| ALB (g/L) | 48.32 ± 3.50 a | 48.76 ± 3.467 ab | 48.60 ± 3.25 abc | 48.75 ± 3.11 ac | <0.001 |
| TBIL (umol/L) | 12.25 ± 5.42 | 12.56 ± 5.33 b | 12.17 ± 5.20 bc | 12.43 ± 5.14 c | <0.001 |
| DBIL (umol/L) | 3.47 ± 2.14 a | 3.56 ± 1.84 b | 3.53 ± 1.81 c | 3.66 ± 1.77 abc | <0.001 |
| IBIL (umol/L) | 8.78 ± 3.83 | 9.01 ± 3.83 b | 8.64 ± 3.82 bc | 8.77 ± 3.75 bc | <0.001 |
| ALP (IU/L) | 86.94 ± 31.32 a | 89.57 ± 25.05 ab | 91.45 ± 26.50 abc | 83.65 ± 26.20 abc | <0.001 |
| GGT (IU/L) | 38.89 ± 86.56 a | 37.60 ± 41.69 b | 41.77 ± 39.99 abc | 26.95 ± 33.73 abc | <0.001 |
| TBA (umol/L) | 4.29 ± 5.55 a | 4.03 ± 4.94 b | 4.08 ± 4.58 c | 3.70 ± 4.10 abc | <0.001 |
| CHE (IU/L) | 8341.40 ± 1608.05 a | 8814.04 ± 1415.35 ab | 9064.56 ± 1465.08 abc | 7993.57 ± 1474.81 abc | <0.001 |
| PA (g/L) | 0.29 ± 0.06 a | 0.30 ± 0.05 ab | 0.30 ± 0.05 abc | 0.28 ± 0.05 abc | <0.001 |
| TG (umol/L) | 1.79 ± 1.75 a | 2.06 ± 1.98 ab | 2.29 ± 2.26 abc | 1.37 ± 1.26 abc | <0.001 |
| FPG (mmol/L)) | 6.04 ± 1.97 a | 6.24 ± 2.01 ab | 6.43 ± 2.13 abc | 5.75 ± 1.60 abc | <0.001 |
| CHOL (mmo/L) | 5.06 ± 1.08 a | 5.20 ± 1.03 ab | 5.23 ± 1.06 ac | 4.99 ± 0.99 bc | <0.001 |
| HDL-C (mmo/L) | 1.41 ± 0.37 a | 1.31 ± 0.31 ab | 1.25 ± 0.29 abc | 1.43 ± 0.34 bc | <0.001 |
| LDL-C (mmo/L) | 2.92 ± 0.86 a | 3.10 ± 0.84 ab | 3.15 ± 0.85 c | 2.87 ± 0.82 bc | <0.001 |
| HbA1c (%) | 5.59 ± 1.14 a | 5.72 ± 1.18 ab | 5.83 ± 1.13 abc | 5.44 ± 0.88 abc | <0.001 |
| RBC× (1012/L) | 4.65 ± 0.46 a | 4.78 ± 0.46 ab | 4.83 ± 0.46 abc | 4.66 ± 0.45 bc | <0.001 |
| HGB (g/L) | 132.74 ± 15.31 a | 137.34 ± 14.94 ab | 139.50 ± 14.84 abc | 134.34 ± 15.25 abc | <0.001 |
| HCT (%) | 0.39 ± 0.04 a | 0.404 ± 0.035 ab | 0.41 ± 0.04 abc | 0.39 ± 0.04 abc | <0.001 |
| MCV (fl) | 84.49 ± 4.92 | 84.36 ± 4.58 b | 84.49 ± 4.21 c | 84.82 ± 4.73 bc | <0.001 |
| MCH (pg) | 28.60 ± 2.25 a | 28.81 ± 2.16 | 28.93 ± 4.80 a | 28.90 ± 2.78 a | 0.043 |
| MCHC (g/L) | 338.14 ± 13.08 a | 341.20 ± 12.97 a | 342.14 ± 56.89 ac | 340.48 ± 22.57 c | <0.001 |
| RDW (%) | 0.11 ± 0.02 | 0.11 ± 0.01 b | 0.11 ± 0.01 bc | 0.11 ± 0.01 bc | 0.001 |
| PLT (×109/L) | 199.56 ± 56.19 a | 210.80 ± 55.96 ab | 221.50 ± 58.65 abc | 217.28 ± 53.59 abc | <0.001 |
| PDW (%) | 0.20 ± 0.01 a | 0.20 ± 0.01 | 0.20 ± 0.01 ac | 0.20 ± 0.01 c | 0.002 |
| MPV (fl) | 6.32 ± 1.07 a | 6.39 ± 1.12 | 6.40 ± 1.11 | 6.41 ± 1.13 a | 0.21 |
| PCT (%) | 0.12 ± 0.03 a | 0.13 ± 0.03 ab | 0.14 ± 0.07 abc | 0.14 ± 0.04 abc | <0.01 |
| WBC (×109/L) | 6.20 ± 1.74 a | 6.44 ± 1.63 ab | 6.80 ± 1.70 abc | 6.15 ± 1.60 bc | <0.001 |
| LYM (×109/L) | 2.16 ± 0.77 a | 2.17 ± 0.61 b | 2.31 ± 0.68 abc | 2.08 ± 0.64 abc | <0.001 |
| MONO (×109/L) | 0.38 ± 0.15 a | 0.40 ± 0.15 ab | 0.42 ± 0.16 abc | 0.39 ± 0.16 bc | <0.001 |
| NEU (×109/L) | 3.48 ± 1.33 a | 3.67 ± 1.26 ab | 3.85 ± 1.27 abc | 3.50 ± 1.23 bc | <0.001 |
| EOS (×109/L) | 0.13 ± 0.12 a | 0.15 ± 0.15 ab | 0.16 ± 0.16 abc | 0.14 ± 0.14 bc | <0.001 |
| BASO (×109/L) | 0.05 ± 0.04 a | 0.06 ± 0.04 b | 0.06 ± 0.07 abc | 0.06 ± 0.04 c | <0.001 |
| Alcohol consumption (g) | 6.53 ± 34.28 | 7.82 ± 25.20 b | 8.14 ± 24.40 c | 5.93 ± 20.69 bc | <0.001 |
| LSM (Kpa) | 6.80 ± 5.27 a | 6.74 ± 3.54 b | 7.50 ± 3.03 abc | 6.10 ± 2.55 abc | <0.001 |
| UAP (dB/m) | 263.46 ± 18.78 a | 265.67 ± 19.14 ab | 276.32 ± 25.90 abc | 208.61 ± 20.81 abc | <0.001 |
Publisher’s Note: MDPI stays neutral with regard to jurisdictional claims in published maps and institutional affiliations. |
© 2022 by the authors. Licensee MDPI, Basel, Switzerland. This article is an open access article distributed under the terms and conditions of the Creative Commons Attribution (CC BY) license (https://creativecommons.org/licenses/by/4.0/).
Share and Cite
Yuan, Q.; Wang, H.; Gao, P.; Chen, W.; Lv, M.; Bai, S.; Wu, J. Prevalence and Risk Factors of Metabolic-Associated Fatty Liver Disease among 73,566 Individuals in Beijing, China. Int. J. Environ. Res. Public Health 2022, 19, 2096. https://doi.org/10.3390/ijerph19042096
Yuan Q, Wang H, Gao P, Chen W, Lv M, Bai S, Wu J. Prevalence and Risk Factors of Metabolic-Associated Fatty Liver Disease among 73,566 Individuals in Beijing, China. International Journal of Environmental Research and Public Health. 2022; 19(4):2096. https://doi.org/10.3390/ijerph19042096
Chicago/Turabian StyleYuan, Qianli, Huai Wang, Pei Gao, Weixin Chen, Min Lv, Shuang Bai, and Jiang Wu. 2022. "Prevalence and Risk Factors of Metabolic-Associated Fatty Liver Disease among 73,566 Individuals in Beijing, China" International Journal of Environmental Research and Public Health 19, no. 4: 2096. https://doi.org/10.3390/ijerph19042096
APA StyleYuan, Q., Wang, H., Gao, P., Chen, W., Lv, M., Bai, S., & Wu, J. (2022). Prevalence and Risk Factors of Metabolic-Associated Fatty Liver Disease among 73,566 Individuals in Beijing, China. International Journal of Environmental Research and Public Health, 19(4), 2096. https://doi.org/10.3390/ijerph19042096