
Temporal and Spatial Distribution Analysis of Atmospheric Pollutants in Chengdu–Chongqing Twin-City Economic Circle

Abstract
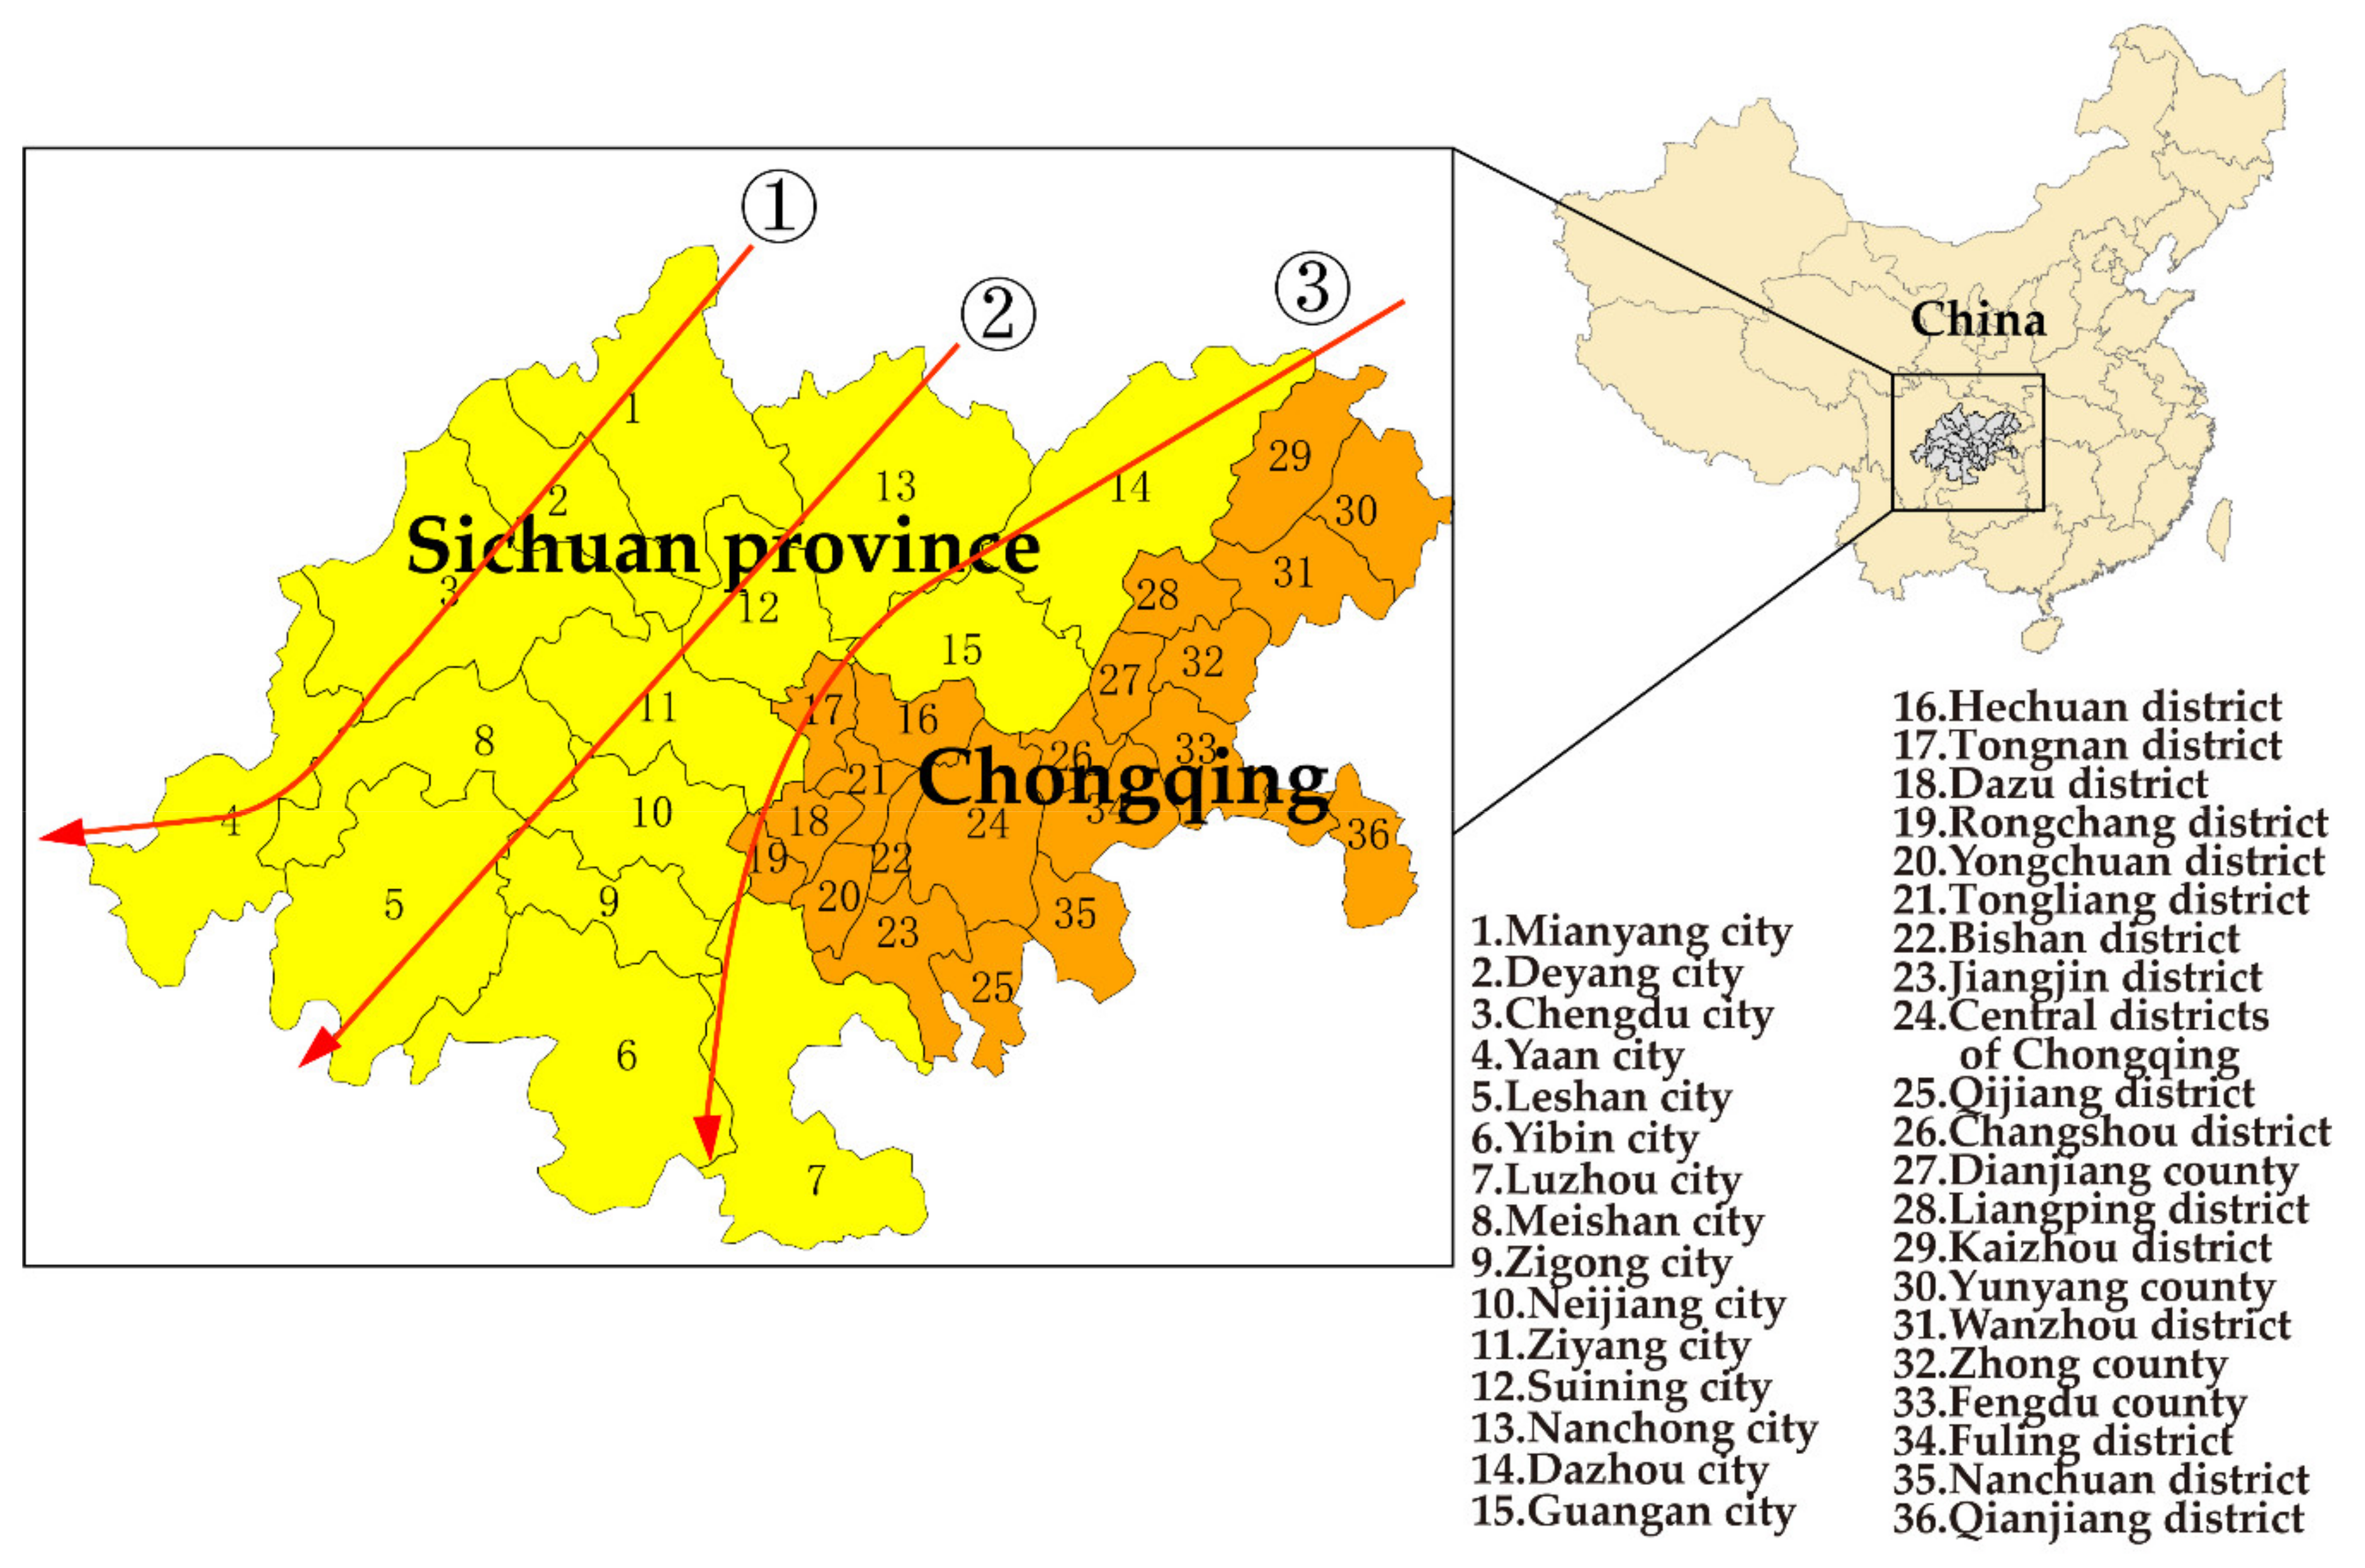
:1. Introduction
2. Data Sources and Methods
2.1. Data Sources
2.2. Evaluation Standards
2.3. Methods
3. Result and Discussions
3.1. Temporal and Spatial Changes of the Concentrations of Atmospheric Pollutants
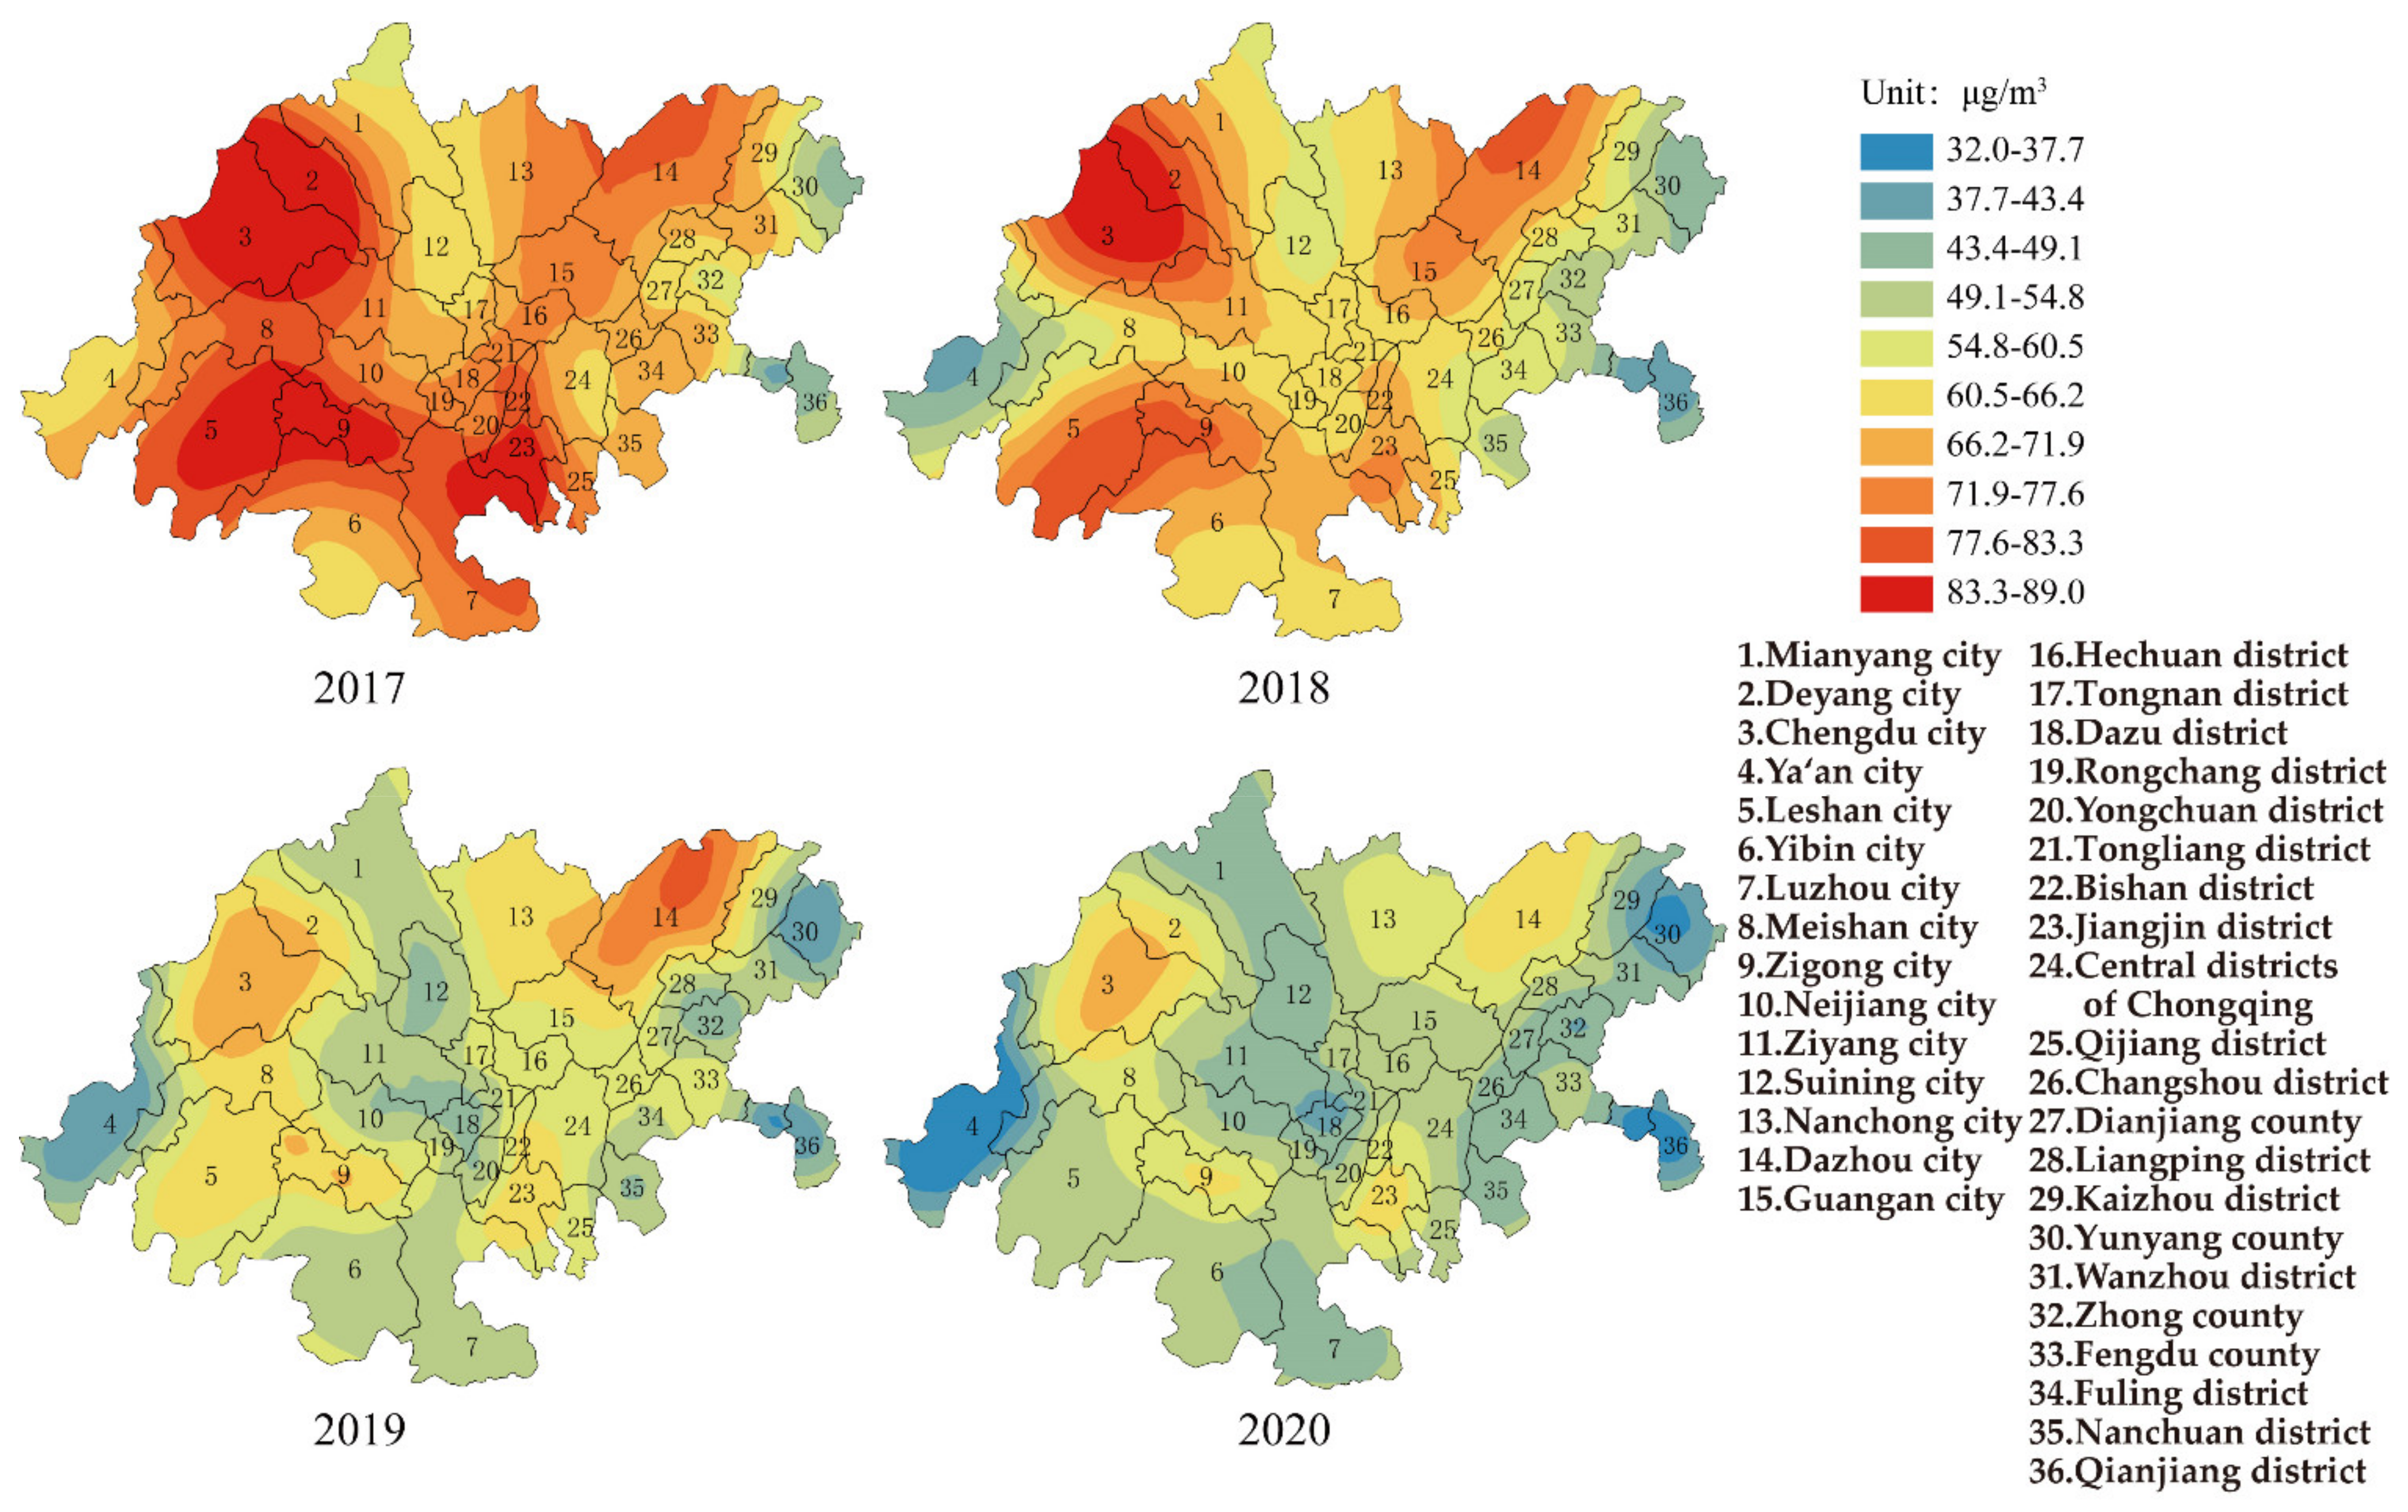
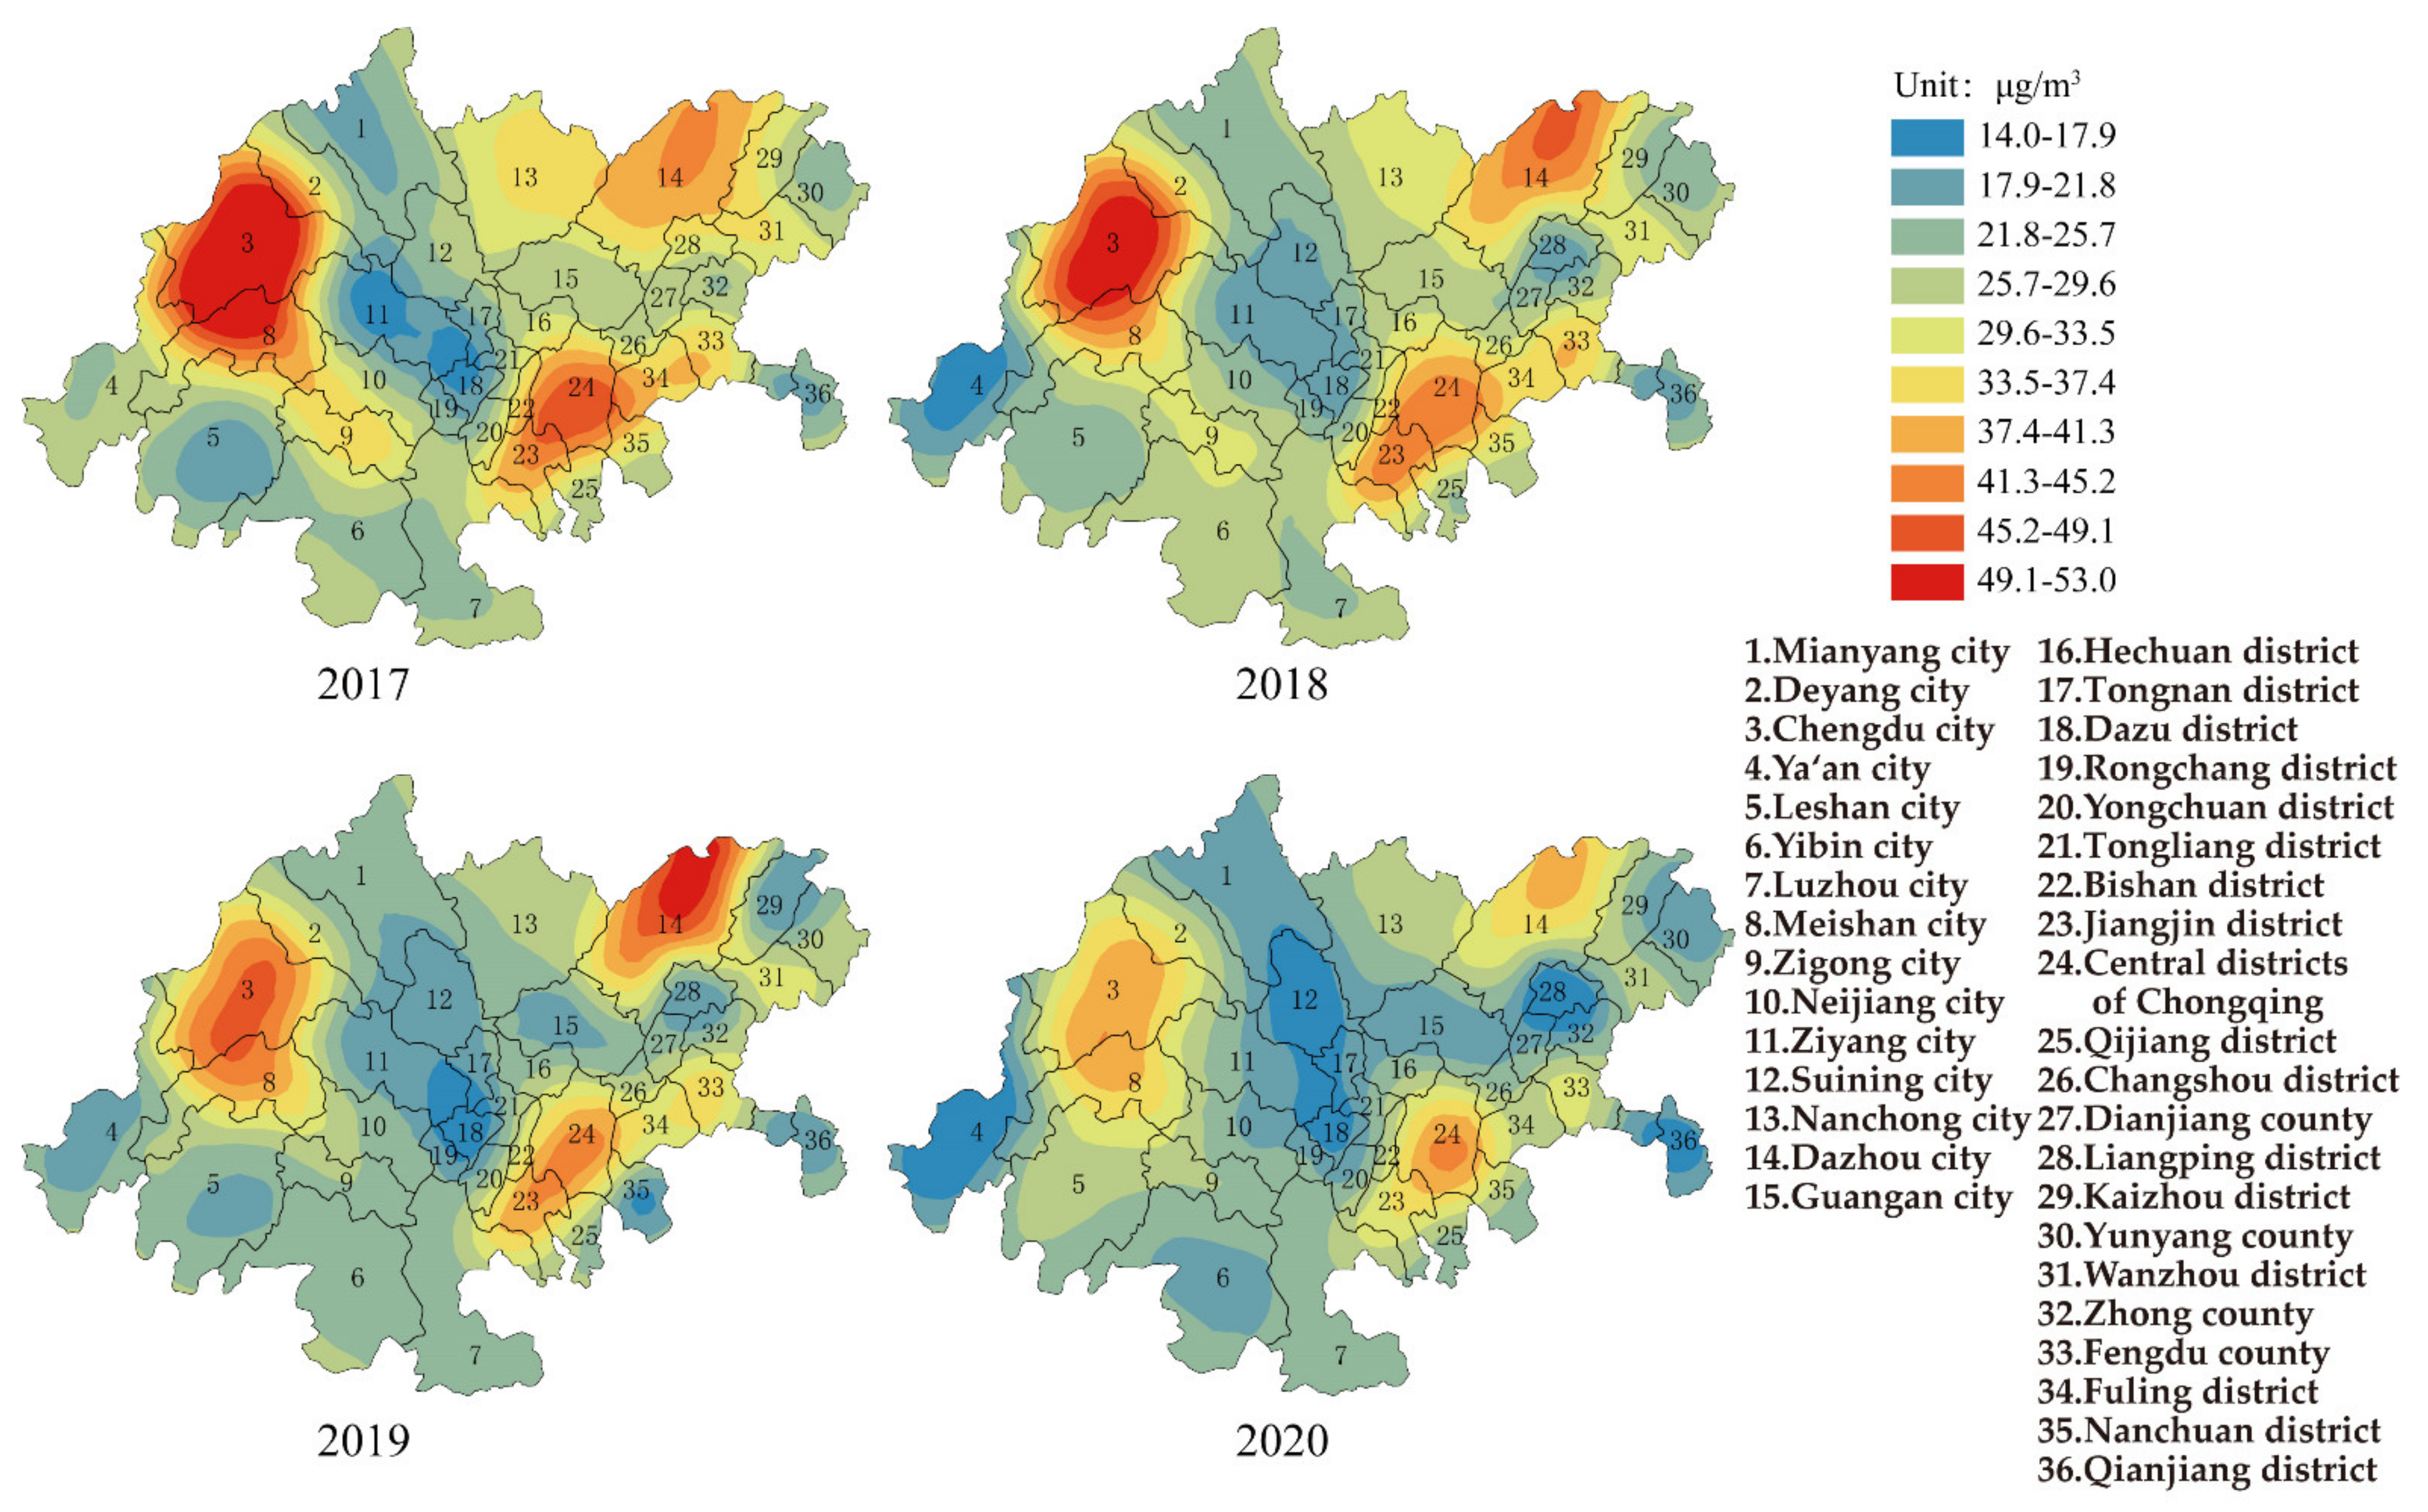
3.1.1. PM10
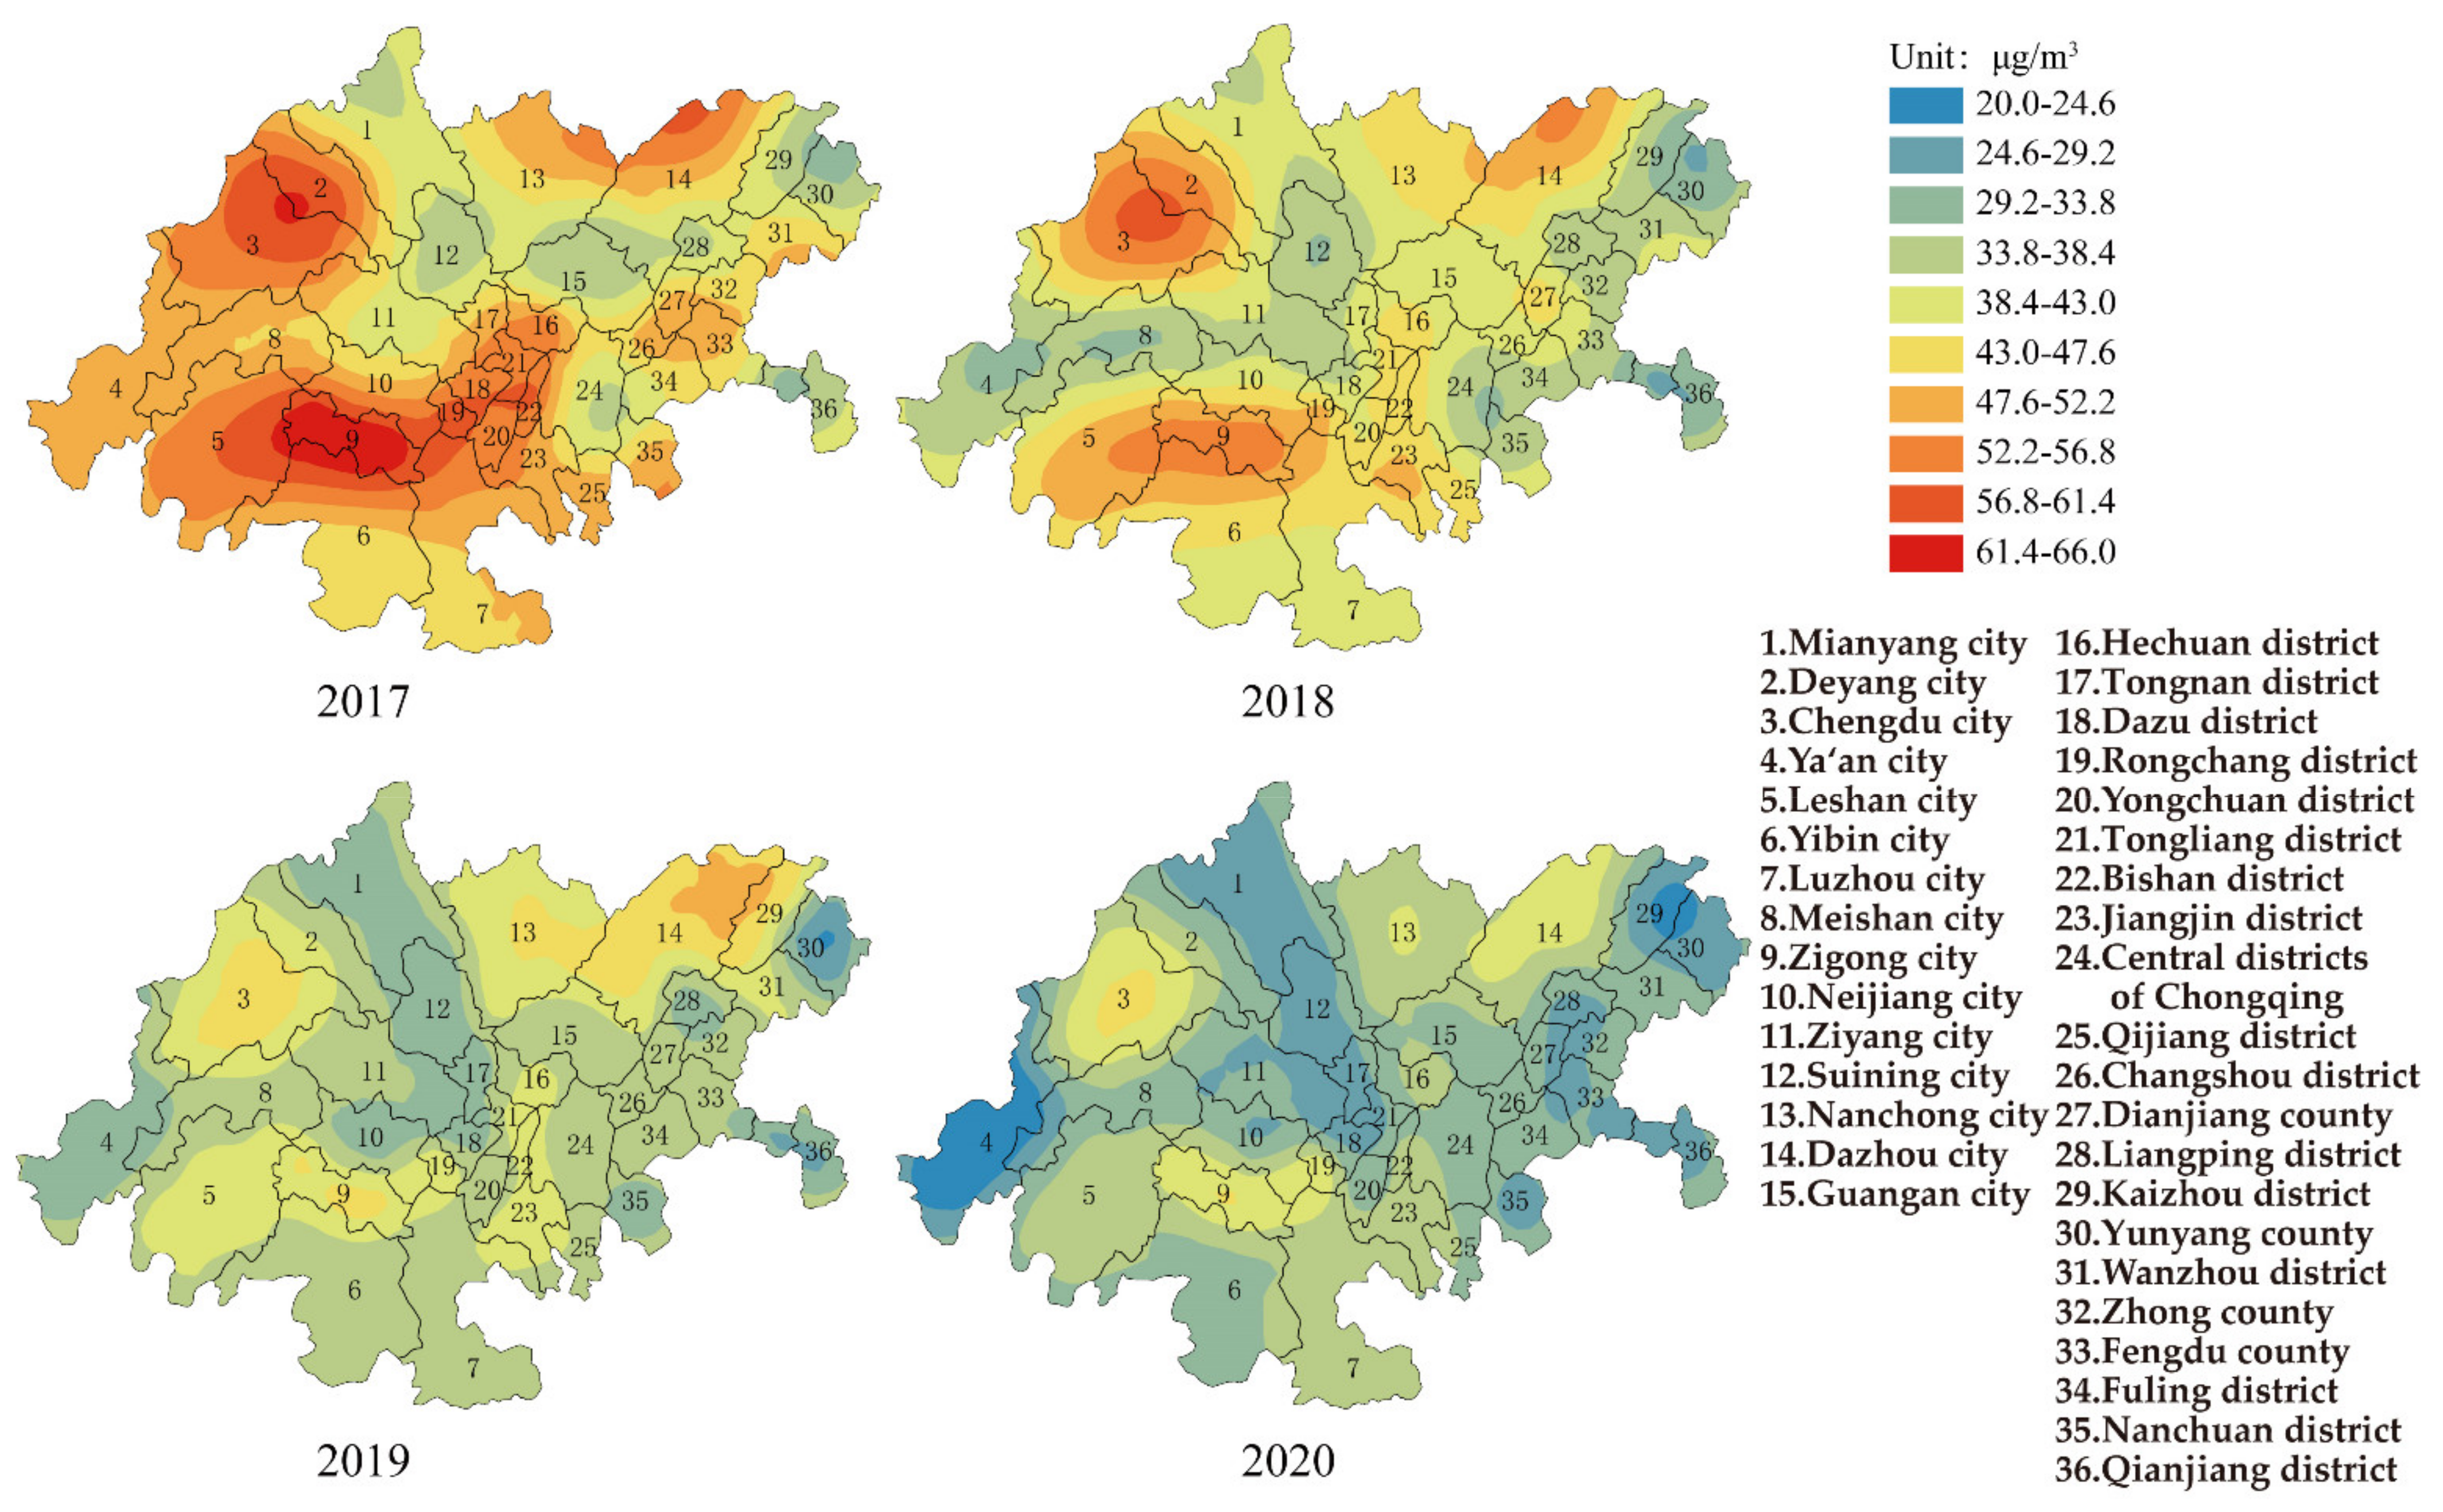
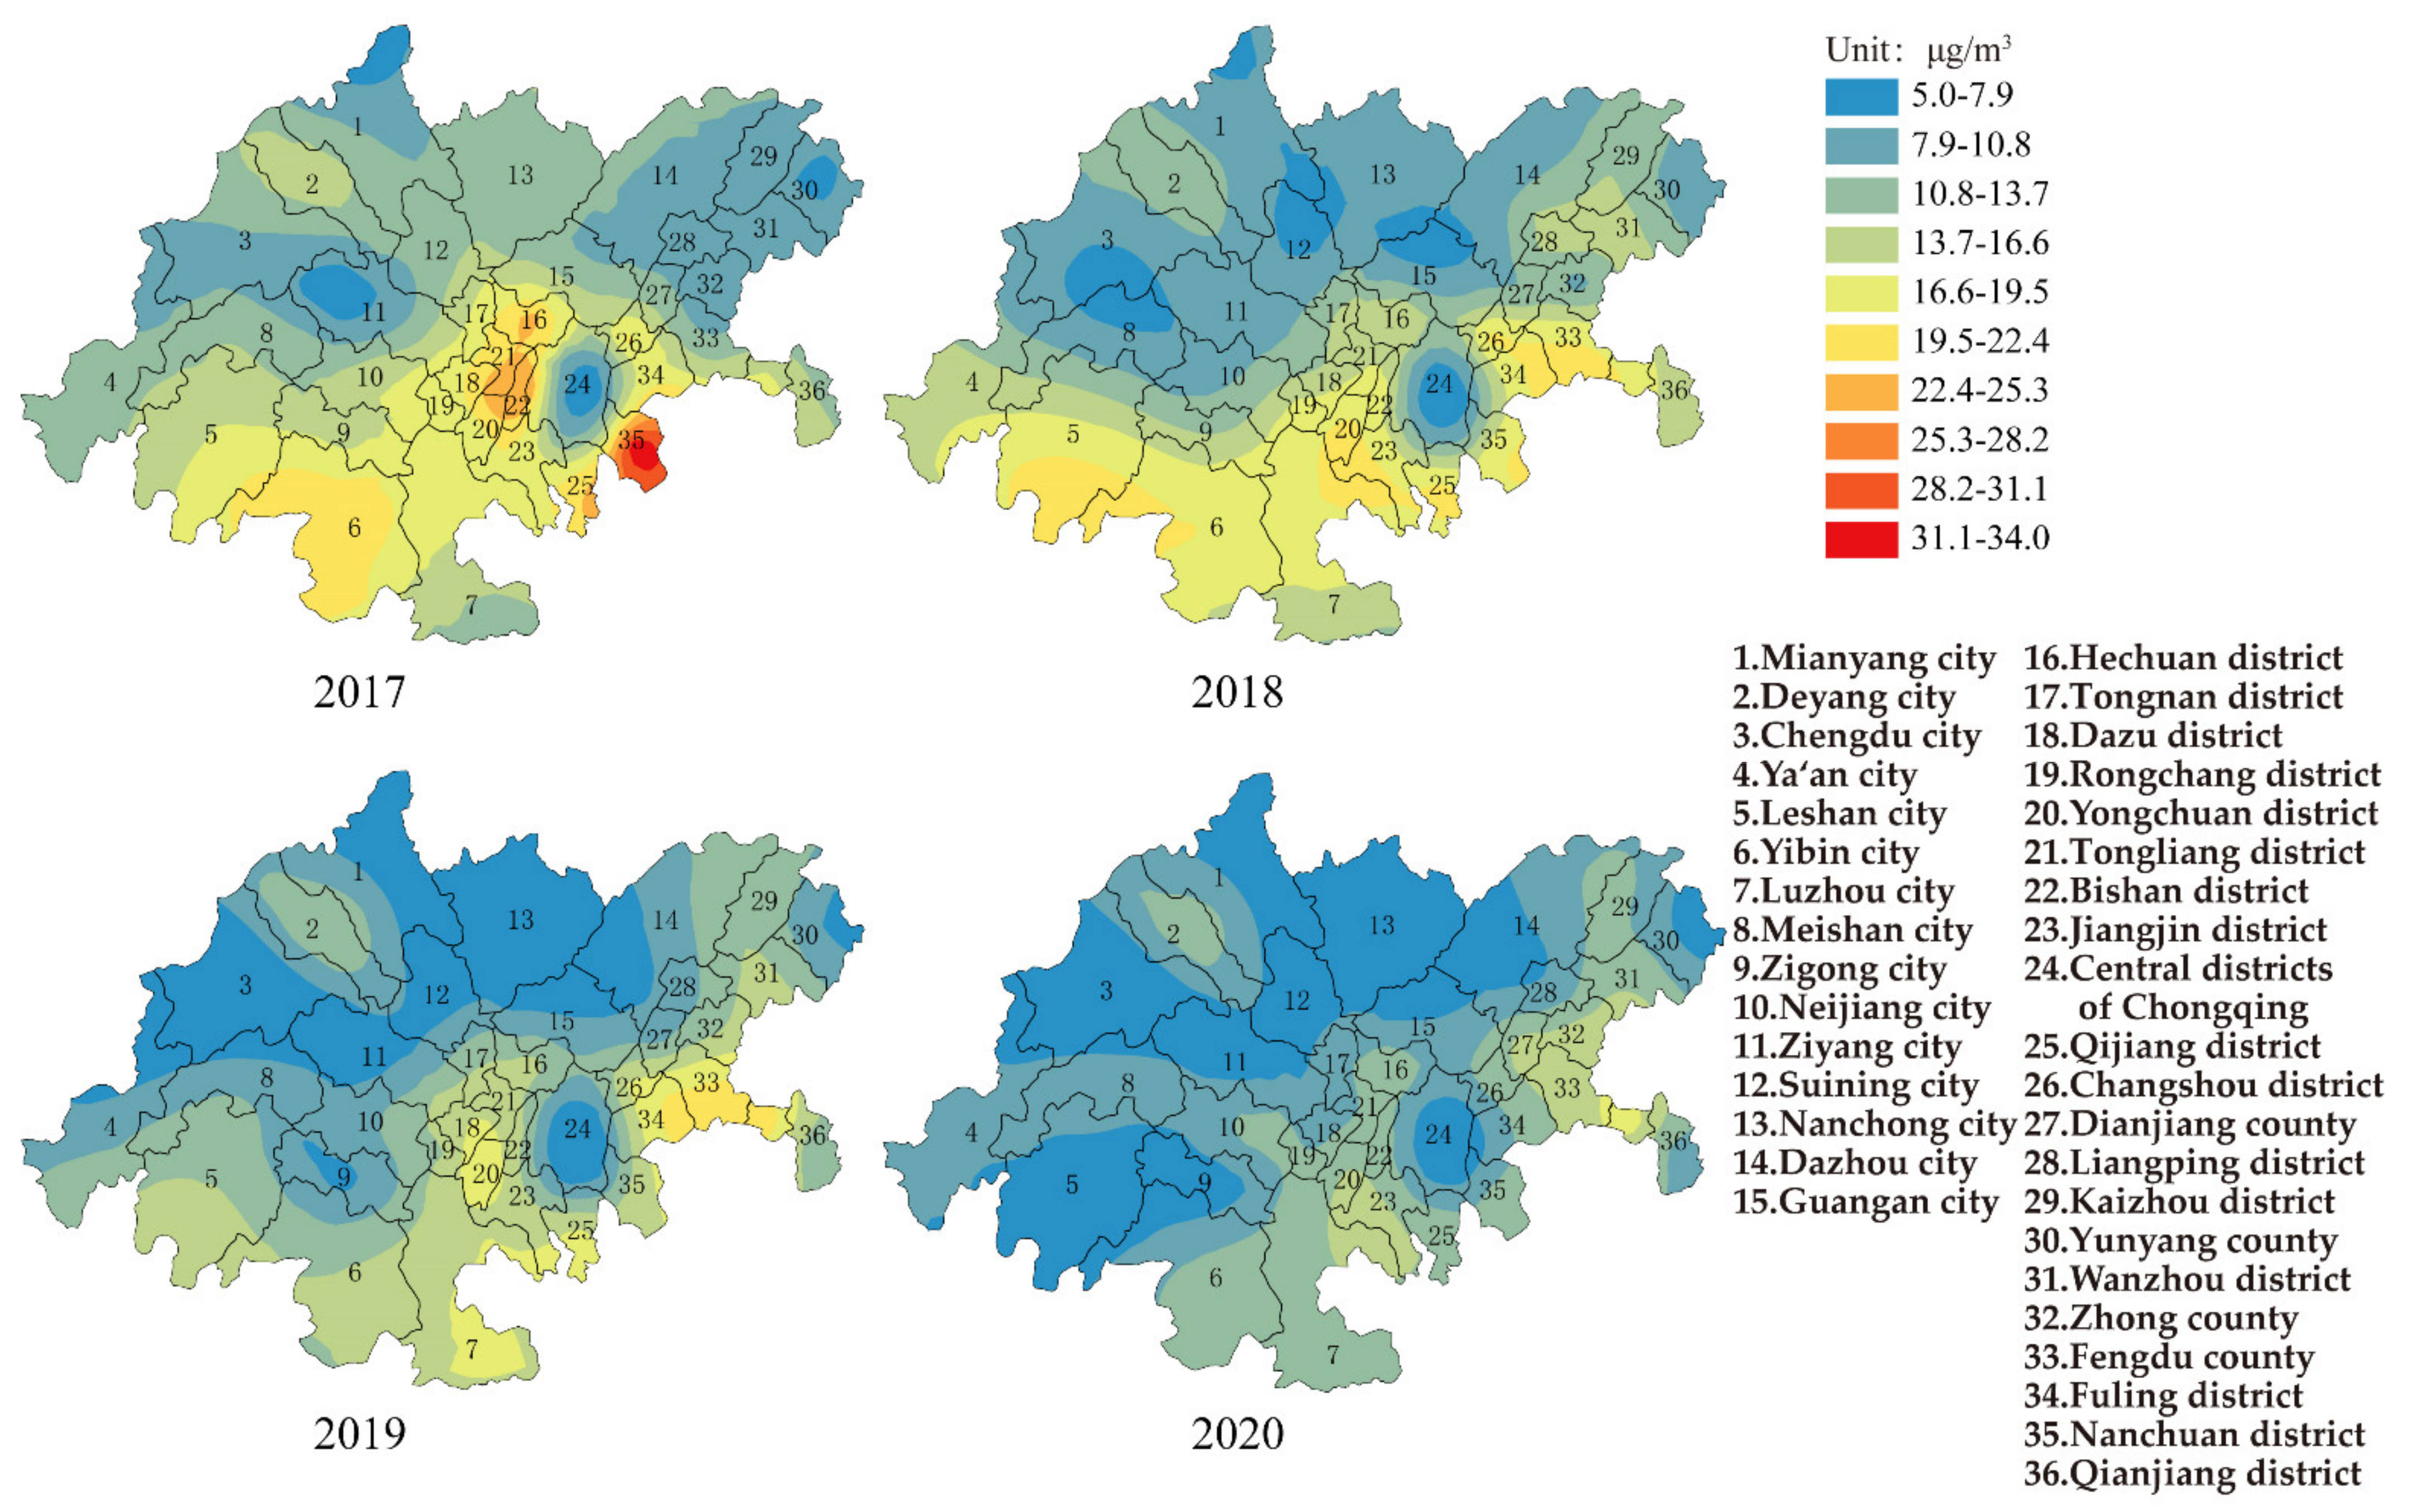
3.1.2. PM2.5
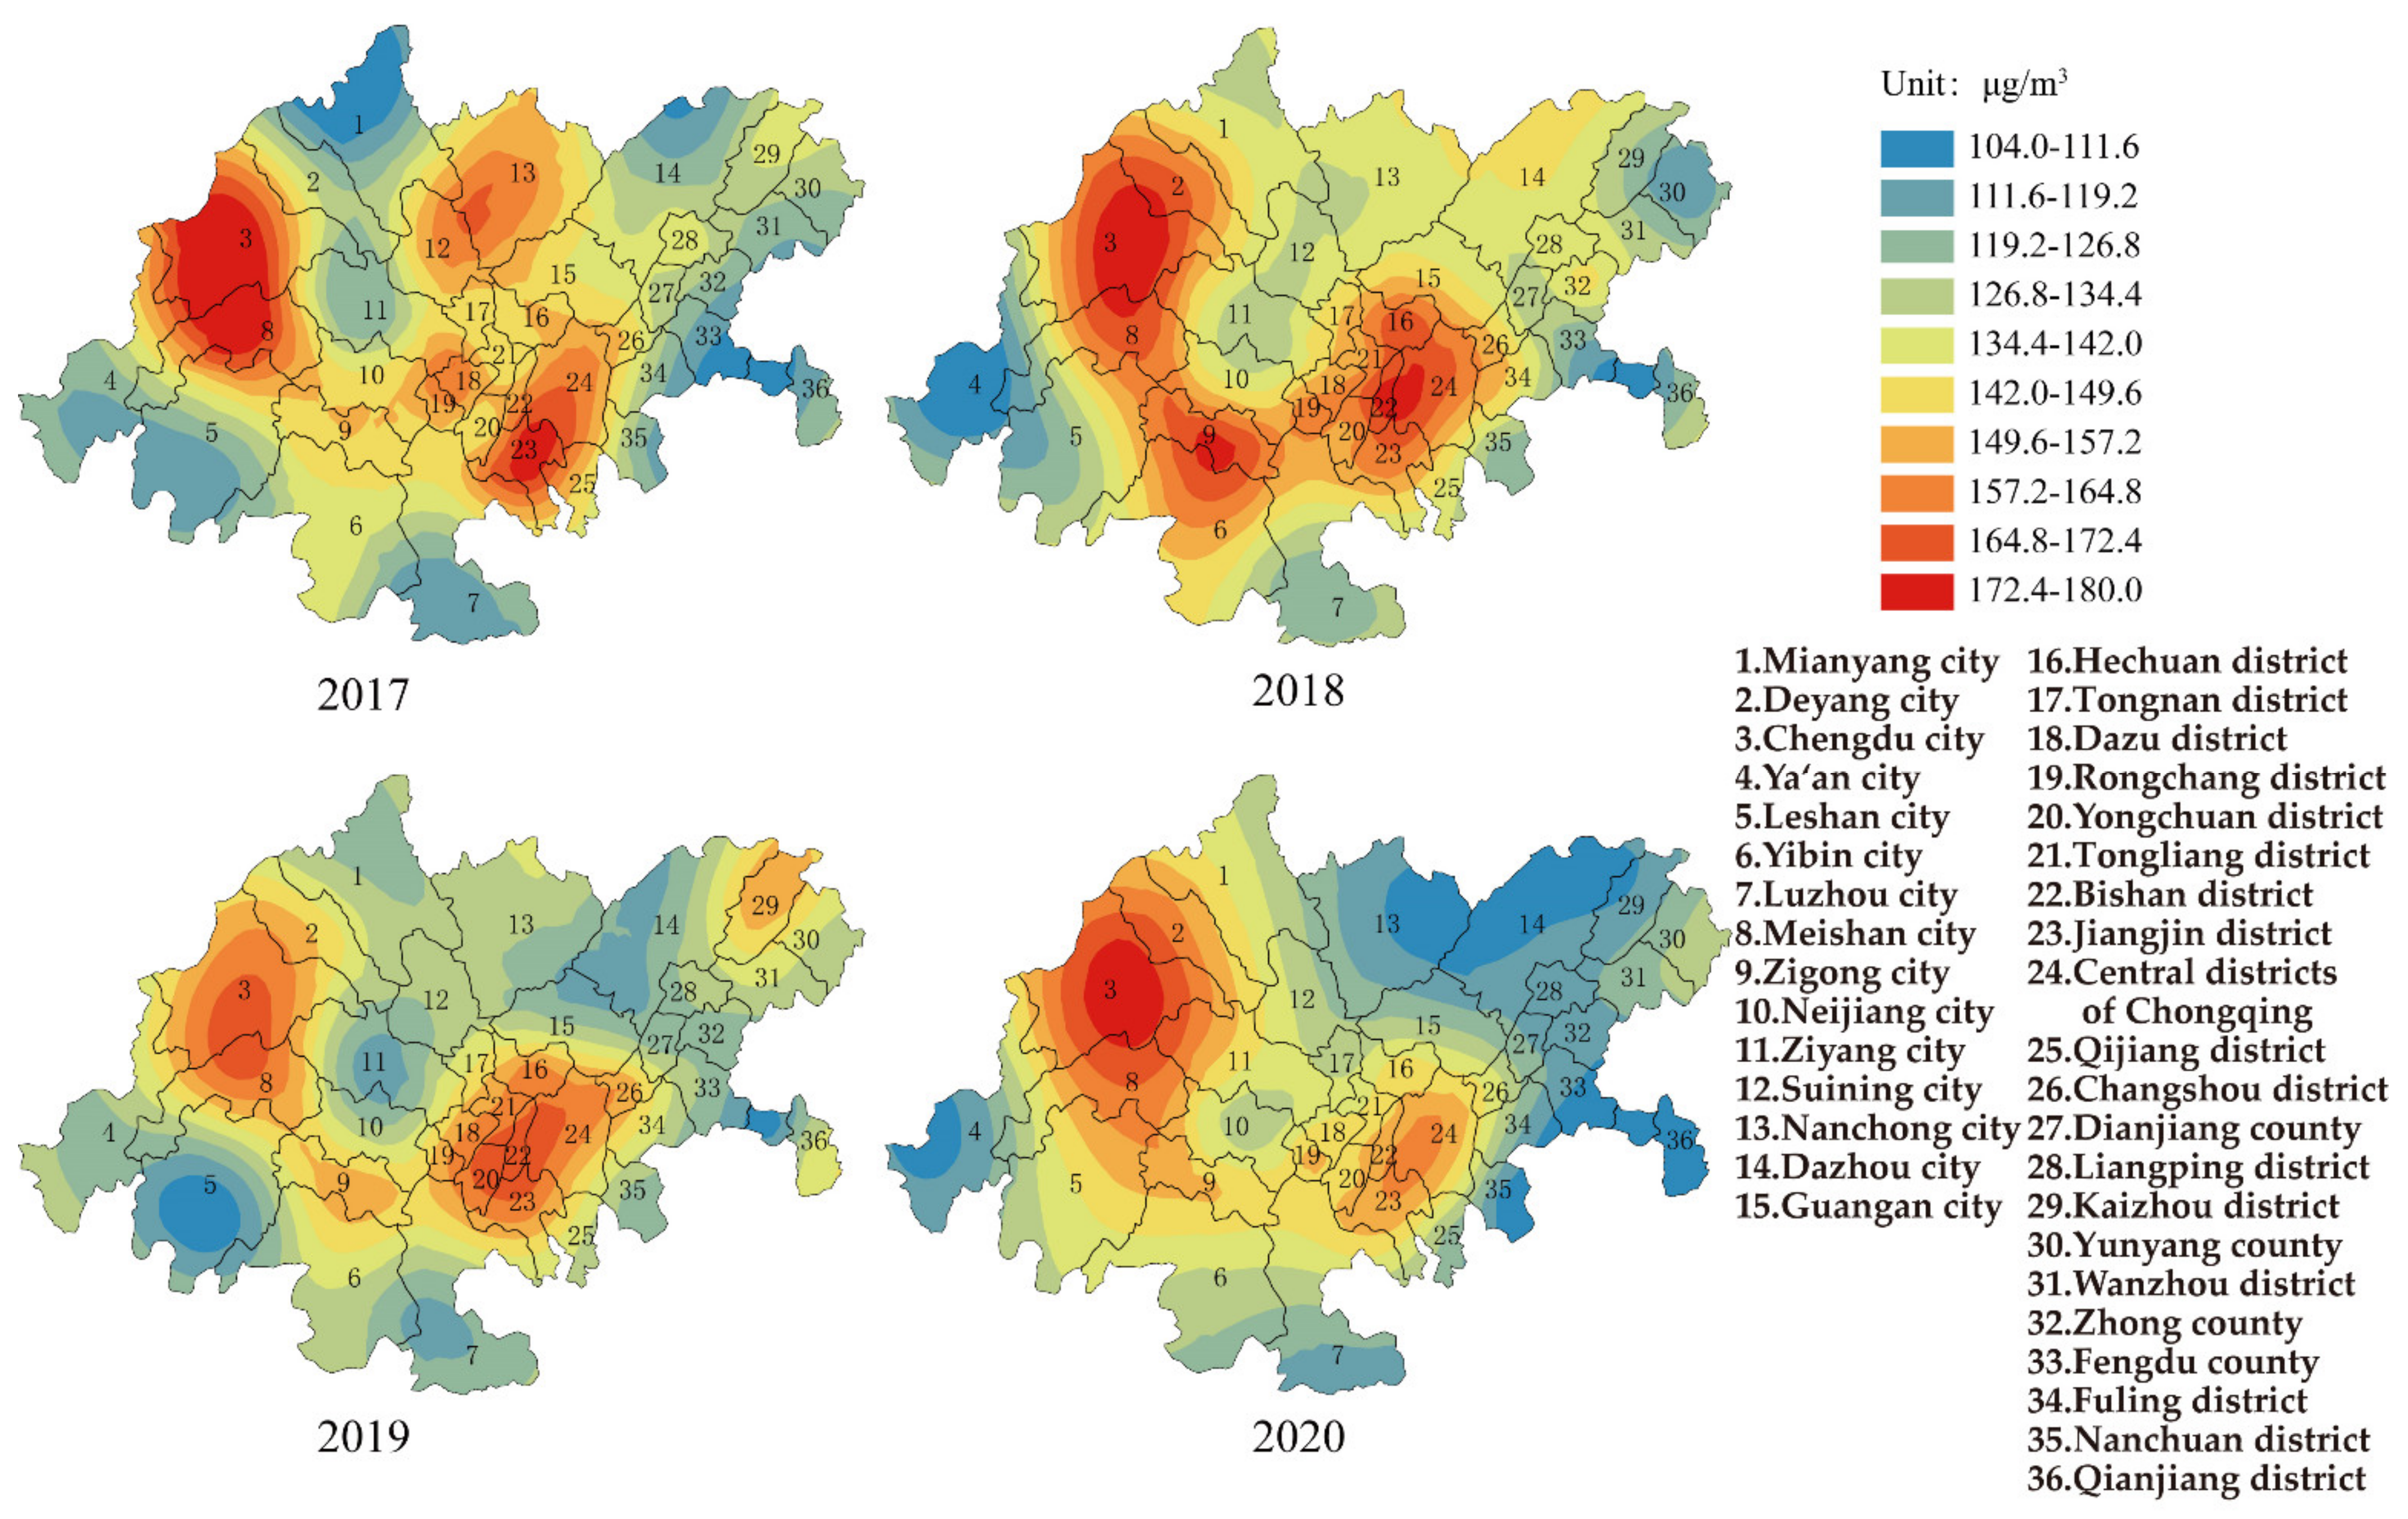
3.1.3. O3
3.1.4. SO2
3.1.5. NO2
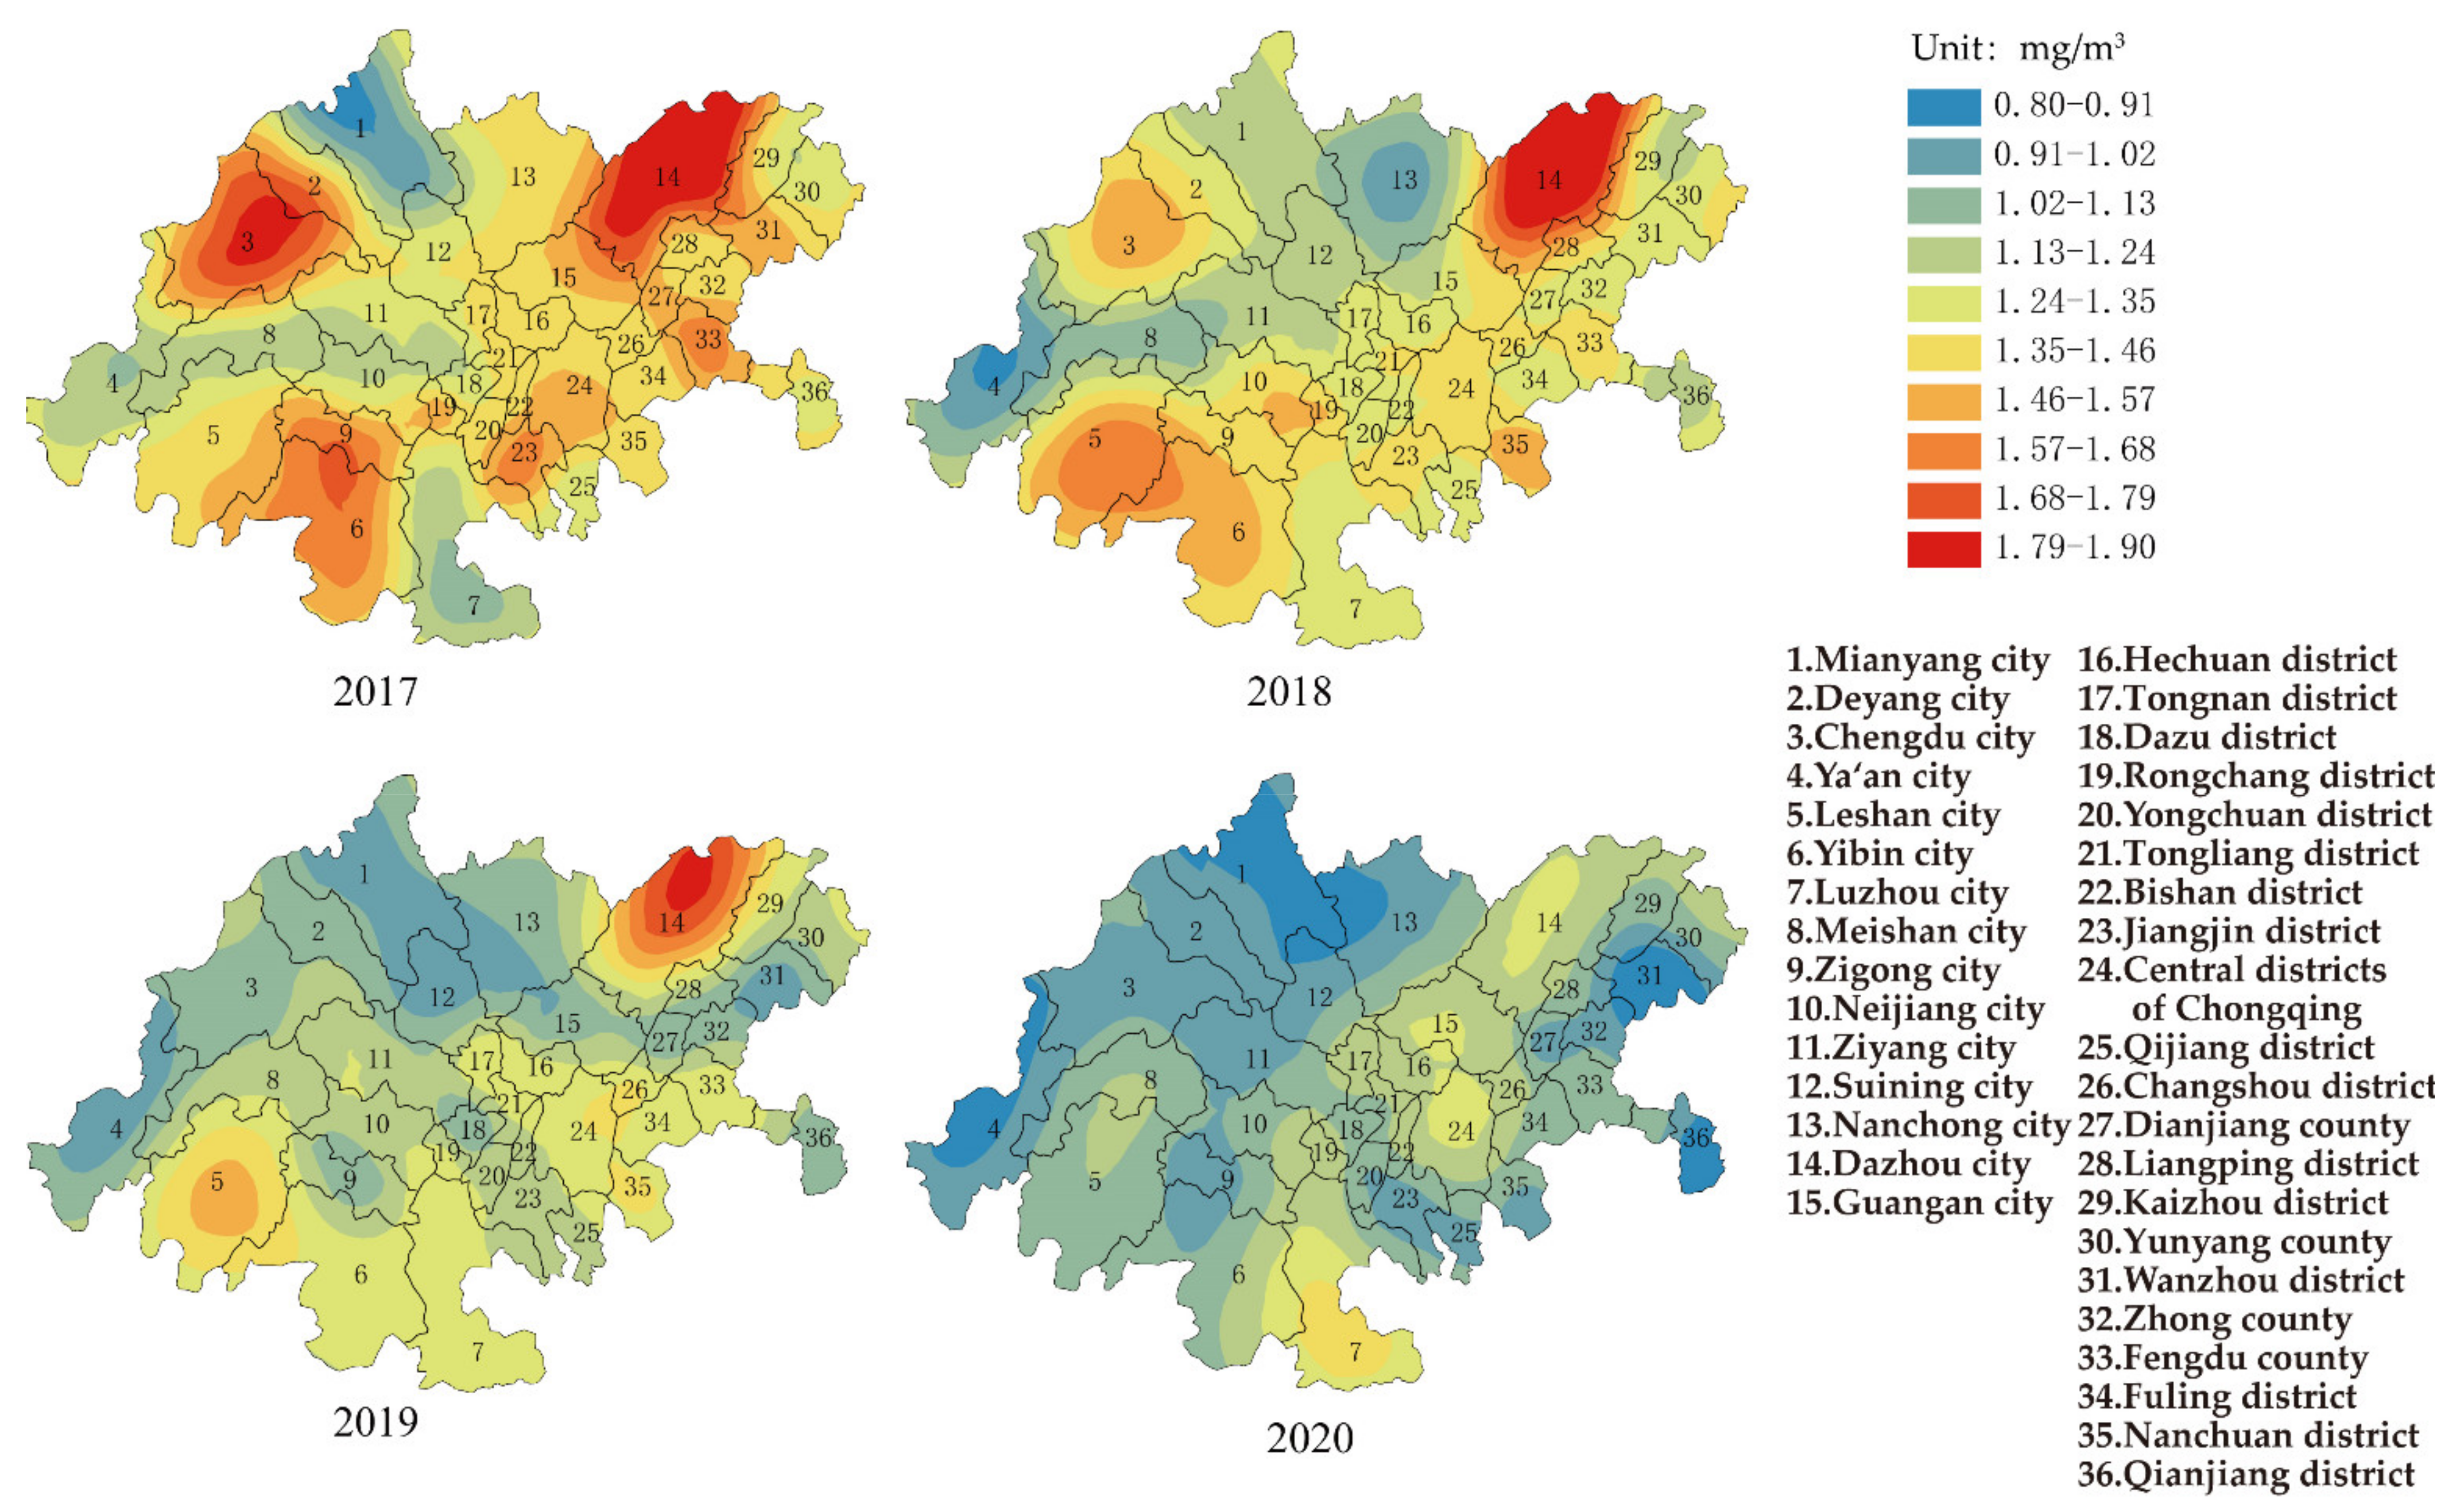
3.1.6. CO
3.2. Spatial Autocorrelation of Air Pollution in CCEC
3.2.1. Global Spatial Autocorrelation
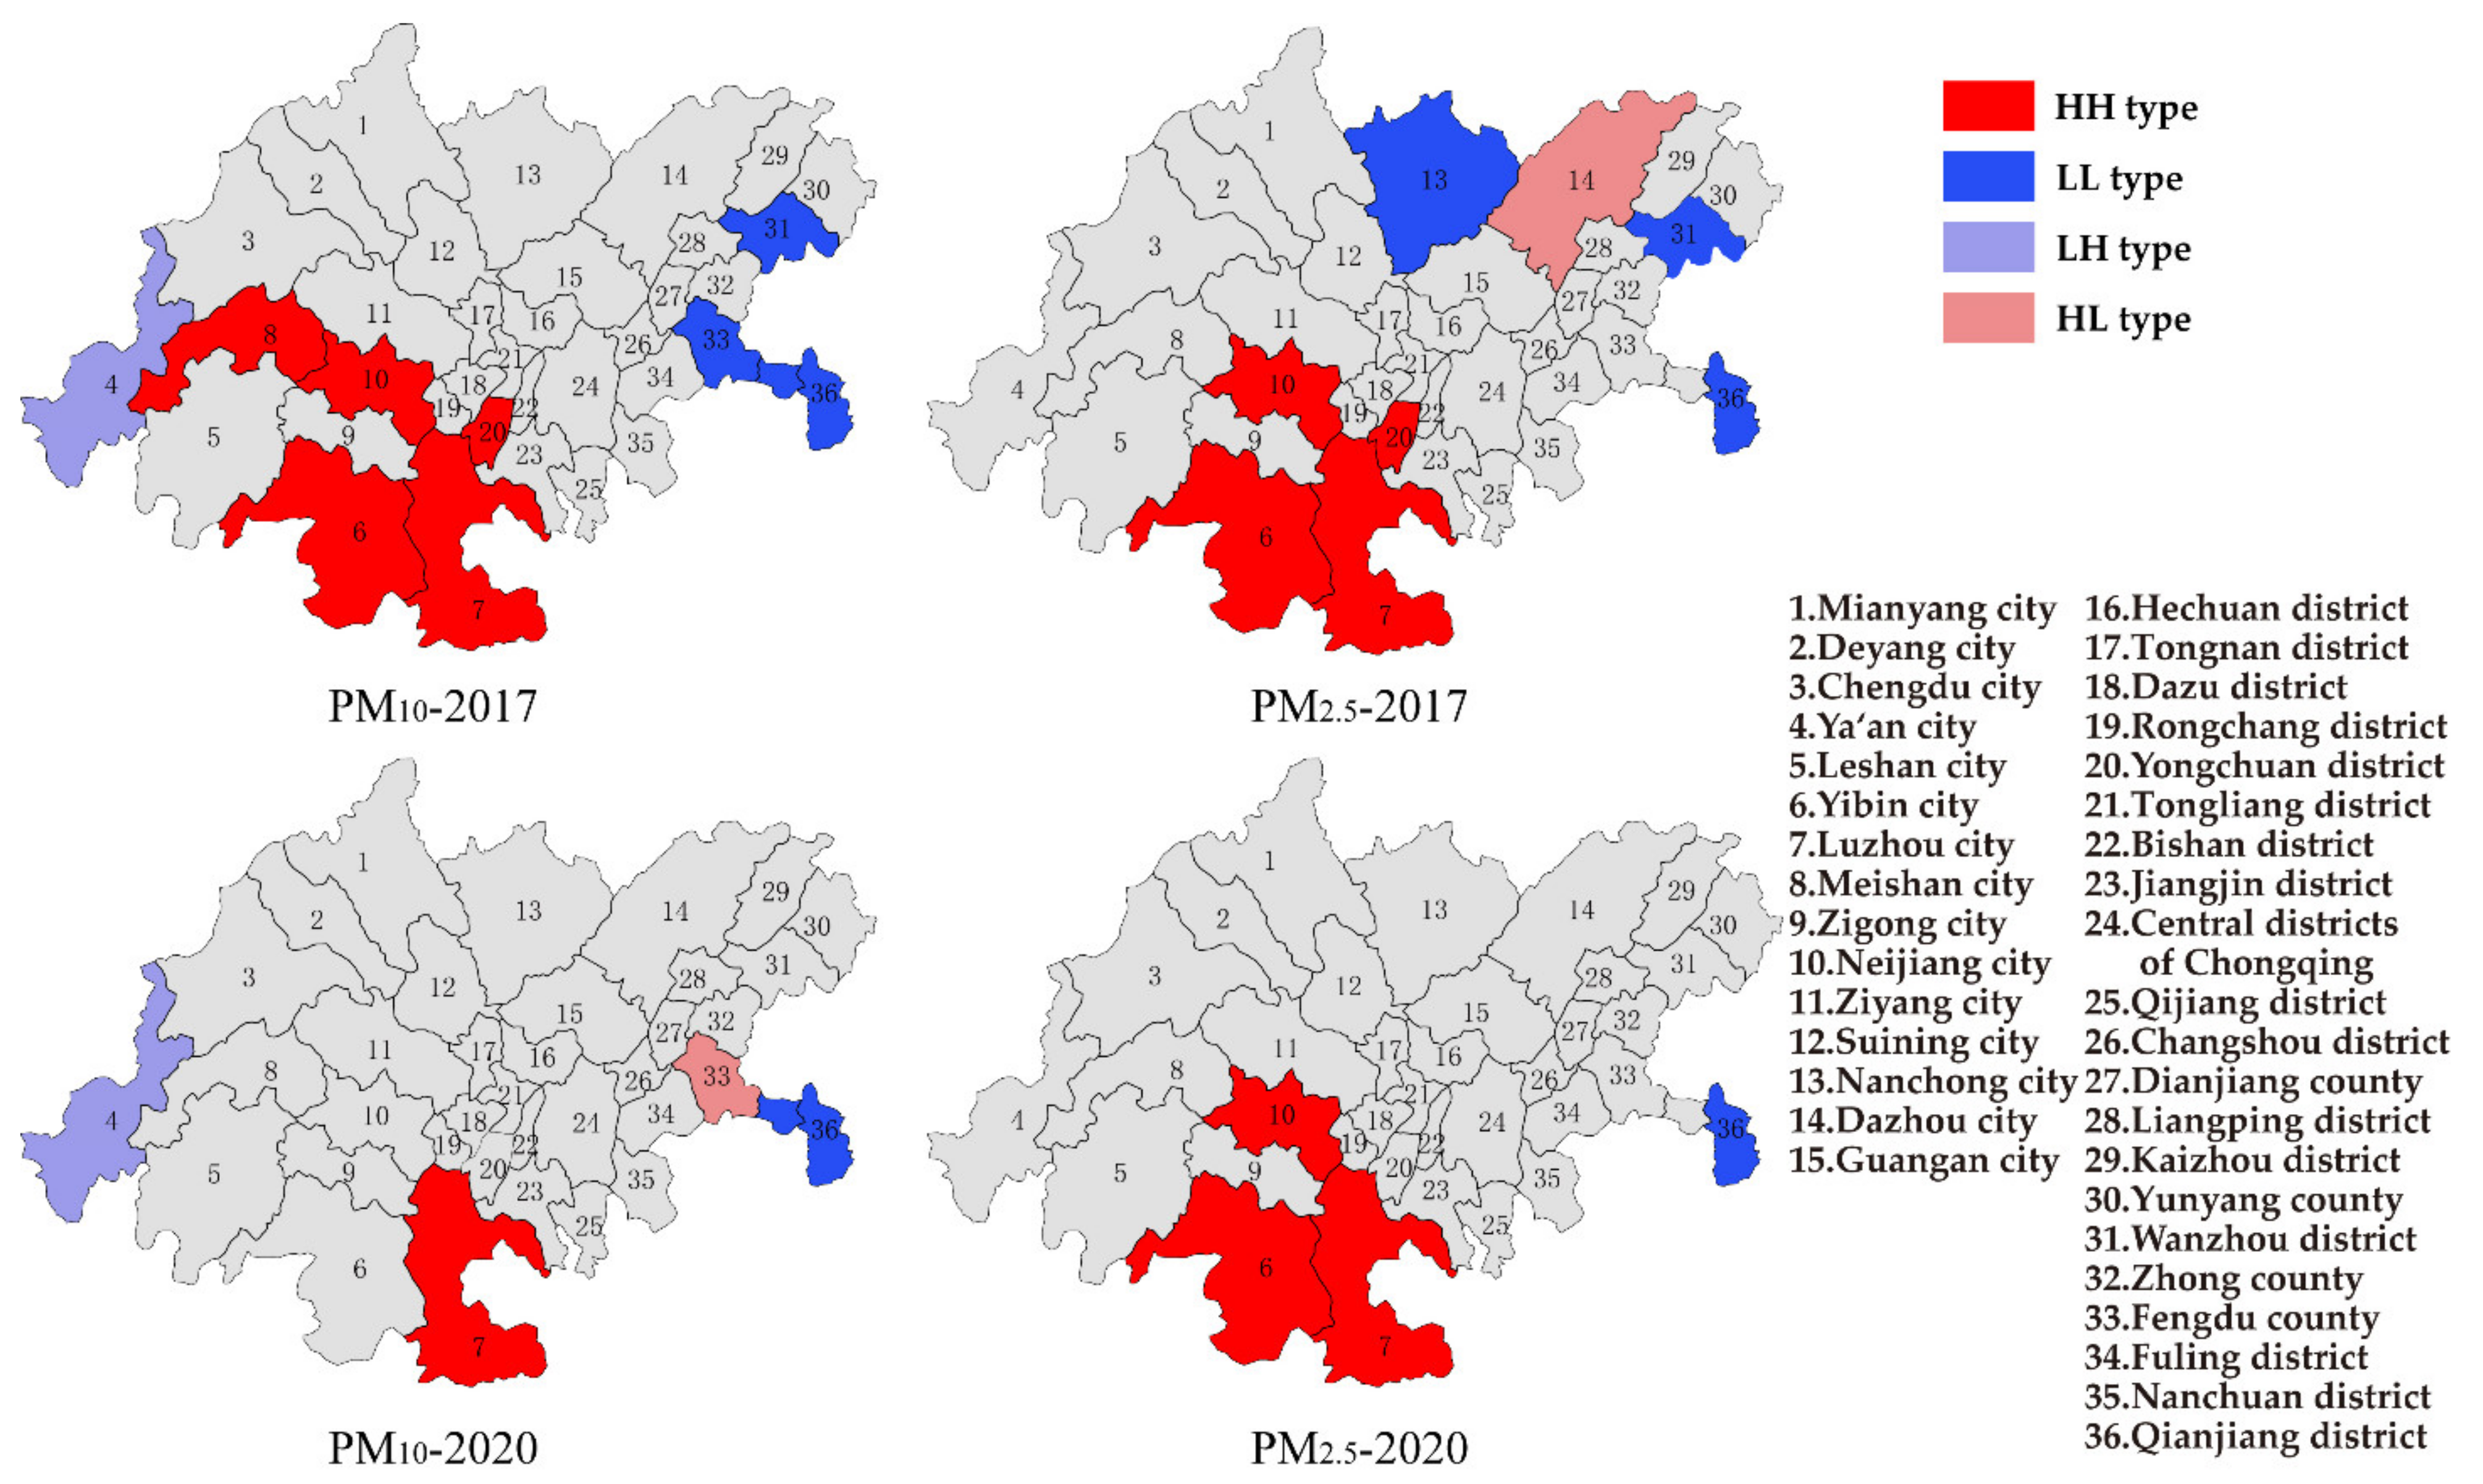
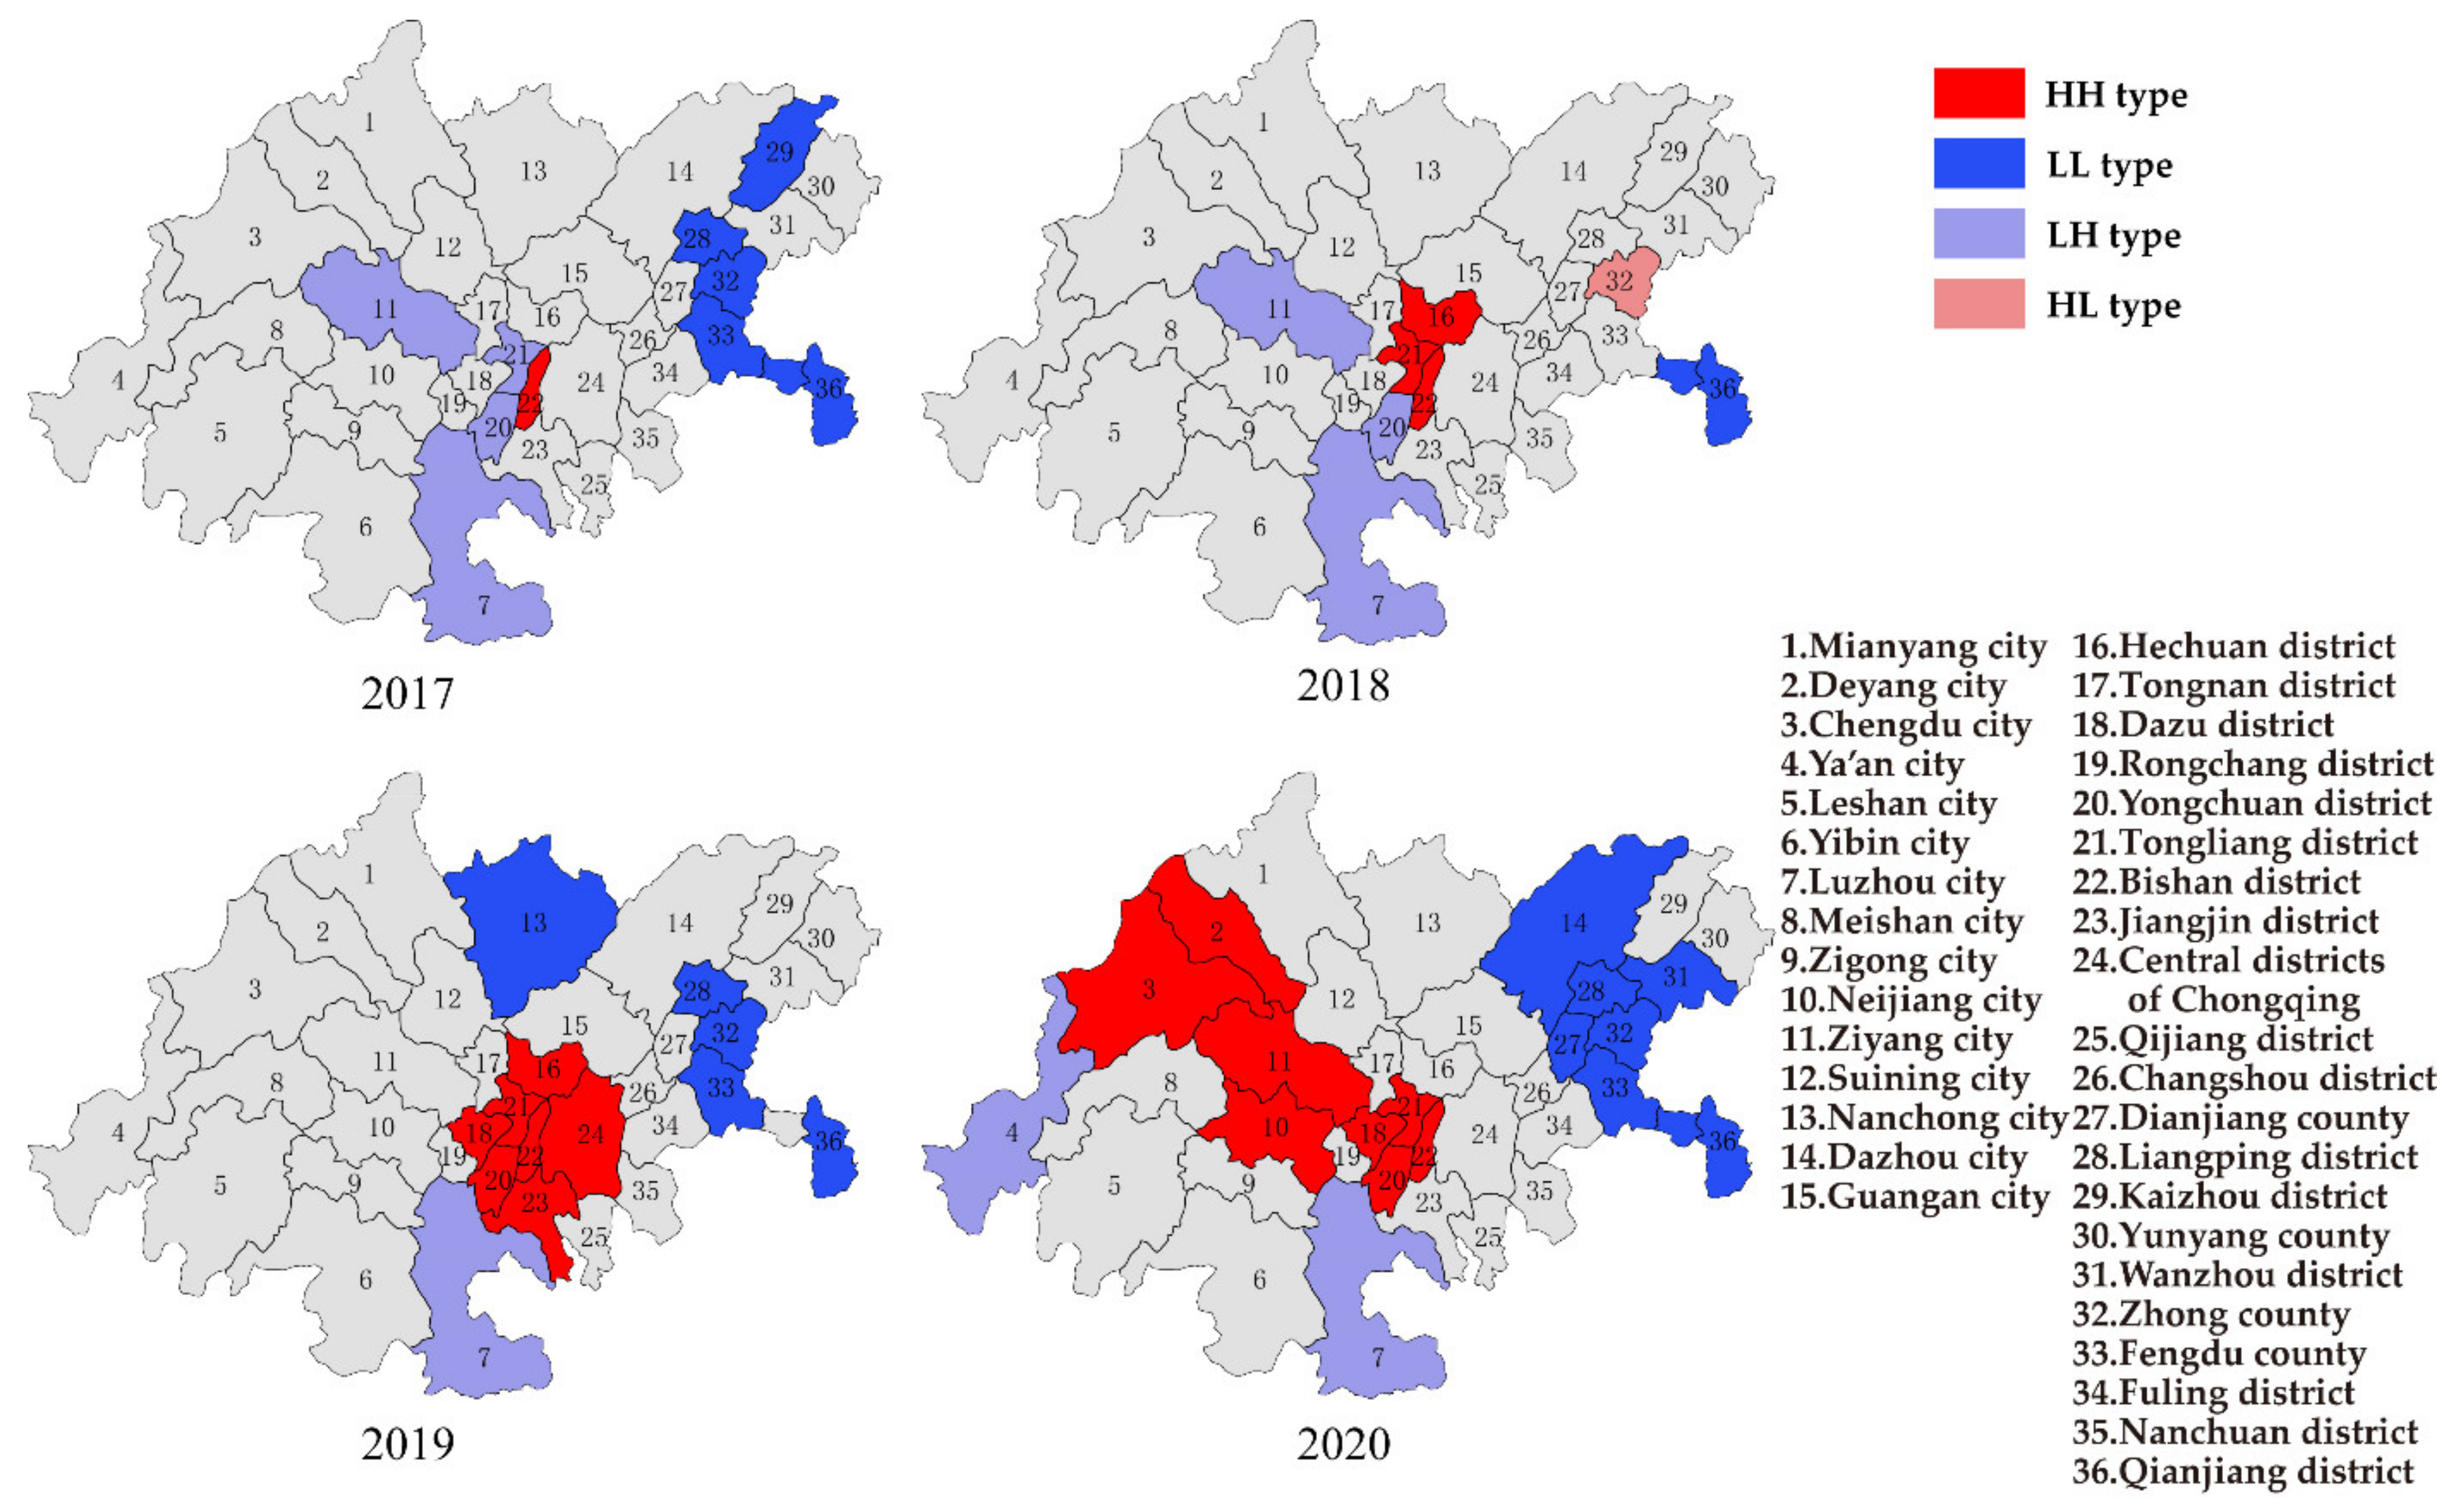
3.2.2. Local Spatial Autocorrelation
4. Conclusions
Author Contributions
Funding
Institutional Review Board Statement
Informed Consent Statement
Data Availability Statement
Conflicts of Interest
References
- Zhou, N.; Cui, Z.; Yang, S.; Han, X.; Chen, G.; Zhou, Z.; Zhai, C.; Ma, M.; Li, L.; Cai, M.; et al. Air pollution and decreased semen quality: A comparative study of Chongqing urban and rural areas. Environ. Pollut. 2014, 187, 145–152. [Google Scholar] [CrossRef] [PubMed]
- Anderson, J.O.; Thundiyil, J.G.; Stolbach, A. Clearing the Air: A Review of the Effects of Particulate Matter Air Pollution on Human Health. J. Med. Toxicol. Off. J. Am. Coll. Med. Toxicol. 2011, 8, 166–175. [Google Scholar] [CrossRef] [PubMed] [Green Version]
- Nemery, B.; Hoet, P.H.; Nemmar, A. The Meuse Valley fog of 1930: An air pollution disaster. Lancet 2001, 357, 704–708. [Google Scholar] [CrossRef]
- Wu, R.; Liu, F.; Tong, D.; Zheng, Y.; Lei, Y.; Hong, C.; Li, M.; Liu, J.; Zheng, B.; Bo, Y.; et al. Air quality and health benefits of China’s emission control policies on coal-fired power plants during 2005–2020. Environ. Res. Lett. 2019, 14, 94016. [Google Scholar] [CrossRef]
- Zhou, Q.; Yabar, H.; Mizunoya, T.; Higano, Y. Evaluation of Integrated Air Pollution and Climate Change Policies: Case Study in the Thermal Power Sector in Chongqing City, China. Sustainability 2017, 9, 1741. [Google Scholar] [CrossRef] [Green Version]
- Silva, L.F.O.; Oliveira, M.L.S.; Neckel, A.; Maculan, L.e.S.; Milanes, C.B.; Bodah, B.W.; Cambrussi, L.P.; Dotto, G.L. Effects of atmospheric pollutants on human health and deterioration of medieval historical architecture (North Africa, Tunisia). Urban Clim. 2022, 41, 101046. [Google Scholar] [CrossRef]
- Bai, Y.; Ni, Y.; Zeng, Q. Impact of Ambient Air Quality Standards revision on the exposure-response of air pollution in Tianjin, China. Environ. Res. 2021, 198, 111269–111275. [Google Scholar] [CrossRef] [PubMed]
- Lin, N. The Research on Transport Law of Atmospheric Pollutant and Joint Prevention and Contral of Air Pollution Technology in Sichuan Province. Master’s Thesis, Southwest Jiaotong University, Chengdu, China, 2015. [Google Scholar]
- Luo, Q.; Liao, T.; Wang, B.; Jiang, H.; Wang, S.; Ouyang, Z.; Lin, D.; Sun, X. Statistical analysis of near-surface wind field and transport pathways of pollutants in Sichuan Basin. Acta Sci. Circumstantiae 2020, 40, 1374–1384. [Google Scholar]
- Wang, W. Research on Establishment of Space-Air-Ground Integrated Monitoring Technology System for Air Pollution. Master’s Thesis, Chongqing Technology and Business University, Chongqing, China, 2020. [Google Scholar]
- Liao, T.; Wang, S.; Ai, J.; Gui, K.; Duan, B.; Zhao, Q.; Zhang, X.; Jiang, W.; Sun, Y. Heavy pollution episodes, transport pathways and potential sources of PM2.5 during the winter of 2013 in Chengdu (China). Sci. Total Environ. 2017, 584–585, 1056–1065. [Google Scholar] [CrossRef]
- Zhai, S.; Jacob, D.J.; Wang, X.; Shen, L.; Liao, H. Fine particulate matter (PM2.5) trends in China, 2013–2018: Separating contributions from anthropogenic emissions and meteorology. Atmos. Chem. Phys. 2019, 19, 11031–11041. [Google Scholar] [CrossRef] [Green Version]
- Feng, X.; Zhang, Y. Temporal and spatial distribution characteristice of air pollutant concentrations in Sichuan and Chongqing area. China Sci. 2018, 13, 1708–1715. [Google Scholar]
- Liu, Y.; Yue, W.; Fan, P.; Zhang, Z.; Huang, J. Assessing the urban environmental quality of mountainous cities: A case study in Chongqing, China. Ecol. Indic. 2017, 81, 132–145. [Google Scholar] [CrossRef]
- Shulan, W.; Fahe, C.; Yuanhang, Z.; Laidong, Z.; Qinling, W. Analysis on the sources and characters of particles in Chengdu. Sci. Geogr. Sin. 2004, 24, 488–492. [Google Scholar]
- Cao, P.; Luo, B.; Zhang, W.; Li, B.; Li, R. Analysis on urban air quality of Sichuan province. Sichuan Environ. 2017, 36, 72–76. [Google Scholar]
- Wang, P.; Wang, Y.; Liu, M.; Zhang, Y.; Li, G. Assessment of atmospheric environmental quality and countermeasures research in Chongqing. Bull. Sci. Technol. 2018, 34, 267–273. [Google Scholar]
- Liu, Y.; Yang, C.; Tan, S.; Zhou, H.; Zeng, W. An approach to assess spatio-temporal heterogeneity of rural ecosystem health: A case study in Chongqing mountainous area, China. Ecol. Indic. 2022, 136, 108644. [Google Scholar] [CrossRef]
- Zhang, F.; Shi, Y.; Fang, D.; Ma, G.; Nie, C.; Krafft, T.; He, L.; Wang, Y. Monitoring history and change trends of ambient air quality in China during the past four decades. J. Environ. Manag. 2020, 260, 110031. [Google Scholar] [CrossRef]
- Zhao, B.; Shi, S.; Ji, J.S. The WHO Air Quality Guidelines 2021 promote great challenge for indoor air. Sci. Total Environ. 2022, 827, 154376. [Google Scholar] [CrossRef]
- Wang, Z.; Wu, T.; Che, F.; Wang, S.; Zhou, Y.; Qian, X.; Wu, X. Comparison between domestic and international Ambient Air Quality Standards. Res. Environ. Sci. 2010, 23, 253–260. [Google Scholar]
- Liu, H.; Du, G. Spatial pattern and distributional dynamics of urban air pollution in China—An empirical study based on aqi and six sub-pollutants of 161 cities. Econ. Geogr. 2016, 36, 33–38. [Google Scholar]
- Chen, S.; Zhu, J.; You, T. Spatial autocorrelation analysis of air quality index—A case study of Fujian Province. Wuyi Sci. J. 2020, 36, 48–58. [Google Scholar]
- Liu, Q.; Wang, S.; Zhang, W.; Li, J.; Kong, Y. Examining the effects of income inequality on CO2 emissions: Evidence from non-spatial and spatial perspectives. Appl. Energy 2019, 236, 163–171. [Google Scholar] [CrossRef]
- Miao, L.; Liu, C.; Yang, X.; Kwan, M.-P.; Zhang, K. Spatiotemporal heterogeneity analysis of air quality in the Yangtze River Delta, China. Sustain. Cities Soc. 2022, 78, 103603. [Google Scholar] [CrossRef]
- Song, W.; Wang, C.; Chen, W.; Zhang, X.; Li, H.; Li, J. Unlocking the spatial heterogeneous relationship between Per Capita GDP and nearby air quality using bivariate local indicator of spatial association. Resour. Conserv. Recycl. 2020, 160, 104880–104887. [Google Scholar] [CrossRef]
- Zheng, D.; Chen, C. Spatial-temporal characteristics and influence factors of PM2.5 concentrations in Chengdu-Chongqing urban agglomeration. Res. Environ. Sci. 2019, 32, 1834–1843. [Google Scholar]
- Ito, K.; Mathes, R.; Ross, Z.; Nádas, A.; Thurston, G.; Matte, T. Fine particulate matter constituents associated with cardiovascular hospitalizations and mortality in New York City. Environ. Health Perspect. 2011, 119, 467–473. [Google Scholar] [CrossRef] [PubMed] [Green Version]
- Jin, Y.; Dai, T.; Yu, C.; Zheng, S.; Nie, Y.; Wang, M.; Bai, Y. Effects of ambient particulate matter (PM10) on prevalence of diabetes and fasting plasma glucose. Chin. J. Prev. Med. 2021, 55, 7. [Google Scholar]
- Liao, T.; Gui, K.; Jiang, W.; Wang, S.; Wang, B.; Zeng, Z.; Che, H.; Wang, Y.; Sun, Y. Air stagnation and its impact on air quality during winter in Sichuan and Chongqing, southwestern China. Sci. Total Environ. 2018, 635, 576–585. [Google Scholar] [CrossRef]
- Luo, J.; Zhang, J.; Huang, X.; Liu, Q.; Luo, B.; Zhang, W.; Rao, Z.; Yu, Y. Characteristics, evolution, and regional differences of biomass burning particles in the Sichuan Basin, China. J. Environ. Sci. 2020, 89, 35–46. [Google Scholar] [CrossRef]
- Zhao, C.; Wang, Y.; Wang, Y.; Zhang, H.; Zhao, B. Temporal and spatial distribution of PM2. 5 and PM10 pollution status and the correlation of particulate matters and meteorological factors during winter and spring in Beijing. Environ. Sci. 2014, 35, 418–427. [Google Scholar]
- Lin, J.J. Characterization of water-soluble ion species in urban ambient particles. Environ. Int. 2002, 28, 55–61. [Google Scholar] [CrossRef]
- Zhuang, H.; Chan, C.K.; Fang, M.; Wexler, A.S. Size distributions of particulate sulfate, nitrate, and ammonium at a coastal site in Hong Kong. Atmos. Environ. 1999, 33, 843–853. [Google Scholar] [CrossRef]
- Yang, X.; Wu, K.; Wang, H.; Liu, Y.; Gu, S.; Lu, Y.; Zhang, X.; Hu, Y.; Ou, Y.; Wang, S.; et al. Summertime ozone pollution in Sichuan Basin, China: Meteorological conditions, sources and process analysis. Atmos. Environ. 2020, 226, 117392. [Google Scholar] [CrossRef]
- Jiang, W.; Xie, W.; Wang, B.; Wang, S.; Long, Q.; Liao, T. Analysis on the characteristics of heavy pollution atmospheric circulation in the Sichuan Basin from 2014 to 2016. Acta Sci. Circumstantiae 2019, 39, 180–188. [Google Scholar]
- Zhang, T.; Shen, N.; Zhao, X.; Wang, X.; Zhao, W. Spatiotemporal variation characteristics of ozone and its population exposure risk assessment in Chengdu-Chongqing urban agglomeration during 2015 to 2019. Acta Sci. Circumstantiae 2021, 41, 4188–4199. [Google Scholar]
- Li, X.; Hussain, S.A.; Sobri, S.; Said, M.S.M. Overviewing the air quality models on air pollution in Sichuan Basin, China. Chemosphere 2021, 271, 129502. [Google Scholar] [CrossRef]
- Wu, L.; Cheng, W.; Zhang, L. The relationship between energy consumption structure and the quality of atmospheric environment-an example in an area of Chengdu. Environ. Sci. Manag. 2009, 34, 166–169. [Google Scholar]
- Yu, C.; Morotomi, T. The effect of the revision and implementation for environmental protection law on ambient air quality in China. J. Environ. Manag. 2022, 306, 114437. [Google Scholar] [CrossRef]
- Berman, J.D.; Ebisu, K. Changes in U.S. air pollution during the COVID-19 pandemic. Sci. Total Environ. 2020, 739, 139864. [Google Scholar] [CrossRef]
- Abdullah, S.; Mansor, A.A.; Napi, N.N.L.M.; Mansor, W.N.W.; Ahmed, A.N.; Ismail, M.; Ramly, Z.T.A. Air quality status during 2020 Malaysia Movement Control Order (MCO) due to 2019 novel coronavirus (2019-nCoV) pandemic. Sci. Total Environ. 2020, 729, 139022. [Google Scholar] [CrossRef]
- Chen, K.; Wang, M.; Huang, C.; Kinney, P.L.; Anastas, P.T. Air pollution reduction and mortality benefit during the COVID-19 outbreak in China. Lancet Planet. Health 2020, 4, e210–e212. [Google Scholar] [CrossRef]
- Qiu, W.; He, H.; Xu, T.; Jia, C.; Li, W. The air quality changes and related mortality benefits during the coronavirus disease 2019 pandemic in China: Results from a nationwide forecasting study. J. Clean. Prod. 2021, 308, 127327. [Google Scholar] [CrossRef] [PubMed]
- Yuan, Q.; Qi, B.; Hu, D.; Wang, J.; Zhang, J.; Yang, H.; Zhang, S.; Liu, L.; Xu, L.; Li, W. Spatiotemporal variations and reduction of air pollutants during the COVID-19 pandemic in a megacity of Yangtze River Delta in China. Sci. Total Environ. 2020, 751, 141820. [Google Scholar] [CrossRef] [PubMed]


| Atmospheric Pollutants | Ambient Air Quality | WHO Global Air Quality Guidelines | |||||
|---|---|---|---|---|---|---|---|
| The Secondary Limits | Interim Target 1 | Interim Target 2 | Interim Target 3 | Interim Target 4 | Air Quality Guideline | Unit | |
| PM10 | 70 | 70 | 50 | 30 | 20 | 15 | μg/m3 |
| PM2.5 | 35 | 35 | 25 | 15 | 10 | 5 | μg/m3 |
| SO2 * | 60 | - | - | - | - | - | μg/m3 |
| O3 | 160 | 160 | 120 | - | - | 100 | μg/m3 |
| NO2 | 40 | 40 | 30 | 20 | - | 10 | μg/m3 |
| CO | 4 | 7 | - | - | - | 4 | mg/m3 |
| Year | PM10 | PM2.5 | NO2 | O3 |
|---|---|---|---|---|
| 2017 | 0.49 | 0.35 | 0.14 | 0.21 |
| 2018 | 0.43 | 0.31 | 0.08 | 0.33 |
| 2019 | 0.17 | 0.05 | 0.04 | 0.29 |
| 2020 | 0.21 | 0.06 | 0.10 | 0.57 |
Publisher’s Note: MDPI stays neutral with regard to jurisdictional claims in published maps and institutional affiliations. |
© 2022 by the authors. Licensee MDPI, Basel, Switzerland. This article is an open access article distributed under the terms and conditions of the Creative Commons Attribution (CC BY) license (https://creativecommons.org/licenses/by/4.0/).
Share and Cite
Qi, N.; Tan, X.; Wu, T.; Tang, Q.; Ning, F.; Jiang, D.; Xu, T.; Wu, H.; Ren, L.; Deng, W. Temporal and Spatial Distribution Analysis of Atmospheric Pollutants in Chengdu–Chongqing Twin-City Economic Circle. Int. J. Environ. Res. Public Health 2022, 19, 4333. https://doi.org/10.3390/ijerph19074333
Qi N, Tan X, Wu T, Tang Q, Ning F, Jiang D, Xu T, Wu H, Ren L, Deng W. Temporal and Spatial Distribution Analysis of Atmospheric Pollutants in Chengdu–Chongqing Twin-City Economic Circle. International Journal of Environmental Research and Public Health. 2022; 19(7):4333. https://doi.org/10.3390/ijerph19074333
Chicago/Turabian StyleQi, Ning, Xuemei Tan, Tengfei Wu, Qing Tang, Fengshou Ning, Debin Jiang, Tengtun Xu, Hong Wu, Lingxiao Ren, and Wei Deng. 2022. "Temporal and Spatial Distribution Analysis of Atmospheric Pollutants in Chengdu–Chongqing Twin-City Economic Circle" International Journal of Environmental Research and Public Health 19, no. 7: 4333. https://doi.org/10.3390/ijerph19074333