
Wrist Circumference Cutoff Points for Determining Excess Weight Levels and Predicting Cardiometabolic Risk in Adults
 ,
,  ,
,  , , , , ,
Abstract
:1. Introduction
2. Materials and Methods
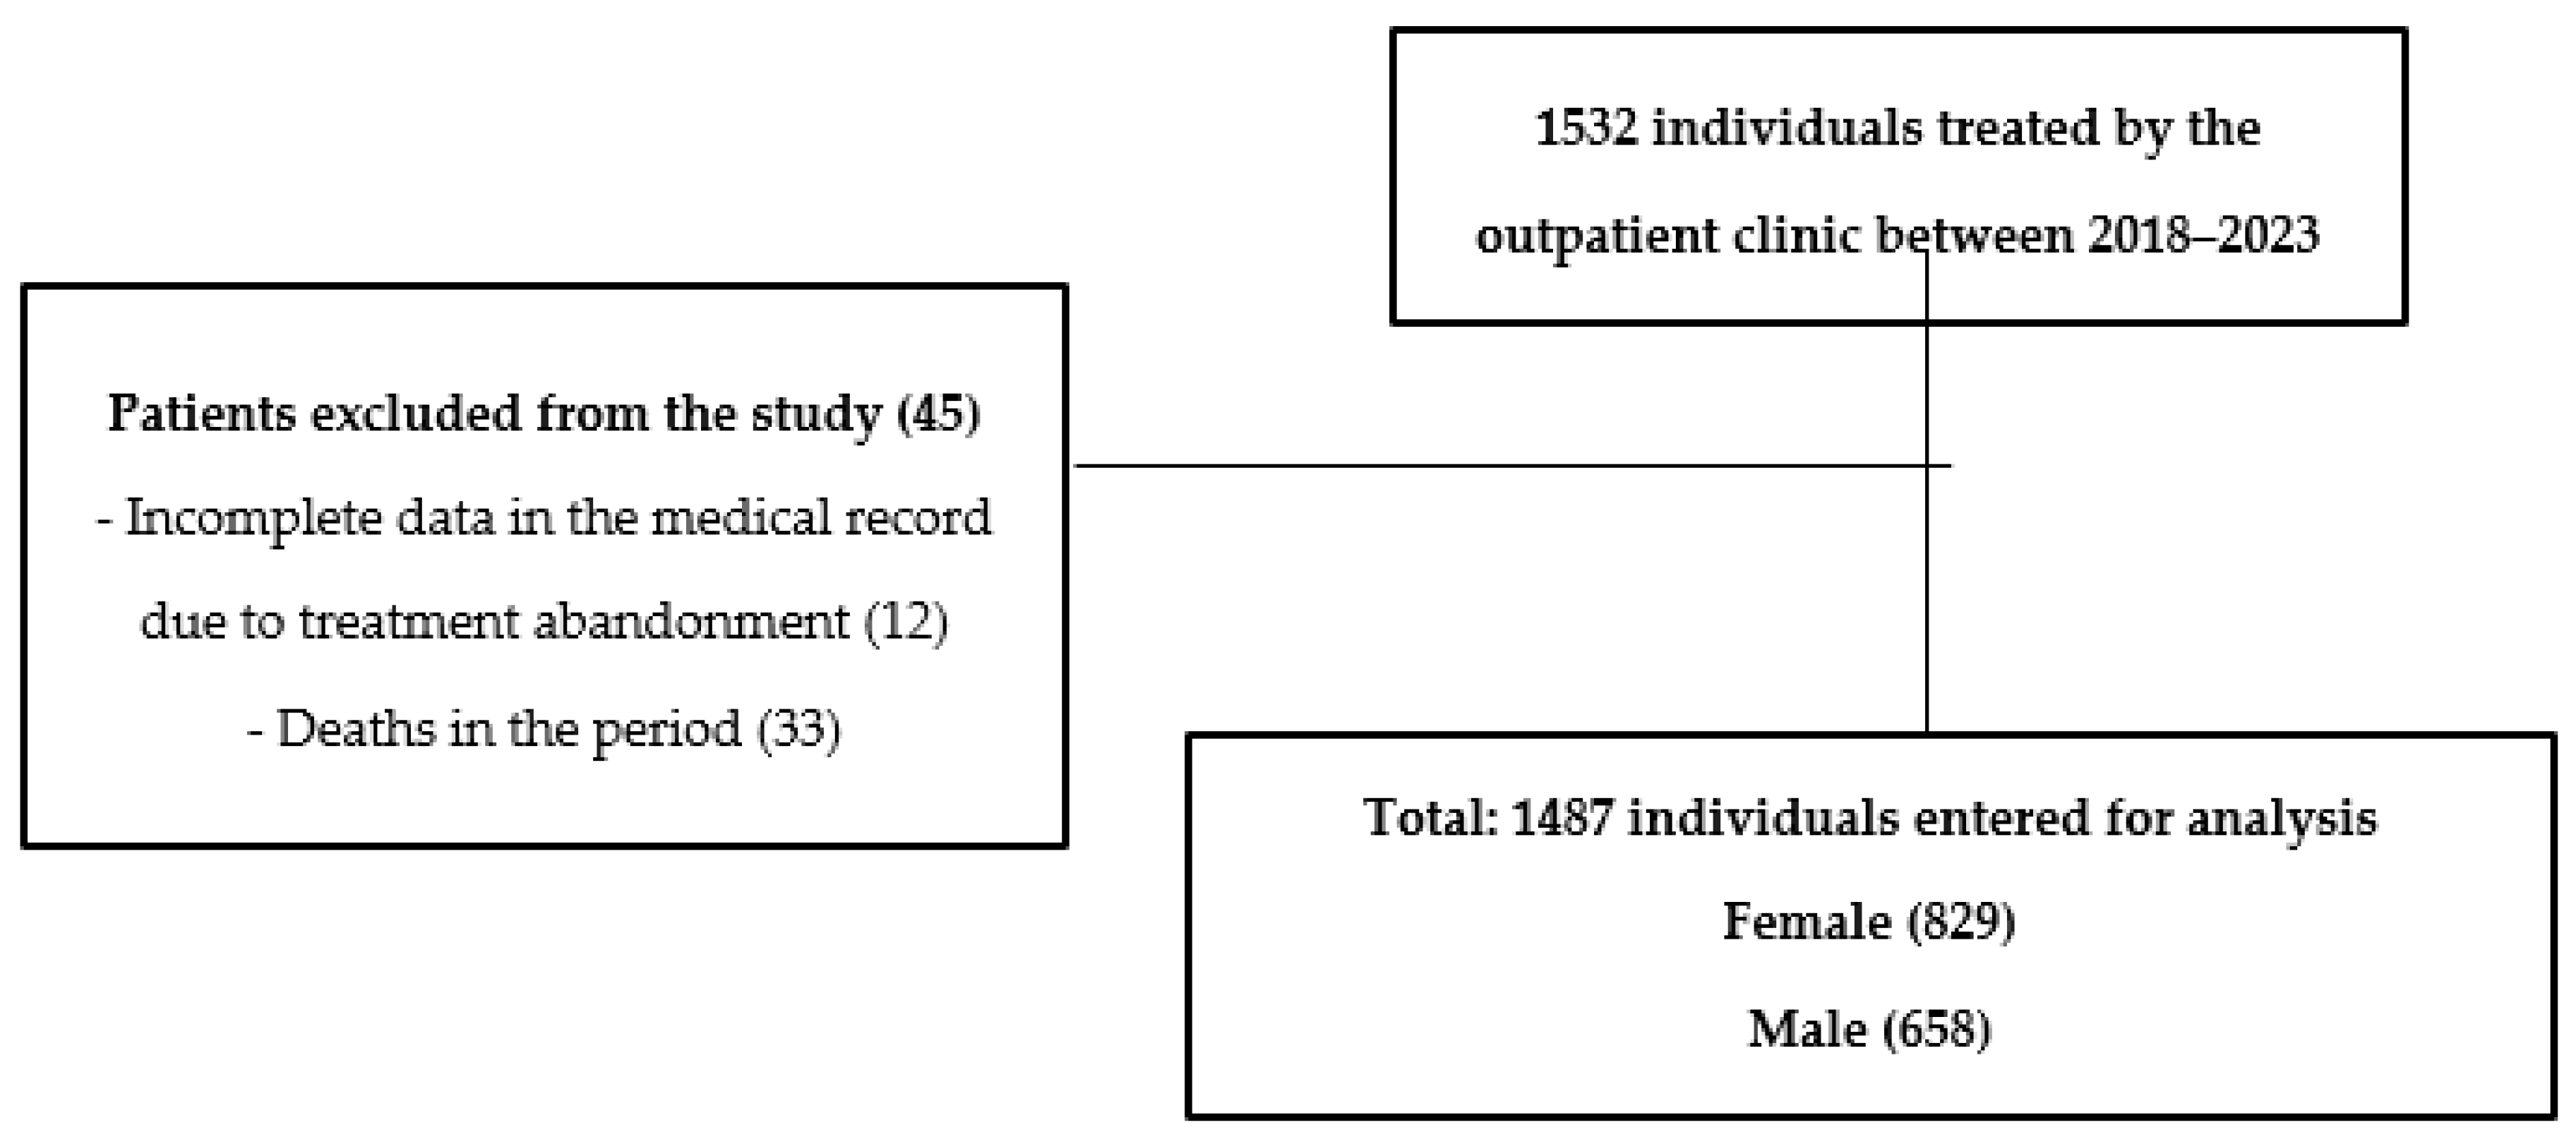
2.1. Study Design
2.2. Study Location
2.3. Clinical Data
2.4. Biochemical
2.5. Cardiovascular Risk
2.6. Anthropometry
2.7. Sociodemographic and Lifestyle
2.8. Statistical Analysis
3. Results
4. Discussion
5. Conclusions
Author Contributions
Funding
Institutional Review Board Statement
Informed Consent Statement
Data Availability Statement
Conflicts of Interest
References
- Chooi, Y.C.; Ding, C.; Magkos, F. The epidemiology of obesity. Metabolism 2019, 92, 6–10. [Google Scholar] [PubMed]
- Jayedi, A.; Rashidy-Pour, A.; Soltani, S.; Zargar, M.S.; Emadi, A.; Shab-Bidar, S. Adult weight gain and the risk of cardiovascular disease: A systematic review and dose-response meta-analysis of prospective cohort studies. Eur. J. Clin. Nutr. 2020, 74, 1263–1275. [Google Scholar] [CrossRef] [PubMed]
- Yuan, S.; Larsson, S.C. An atlas on risk factors for type 2 diabetes: A wide-angled Mendelian randomisation study. Diabetologia 2020, 63, 2359–2371. [Google Scholar] [CrossRef] [PubMed]
- Larsson, S.C.; Burgess, S. Causal role of high body mass index in multiple chronic diseases: A systematic review and meta-analysis of Mendelian randomization studies. BMC Med. 2021, 19, 320. [Google Scholar] [CrossRef]
- Mahmoud, I.; Al-Wandi, A.S.; Gharaibeh, S.S.; Mohamed, S.A. Concordances and correlations between anthropometric indices of obesity: A systematic review. Public Health 2021, 198, 301–306. [Google Scholar] [CrossRef] [PubMed]
- Fang, H.; Berg, E.; Cheng, X.; Shen, W. How to best assess abdominal obesity. Curr. Opin. Clin. Nutr. Metab. Care 2018, 21, 360–365. [Google Scholar] [CrossRef] [PubMed]
- Darbandi, M.; Najafi, F.; Pasdar, Y.; Rezaeian, S. Structural equation model analysis for the evaluation of factors associated with overweight and obesity in menopausal women in RaNCD cohort study. Menopause 2020, 27, 208–215. [Google Scholar] [CrossRef]
- Mahmoud, I.; Sulaiman, N. Dyslipidaemia prevalence and associated risk factors in the United Arab Emirates: A population-based study. BMJ 2019, 9, 031969. [Google Scholar] [CrossRef]
- Ranasinghe, P.; Jayawardena, R.; Gamage, N.; Wickramasinghe, V.P.; Hills, A.P. The range of non-traditional anthropometric parameters to define obesity and obesity-related disease in children: A systematic review. Eur. J. Clin. Nutr. 2021, 75, 373–384. [Google Scholar] [CrossRef]
- Namazi, N.; Larijani, B.; Surkan, P.J.; Azadbakht, L. The association of neck circumference with risk of metabolic syndrome and its components in adults: A systematic review and meta-analysis. Nutr. Metab. Cardiovasc. Dis. 2018, 28, 657–674. [Google Scholar] [CrossRef]
- Obirikorang, C.; Obirikorang, Y.; Acheampong, E.; Anto, E.O.; Toboh, E.; Asamoah, E.A.; Amakwaa, B.; Batu, E.N.; Brenya, P. Association of Wrist Circumference and Waist-to-Height Ratio with Cardiometabolic Risk Factors among Type II Diabetics in a Ghanaian Population. J. Diabetes Res. 2018, 2018, 1838162. [Google Scholar] [CrossRef] [PubMed]
- Luordi, C.; Maddaloni, E.; Bizzarri, C.; Pedicelli, S.; Zampetti, S.; D’Onofrio, L.; Moretti, C.; Cappa, M.; Buzzetti, R. Wrist circumference is a biomarker of adipose tissue dysfunction and cardiovascular risk in children with obesity. J. Endocrinol. Investig. 2020, 43, 101–107. [Google Scholar] [CrossRef] [PubMed]
- Shafiee, G.; Qorbani, M.; Heshmat, R.; Djalalinia, S.; Motlagh, M.E.; Arefirad, T.; Gorabi, A.M.; Najafi, F.; Asayesh, H.; Kelishadi, R. Wrist circumference as a novel predictor of obesity in children and adolescents: The CASPIAN-IV study. J. Pediatr. Endocrinol. Metab. 2018, 31, 717–725. [Google Scholar] [CrossRef]
- Namazi, N.; Djalalinia, S.; Mahdavi-Gorabi, A.; Asayesh, H.; Mansourian, M.; Noroozi, M.; Qorbani, M. Association of wrist circumference with cardio-metabolic risk factors: A systematic review and meta-analysis. Eat Weight Disord. 2020, 25, 151–161. [Google Scholar] [CrossRef] [PubMed]
- Von Elm, E.; Altman, D.G.; Egger, M.; Pocock, S.J.; Gøtzsche, P.C.; Vandenbroucke, J.P.; STROBE Initiative. The Strengthening the Reporting of Observational Studies in Epidemiology (STROBE) statement: Guidelines for reporting observational studies. J. Clin. Epidemiol. 2008, 61, 344–349. [Google Scholar] [CrossRef] [PubMed]
- Faludi, A.A.; Izar, M.C.O.; Saraiva, J.F.K.; Chacra, A.P.M.; Bianco, H.T.; Afiune, A.N.; Bertolami, A.; Pereira, A.C.; Lottenberg, A.M.; Sposito, A.C.; et al. Atualização da Diretriz Brasileira de Dislipidemias e Prevenção da Aterosclerose—2017. Arq. Bras. Cardiol. 2017, 109, 1–76. [Google Scholar] [CrossRef] [PubMed]
- Kannel, W.B. Risk stratification in hypertension: New insights from the Framingham Study. Am. J. Hypertens. 2000, 13, 3–10. [Google Scholar] [CrossRef] [PubMed]
- Pardini, R.; Matsudo, S.; Araújo, T.; Matsudo, V.; Andrade, E.; Braggion, G.; Andrade, D.; Oliveira, L.; Figueira, A.; Raso, V. Validação do questionário internacional de nível de atividade física (IPAQ-Versão 6): Estudo piloto em adultos jovens brasileiros. RBCM 2001, 9, 45–52. [Google Scholar]
- Eusebi, P. Diagnostic accuracy measures. Cerebrovasc. Dis. 2013, 36, 267–272. [Google Scholar] [CrossRef]
- Mousapour, P.; Barzin, M.; Valizadeh, M.; Mahdavi, M.; Hadaegh, F.; Azizi, F.; Hosseinpanah, F. Wrist circumference as a novel predictor of transition from metabolically healthy to unhealthy phenotype in overweight/obese adults: A gender-stratified 15.5-year follow-up. BMC Public Health 2021, 21, 2276. [Google Scholar] [CrossRef]
- Payab, M.; Qorbani, M.; Shahbal, N.; Motlagh, M.E.; Hasani-Ranjbar, S.; Zahedi, H.; Shafiee, G.; Ziaodini, H.; Pourmirzaiee, M.A.; Heshmat, R.; et al. Association of Anthropometric Indices With Metabolic Phenotypes of Obesity in Children and Adolescents: The CASPIAN-V Study. Front. Endocrinol. 2019, 10, 786. [Google Scholar] [CrossRef] [PubMed]
- Zadeh, T.S.S.; Moazzeni, S.S.; Asgari, S.; Mirbolouk, M.; Azizi, F.; Hadaegh, F. Association between Wrist Circumference and Risk of Any Fracture in Adults: Findings from 15 Years of Follow-Up in the Tehran Lipid and Glucose Study. J. Clin. Med. 2022, 11, 7048. [Google Scholar] [CrossRef] [PubMed]
- Brasil. Vigitel Brazil 2021: Surveillance of risk and protective factors for chronic diseases by telephone survey: Estimates of frequency and sociodemographic distribution of risk and protective factors for chronic diseases in the capitals of the 26 Brazilian states and the Federal District in 2021. Minist. Saúde 2021, 1, 1–131. [Google Scholar]
- Monteiro, L.Z.; Varela, A.R.; Lira, B.A.; Contiero, L.C.; Carneiro, M.L.A.; Souza, P.; Nóbrega, J.O.T.; Júnior, F.B. Weight status, physical activity and eating habits of young adults in Midwest Brazil. Public Health Nutr. 2019, 22, 2609–2616. [Google Scholar] [CrossRef] [PubMed]
- Burgess, E.; Hassmén, P.; Pumpa, K.L. Determinants of adherence to lifestyle intervention in adults with obesity: A systematic review. Clin. Obes. 2017, 7, 123–135. [Google Scholar] [CrossRef] [PubMed]
- Affinati, A.H.; Esfandiari, N.H.; Oral, E.A.; Kraftson, A.T. Bariatric Surgery in the Treatment of Type 2 Diabetes. Curr. Diabetes Rep. 2019, 19, 156. [Google Scholar] [CrossRef] [PubMed]
- Kalantari, S.; Khalili, D.; Asgari, S.; Fahimfar, N.; Hadaegh, F.; Tohidi, M.; Azizi, F. Predictors of early adulthood hypertension during adolescence: A population-based cohort study. BMC Public Health 2017, 17, 915. [Google Scholar] [CrossRef] [PubMed]
- Clemente, A.P.; Netto, B.D.; Carvalho-Ferreira, J.P.; Campos, R.M.S.; Ganen, A.P.; Tock, L.; Mello, M.T.; Dâmaso, A.R. Circunferência da cintura como marcador para triagem de doença hepática gordurosa não alcoólica em adolescentes obesos. Rev. Paul. Pediatr. 2016, 34, 47–55. [Google Scholar] [CrossRef] [PubMed]
- World Health Organization. Available online: https://www.who.int/news-room/fact-sheets/detail/obesity-and-overweight (accessed on 11 November 2023).
- Mohebi, R.; Mohebi, A.; Sheikholeslami, F.; Azizi, F.; Hadaegh, F. Wrist circumference as a novel predictor of hypertension and cardiovascular disease: Results of a decade follow up in a West Asian cohort. J. Am. Soc. Hypertens. 2014, 8, 800–807. [Google Scholar] [CrossRef]
- Derakhshan, A.; Eslami, A.; Bozorgmanesh, M.; Sheikholeslami, F.; Azizi, F.; Hadaegh, F. Wrist circumference as a novel negative risk factor for cardiovascular disease among adult men: A median follow-up of 9 years. J. Endocrinol. Investig. 2016, 39, 763–768. [Google Scholar] [CrossRef]
- Noudeh, J.Y.; Hadaegh, F.; Vatankhah, N.; Momenan, A.A.; Saadat, N.; Khalili, D.; Azizi, F. Wrist circumference as a novel predictor of diabetes and prediabetes: Results of cross-sectional and 8.8-year follow-up studies. J. Clin. Endocrinol. Metab. 2013, 98, 777–784. [Google Scholar] [CrossRef] [PubMed]
- Capizzi, M.; Leto, G.; Petrone, A.; Zampetti, S.; Papa, R.E.; Osimani, M.; Spoletini, M.; Lenzi, A.; Osborn, J.; Mastantuono, M.; et al. Wrist circumference is a clinical marker of insulin resistance in overweight and obese children and adolescents. Circulation 2011, 123, 1757–1762. [Google Scholar] [CrossRef] [PubMed]
- Amini, A.; Soltanian, N.; Iraj, B.; Askari, G.; Ebneyamin, S.; Ghias, M.; Hajian, H.; Zahed, A.; Amini, M. Association of wrist circumference with cardio metabolic risk factors. J. Pak. Med. Assoc. 2012, 62, 34–36. [Google Scholar]


| Variable/Category | Age Range | p-Value | |
|---|---|---|---|
| 20 to 40 Years n (%) | >40 Years Old n (%) | ||
| SEX | |||
| Feminine | 420 (60.1) | 409 (51.9) | 0.002 |
| Masculine | 279 (39.9) | 379 (48.1) | |
| Framingham classification | |||
| High | 185 (32) | 432 (62.4) | <0.001 |
| Intermediary | 12 (2) | 68 (9.9) | |
| Low | 382 (66) | 190 (27.7) | |
| ERG | |||
| High | 179 (30.9) | 436 (63) | <0.001 |
| Intermediary | 43 (7.4) | 128 (18.5) | |
| Low | 357 (61.7) | 128 (18.5) | |
| IPAQ | |||
| Active | 459 (65.7) | 592 (75.1) | <0.001 |
| Inactive | 240 (34.3) | 196 (24.9) | |
| BMI | |||
| Low weight | 32 (4.6) | 9 (1.1) | <0.001 |
| Eutrophy | 82 (11.7) | 102 (12.9) | |
| Overweight | 153 (21.9) | 210 (26.6) | |
| Obesity | 432 (61.8) | 467 (59.3) | |
| Variable | Age Range | p-Value | |
|---|---|---|---|
| 20 to 40 Years Median (IIQ) | >40 Years Old Median (IIQ) | ||
| Weight (kg) | 87.4 (73.3–105) | 84.6 (73.3–95.6) | 0.002 |
| Height (cm) | 1.65 (1.59–1.72) | 1.62 (1.57–1.7) | <0.001 |
| BMI (kg/m2) | 31.6 (27.3–39.3) | 32.1 (27.7–36.8) | 0.206 |
| WrC (cm) | 17 (15.8–18) | 17 (16–18) | 0.009 |
| WrCE (cm) | 37 (34.2–39) | 37 (35–38.5) | 0.855 |
| WC (cm) | 98 (86.8–110) | 100 (91.9–109) | 0.003 |
| WHtR (cm) | 0.59 (0.53–0.67) | 0.61 (0.56–0.67) | <0.001 |
| WHR (cm) | 0.88 (0.81–0.93) | 0.92 (0.86–0.97) | <0.001 |
| Variable | Wrist Circumference | ||
|---|---|---|---|
| Total R (p-Value) | 20 to 40 Years R (p-Value) | >40 Years Old R (p-Value) | |
| Weight (kg) | 0.61 (<0.001) | 0.64 (<0.001) | 0.57 (<0.001) |
| Height (cm) | 0.31 (<0.001) | 0.31 (<0.001) | 0.33 (<0.001) |
| BMI (kg/m2) | 0.51 (<0.001) | 0.55 (<0.001) | 0.44 (<0.001) |
| WrCE (cm) | 0.56 (<0.001) | 0.61 (<0.001) | 0.48 (<0.001) |
| WC (cm) | 0.53 (<0.001) | 0.57 (<0.001) | 0.48 (<0.001) |
| WHtR (cm) | 0.43 (<0.001) | 0.46 (<0.001) | 0.38 (<0.001) |
| WHR (cm) | 0.29 (<0.001) | 0.33 (<0.001) | 0.27 (<0.001) |
| Wrist Circumference | ||||||
|---|---|---|---|---|---|---|
| Variables | β (EP) | T (p-Value) | Bstd _ | VIF | R2 | R2adj |
| Weight (kg) | 7.12 (0.25) | 28.79 (<0.001) | 0.61 | 0.94 | 0.38 | 0.38 |
| Height (cm) | 0.72 (0.08) | 8.16 (<0.001) | 0.17 | 0.93 | 0.43 | 0.42 |
| BMI (kg/m2) | 2.30 (0.09) | 26.10 (<0.001) | 0.57 | 0.94 | 0.33 | 0.32 |
| WrCE (cm) | 0.84 (0.04) | 23.12 (<0.001) | 0.49 | 0.93 | 0.37 | 0.37 |
| WC (cm) | 4.86 (0.21) | 23.02 (<0.001) | 0.53 | 0.92 | 0.28 | 0.28 |
| WHtR (cm) | 0.03 (0.001) | 19.90 (<0.001) | 0.47 | 0.92 | 0.22 | 0.22 |
| WHR (cm) | 0.01 (0.001) | 7.93 (<0.001) | 0.19 | 0.92 | 0.24 | 0.24 |
| SBP (mmHg) | 1.35 (0.19) | 7.26 (<0.001) | 0.18 | 0.94 | 0.13 | 0.13 |
| PAD (mmHg) | 0.91 (0.12) | 7.61 (<0.001) | 0.20 | 0.94 | 0.08 | 0.07 |
| Total cholesterol | 0.62 (0.55) | 1.15 (0.251) | 0.03 | 0.94 | 0.01 | 0.01 |
| LDL | 0.11 (0.47) | 0.24 (0.811) | 0.01 | 0.94 | 0.01 | 0.01 |
| HDL | 0.01 (0.14) | 0.07 (0.940) | 0.002 | 0.94 | 0.01 | 0.003 |
| Triglycerides | 2.19 (1.23) | 1.77 (0.076) | 0.05 | 0.95 | 0.02 | 0.02 |
| Fasting blood glucose | −0.66 (0.62) | −1.06 (0.290) | −0.03 | 0.94 | 0.05 | 0.05 |
| Variable | Wrist Circumference | ||
|---|---|---|---|
| Total R (p-Value) | 20 to 40 Years R (p-Value) | >40 Years Old R (p-Value) | |
| TOTAL CHOLESTEROL | 0.07 (0.011) | 0.10 (0.012) | 0.04 (0.244) |
| LDL | 0.02 (0.436) | 0.03 (0.545) | 0.02 (0.676) |
| HDL | −0.04 (0.114) | −0.02 (0.586) | −0.07 (0.061) |
| TRIGLYCERIDES | 0.15 (<0.001) | 0.25 (<0.001) | 0.07 (0.078) |
| FASTING GLUCOSE | 0.09 (0.002) | 0.14 (0.002) | 0.04 (0.334) |
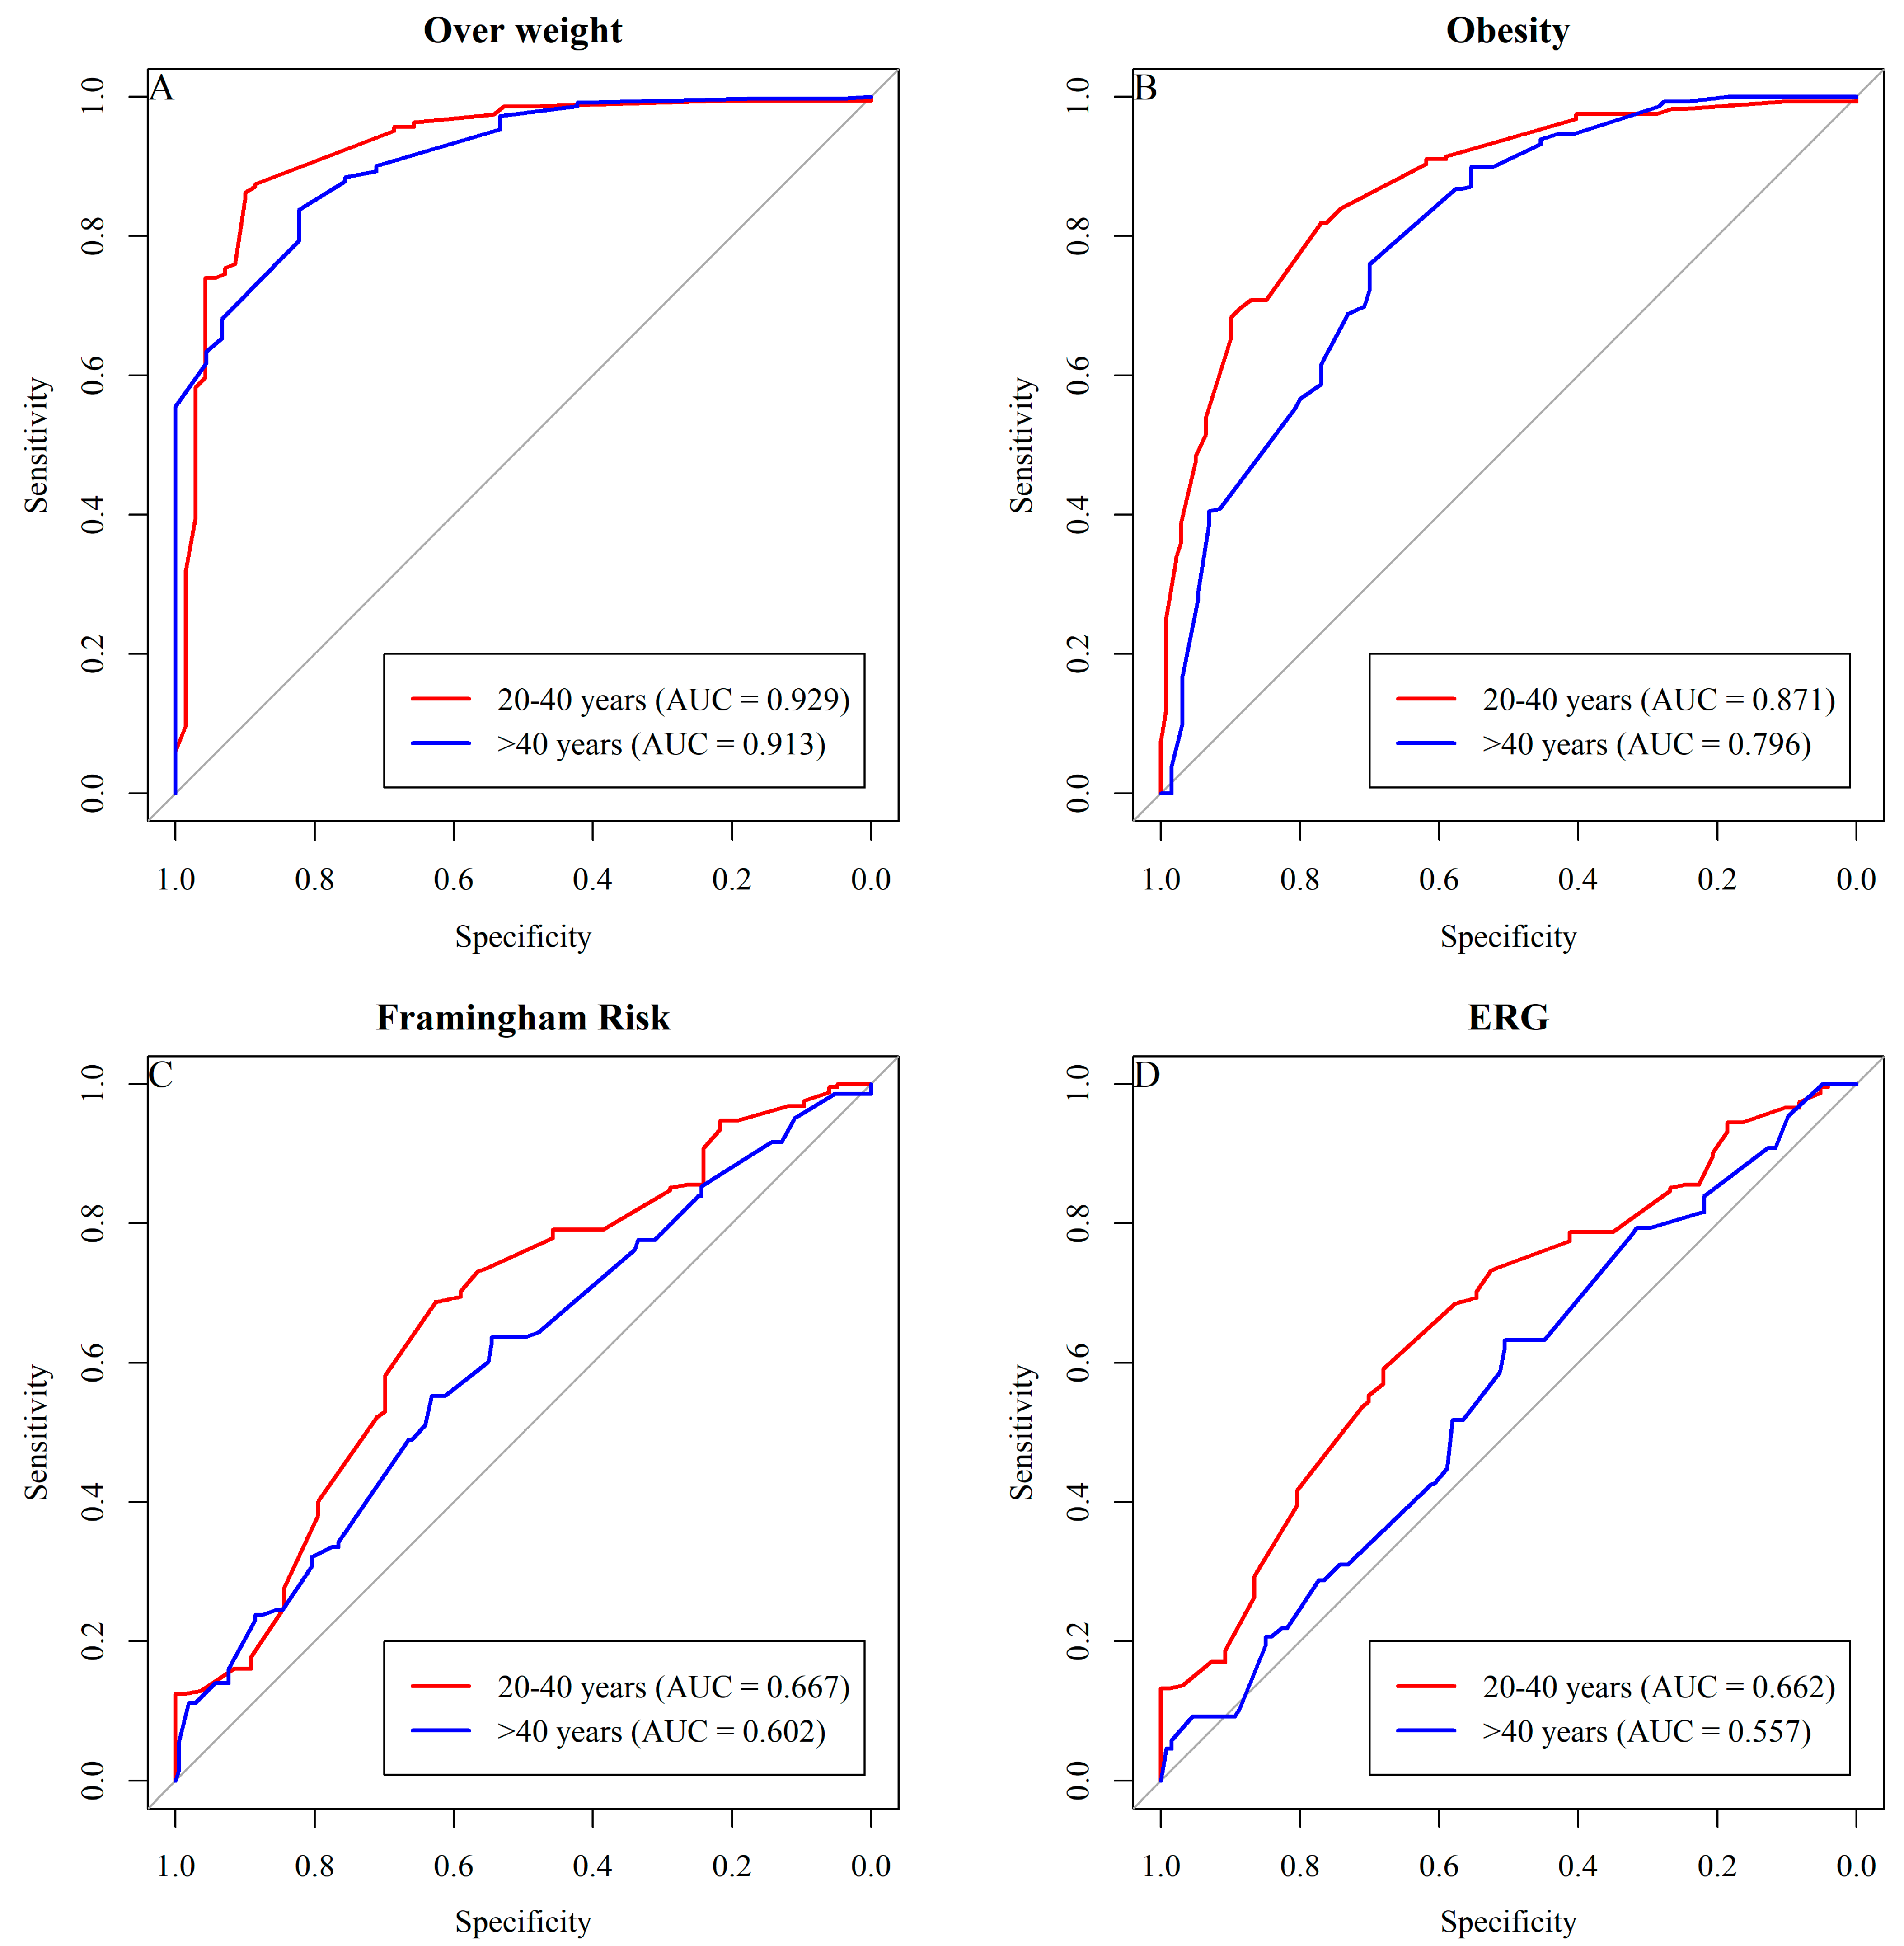
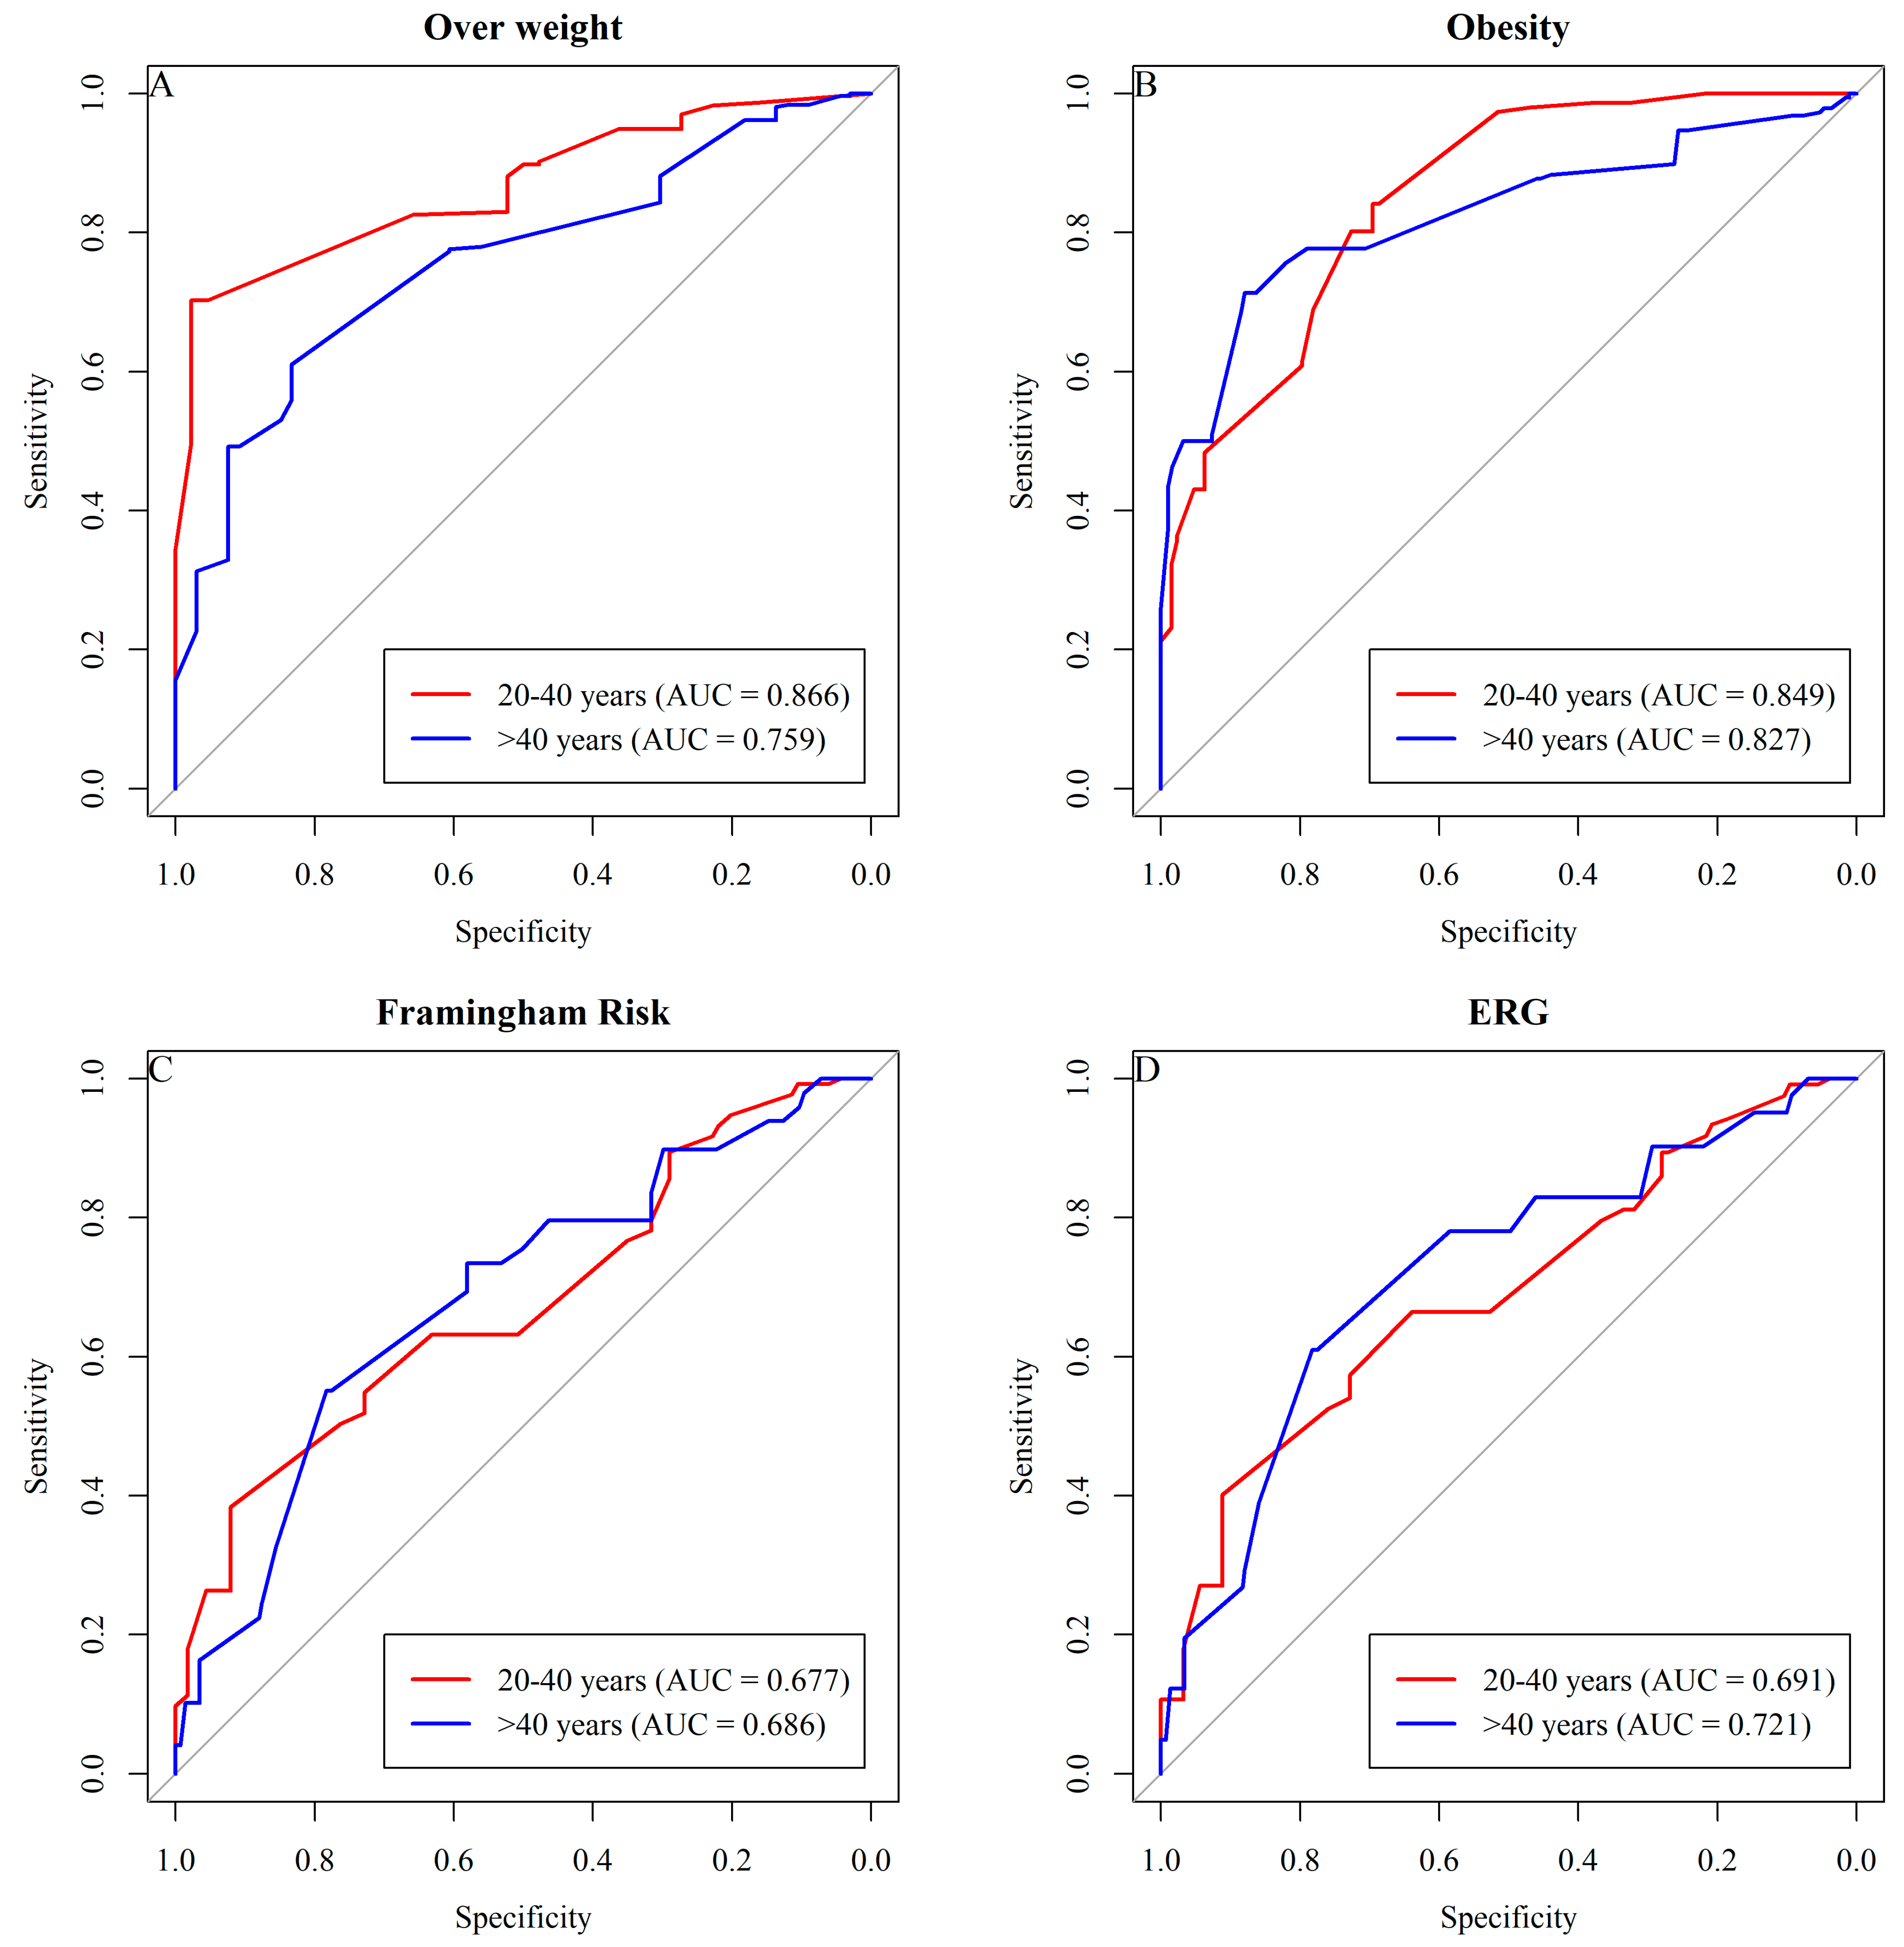
| Variable | Circumference of Wrist (cm) | IF | ES | B.C | PPV | VPN | AUC | Youden |
|---|---|---|---|---|---|---|---|---|
| Overweight | ||||||||
| 20 to 40 years | 15.6 | 83.8 | 82.2 | 83.6 | 97.4 | 38.5 | 0.913 | 0.660 |
| >40 years old | 15.4 | 86.3 | 90 | 86.9 | 97.7 | 56.7 | 0.929 | 0.762 |
| Obesity | ||||||||
| 20 to 40 years | 16.1 | 76.0 | 70 | 74.1 | 84.5 | 57.6 | 0.796 | 0.460 |
| >40 years old | 16 | 81.8 | 77 | 80.2 | 87.8 | 67.7 | 0.871 | 0.588 |
| Framingham Risk | ||||||||
| 20 to 40 years | 16.4 | 64.4 | 52.4 | 64.1 | 55.6 | 61.5 | 0.593 | 0.169 |
| >40 years old | 16.6 | 62.6 | 68.7 | 74.0 | 40.0 | 84.6 | 0.667 | 0.313 |
| ERG | ||||||||
| 20 to 40 years | 16.4 | 63.9 | 52.2 | 64.8 | 56.1 | 60.2 | 0.590 | 0.162 |
| >40 years old | 16.6 | 62.3 | 67.8 | 75.6 | 36.9 | 85.6 | 0.668 | 0.302 |
Disclaimer/Publisher’s Note: The statements, opinions and data contained in all publications are solely those of the individual author(s) and contributor(s) and not of MDPI and/or the editor(s). MDPI and/or the editor(s) disclaim responsibility for any injury to people or property resulting from any ideas, methods, instructions or products referred to in the content. |
© 2024 by the authors. Licensee MDPI, Basel, Switzerland. This article is an open access article distributed under the terms and conditions of the Creative Commons Attribution (CC BY) license (https://creativecommons.org/licenses/by/4.0/).
Share and Cite
Pereira, L.M.C.; Souza, M.F.C.d.; Aidar, F.J.; Getirana-Mota, M.; Santos-Junior, A.M.d.; Filho, M.F.D.d.S.; Almeida-Santos, M.A.; Rocha, R.M.S.; Almeida, R.R.d.; Baumworcel, L.; et al. Wrist Circumference Cutoff Points for Determining Excess Weight Levels and Predicting Cardiometabolic Risk in Adults. Int. J. Environ. Res. Public Health 2024, 21, 549. https://doi.org/10.3390/ijerph21050549
Pereira LMC, Souza MFCd, Aidar FJ, Getirana-Mota M, Santos-Junior AMd, Filho MFDdS, Almeida-Santos MA, Rocha RMS, Almeida RRd, Baumworcel L, et al. Wrist Circumference Cutoff Points for Determining Excess Weight Levels and Predicting Cardiometabolic Risk in Adults. International Journal of Environmental Research and Public Health. 2024; 21(5):549. https://doi.org/10.3390/ijerph21050549
Chicago/Turabian StylePereira, Larissa Monteiro Costa, Márcia Ferreira Cândido de Souza, Felipe J. Aidar, Márcio Getirana-Mota, Alex Menezes dos Santos-Junior, Mario Francisco Dantas de Santana Filho, Marcos Antonio Almeida-Santos, Raysa Manuelle Santos Rocha, Rebeca Rocha de Almeida, Leonardo Baumworcel, and et al. 2024. "Wrist Circumference Cutoff Points for Determining Excess Weight Levels and Predicting Cardiometabolic Risk in Adults" International Journal of Environmental Research and Public Health 21, no. 5: 549. https://doi.org/10.3390/ijerph21050549