Article

Molecular Modeling Studies of the Binding Characteristics of Phosphates to Sevelamer Hydrochloride – Assessing a Novel Technique to Reduce Phosphates Contamination

1
Department of FAMU/FSU Industrial and Manufacturing Engineering, Tallahassee, FL, USA
2
Department of Materials Science and Engineering University of Florida, Gainesville, FL, USA
3
Department of Chemistry Florida A&M University, Tallahassee, FL, USA
4
Department of Nephrology University of Florida, Gainesville, FL, USA
*
Author to whom correspondence should be addressed.
Int. J. Environ. Res. Public Health 2006, 3(2), 202-208; https://doi.org/10.3390/ijerph2006030024
Submission received: 6 February 2006 / Accepted: 2 June 2006 / Published: 30 June 2006

Abstract

:
Recent advances in the use of polymeric materials for the remediation of phosphate from aqueous systems, including biological environments, have prompted the use of computational techniques to determine which methods are feasible to model such complex systems and to model the mechanism of binding action. In particular, Sevelamer Hydrochloride (Renagel®) is used as our model polymer. A relatively simple system is constructed with a dimer of Sevelamer Hydrochloride and four phosphate ions used for capture. This work reports on molecular dynamics and Monte Carlo simulations used to determine average structure, and points of intermolecular interaction, and calculate changes in volume after the successful capture of phosphate in our model. Our resulting volume changes are of the order of 20–25%, in comparison to experimental swelling measurements on similar systems, which have an average swelling of 50–60% in aqueous media.

Introduction

Environmental concerns over phosphate contamination in aqueous systems have spawned the need for its targeted removal from lakes and ponds. Eutrophication of such water systems is a direct effect of phosphorus and other excessive elemental concentrations [14]. These compounds are found in industrial and domestic wastewater. Elements such as nitrogen, which is known to contribute to eutrophication, have been examined for remediation by use of nitrification processes. However, phosphorus containing compounds have proven to be much more difficult to handle in a practical fashion [24]. One method which employs the use of a condensed phosphate template resin has been shown to absorb phosphate. This system was produced via an emulsion polymerization of oleylamine, oleyl alcohol, and divinylbenzene to form a surface imprinted binding site for the capture of phosphates [4]. This current work reports on a more simplified system which uses Sevelamer Hydrochloride to sequester phosphate ions.
The similarities between the functional groups in the structure of Sevelamer Hydrochloride and the oleylamine polymerized system allow for direct comparisons between phosphate binding structure and electrostatic/van der Waals interactions between the captured phosphate and amine groups. Use of Monte Carlo simulations to calculate molecular volumes provide a means for comparison of the in silico results with experimental results. This work reports on the culmination of two computational methods to reproduce the swelling in Renagel®[58] and determine the binding interactions, and structure involved in phosphate capture. This simple model can then be extrapolated to more sophisticated systems for use in predicting polymer systems to be used in wastewater treatment.
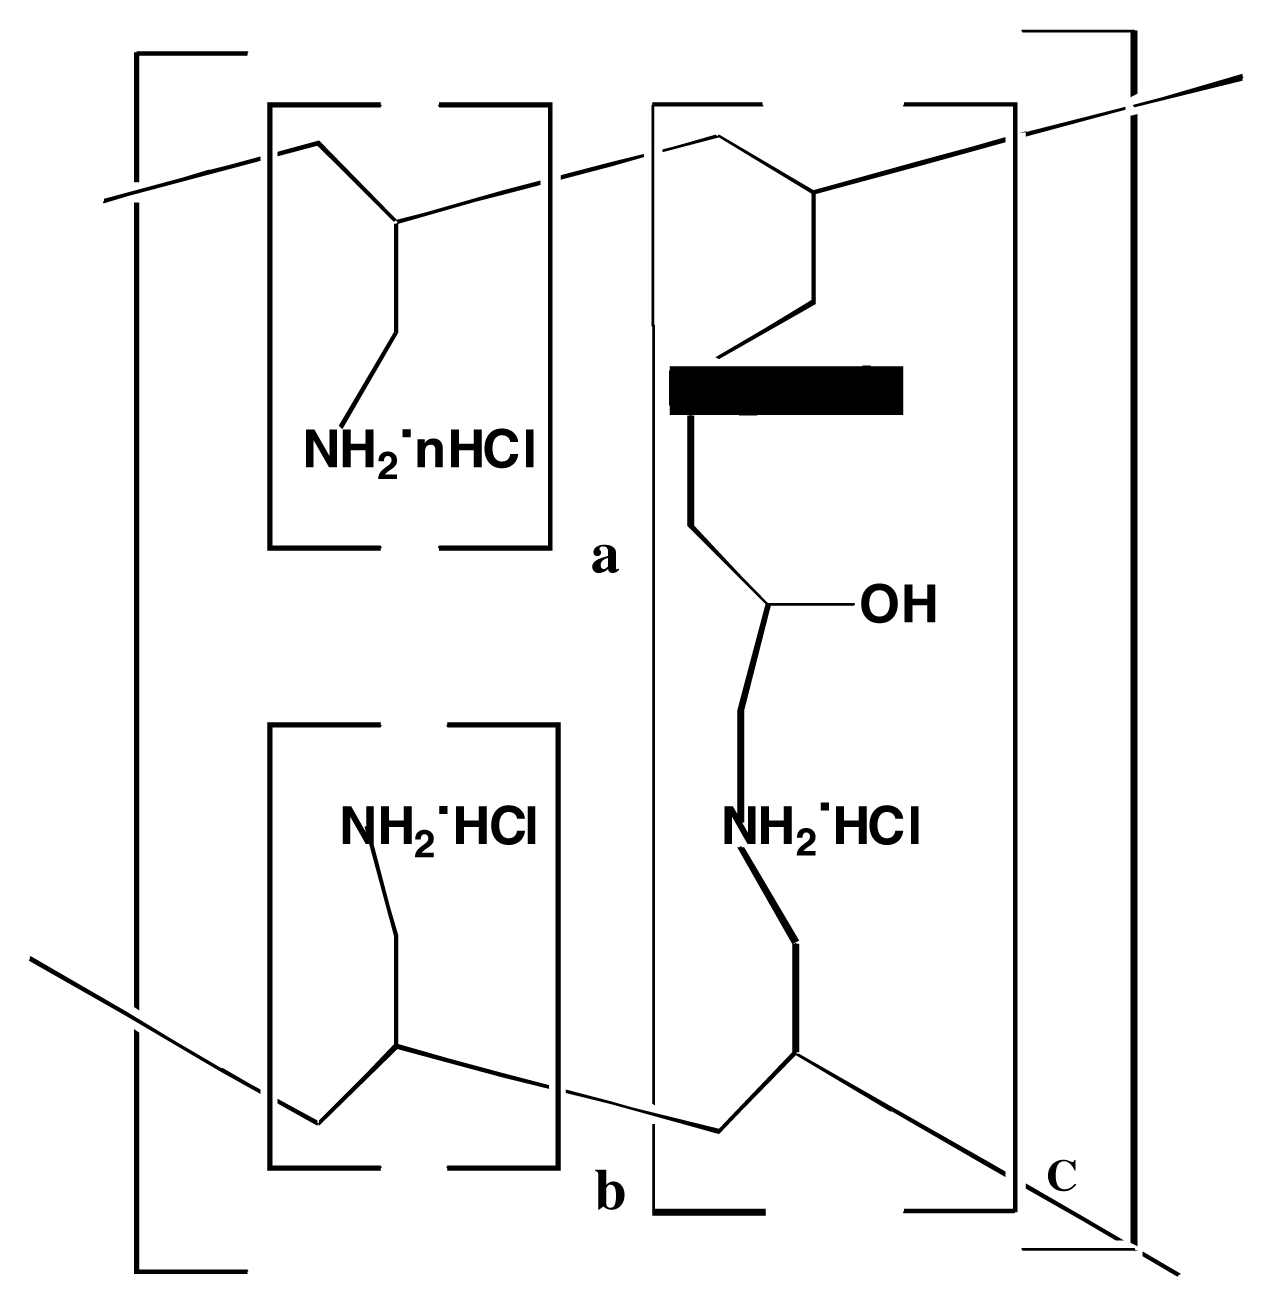
Figure 1 shows the schematic of Sevelamer Hydrochloride. The NH2 groups are protonated by the HCl producing a set of positively charged cages to capture the phosphate anions. In addition, hydroxyl groups can function as supplemental sites for binding through hydrogen bond interactions. Using our simple model of 1.5 repeat units shown in Figure 1, molecular dynamics [9, 10], and Monte Carlo methods [9, 11], insight into the interactions and bonding structure of this system is defined. In particular, Monte Carlo simulations were used to conduct volume calculations to be compared with experimental swelling measurements by taking the difference between the calculated volumes of our model and the same model with four captured phosphate ions in the system.

Methods

Experimental Methods (Swelling Measurements)

Particles for swelling studies are obtained by dissolving a Renagel® tablet (800 mg) in 100 mL of deionized water for 1 hour. The solid is filtered, collected, and dried overnight under pressure. Once dried, particles are spread over double-sided tape, and mounted in a flow cell. Solution flow through the cell is set to 100 mL/hr, which is regulated via a syringe pump. Particle size change is analyzed after flowing solutions of .1 M HCl through the cell for 1 hour. Swelling is monitored through an optical microscope at a 10x magnification, and measurements are taken using Zeiss imaging software. Readings are taken in triplicate, the third set using Image J software, and are found to be within ± 5 % of each other.

Computational Methods

Molecular Dynamics

Vacuum System

Sybyl 6.9 Software [12] was used to build the inhibitor in vacuum and perform minimization and molecular dynamics simulations on SGI Octane 2. Energy minimization was performed with Tripos [12] force-field and Gasteiger-Huckel [13] charges with a non-bond cutoff distance of 8 Å using the conjugate gradient method until the root mean square deviation (RMS) < 0.05 kcal/mole/Å (where Å is angstrom). An NVT ensemble [9] molecular dynamic simulation was conducted in vacuum with Gasteiger-Huckel [6] charges assigned at 300 K for 400 ps with a time step of 1 fs. Every 200 fs a snapshot was collected.

Solvated System

The dielectric constant of the system was changed to a constant of 78 debye to mimic a solvated (H2O) system. The same non-bonded cutoff distance of 8Å was used in the solvated system, along with the same conjugate gradient method and convergence criteria. Again, Gasteiger-Huckel charges were used on the atoms of the system. Using this prescription the large dielectric constant diminishes the coulombic interactions of the charged atoms. This allows for the study of the van der Waals interactions absent strong coulombic effects. Therefore the effect of van der Waals attraction on phosphate capture could be determined.

Monte Carlo

The procedure used to determine the volume of each molecule was a simple Monte Carlo procedure. In broad terms, the Monte Carlo method was broken into four steps. First, a spherical shell was formed around the molecule. Secondly, several random values were generated as points in space, bound by the dimensions of the sphere. This allowed all points generated to fall within the sphere; however, they might not have fallen within the molecule. Thirdly, an algorithm was used to assess if the values fell within the molecule. Lastly, the volume of the sphere was multiplied by the ratio of points falling within the molecule to the total number of points. The product was assessed to be the volume of the molecule.

Determining the Shell Volume

The spatial coordinates of the molecular system are exported from the molecular modeling program in the cssr format (Cambridge Structure Search and Retrieval). The cssr format is composed of a numbering column, an atom identification column, spatial coordinates, a connectivity matrix, each atom’s potential charge and a few other pieces of chemical information.
The spatial coordinates are given in a Cartesian format. The center of the molecule (x′,y′,z′) was determined by averaging the values in the coordinate space. The molecule was then translated by spatial subtraction of each value by the center. This resulted in the center of the molecule having the coordinate of (0,0,0). The coordinate space is subsequently transformed into spherical coordinates. The largest value of r is determined. A value of 2 Å is added to the larges value of r. This value is termed rshell. From this, the volume of the shell is determined.
V s h e l l = 4 3 π r s h e l l 3

Generating Random Numbers

The random numbers used for this simulation are obtained via the stock random number generator of Matlab®. For each point three numbers are generated. The first two numbers are bound by (−π,π), and the angles are given in radians. The last number is bound by the radius of the shell.

Determining the Ratio

To increase the efficiency of the assessment, the solution technique is parsed into three steps. The first step evaluates if the generated radius is greater than any radius existing on the molecule. If so, the value is assessed to be outside of the molecule and added only to the total count. If the value is less than all values within the molecule, it is counted in the molecule. For the other values, the proximity to an angle is assessed. If 1 or more points have a radius greater than the said angle, and is within 0.07 radians (~2 degrees) of any of those points having a larger radius, then it was assessed within the molecule. This algorithm was run several times such that the value of ratio as shown in Equation 2 became sufficiently stable over many runs.
r a t i o = c o u n t i n s i d e c o u n t t o t a l

Determining the Volume of the Molecule

The value of the molecule as shown in Equation 2 was determined by multiplying the total volume of the shell by the ratio of points falling within the molecule vs. the number of total points (Equation 3).
V m o l e c u l e = V s h e l l × r a t i o
The reportable final volume of the molecule is assessed by taking the average of several runs. This is performed by utilizing a nested for-loop. The first for-loop is used to determine a ratio. The second for-loop is used to determine the stability of the Monte Carlo method in predicting the volume of the molecule. If the predicted value has a covariance less than 3%, then we conclude that the prediction method is valid.

Results

Figure 2 depicts experimental swelling results are shown below. These results showed swelling ranging between 10–200%, with the average being approximately 50–60%. As mentioned above, these results were determined by light microscopy using a light microscope at 1300 ×10 magnification using Zeiss Magnification Software.
The results presented at this point will compare the experimental swelling measurements to that of the calculated values from the simulations. The molecular dynamic simulations are used to construct a view of the average structure of our model system in the presence of four triphosphate ions. The average structure is then used in Monte Carlo simulation to compute the volume of the model system. The percent change of volume (% swelling) is calculated by comparing the volume of model system absent phosphates to that of the same system with the four triphosphate ions. To begin with we present the results of the molecular dynamic system in vacuum. Figure 3 shows the plot of the total energy of the system vs. the time for the NVT ensemblen [9] simulation in vacuum with a constant dielectric of 1 debye. As depicted in Figure 3, the simulation is stable for 1 ns.
A space filled representation of the model system is shown in figure 4. It is clear from the representation that the phosphate ions appear trapped in NH2 and NH3 cages in the center of the system (3 out of the 4 phosphates) with the outer phosphate ion seemingly plugged into an amine socket on the surface of the model system. This observation leads us to believe that van der Waals interactions are the major contributors to ion capture in this model system.
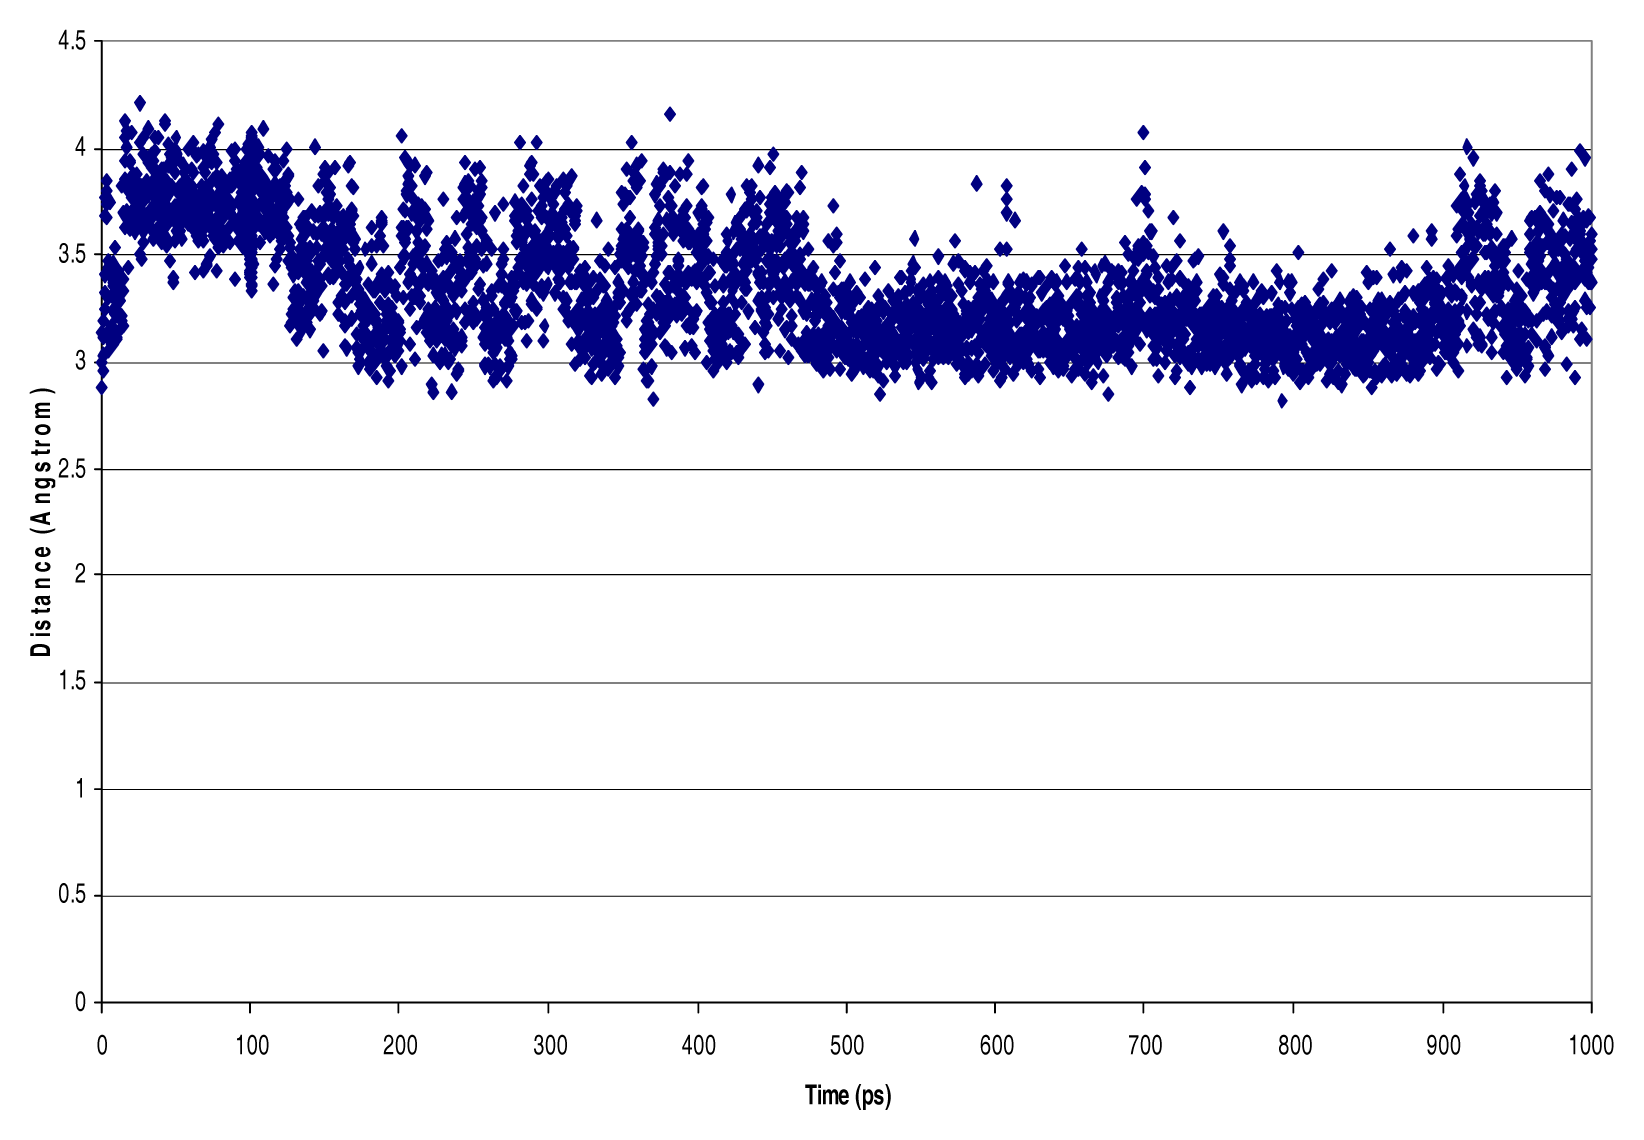
Figure 5 shows the interatomic distances between a nitrogen atom labeled Nitrogen 126 and phosphorus atom labeled Phosphorous 237. The atom labels represent the atom type and atom number for the entire system. From the plot it is evident that upon the resolution of the reorganization energy the system stabilizes and maintains a bond distance between 2.7 and 4 Å. The plot also shows an adjustment of the system at around 480 ps to allow for the Nitrogen - Phosphorous separation to decrease below 3.5 Å, and eventually the system adjusts back to a larger average separation around 3.5 Å. This would allow for hydrogen bonding between the phosphate ions and the hydrogen atoms on the amine groups and/or van der Waals interactions ions.
Figure 6 below is a similar type of plot with the interatomic distances of Nitrogen 204 and Phosphorous 237 being depicted. In this plot the Nitrogen group is bonded to the end of the polymer allowing for more freedom of motion. This group moves freely in a wagging motion. Therefore, the capture phosphate is held steady while the amine is allowed to wag in and out of the proximity of the phosphate, resulting in a periodic motion depicted in Figure 6. The periodic interatomic separation between the phosphate ion and the amine nitrogen is due to the wagging motion of the amine on the polymeric tail, and varies between a separation of ~5 Å for 200 ps and then returns to a separation of below 4.3 Å for 400 ps with only a brief change in that approximate distance during that period.
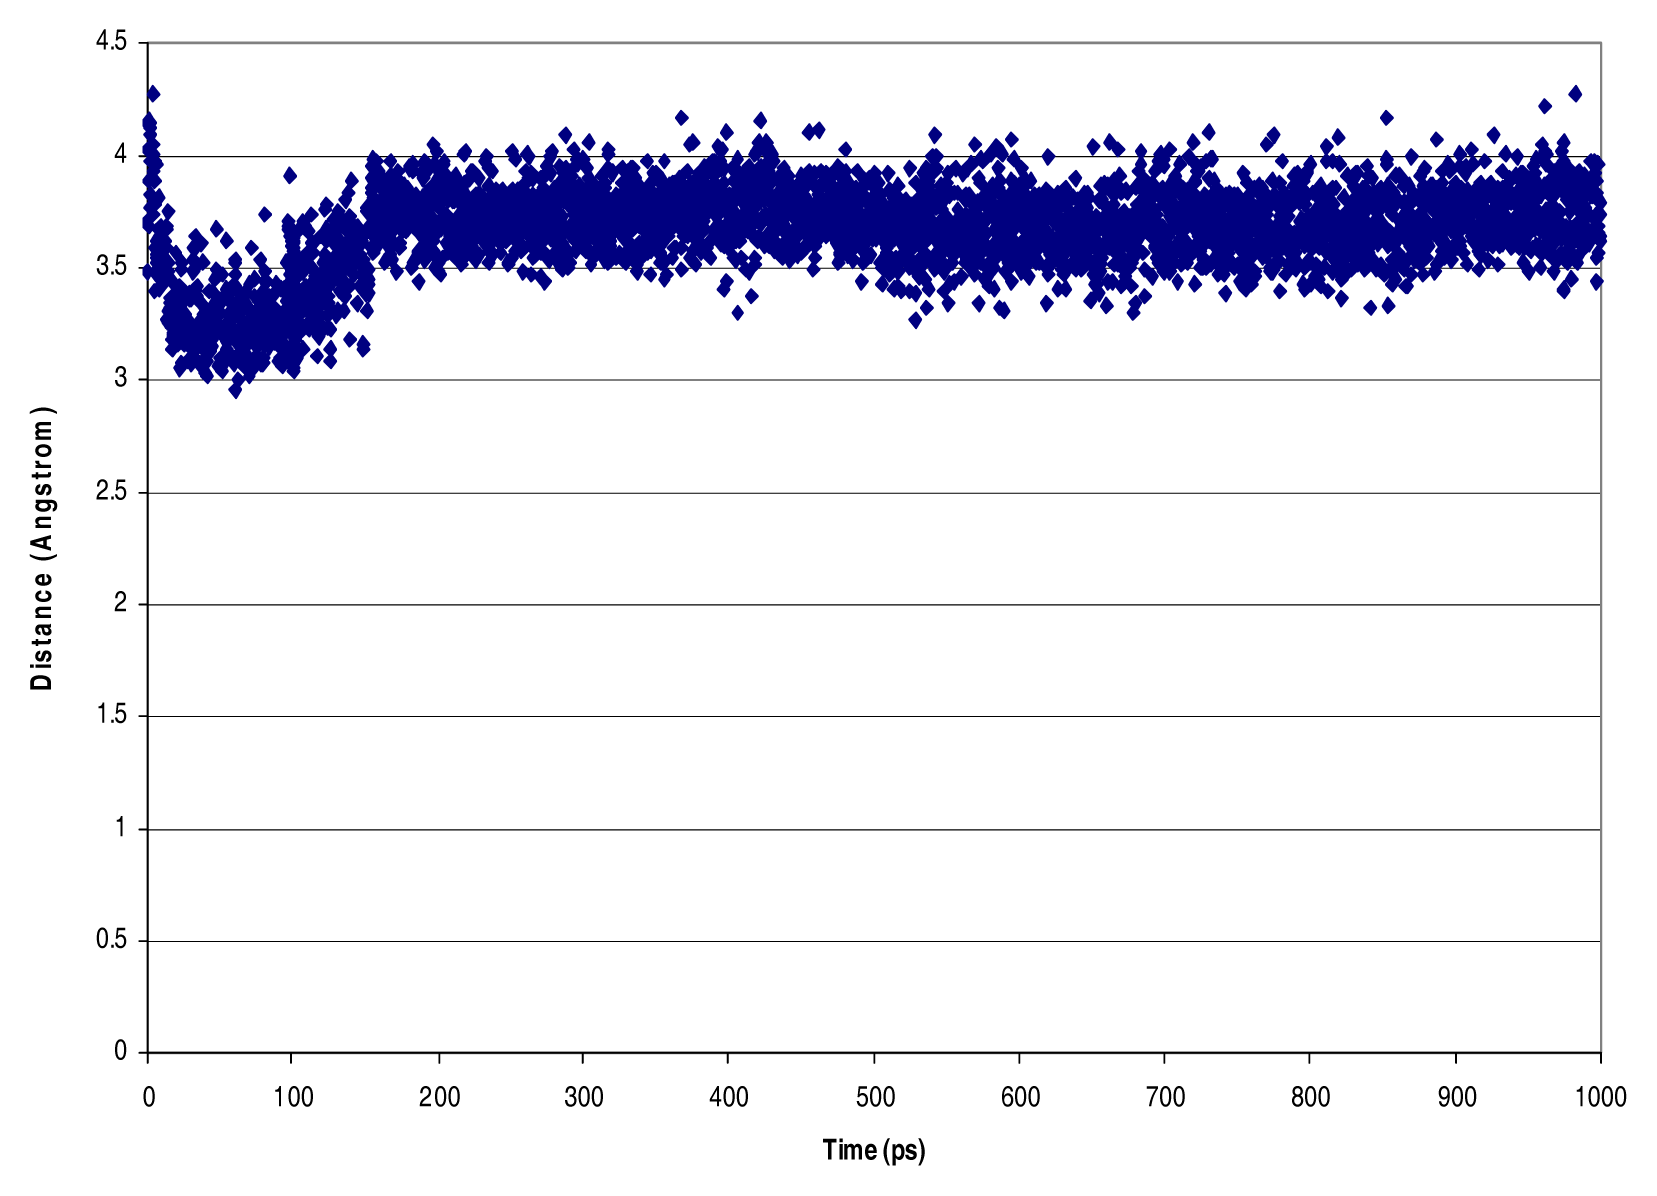
Figure 7 above shows the plot of the interatomic distance between Nitrogen (89) and Phosphorous (237). This figure displays the reorganization and stabilization that followed during the simulation. After the reorganization of the polymer the separation was maintained at about 3.5–4 Å. Nitrogen (89) and Phosphorous (237) show typical behavior of amines nitrogen groups and phosphate ions in the central cages of the polymers.
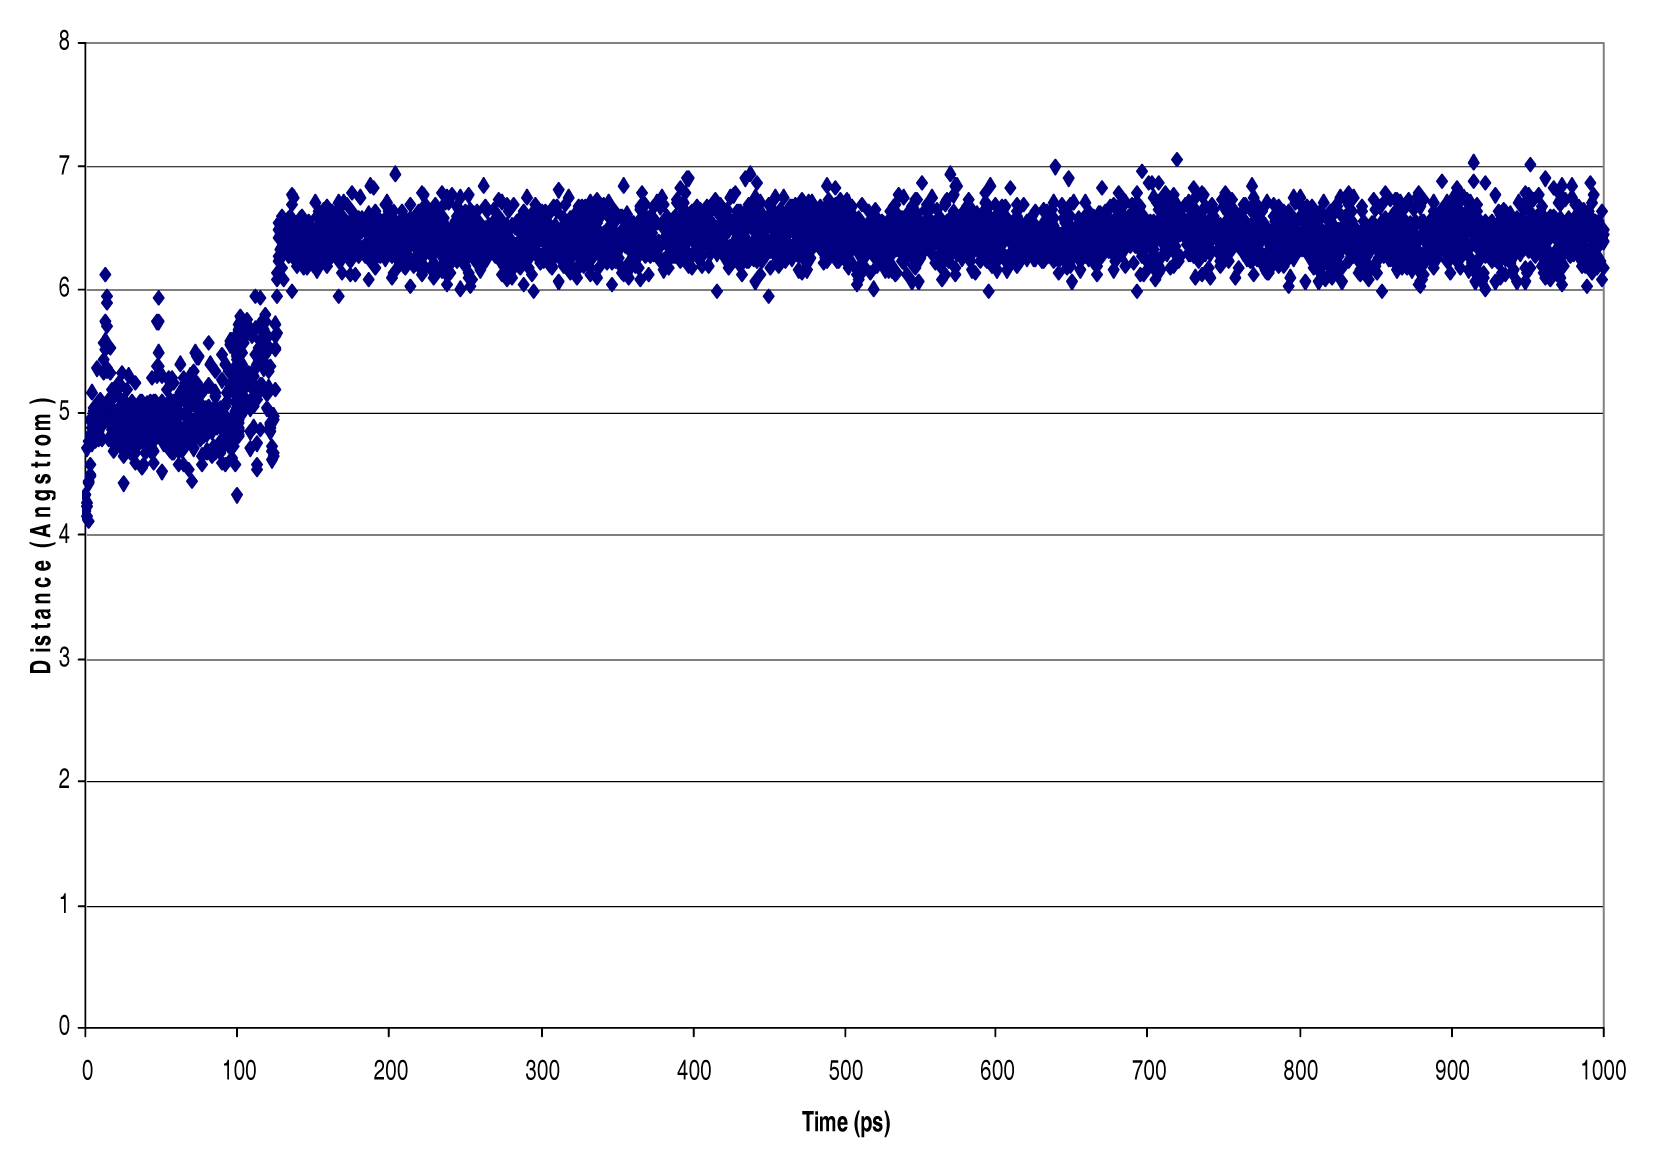
After measuring the distances between a set of interior (captured) phosphate ions the distances remain constant after the stabilization of the simulation. The plot shown in Figure 8 shows the stable separation between Phosphorous 237 and Phosphorous 216 of about 6–7 Å. In fact this type of stabilized separation is evident between all of the phosphorus atoms found in phosphates captured in the center of the polymer.
Finally, we discuss the calculated volumes of the model system with four phosphates and the same system without the phosphates. In comparing the two aforementioned system volumes we are able to estimate the percent swelling. Using Monte Carlo simulations we were able to determine the volumes of these systems. Below we show the results of the Monte Carlo simulations using structures from the molecular dynamic simulations. The results of Monte Carlo simulations used to calculate volume of 733 and 933 cubic Å for the systems containing no phosphate ions and for the system containing four phosphate ions, respectively, are shown below in the plots.
With these calculated volumes shown in Figure 9 and 10, the percent swelling can be determined and compared to experimental data. The percent swelling was calculated to be 25% which is below the average percent swelling of 50–60% found in the experimental results. Tables 1 and 2 summarize the interatomic distances of several of the Nitrogen-Phosphate pairs.
One of the possible explanations for the discrepancy between our results and the experimental averages is the lack of solvent found in the experimental measurements. We used a constant dielectric of 78 debye to mimic a solvated system. We produced similar molecular dynamic simulations for several hundred picoseconds that showed internal and external capture of 4 phosphate ions by our model polymer system. The energy plots for these systems are not shown here, but a similar table (Table 2) to the one shown below is presented below for our solvated simulation.
Both tables show the mean standard deviation, high, and low values of various inter-atomic separations are reported from the results of a NVT ensemble simulation in vacuum for the four phosphate system. Captured phosphates in the inner portion of the polymer, exhibit Nitrogen-Phosphorous separations on the order of 3–4Å with very small standard deviations. This suggests little or no movement of the central phosphate (captured). In the solvated system the system goes through considerable reorganization before being stabilized. Due to the large dielectric constant in the simulated solvated system, see the equation below, the coulombic interactions are decreased tremendously.
U = q 1 q 2 D r 2
where D = dielectric constant
In Table 1 the standard deviation of the Nitrogen - Phosphorous separations that are on the centrally captured phosphate amines is very low where as in Table 2 where the solvation is mimicked by the change in dielectric from 1 to 78 debye the deviations are much higher. This is due to the fact that the capture of phosphate is attributed to van der Waals interactions. In fact, the polymer must undergo structural rearrangement to properly incorporate the phosphates in an amine cage. Table 2 summarizes such results.
The hydrogen bonding found with chloride ions and hydrogen atoms in the NVT ensemble simulation with dielectric of 1 (vacuum) is not present in the solvated system (dielectric 78). This is evident when all of the chloride ion escape the system and must be removed from the system entirely in order to produce a stable simulation.
The chloride ions rely on electrostatic interactions due to their smaller size as opposed to the larger phosphate ions which experience significant van der Waals interactions. The calculated average volume from the molecular dynamic simulation of the solvated four phosphate systems produced a percent swelling of 140% which is good agreement with some of the extreme values of the experimental results.

Discussion

The results presented in this work conclude that a simple model of the Renagel® compound Sevelamer hydrochloride can reproduce % swelling results. Our results derived from molecular dynamic and Monte Carlo simulations showed an average value of 25% in vacuum and over 140% in H2O mimicked (dielectric 78) simulations. These results are relatively consistent with experimental results of between 10–200%, with the average being approximately 50–60%. Our results also bring out the dominant nature of van der Waals bonding in this system by effectively eliminating electrostatic interactions by increasing the dielectric to 78 debye.
In this way our results are able to show the capture of the four phosphates with minimal electrostatic interactions. The internal capture of phosphate is apparently achieved through formation of amine cages around the phosphate in the center of the polymer while the external capture of phosphate was accomplished by interactions about one of the P-O bonds with the amines on the exterior of the polymer.
Figure 1. Schematic description of Sevelamer Hydrochloride (Renagel®), where a, b = number of primary amine groups a+b = 9; c = number of cross-linking groups, c= 1; n = fraction of protonated amines, n = 0.4; m = large number to indicate extended polymer network. This work used approximately 1.5 of these repeating units. The schematic in Figure 1 was taken from the Renagel® website: www.renagel.com.
Ijerph 03 00202f1
Figure 2. Shows experimental swelling results of Renagel® a) dry, b) after 1 hour in solution.
Ijerph 03 00202f2
Figure 3. Plot of the Total energy vs. Time for a NVT ensemble. The plot shows a stable simulation for almost 1 nanosecond.
Ijerph 03 00202f3
Figure 4. Van der Waals representation of model system with four PO4 ions captured by the polymer. The green spheres represent chloride ions (counter ions to amines), light blue spheres are hydrogen atoms, royal blue spheres are nitrogen atoms, red spheres are oxygen atoms, and orange spheres are phosphorus atoms. In order to further support this idea the interatomic distances were plotted between various nitrogen and phosphorus atoms. The following discussion shows data depicting the dynamic motion of between the nitrogen groups and phosphate ions being captured.
Ijerph 03 00202f4
Figure 5. Interatomic distance between Nitrogen (126) and Phosphorous (237) in the model system Renagel® and four triphosphate ions. The plot shows an adjustment of the system at about 480 ps to allow for the N-P separation to decrease below 3.5 Å and eventually the system adjusts back to a larger average separation around 3.5 Å.
Ijerph 03 00202f5
Figure 6. Interatomic distance between Nitrogen (204) and Phosphorous (237) in the model system Renagel® and four triphosphate ions. This figure shows the periodic motion of end amine group wagging in and out of the proximity of the phosphours 237 atom of a triphosphate ion. The ion and amine nitrogen group interatomic separation is periodic due to the wagging motion of the amine on the polymeric tail and varies between a separation of ~5 Å for 200 ps and then returns to a separation of below 4.3 Å for 400 ps with only a brief change in that approximate distance during that period.
Ijerph 03 00202f6
Figure 7. Depicts the change of interatomic distance between N(89) and P(237). This figure displays the reorganization and stabilization that followed during the simulation. After the reorganization of the polymer the separation was maintained at about 3.5–4 Å.
Ijerph 03 00202f7
Figure 8. The P(237)-P(216) interatomic separations plotted versus time. The plot shows a stable separation after about 100ps between 6–7 Å.
Ijerph 03 00202f8
Figure 9. Monte Carlo Calculations of Volume (No Phosphates) Plot of calculated volumes versus the iteration number. Monte Carlo simulations were used to determine the system volume. The system is a vacuum system containing no phosphate ions.
Ijerph 03 00202f9
Figure 10. Plot of calculated volumes versus the iteration number. Monte Carlo simulations were used to determine the system volume. The system is a vacuum system containing four phosphate ions.
Ijerph 03 00202f10
Table 1. Interatomic distance values (mean, standard deviation, high, and low) for the NVT ensemble simulation in vacuum for four phosphate system with dielectric 1 debye.
NVT Ensemble 4 PO4 dielectric=1 debye InterAtomic Distances [Nitrogen - Phosphorous, Phosphorous - Phosphorous, Hydrogen - Chlorine] (Å)

Atom Types and ID NumberMeanStandard DeviationHighLow
N126-P2373.350.284.212.82
N39-P2373.160.184.022.76
N89-P2373.660.194.272.96
N30-P2373.350.143.812.92
N81-P2373.130.123.732.69
N204-P2374.330.686.003.34
N102-P24213.150.113.632.79
N204-P2423.360.164.002.78
N165-P2424.100.175.323.49
N89-P2263.440.425.122.86
N165-P2263.080.093.512.79
N188-P2263.190.134.032.81
N139-P2265.841.037.012.97
N201-P2163.030.143.822.71
N16-P2163.290.234.562.82
N65-P2163.180.174.302.74
P237-P2166.210.537.044.12
P226-P2425.904.090.194.88
Cl106-H1433.190.134.032.81
Table 2. Interatomic distance values (mean, standard deviation, high, and low) for the NVT ensemble with dielectric 78 debye to mimic a solvated system (H2O). This system shows the capture of four phosphates internally and externally for several hundred picoseconds.
NVT Ensemble 4 PO4 dielectric=1 debye InterAtomic Distances [Nitrogen - Phosphorous, Phosphorous - Phosphorous, Hydrogen - Chlorine] (Å)

Atom Types and ID NumberMeanStandard DeviationHighLow
N16-P22310.222.2321.416.72
N131-P2284.520.979.283.19
N84-P2284.591.069.403.37
N96-P2285.550.788.453.70
N144-P2289.191.0413.674.06
N155-P22810.481.4214.614.54
N77-P2287.820.8912.336.01
N77-P2024.691.5910.593.03
N177-P2025.662.2812.813.19
N62-P2028.524.8420.283.24
N155-P2025.922.7014.423.39
N119-P20212.441.9915.984.73
N77-P2236.403.4920.103.15
N119-P2239.883.7821.273.36
N29-P2124.991.1211.353.42
N37-P2124.761.1712.463.32
P223-P2129.802.7718.995.73
N77-P2124.910.748.183.26
N29-P2238.003.7217.183.40
P228-P2029.411.6612.274.16
P223-P2288.471.9617.604.91

Acknowledgements

The proceeding work was accomplished with support from a NIH/NCRR/RCMI Grant number G12RR03051 and NSF/FGLSAMP/AGEP Grants numbered HRD0217675 and HRD9817676. The authors of this work would like to express their sincere appreciation for the use of the Molecular Modeling Laboratory in the College of Pharmacy and Pharmaceutical Sciences at Florida A&M University and the support provided by the system administrator of that facility, Mr. Michael Arradondo.

References

  1. Foy, R. H.; Withers, P. J. A. The Contribution of Agricultural Phosphorus to Eutrophication, 365 Ed ed; Department of Agriculture for Northern Ireland: Belfast, UK; In Fertiliser Society1995; pp. 1–32. [Google Scholar]
  2. Kunoh, M.; Niwa, K.; Nakamoto, N.; Fukuwari, T. Condensed-Phosphate Imprinted Resins. Suikankyou Gakkaishi 1997, 20, 338. [Google Scholar]
  3. Nakasone, H.; Ozaki, M.; Kuroda, H. Advancement of nitrogen removal of the contact aeration system by the aeration tank preface system. Suikankyou, Gakkaishi 1997, 20, 665. [Google Scholar]
  4. Fujiwara, I.; Maeda, M.; Takagi, M. Condensed-Phosphate Imprinted Resins Prepared by a Surface Template Polymerization Method. Analytical Sciences 2002, 16, 407–412. [Google Scholar]
  5. Rosenbaum, D.; Holmes-Farley, S.; Mandeville, W.; Pitruzello, M.; Goldberg, D. Effect of Rena-Gel, A Non-absorbable, Cross-linked, Polymeric Phosphate Binder, on Urinary Phosphorus Excretion in Rats. Nephrol Dial Transplant 1997, 12, 961–964. [Google Scholar]
  6. Goldberg, D.; Dillon, M.; Slatopolsky, E.; Garrett, B.; Gray, J.; Marbury, T.; Weinberg, M.; Wombolt, D.; Burke, S. Effect of RenaGel®, a non-absorbed, calcium- and aluminium-free phosphate binder, on serum phosphorus, calcium, and intact parathyroid hormone in end-stage renal disease patients. Nephrol. Dial. Transplant 1997, 12(8), 1640–44. [Google Scholar]
  7. Chertow, G.; Burke, S.; Lazarus, J.; Stenzel, K.; Wombolt, D.; Bonventre, J.; Slatopolsky, E. Poly[allylamine hydrochloride] (Renagel): A noncalcemic Phosphate Binder for the Treatment of Hyperphosphatemia in Chronic Renal Failure. Am J. Kidney Dis 1997, 29, 66–67. [Google Scholar]
  8. Burke, S. K.; Goldberg, D.; Lazarus, J. RenaGel, A Novel Calcium- and Aluminum-free Phosphate Binder, Inhibits Phosphate Absorption in Normal Volunteers. Nephrol. Dial. Transplant 1997, 12, 1640–1644. [Google Scholar]
  9. Leach, A. Molecular Modelling: Principles and Applications; Pearson Education Limited: Edinburgh Gate, Harlow, England, 1996. [Google Scholar]
  10. Berendsen, H. J. C. Treatment of long-range forces in molecular dynamics. In Molecular Dynamics and Protein Structure; Hermans, J., Ed.; Western Springs, IL; Polycrystal Book Service, 1985; pp. 18–22. [Google Scholar]
  11. Olaj, O. F.; Petrik, T.; Zifferer, G. Monte Carlo Simulations of Symmetric Polymer Blends 2, Chain Properties in Interface Regions. J. Chem. Phys 1998, 108, 8226. [Google Scholar]
  12. SYBYL 6.9; Tripos Inc: 1699 Hanley Road, St. Louis, Missouri, 63144, USA, 2003.
  13. Gasteigner, J.; Marsili, M. A New Model for Calculating Atomic Charges in Molecules. Tetrahedron Lett 1978, 3181–3184. [Google Scholar]