Exposure Assessment of Diesel Bus Emissions

1
Division of Physics and Biophysics, Department of Molecular Biology, University of Salzburg, A-5020 Salzburg, Austria
2
International Laboratory for Air Quality and Health Queensland University of Technology, QLD 4001, Brisbane, Australia
*
Author to whom correspondence should be addressed.
Int. J. Environ. Res. Public Health 2006, 3(4), 309-315; https://doi.org/10.3390/ijerph2006030038
Submission received: 15 August 2005
/
Accepted: 10 February 2006
/
Published: 31 December 2006
Abstract
:The goal of this study was to measure ultrafine particle concentrations with diameters less than 1 μm emitted by diesel buses and to assess resulting human exposure levels. The study was conducted at the Woolloongabba Busway station in Brisbane, Australia in the winter months of 2002 during which temperature inversions frequently occurred. Most buses that utilize the station are fuelled by diesel, the exhaust of which contains a significant quantity of particle matter. Passengers waiting at the station are exposed to these particles emitted from the buses. During the course of this study, passenger census was conducted, based on video surveillance, yielding person-by-person waiting time data. Furthermore, a bus census revealed accurate information about the total number of diesel versus Compressed Natural Gas (CNG) powered buses. Background (outside of the bus station) and platform measurements of ultrafine particulate number size distributions were made to determine ambient aerosol concentrations. Particle number exposure concentration ranges from 10 and 40 to 60% of bus related exhaust fumes. This changes dramatically when considering the particle mass exposure concentration, where most passengers are exposed to about 50 to 80% of exhaust fumes. The obtained data can be very significant for comparison with similar work of this type because it is shown in previous studies that exhaust emissions causes cancer in laboratory animals. It was assumed that significant differences between platform and background distributions were due to bus emissions which, combined with passenger waiting times, yielded an estimate of passenger exposure to ultrafine particles from diesel buses. From an exposure point of view, the Busway station analyzed resembles a street canyon. Although the detected exhaust particle concentration at the outbound platform is found to be in the picogram range, exposure increases with the time passengers spend on the platform along with their breathing frequency.
Introduction
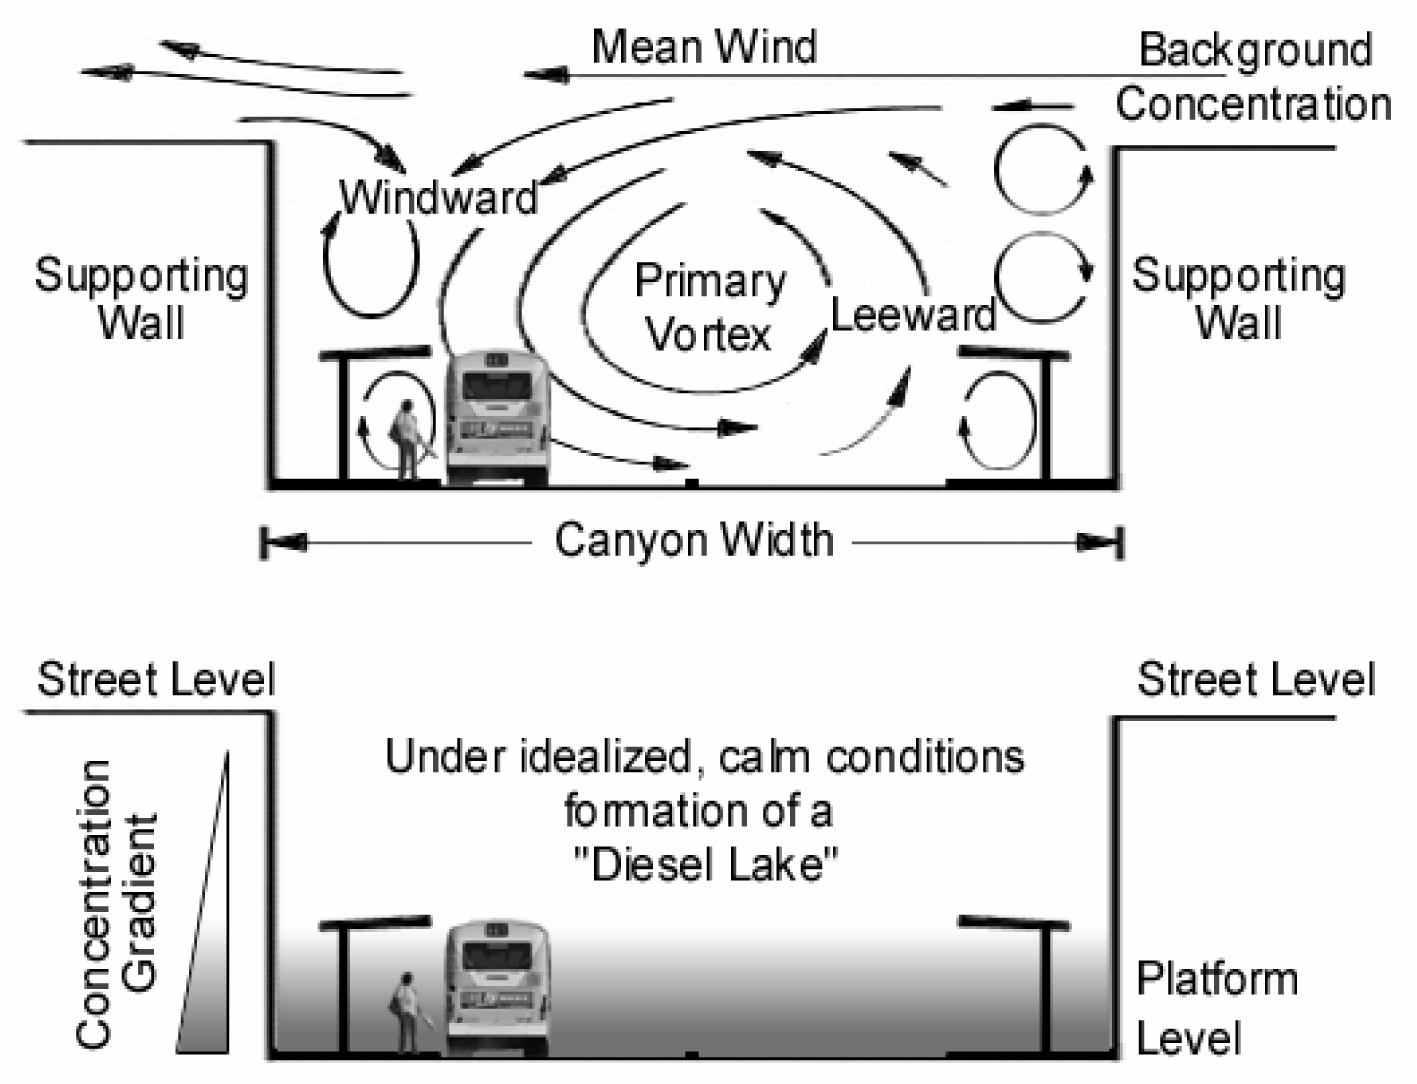
Despite considerable amounts of basic research, neither the formation of diesel particulate matter (DPM) in the combustion chamber, nor its physico-chemical properties or human health effects are fully understood at present. However, DPM is perceived as one of the major harmful emissions produced by diesel engines [9]. Exposure to diesel exhaust emissions has been classified by the International Agency for Research on Cancer (IARC) [7], as well as other international health organizations [3], as probably carcinogenic to humans [2,7]. Among soot particles, diesel exhaust contains a complex mixture of many gases and adsorbed substances known to be hazardous air pollutants [4]. Diesel was found to increase carcinogenic rates in rat tissues, but may also be carcinogenic in humans [6]. Almost the entire fresh diesel exhaust particle mass is in the fine particle range of less than 1 μm in diameter. Because of their minute sizes and hydrophobic properties, these particles are easily inhaled and eventually trapped within the bronchial and alveolar regions of the lung. Studies investigating the chemical and physical changes of diesel exhaust emissions suggest that there is little or no hygroscopic growth of primary diesel particles [1]. This observation suggests that the small size of DPM particles might be maintained upon inhalation, particularly near the emission source, allowing these particles to reach the deeper portions of the respiratory tract. Secondary aerosols from diesel exhaust may also exhibit different biological reactions from the primary particles. Since it is known that diesel exhaust also contains organic matter (including PAHs, dioxins and furans) [9], there is evidence for nitration of some PAH compounds resulting in the formation of 3-nitrobenzathrone that is mutagenic [13]. Highly exposed categories generally include urban settings in which diesel delivery trucks, buses, and garbage trucks frequent roadways, in particular, people living near freeways, bus stations, construction sites, train stations, marinas predominantly accessed by diesel-powered vessels, and distribution hubs using diesel truck vehicles. From a population exposure point of view, air quality in a street canyon is of major importance, since the highest pollution levels and the larger targets of impact are often concentrated in this kind of setting. The so-called canyon effect results in greater health complications [12] see Fig. 1. DPM from mobile sources (buses) have a greater potential for human exposure (per g of DPM emissions) compared to combustion particulates emitted from point sources [13].
Information collected from the City Brisbane Council - in charge of the transportation system within the inner and outer Brisbane area - state that diesel buses were introduced in 1982 and many of them are still in service till the present time. This pool of buses is one of the oldest fleets in operation across Australia. A number of Compressed Natural Gas (CNG) buses were introduced only since the year 2000.
Experimental Techniques and Methods
Topography and Meteorology of the City of Brisbane
The city of Brisbane with a population of approximately 1.3 million lies at 27° 28′ latitude and 153° longitude near the mouth of the Brisbane River. Its topographical area is moderately complex and surrounded by a mountain range. Wind patterns in the region are governed by synoptic flows, which are most often from the south-east, and a period of strong westerly flows lasting for 1 or 2 months in winter. There are occasions in which infrequent synoptic flows result in gradient winds from the northwest. Hence, these light synoptic northwesterly winds combined with the overnight southwest drainage flow delay the onset of the sea breeze [10]. These conditions facilitate recirculation of urban emissions (including photochemical smog events) and contribute to the observed higher background particle load as detected during platform measurements.
Sampling Site Location
In June 1995 a network of five Busway corridors linking the rail network to improve public transport connectivity across the city of Brisbane was conceived. The idea behind the Busway is based exclusively on bus corridors that run parallel to the express highways. The Woolloongabba Busway station was among the first ones to be built. It was considered for this research project because of its semi-covered and semi-submerged design (about 10 m below the street level) – based on the categories described by Vardoulakis et al, 2003 [14], this busway station resembles a street canyon (see Fig. 1). Both driveways are paneled with walls made of glass and concrete and topped by a hinged roof structure. However, this construction design offers only limited ventilation for the emissions of vehicles to escape or to be properly diluted. Due to the proximity to bus emission sources, the waiting passengers are directly exposed to these pollutants.
Data Gathering
The urban bus-driving modes, especially within bus-stations are characterized by a typical “stop-and-go” cycle. Thus it was assumed that variability in bus frequencies, micro-climatic weather patterns, and inhomogeneous particle distribution along the platform must result in substantial variations in particle concentrations during a typical day. Consequently, a number of parameters had to be analyzed in order to establish a reasonable correlation between bus frequencies and particle exposure. Mesoscale meteorological data were kindly provided by the Queensland Environmental Protection Agency (EPA) which is located in the southern sector of the Woolloongabba district. The meteorological data were processed in 30 minutes interval of time and focused mainly on wind direction and speed for the particular days the platform measurements were performed (from the 7th to the 18th of June 2002). Microscale meteorological data have been gathered on the platform and the background reference site and have been collected with a mobile meteorological station. These sets of data included wind direction, wind speed, temperature and relative humidity. Micro-climatic meteorological data suggest that the East-West-orientation of the Busway station has a channeling effect on forming a vortex and are probably the result of perpendicularly oriented above-ground wind patterns. A manual bus census collected information about the type of bus, their frequencies, and stopping time at the station, and other features like idling and aggressive driving modes. The data were collected from 07:00 am till 19:00 hours for the duration of four days for both platforms in May 2002.
Passenger data collection consisted of arrival and departure times, waiting time at the station, passenger waiting location along the platform, and passenger frequency count. Video surveillance data of passenger movement aided in the correct correlation of total waiting time on the platform with those of the bus census.
Based on this kind of information, the outbound platform was eventually chosen as the main particle concentration sampling location – a decision primarily based on insignificant passenger presence at the inbound platform (passengers left the station immediately once they got off the bus). As a result this study is split into three parts.
Particle Inventory
Here it concentrates on the particle load present per unit volume (cm3) on the platform from which the background concentration at street level is subtracted. Particle concentrations measurements were taken on the outbound platform during the 7th till the 18th of June 2002. A typical sampling day started at 07:00 in the morning and lasted till 19:00 in the evening and was clustered in intervals of 30 minutes each. Thus, about 20 sets consisting of 6 samples (each sample lasting five minutes plus one minute down scan time) were taken throughout a day. Based on the previous census made on passenger, bus frequency and video surveillance tapes, the actual time window used for particle exposure was ultimately restricted to a period between 10:00 and 19:00 hours when a significant number of passengers was present at this platform. The actual particle number concentration was measured in real-time with a Scanning Mobility Particle Sizer (SMPS, TSI, Inc., Minneapolis, MN) Model 3934 for both the outbound platform and the background locations. This model consists of two separate instruments; an Electrostatic Classifier (model 3071A), which utilizes a mobility detection technique by charging the particles to a known charge distribution. Then these particles are classified according to their ability to traverse an electrical field and counted with a Condensation Particle Counter (model 3010). In order to measure low concentrations of exhaust particles from the buses, a particle diameter size window of 13.3 nm till 805 nm with scan times set at 300 seconds along with a monodisperse air flow rate of 0.3 L·min−1 were chosen.
Exposure Assessment
In a subsequent step this varying particle concentration was used to calculate personal exposure as the product of pollutant concentration and the time spent in a specific micro-environment; i.e. the outbound platform. Exposure (E) itself is defined as the average concentration of a toxin multiplied by the time an individual is exposed to that concentration:
where twaiting is the time exposed to DPM in [min] and cparticle the number concentration of DMP in [#/cm3], (see Fig. 2). This approach enables rapid and easy evaluation of the pollutant concentration and subsequently exposure situation to passengers on the platform. As mentioned previously, the low density of waiting individuals at the inbound platform, made exposure evaluation on that side of the station obsolete.
Even though it would be possible to calculate the exposure for each passenger registered during the census, it is not feasible to assign each waiting passenger the same pollutant concentration as microclimatic data may well be different in all of the three spatial dimensions; e.g. a sitting passenger will experience a different exposition than a passenger walking up and down the platform. Furthermore, personal constituents, like total lung capacity, breathing rates, and other physiological parameters vary widely; making exposure calculations based on an individual level an almost impossible task. Thus, for the sake of generality, it is more applicable to operate with averages. In particular, for a given time window, particle concentration averages are used, which is then multiplied by the average time a passenger, was present on the platform. Bus related exposure must be treated in that the background pollutant concentration must be subtracted from the concentration levels measured on the platform. Passenger waiting times are not averaged but calculated for seven consecutive days using the count data obtained from the video passenger census; i.e. as only one set of passenger counts was available covering an entire day, the same set of data was used for each of the seven days platform measurements were made. As passengers have varying waiting times that do not necessarily match scanning times of the SMPS system (preset to 6 mins), the following procedure was applied to assign concentrations scans. An individual waiting for about 3 mins at the platform is already considered to be exposed to aerosol pollutants on the way down to the waiting area. Therefore, the scan prior to the arrival of the passenger, as well as the follow-up scan after his departure, and the scan while at the platform (when waiting time exceeded the 6 min interval) are used to calculate the concentration average for that particular time window. This procedure provides an estimate of the possible exposure that a passenger is subjected to. Over a seven-day sampling period, this results in 2547 individual cases of exposure.
Lifetime Exposure
Ultimately these 2547 distributions are summed up and averaged to obtain a single exposure distribution. Using both the number and mass concentrations, it is possible to determine total particle load and total mass inhaled per unit time spent on the platform. This great enough set of measurements converts the randomly fluctuating pollutant concentration to a passenger-associated time-average. Thus, total exposure consists of an averaged pollutant concentration for an averaged waiting time a hypothetical passenger spends on the platform. Doing so enables extrapolation of a lifetime exposure of a working person using this platform to commute.
Results and Discussions
The use of passenger-census data and bus frequency data were correlated with the particle inventory data obtained at the outbound platform. The influence of factors such as wind speed and direction were considered in the propagation, dispersion, or trapping of bus pollutants inside the Busway station. An automated series of routine calculations were created (Origin MicroCal Scripts) to analyze the passengers’ waiting time data, the particle data from the SMPS system and the assessment of exposure concentrations due to buses at the platform. From the bus census made in this study, it is known that the bulk of vehicles frequenting the Woolloongabba Busway station are diesel-powered buses. In fact, during the observed period, the average vehicle number grouped in fuel classes visiting this station on an hourly basis consisted of 77.92 for diesel powered buses, 14.75 for compressed natural gas (CNG) buses and an insignificant amount of 1.75 for petrol driven pickup-type service vehicles.
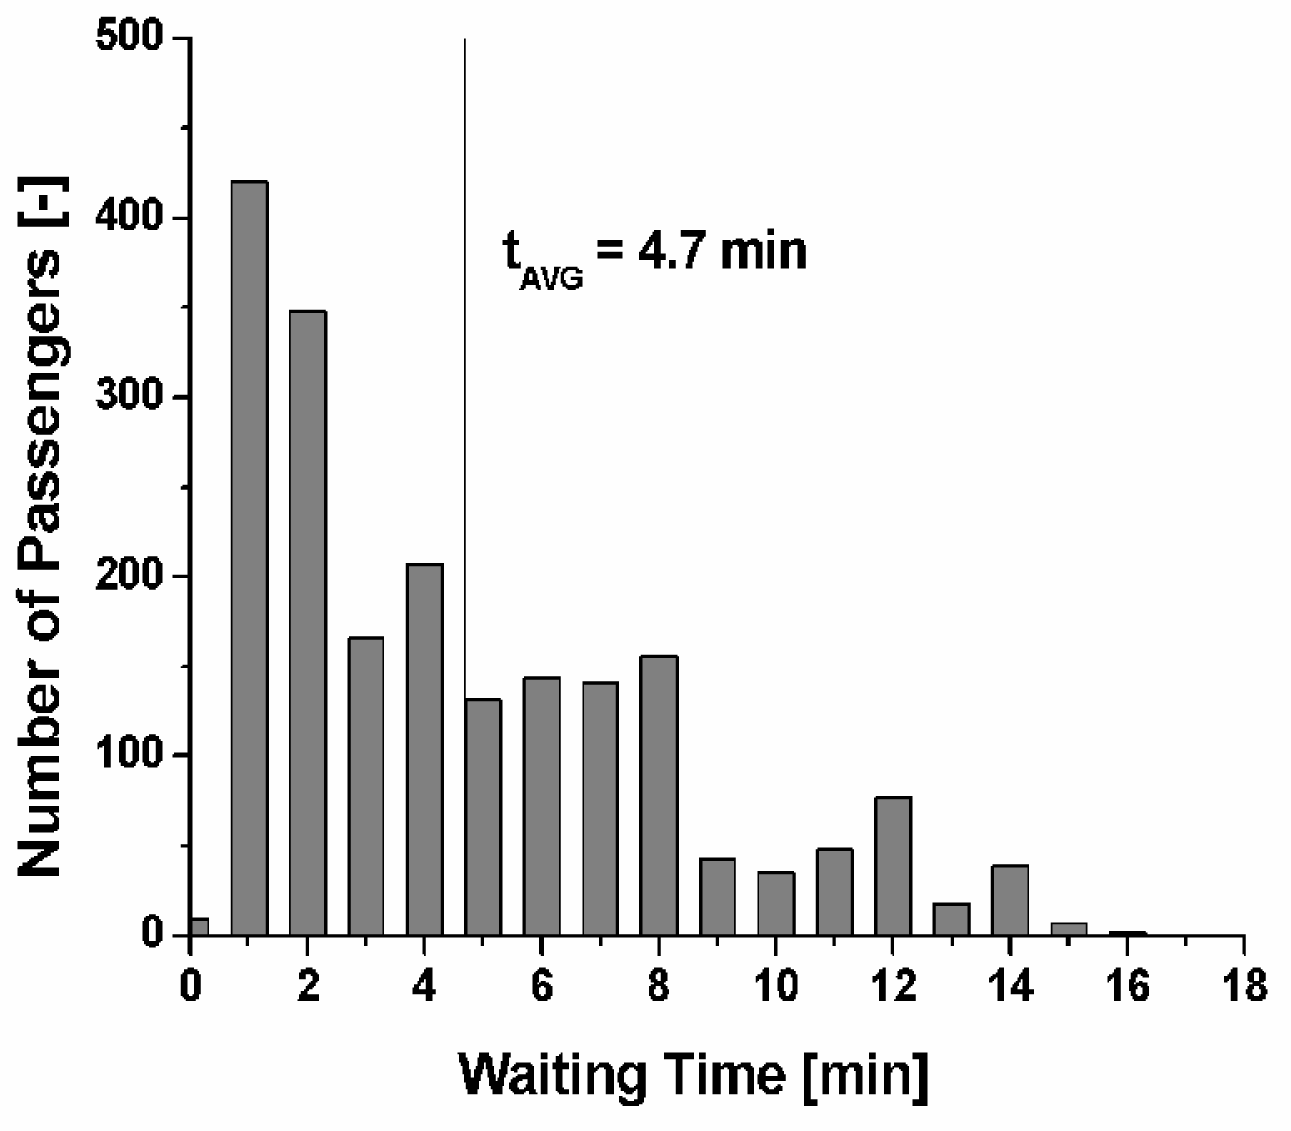
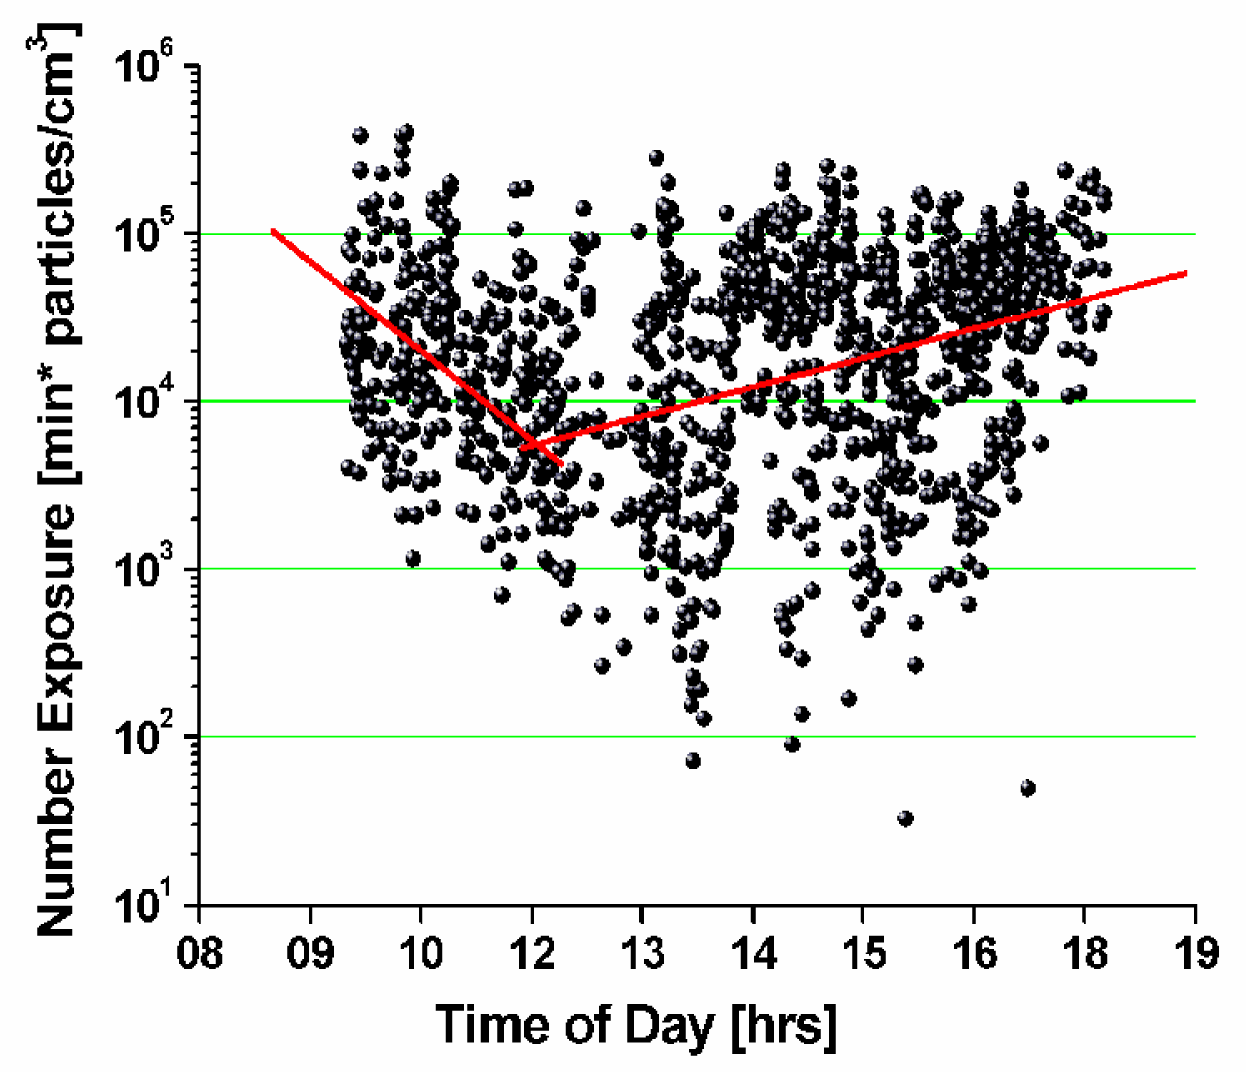
The histogram in Figure 2 shows an average time a passenger spent on the platform of 4.7 minutes (there are a few passengers that spent a maximum time of 17 minutes or more waiting for their service). Particle number exposure during these 4.7 minutes gave an average value of 14.1×10³ particles per cm3, which, based on a standard density of 1g/cm3[5], translates to a mass concentration of 1.64 pg·cm−3. Some passengers’ exposure to particles increase as they waited longer. As can be seen in Figure 3, the particle concentration (7-working day average) exhibits a V-shaped pattern; being higher in the early morning rush hour, it decreases during the midday hours and regains intensity during the afternoon-evening rush hour.
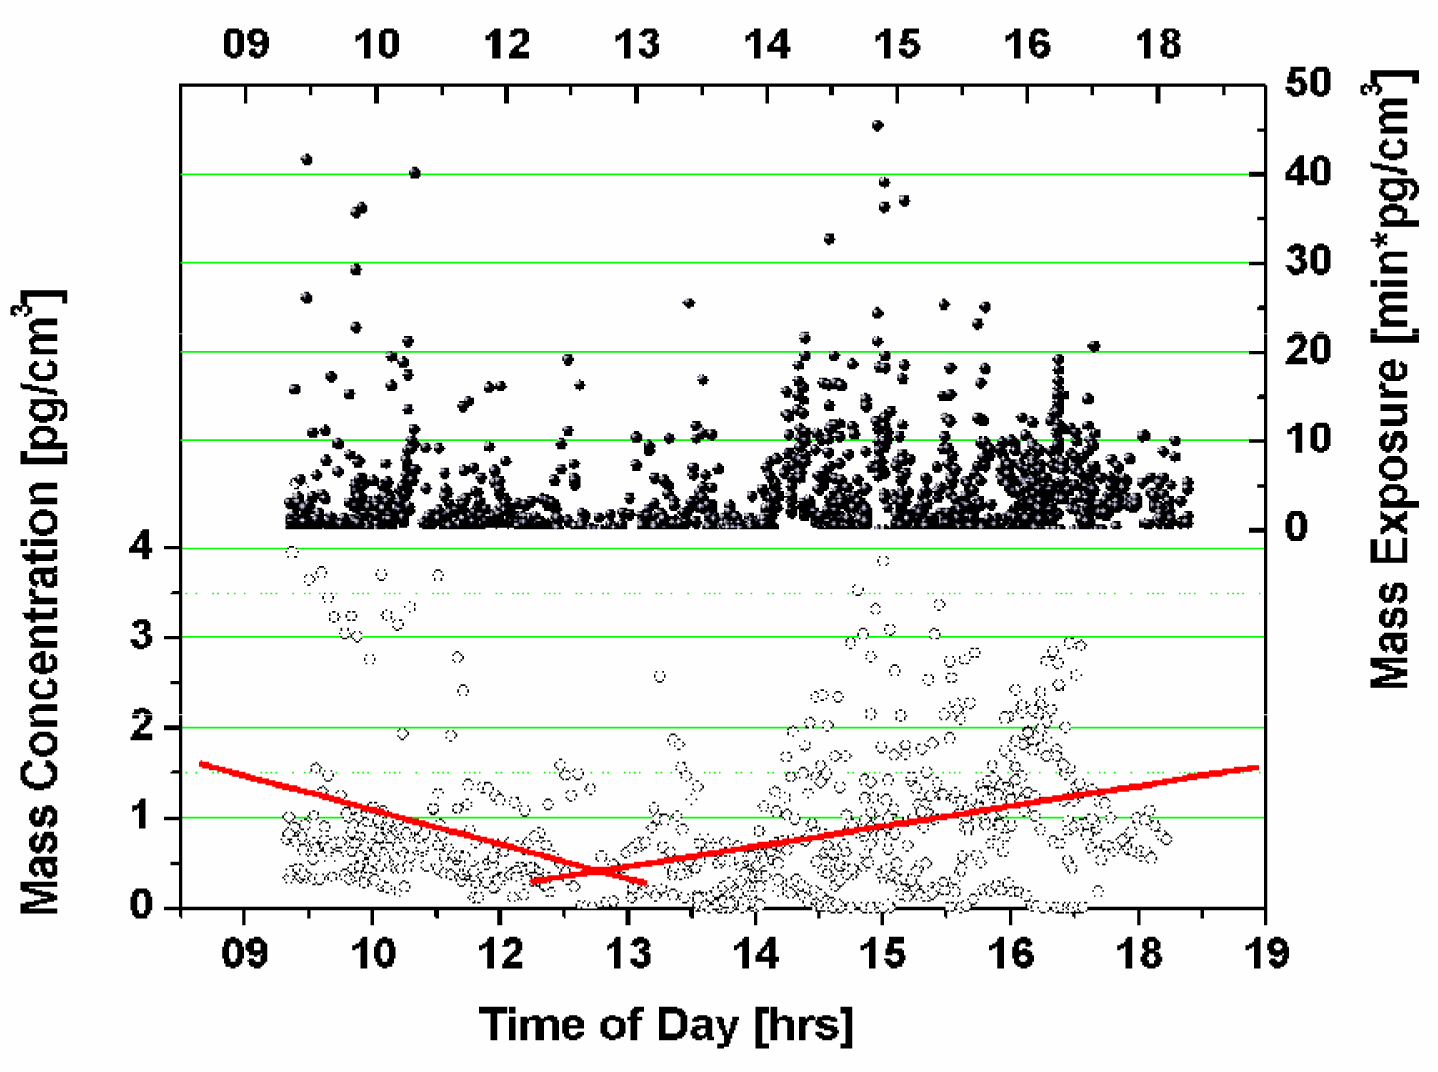
The corresponding mass averages are depicted in the lower part of Figure 4; both the particle mass concentration and the particle mass exposure emphasize a similar trend. Knowing from the passenger census data that passenger frequency at the outbound platform peaks in the afternoon hours, which coincide with the closing hours of the teaching day from the nearby high school, both school children and adults alike are subject to increased particle concentrations at the outbound platform. The increasing number of buses arriving at the station during this time of the day corresponds to increasing passenger demand.
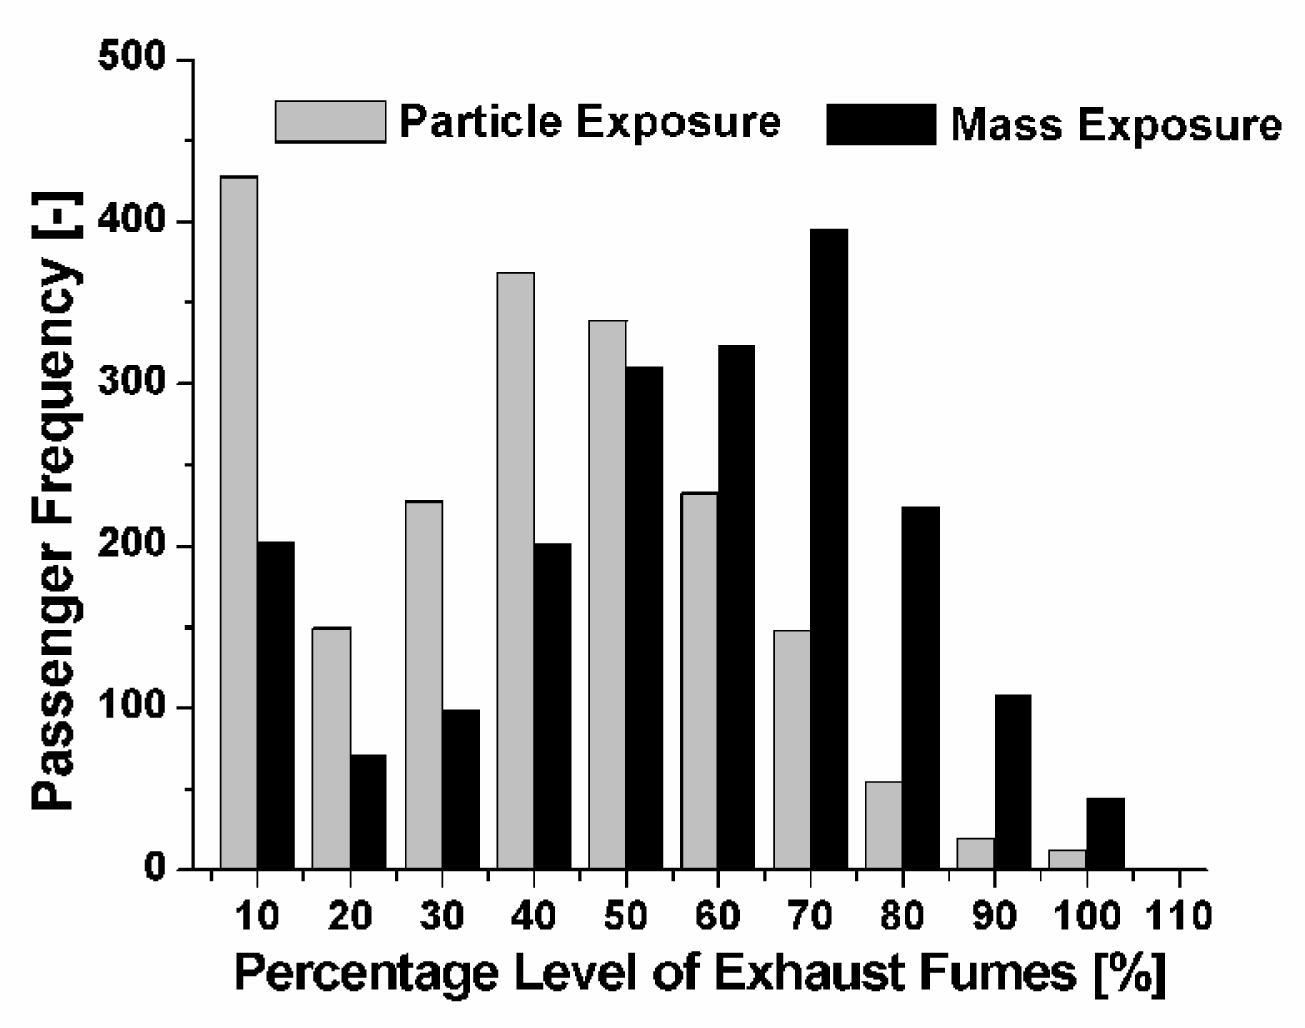
Based on the same set of data and correlating them with the passengers present at any given time (between 10:00 and 19:00 hours), it is possible to plot a frequency diagram for all 2547 cases (as shown in Figure 5). Since most passengers only spend approximately 5 minutes on the platform waiting for their service, particle number exposure originating from bus fumes dominate the 10 and 40 to 60% range; i.e. about 425 passengers are exposed exhaust of which only 10% is bus related, whereas 212–375 passengers are exposed to exhaust of which 40 to 60% is bus related. This changes dramatically when considering the particle mass exposure. Here, most passengers are exposed to about 50 to 80% of exhaust fumes originating from buses.
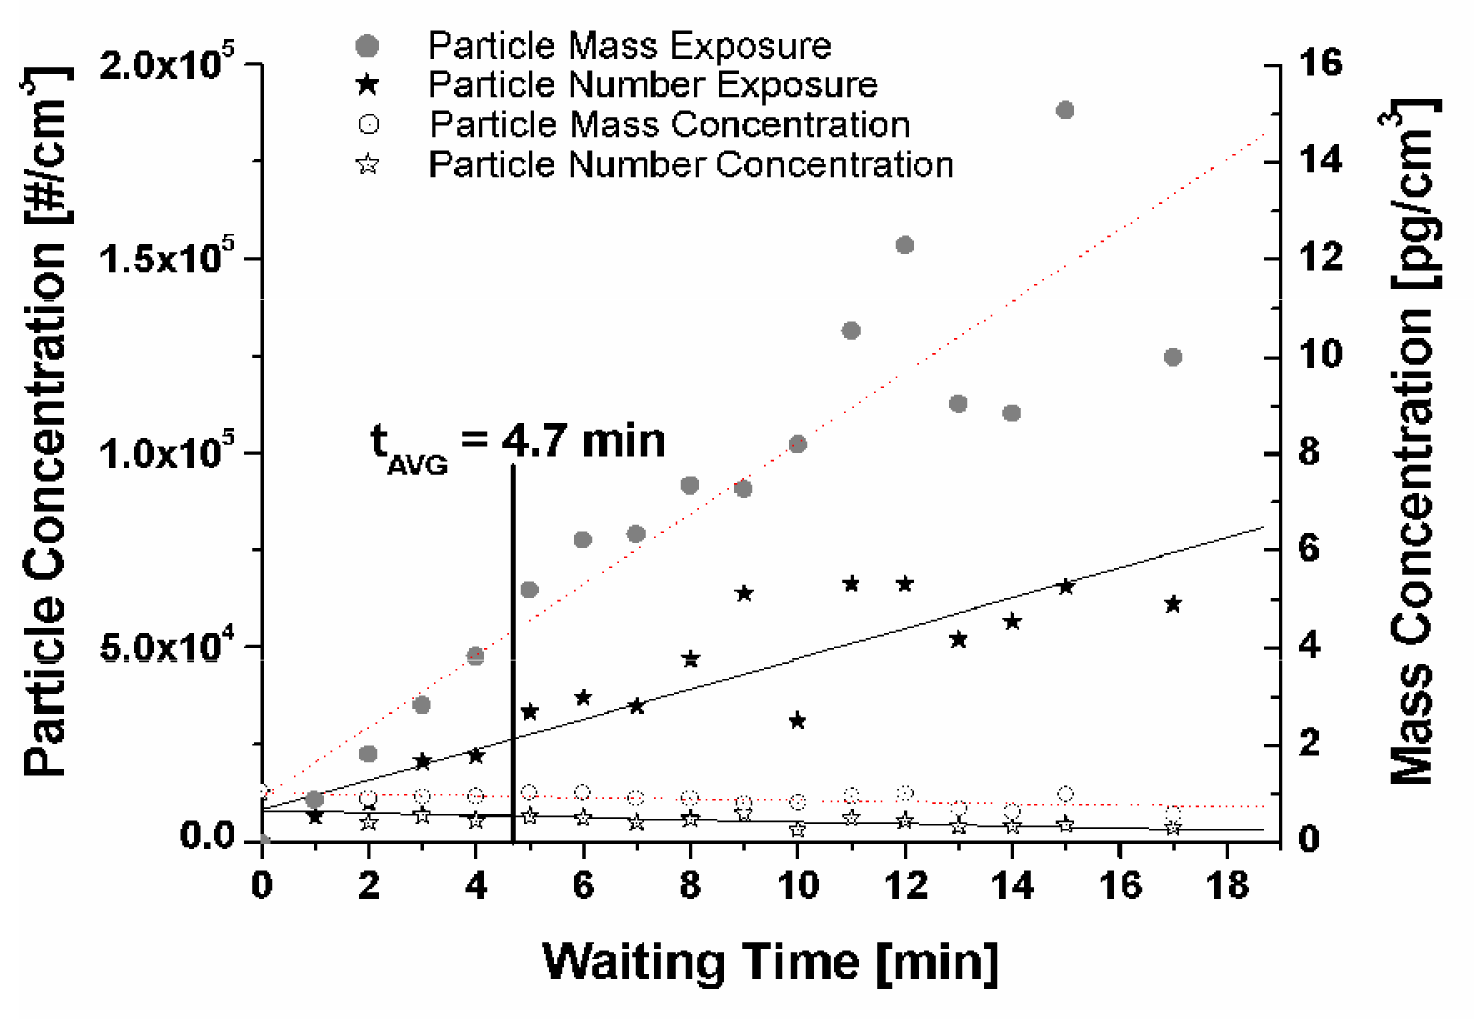
Using a different presentation (as shown in Figure 6) in which the abscissa depicts the passenger waiting time, the increasing exposure versus extended waiting time becomes more evident.
Finally, total occupational exposure of particle mass can be estimated by using the 4.7 minute average particle mass exposure. The dose, which determines the effect on the human body, is defined as the quantity of an active agent taken in or absorbed at any one time (given in mass of substance related to the unit mass of the human body; e.g. ng/kg bodyweight). To estimate an environmental exposure that is equivalent to a lifetime exposure, the fraction of time a passenger is exposed to the exhaust aerosol is calculated as the amount of air breathed in multiplied by the typical amount of time spent at the platform. It is calculated for a 70-year lifetime environmental inhalation exposure [13]:
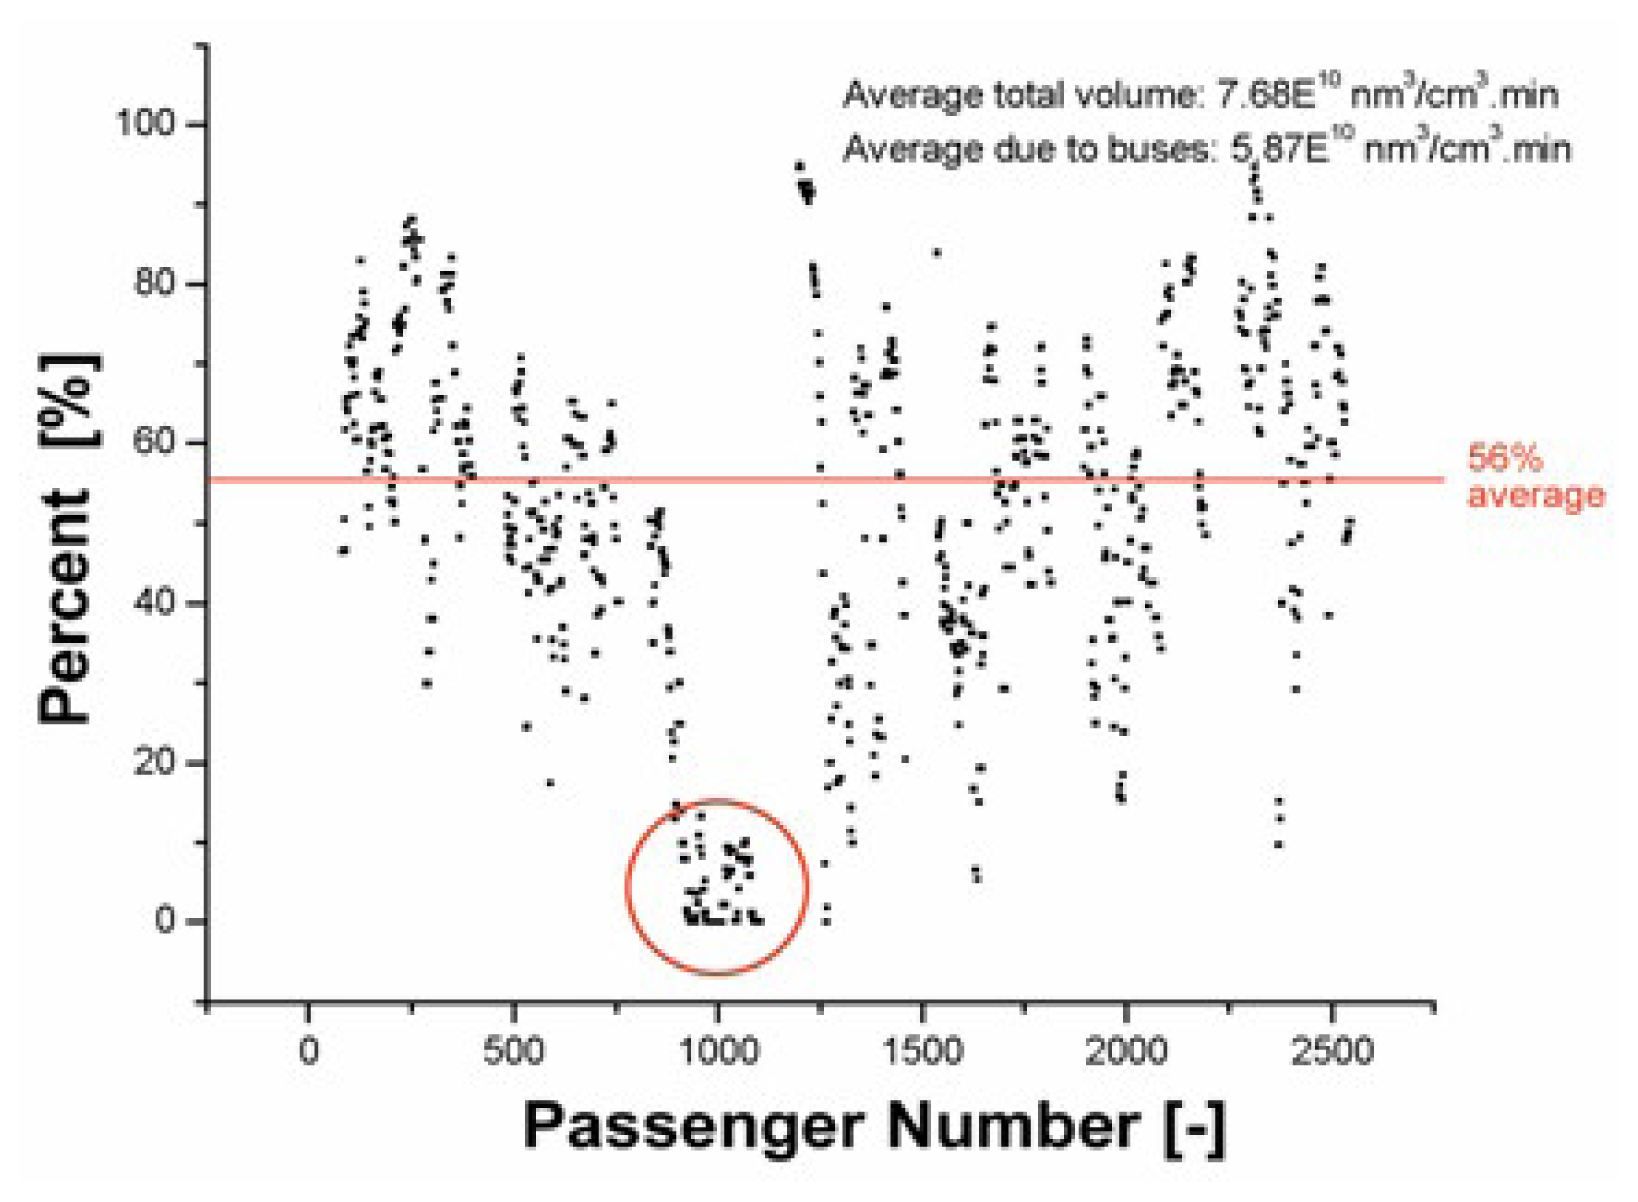
Where cVavg is the average particle concentration (here 1.64×10¹⁰ nm3·cm−3·day−1) and tAvg the average time spent on the platform (here 4.7 min). The respiratory breathing rate (QBR) is estimated to be 15 L/min or 15·103 cm3/min, and the exhaust particle unit density (ρExhaust) of 1 g/cm3. The observed exhaust fraction (ɛ) due to buses is calculated to be 0.56 (see Fig. 7). Due to the variations of the inhaled particle diameters (ranging from 13 to 800 nm), it corresponds to a mass median diameter of 156 nm, the pulmonary deposition efficiency (ηdepo) is 0.2 [8]. The working days (dwork/yr) in a year is commonly 260 days; and finally the lifetime working period (yrLT) is assigned a numeric value of 30 years.
Based on these parameters a theoretical daily aerosol mass exposure in the order of 13.0 ng for time-interval of 4.7 min is obtained. Applying a working week of 5 days, it results in an exposure of 64.8 ng. Extrapolating this value to a monthly interval consisting of 20 working days, it results in an exposition of 0.26 μg. An annual exposure is calculated to be around μ3.37 g based on 260 working days. Finally, for a 30-year long career, a lifetime exposure of about 0.10 mg deposited aerosol mass can be estimated.
Wind speed has been broadly documented as one of the factors that lead to a reduction in ambient concentrations of pollution emissions. The problem is quantification, and in particular to what extent a given wind speed will change particle concentration on the platform. It was noted that wind direction and wind speed at the Busway station varied over the seven-day period (see Fig. 7). Therefore, it is concluded that this variable wind patterns had an effect on the variable particle concentration that were measured at the Woolloongabba Busway station.
Conclusions
This study has shown that significant particle exposure concentrations to humans are present at the platform and are most likely to be found in similar settings for future studies of this kind. The method used has the advantages of being very simple, comprehensive and cost effective. Indeed, the design of this study was so straightforward that it was possible not only to raise issues concerning exposure of diesel exhaust, but also to propose and implement artificial ventilation. This study has shown that an average waiting time of 4.7 minutes at the station along with an average particle concentration of 14.1×10³ particles per cm3, converts to a mass concentration of 1.64 pg·cm−3. Since a significant amount (56%) of the particle mass exposure on the platform originates from bus exhaust fumes, it can be concluded that adverse health effects for long-term exposure cannot be excluded. Because the major portions of exhaust particles are emitted during acceleration, those individuals in the vicinity are highly exposed [13]. Similarly, OEHHA [11] considers that near-sources particulate emissions represent an increased potential health risk in exposed individuals. This is of particular importance, as exposure experiments with exhaust fumes have been shown to cause cancer in laboratory animals [6]. The canyon-like setting, in which the bus station is embedded, prevents dilution and dispersion of exhaust gases and particles. As buses contribute a large fraction in overall particle load to the waiting passengers, we recommend that buses do not wait at the platform edge for long periods of time with the engine running in idling mode, especially during shift-changes, e.g. in such cases, we observed that drivers kept their engines running for several minutes. The results obtained from this study should have an impact in the following ways: one, on a local scale, to assist government and city planners in the design and construction of future Busway stations in order to minimize stressors such as sound (subject for future publication) and particle concentration emitted and produced by the buses; two, on a global scale, to assist in the planning of future cities, urban traffic control management, in the planning, implementation, extension, and improvement of the public transportation system, and the enforcement of more research funneled to cleaner air; finally, to promote the use of alternative fuels that are environmentally safe and clean.
Figure 1.
Identical pollutant dispersion in a street canyon (modified [14]). The upper part of this picture shows strong wind conditions, which are capable to provide adequate ventilation and to remove air pollutants coming from the buses. The lower part depicts the most likely conditions in absence of wind or low ventilation favoring particle exposure.

Figure 2.
Histogram revealing waiting time frequencies for 2547 cases (passengers) present on a typical working day at the platform. The overall average for the entire pool of passengers counted amounts to 4.7 minutes.
Figure 2.
Histogram revealing waiting time frequencies for 2547 cases (passengers) present on a typical working day at the platform. The overall average for the entire pool of passengers counted amounts to 4.7 minutes.

Figure 3.
This 7-working day summary shows an increase of particle number exposure during the early peak hours in the mornings, a depression during midday hours and an increase in the late afternoon. The superimposed trend lines group together the morning measurements and the afternoon measurements, which are separated by the background measurement performed at noon

Figure 4.
Diurnal particle mass concentration below and the particle mass exposure above. Using a standard exhaust aerosol conversion density of 1g/cm3, it is possible to convert particle concentration data into mass exposure data.
Figure 4.
Diurnal particle mass concentration below and the particle mass exposure above. Using a standard exhaust aerosol conversion density of 1g/cm3, it is possible to convert particle concentration data into mass exposure data.

Figure 5.
This histogram representation reveals the number of passengers exposed partially or entirely to bus fumes. The dark-colored section highlights particle number concentration, whereas the light-shaded portion the corresponding mass exposure concentration.
Figure 5.
This histogram representation reveals the number of passengers exposed partially or entirely to bus fumes. The dark-colored section highlights particle number concentration, whereas the light-shaded portion the corresponding mass exposure concentration.

Figure 6.
Particle and mass concentrations as fractions of the passengers’ waiting times. Both particle and mass concentrations decline with time, whereas particle and mass exposure increase as passengers wait on the platform.
Figure 6.
Particle and mass concentrations as fractions of the passengers’ waiting times. Both particle and mass concentrations decline with time, whereas particle and mass exposure increase as passengers wait on the platform.

Figure 7.
Exposure originating from bus fumes by particle volume concentration [nm3/cm3 min], which corresponds to mass (see text). The circled area indicates the flushing effect when longitudinal winds blow through the Busway Canyon (red circle).
Figure 7.
Exposure originating from bus fumes by particle volume concentration [nm3/cm3 min], which corresponds to mass (see text). The circled area indicates the flushing effect when longitudinal winds blow through the Busway Canyon (red circle).

Acknowledgements
The authors wish to thank the Center Operations at Woolloongabba Busway Station and the Queensland Environmental Protection Agency for their kind assistance.
References
- AKPF. Arbeitskreis Partikel-Filter-Systemhersteller. Exhaust Motor Particles: Lexikon Verbrennungsmotor-Partikel; Vorschlag TTM, 2000. http://www.akpf.org/pub/lexicon10-3-2000.pdf.
- Boffetta, P.; Dosemeci, M.; Gridley, G.; Silverman, D.; Bath, H; Moradi, T. Occupational exposure to diesel engine emissions and risk of cancer in Swedish men and women, Cancer Causes and Control. Lung Cancer 2001, 12, 365–374. [Google Scholar]
- CaEPA. California Environmental Protection Agency. Air Resources Board, Office of Environmental Health Hazard Assessment. Executive Summary for the Proposed Identification of Diesel Exhaust as a Toxic Air Contaminant. 1998. http://www.arb.ca.gov/toxics/dieseltac/staffrpt.pdf.
- CSE, Center for Science and Environment, The smokescreen of lies, Myths and facts about CNG; Right to Clean Air Campaign Team: New Delhi, 2001; Volume 11, p. 12.
- Dieselnet Ecopoint Inc. Diesel Exhaust Particle Size, Revision. 2002, 11. http://www.dieselnet.com/tech/dpm_size.html.
- Enya, T.; Suzuki, H.; Watanabe, T.; Hirayama, T.; Hisamatsu, B. 3-Nitrobenzanthrone, a powerful bacterial mutagen and suspected carcinogen found in diesel exhaust and airborne particles. Environmental Science and Technology 1997, 31, 2772–2776. [Google Scholar]
- IARC. International Agency for Research on Cancer, Diesel and gasoline engine exhaust, IARC Monographs on the Evaluation of Carcinogenic Risks to Humans. In Diesel and Gasoline Engine Exhaust and Some Nitroarenes; Lyon, 1989; Volume 46, pp. 41–185.
- Hofmann, W.; Koblinger, L. Monte Carlo modeling of aerosol deposition in human lungs. Part II: Deposition fractions and their sensitivity to parameter variations. Journal of Aerosol Science 1990, 21, 675–688. [Google Scholar]
- Majewski, W. A. DieselNet Technology Guide: Diesel Particulate Matter Revision. 2002, 11a. http://www.dieselnet.com/tech/dpm.html.
- Morawska, L.; Vishvakarman, D.; Mengersen, K.; Stephen, T. Spatial variation of airborne pollutant concentrations in Brisbane, Australia and its potential impact on population exposure assessment. Atmospheric Environment 2002, 36, 3545–3555. [Google Scholar]
- OEHHA. Office of Environmental Health Hazard Assessment. Executive Summary for the “Proposed Identification of Diesel Exhaust, as a Toxic Air Contaminant”; USU: CA, 1998. http://www.oehha.ca.gov/air/toxic_contaminants/html/Diesel%20Exhaust.htm.
- Spadaro, J.; Rabl, A. Damage costs due to automotive air pollution and the influence of street canyons. Atmospheric Environment 2001, 35, 4763–4775. [Google Scholar]
- USEPA. United States Environmental Protection Agency, Health Assessment Document for Diesel Engine Exhaust; EPA/600/8-90/057F; USA, 2002.
- Vardoulakis, S.; Fisher, B.; Pericleous, K.; Flesca, N. Modeling air quality in street canyons: a review. Atmospheric Environment 2003, 37, 155–182. [Google Scholar]
© 2006 MDPI. All rights reserved.
Share and Cite
MDPI and ACS Style
Yip, M.; Madl, P.; Wiegand, A.; Hofmann, W. Exposure Assessment of Diesel Bus Emissions. Int. J. Environ. Res. Public Health 2006, 3, 309-315. https://doi.org/10.3390/ijerph2006030038
AMA Style
Yip M, Madl P, Wiegand A, Hofmann W. Exposure Assessment of Diesel Bus Emissions. International Journal of Environmental Research and Public Health. 2006; 3(4):309-315. https://doi.org/10.3390/ijerph2006030038
Chicago/Turabian StyleYip, Maricela, Pierre Madl, Aaron Wiegand, and Werner Hofmann. 2006. "Exposure Assessment of Diesel Bus Emissions" International Journal of Environmental Research and Public Health 3, no. 4: 309-315. https://doi.org/10.3390/ijerph2006030038