Introduction
The urban environment quality is deteriorating day by day with the largest cities reaching saturation points and unable to cope with the increasing pressure on their infrastructure. Hyderabad, the capital city of Andhra Pradesh, which lies between 78° 22′ 30″ and 78° 32′ 30″ East longitude and between 17°18′30″ and 17°28′ 30″ North latitude, is facing a rapid change in the environmental quality. Rapid urbanization brings with it many problems as it places huge demands on land, water, housing, transport, health, education etc [
1]. Environmental pollution has reached alarming levels in the last 5–6 years mainly due to industries and automobiles. The city witnessed an increase in population from 0.448 million in 1901 – 1.429 million in 1961, between 1981 and 1991 the population went upto 4.34 million and the growth rate so far is 67.04% [
2]. As per the population estimates, Hyderabad is likely to become a mega city with about 7.5 million population by 2011. This rising population density will continue to have an impact on the quality and quantity of local water resources.
Fresh water being one of the basic necessities for sustenance of life, the human race through the ages has striven to locate and develop it. Water, a vital source of life in its natural state is free from pollution but when man tampers the water body it loses its natural conditions. Ground water has become an essential resource over the past few decades due to the increase in its usage for drinking, irrigation and industrial uses etc. The quality of ground water is equally important as that of quantity. Remote sensing and GIS are effective tools for water quality mapping and land cover mapping essential for monitoring, modeling and environmental change detection [
3]. GIS can be a powerful tool for developing solutions for water resources problems for assessing water quality, determining water availability, preventing flooding, understanding the natural environment, and managing water resources on a local or regional scale [
4]. Keeping this in view, we have Integrated Remote Sensing, GIS and field studies for the evaluation of the impacts of land use changes on the ground water quality of zone-V under MCH. There is an urgent need to have a first hand asesment of the prospective ground water quality in MCH, especially in view of the latest proposal in January 2007 to implement policy of greater Hyderabad, The current asessment of water quality in MCH Zone - V is an uptodate beginning in that direction.
Study Area
The total area of Municipal Corporation of Hyderabad (MCH) is 179 Km2 and divided into 11 planning zones wherein the present study area (Zone-V) consists of 31.68 Km2 out of the total MCH area and is situated in between 78°25′22″ East Longitude and 17°22′48″ North Latitude. The climate is fairly equitable with a daily mean maximum temperature varying from a minimum of 11.6° C during the month of December to a maximum of 40.56° C in April. Hyderabad gets its rainfall mainly from southwest monsoon with the total annual average rainfall of about 73.55 cm. It is located at an altitude of 570m above mean sea level.
Methodology
Data Used
Different data products required for the study include the 56K/7 and 56K/11 toposheets which are obtained from Survey of India (1:50,000) and fused data of IRS – 1D PAN and LISS-III satellite imagery of path 100 and row 60 from National Remote Sensing Agency (NRSA), Hyderabad.
Database Creation
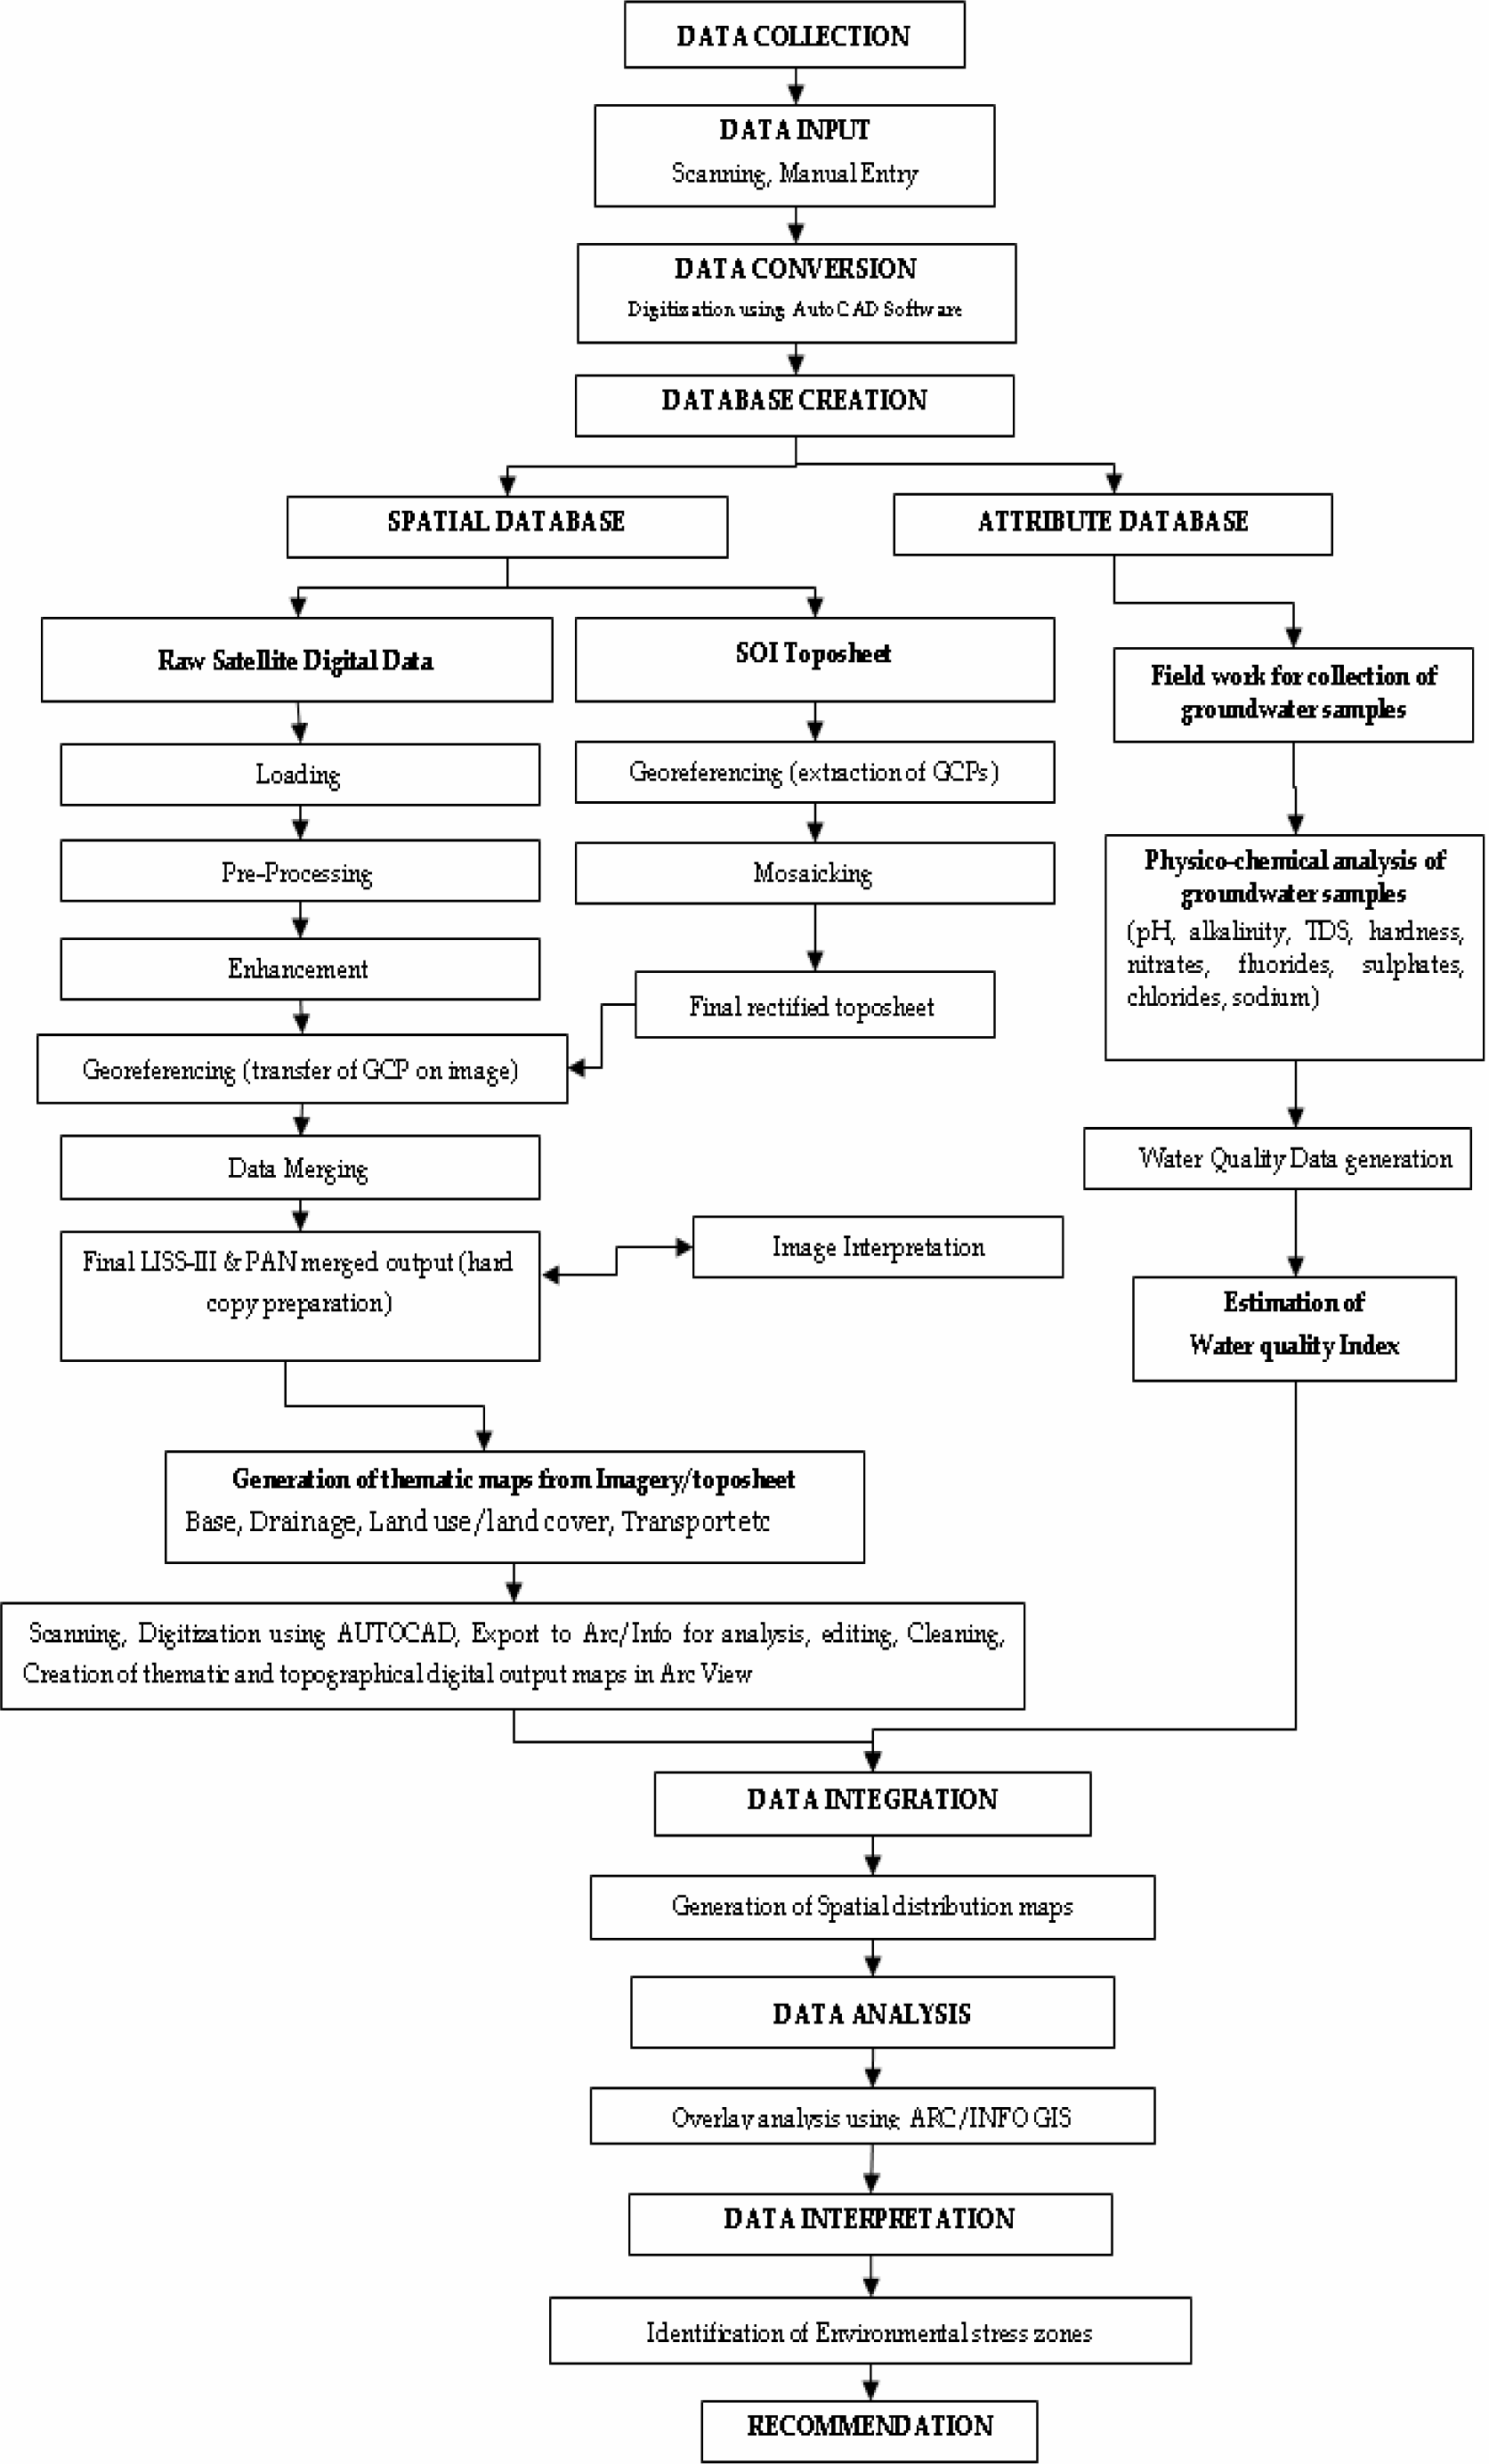
IRS-ID PAN and LISS-III satellite imageries are georeferenced using the ground control points with SOI toposheets as a reference and further merged to obtain a fused, high resolution (5.8m of PAN) and colored (R,G,B bands of LISS-III) output in EASI/PACE v6.3 Image processing software. The study area is then delineated from the fused data based on the latitude and longitude values and a final hard copy output prepared which is further interpreted visually for the generation of thematic maps. These thematic maps (Raster data) are converted to vector format by scanning using an A0-Flatbed Deskjet scanner and digitized in AUTOCAD 2000. The map is further edited in ARC/INFO v3.5.1 and final hardcopy output is prepared using ARC/VIEW v3.1 GIS software. The methodology adopted for creation of database is given in
Fig. 1.
Spatial database
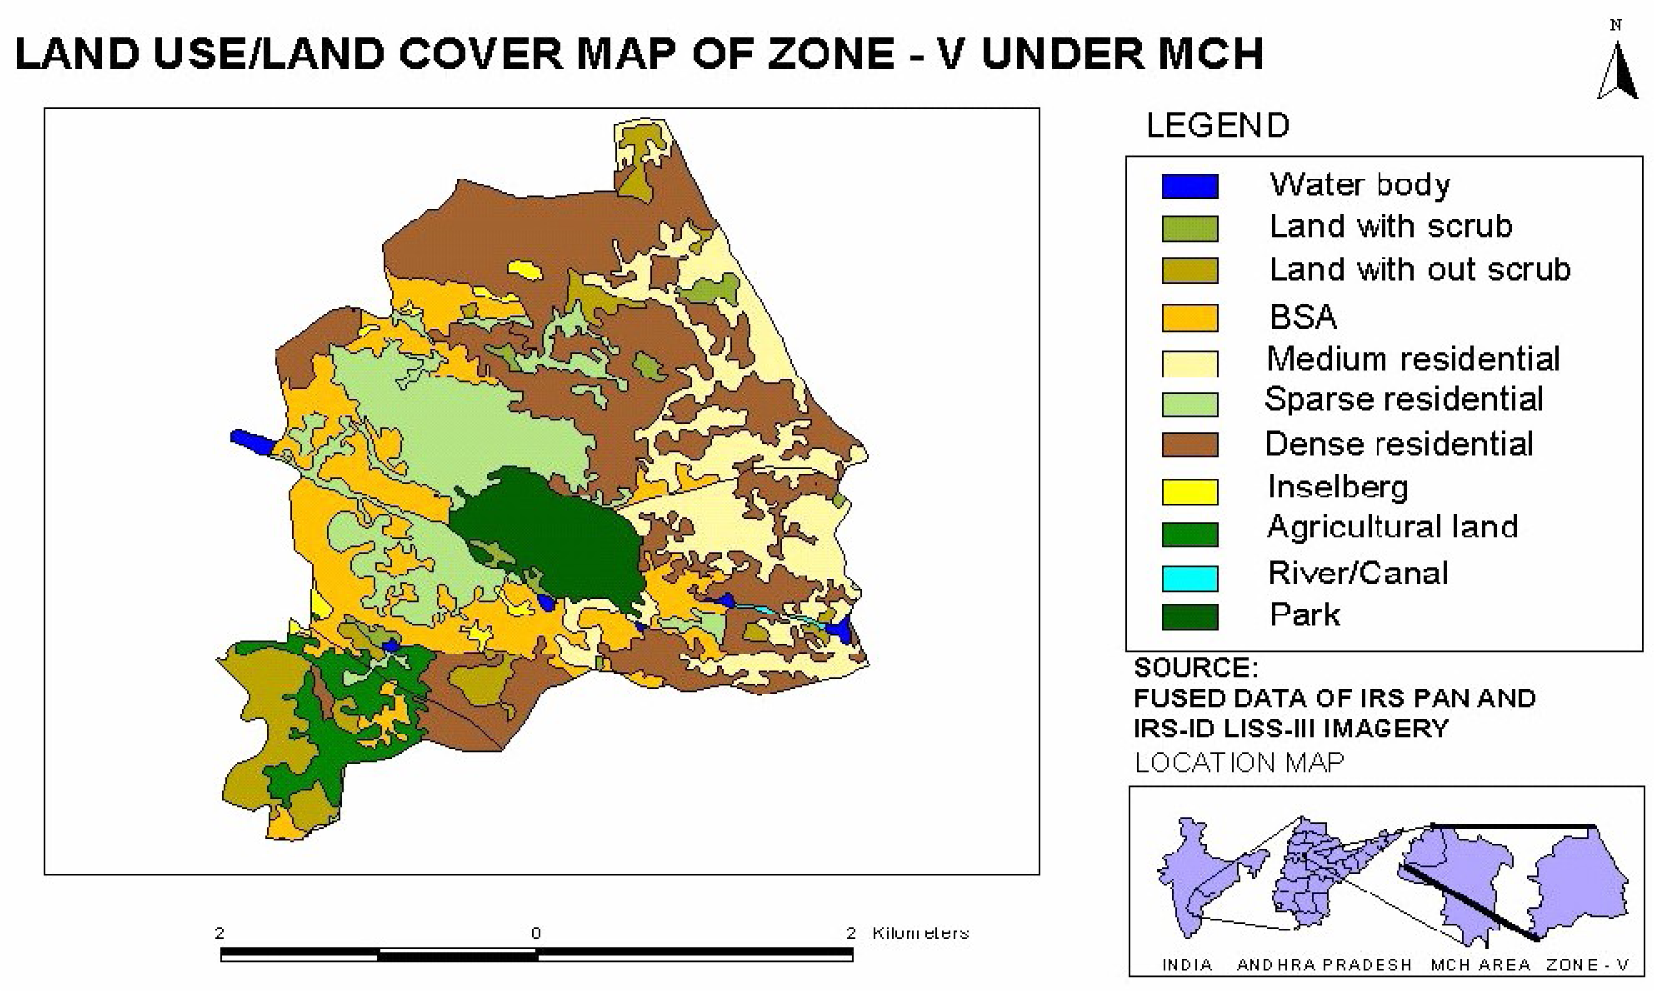
Thematic maps like base map and drainage network maps are prepared from the SOI toposheets on 1:50,000 scale using AutoCAD and Arc/Info GIS software to obtain a baseline data. All the maps are scanned and digitized to generate a digital output. Land use/Land cover map of the study area was prepared using visual interpretation technique from the fused satellite imagery (IRS-ID PAN + LISS-III) and SOI toposheets along with ground truth analysis.
Attribute database
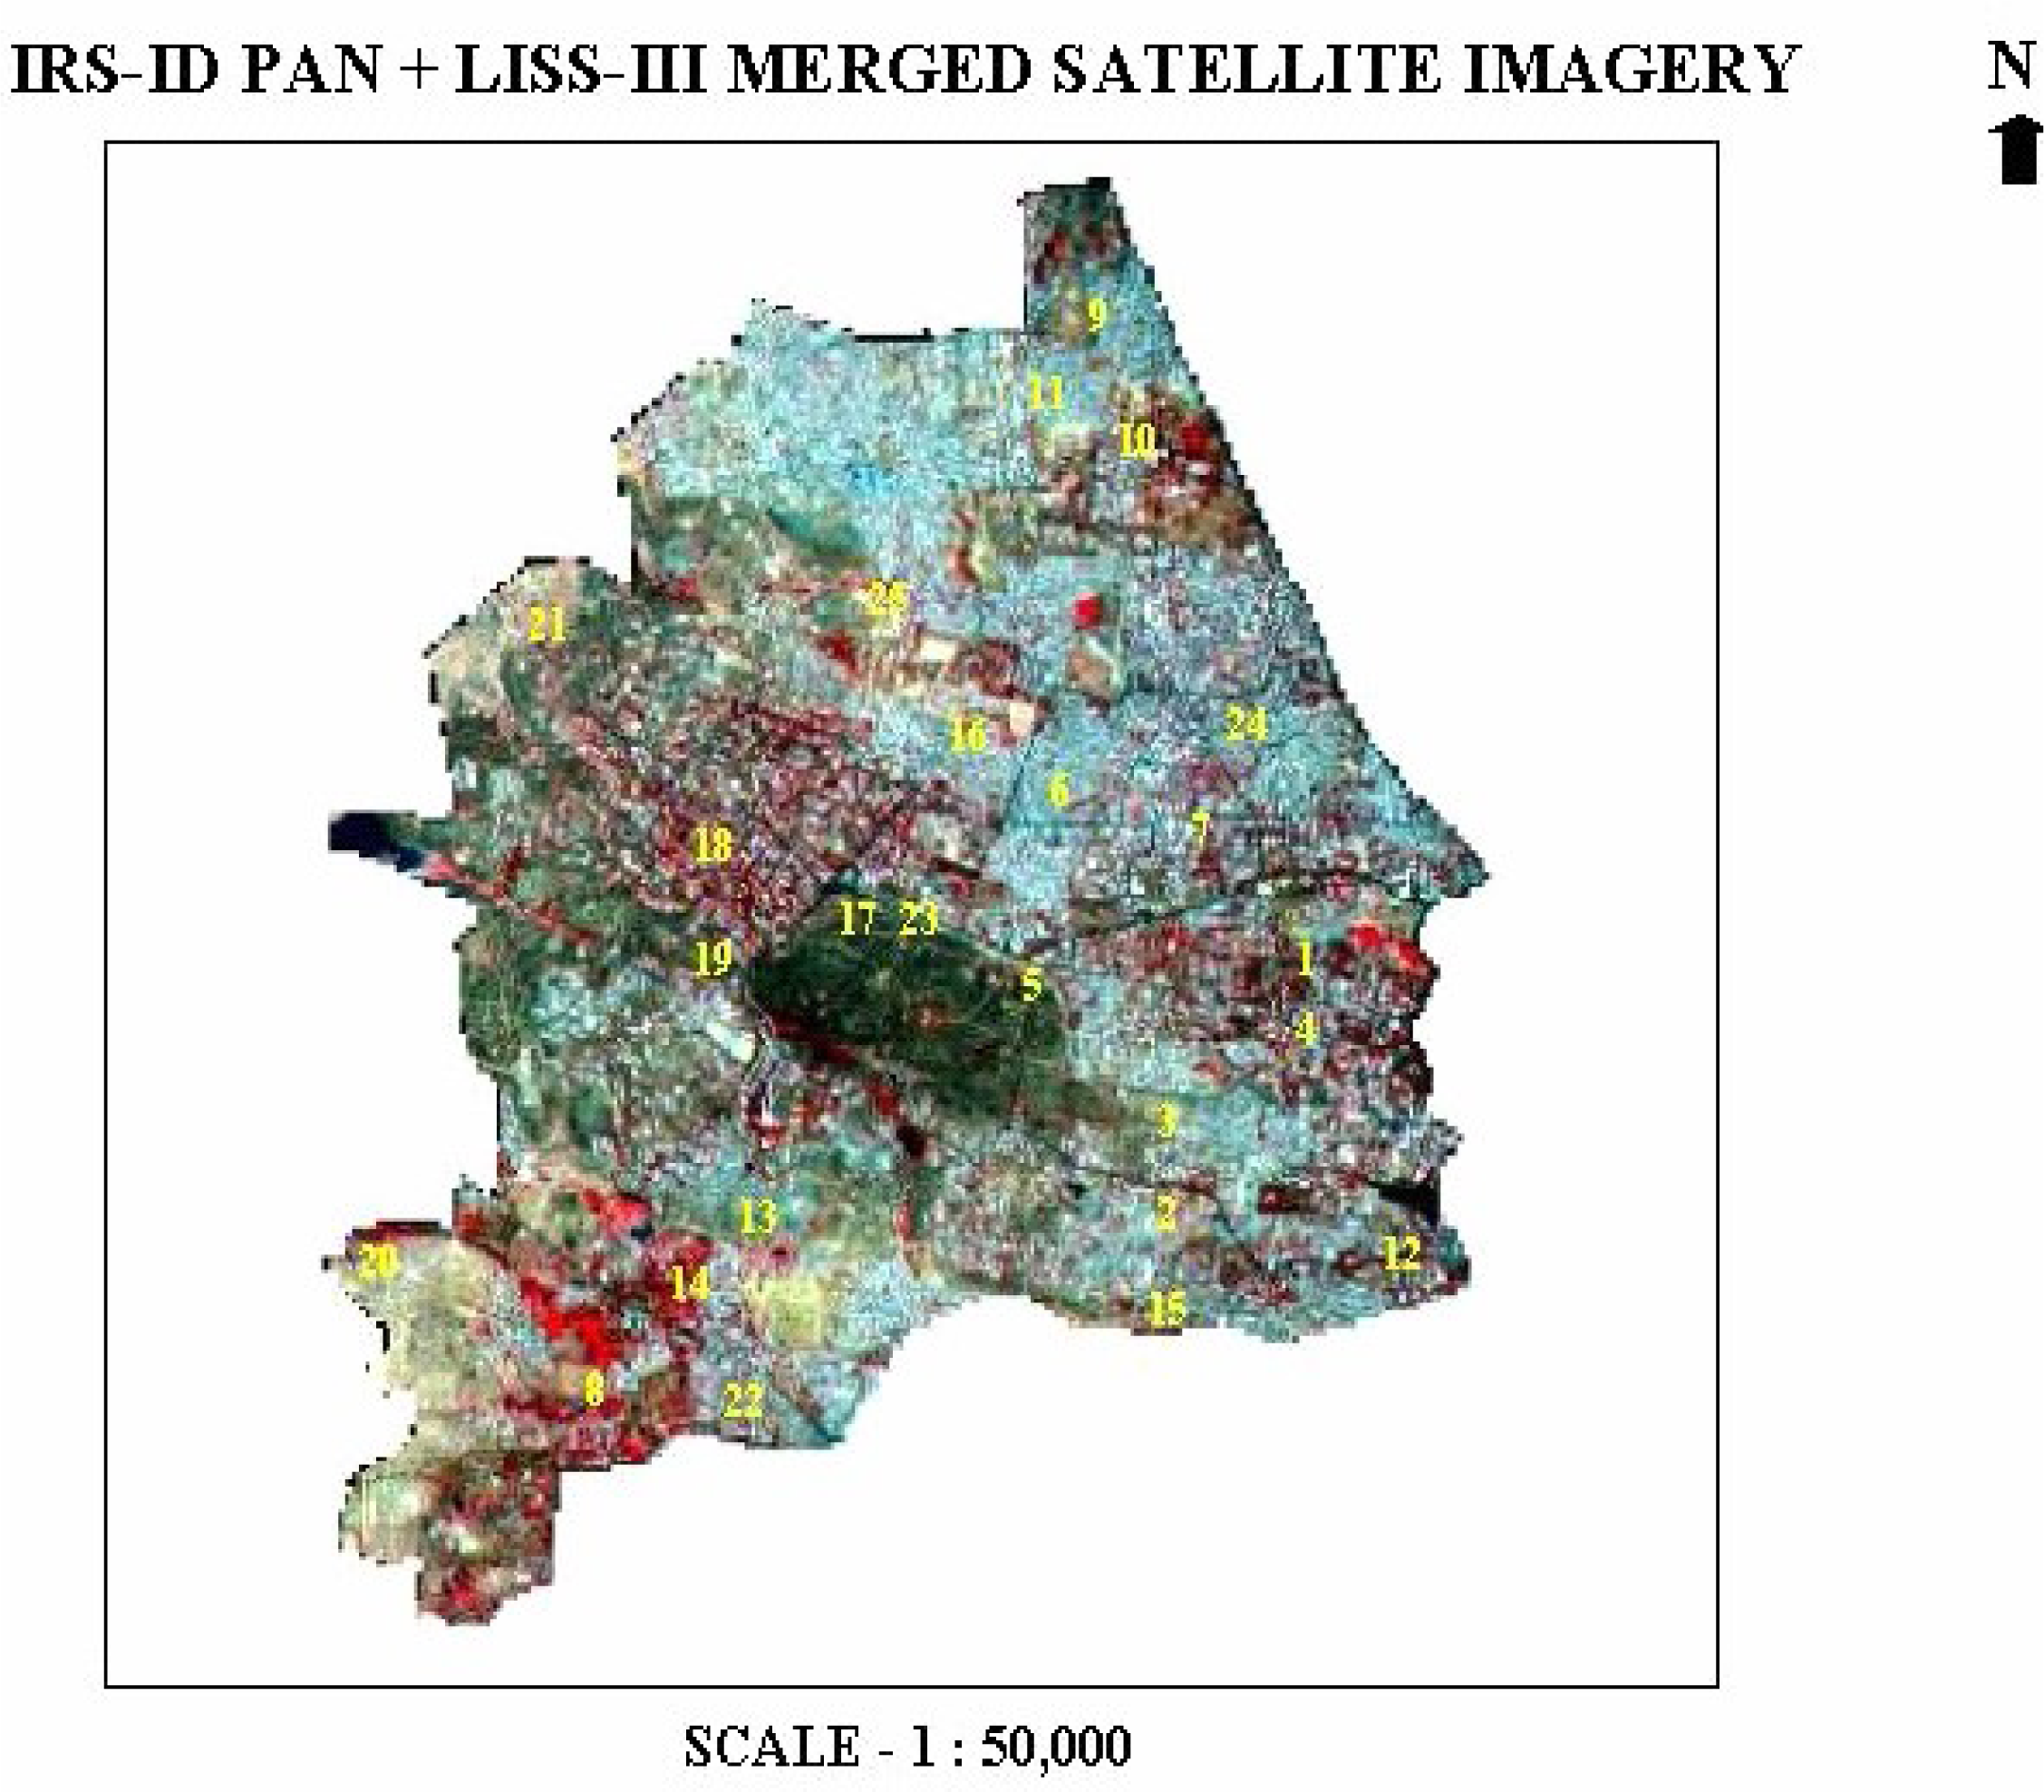
Fieldwork was conducted and groundwater samples were collected from predetermined locations based on the land use change and drainage network maps of the study area. Map showing sampling points overlaid on satellite imagery as shown in
Fig 2. The water samples were then analyzed for various physico-chemical parameters adopting standard protocols [
5]. The water quality data thus obtained forms the attribute database for the present study (
Table 1).
Integration of Spatial and Attribute Database
The spatial and the attribute database generated are integrated for the generation of spatial distribution maps of selected water quality parameters like pH, alkalinity, chlorides, sulphates, nitrates, TDS, total hardness, fluorides and Water Quality Index (WQI) and overlaid on satellite imagery. The water quality data (attribute) is linked to the sampling location (spatial) in ARC/INFO and maps showing spatial distribution are prepared to easily identify the variation in concentrations of the above parameters in the ground water at various locations of the study area using curve fitting technique of ARC/VIEW GIS software.
Spatial Modeling and Surface Interpolation through IDW
GIS can be a powerful tool for developing solutions for water resources problems for assessing water quality, determining water availability, preventing flooding, understanding the natural environment, and managing water resources on a local or regional scale [
6]. Though there are a number of spatial modeling techniques available with respect to application in GIS, spatial interpolation technique through Inverse Distance Weighted (IDW) approach has been used in the present study to delineate the locational distribution of water pollutants or constituents. This method uses a defined or selected set of sample points for estimating the output grid cell value. It determines the cell values using a linearly weighted combination of a set of sample points and controls the significance of known points upon the interpolated values based upon their distance from the output point thereby generating a surface grid as well as thematic isolines. Important water quality indicating parameters and their distribution patterns were studied in Hyderabad metropolis also with the help of cartographic techniques. Thus, GIS enables us to look into the cause and effect relationship with visual presentation [
7].
Estimation of Water Quality Index (WQI)
Water Quality Index (WQI) is a very useful and efficient method for assessing the quality of water [
8]. Water Quality Index (WQI) is a very useful tool for communicating the information on overall quality of water [
9,
10]. To determine the suitability of the groundwater for drinking purposes, WQI is computed adopting the following formula [
11].
where, W, Weightage factor (W) is computed using the following equation, (
Table 2)
and K, Proportionality constant is derived from,
Sn and Si are the WHO / ICMR standard values of the water quality parameter.
Quality rating (q) is calculated using the formula,
where,
| qni | Quality rating of ith parameter for a total of n water quality parameters |
| Vactual | Value of the water quality parameter obtained from laboratory analysis |
| Videal | Value of that water quality parameter can be obtained from the standard tables. |
| Videal for pH | 7 and for other parameters it is equalent to zero. |
| Vstandard | WHO / ICMR standard of the water quality parameter |
Based on the above WQI values, the ground water quality is rated as excellent, good, poor, very poor and unfit for human consumption (
Table 3).
Results and Discussion
Land Use/ Land Cover Distribution
An analysis of the nature and rate of land use change and its associated impact on groundwater quality is essential for a proper understanding of the present environmental problems [
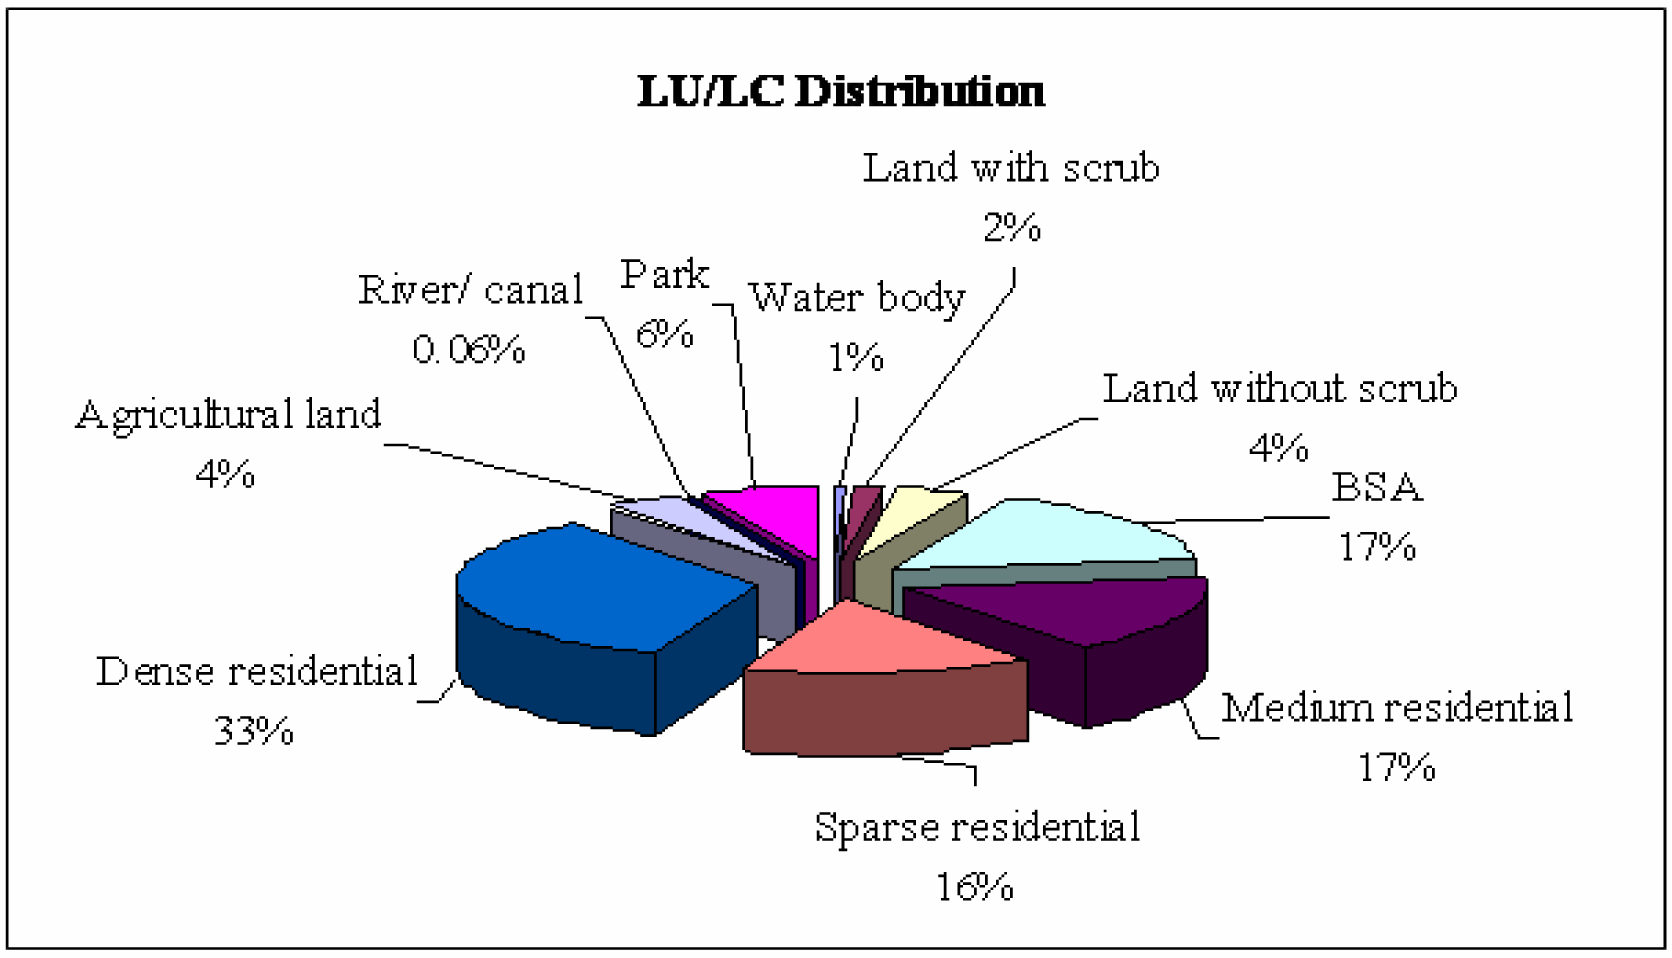
12]. In the present study area, built-up land includes dense, medium and sparse residential areas, which comprises of 18.88 km
2 of the total study area out of which 9.74km
2 is of dense residential and 4.73km
2 medium residential and 4.57km
2 sparse residential areas as shown in
Fig 3 and
Fig 4.
Agricultural land occupies 1.18km2. The major water bodies that are present in this zone are Durgam cheruvu, Yousufguda cheruvu, Hakimpet cheruvu and Sheikpet cheruvu. Among these Yousufguda cheruvu is converted in to a solid waste dumping site and Durgam cheruvu is developed for tourist recreational purpose. Land without scrub, the most common category, which transforms to built-up land in the urban areas comprises of 1.1km2 of total area. The study area comprises of 4.8km2 of the area under barren sheet area.
Groundwater Quality Variation
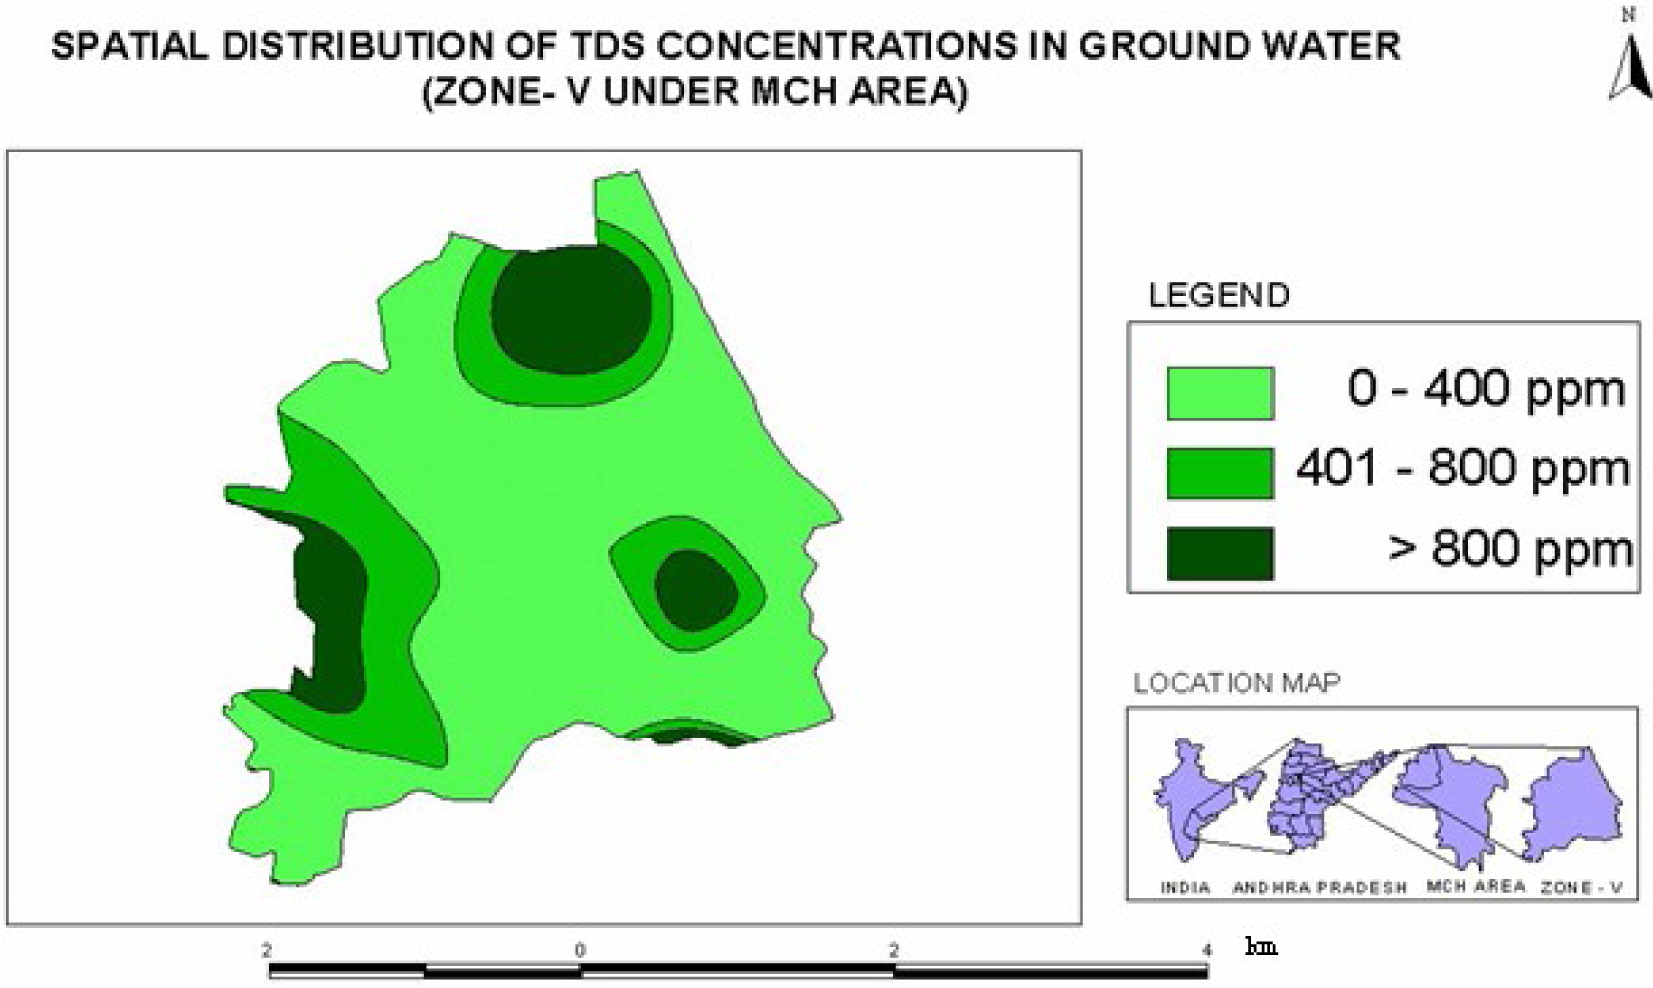
The pH of the water samples in the study area ranged in between 6.0 – 8.0. High alkaline water with concentrations ranging above 300mg/l was observed at Yellareddyguda and Erragadda, which is due to decay of organic matter, weathering of rocks and minerals. The concentration of chloride in most of the areas is within the permissible limits except at Banjara Hills N.V.T. Nagar, which has 260mg/l of chloride. The highest concentration of total dissolved solids was found to be 1350 mg/l at Erragadda and at Yellareddyguda with 1010mg/l which is due to the presence of dense residential area and due to BSA land form. Solid waste dumping site situated at Yousufguda and locations of industries at Sanath Nagar have an impact on the groundwater of these areas. A high concentration of TDS was also observed at Southern Jubilee Hills (1245mg/l) and Sheikpet (1120mg/l), which is attributed to agricultural practices (
Fig. 5). TDS in ground water also originate from natural sources, sewage, urban run-off and industrial wastes [
13].
High concentration of total hardness is found in Shaikpet (970mg/l) and Hakimpet (630mg/l) where the land use pattern is completely BSA and some of the land is under agricultural practice. The other places where high concentrations of total hardness were found are in Yousufguda and its surroundings, which have been converted into solid waste dumping sites. The other areas nearby showed a moderate range of hardness values, which is due to common contamination due to dense residential human activities and weathering and leaching of salts into the ground water. Interestingly the highest concentration of nitrate is around 400 mg/l in the areas of Yousufguda, Kamalapuri (Jubilee Hills) and Vinayak Nagar. Nitrate formed by the biochemical activities of microorganisms or added in chemically synthesized forms to lithosphere and biosphere enters hydrosphere with relative ease, all these environmental components are dynamically interconnected [
14]. High nitrate concentrations indicate sources of past or present pollution [
15]. The direction of the slope from Yousufguda cheruvu towards Vinayak Nagar could be one of the reasons where the high contents of wastes were dumped and also due to residential areas. Sheikpet (500) also showed high concentration owing to the agricultural practices in this pocket that can leach and enter into the ground water. The other places like Jubilee Hills, Banjara Hills, Hakimpet and a part of Punjagutta showed a range between 200–400 mg/l.
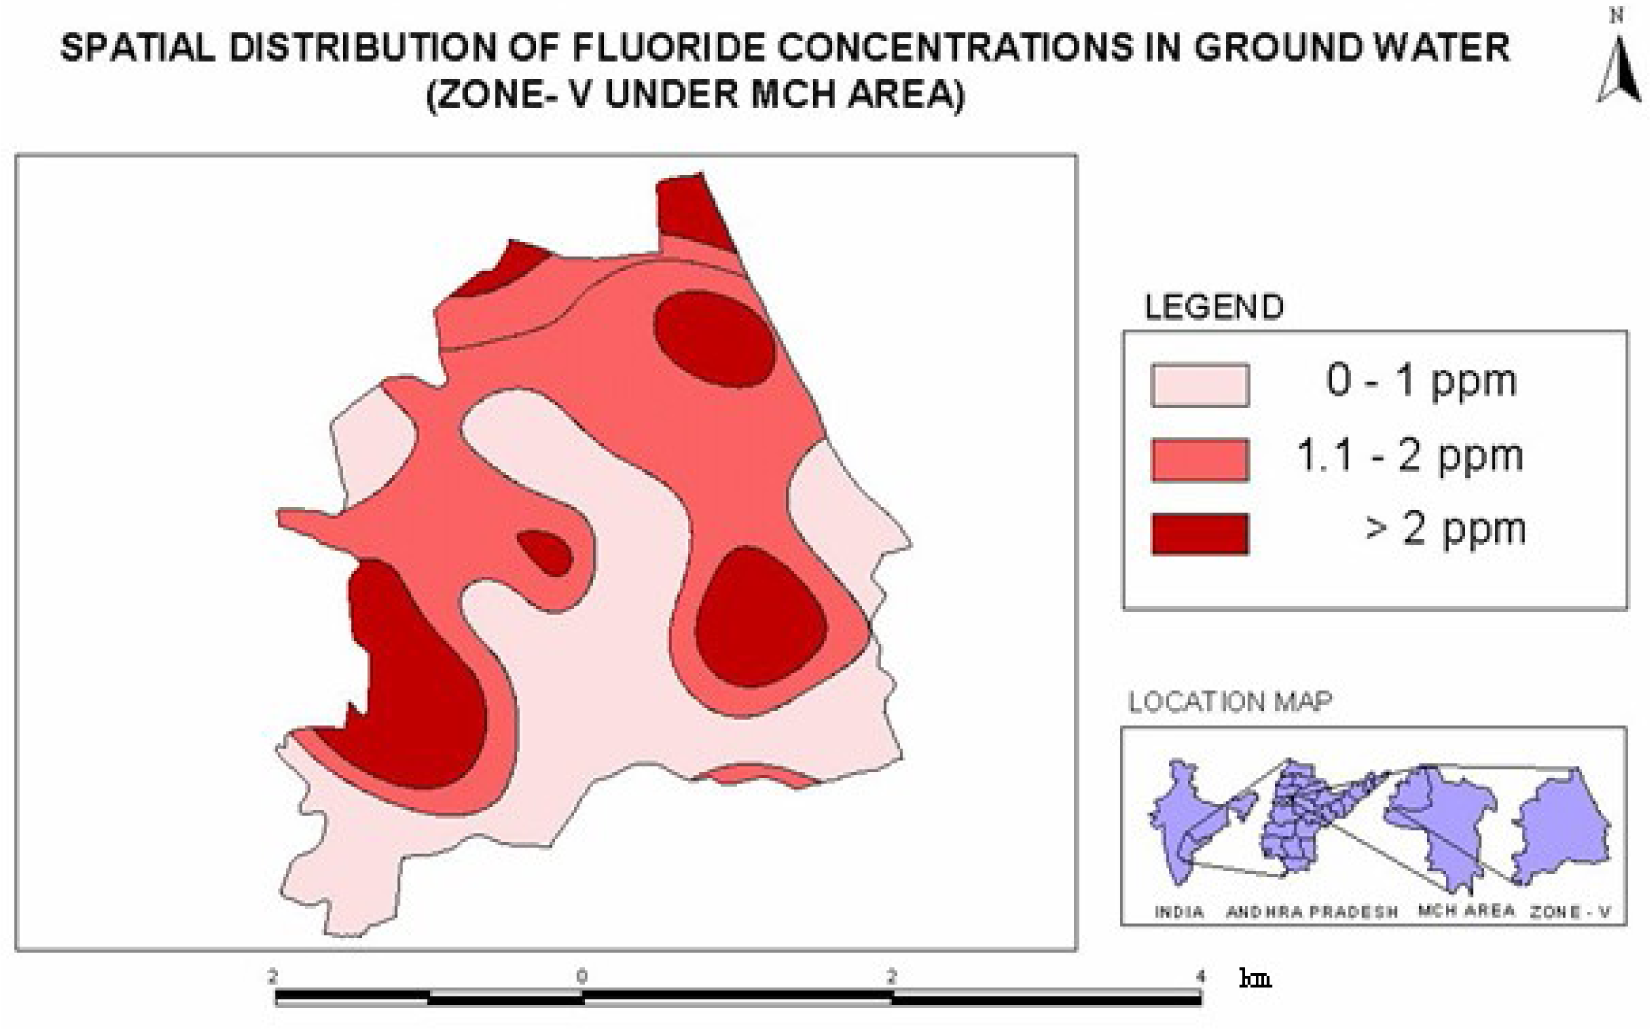
Fluoride, the most commonly occurring form of fluorine, is the natural contaminant of water. Ground water usually contains fluoride dissolved by geological formation [
16]. The concentration of fluoride was observed to be 3.15 mg/l at Yellareddyguda and the concentration above permissible limit was seen near Jubilee Hills, Sheikpet, Erragadda and Sanathnagar (
Fig. 6).
Excessive consumption of fluorine (>2mg/l) causes a dental disease known as fluorosis while regular consumption in excess may give rise to bone fluorosis and other skeletal fluorosis. On the other hand, fluorides <2mg/l causes dental cavities in children [
17]. This could be due to the effect of industrial area and weathering of fluorine bearing minerals like fluoride and apatite. The other parameters like sodium, potassium and phosphorous were found to be within the permissible limits.
Correlation of Water Quality with Land Use/ Land Cover
Water Quality index is calculated to determine the suitability of water for drinking purpose [
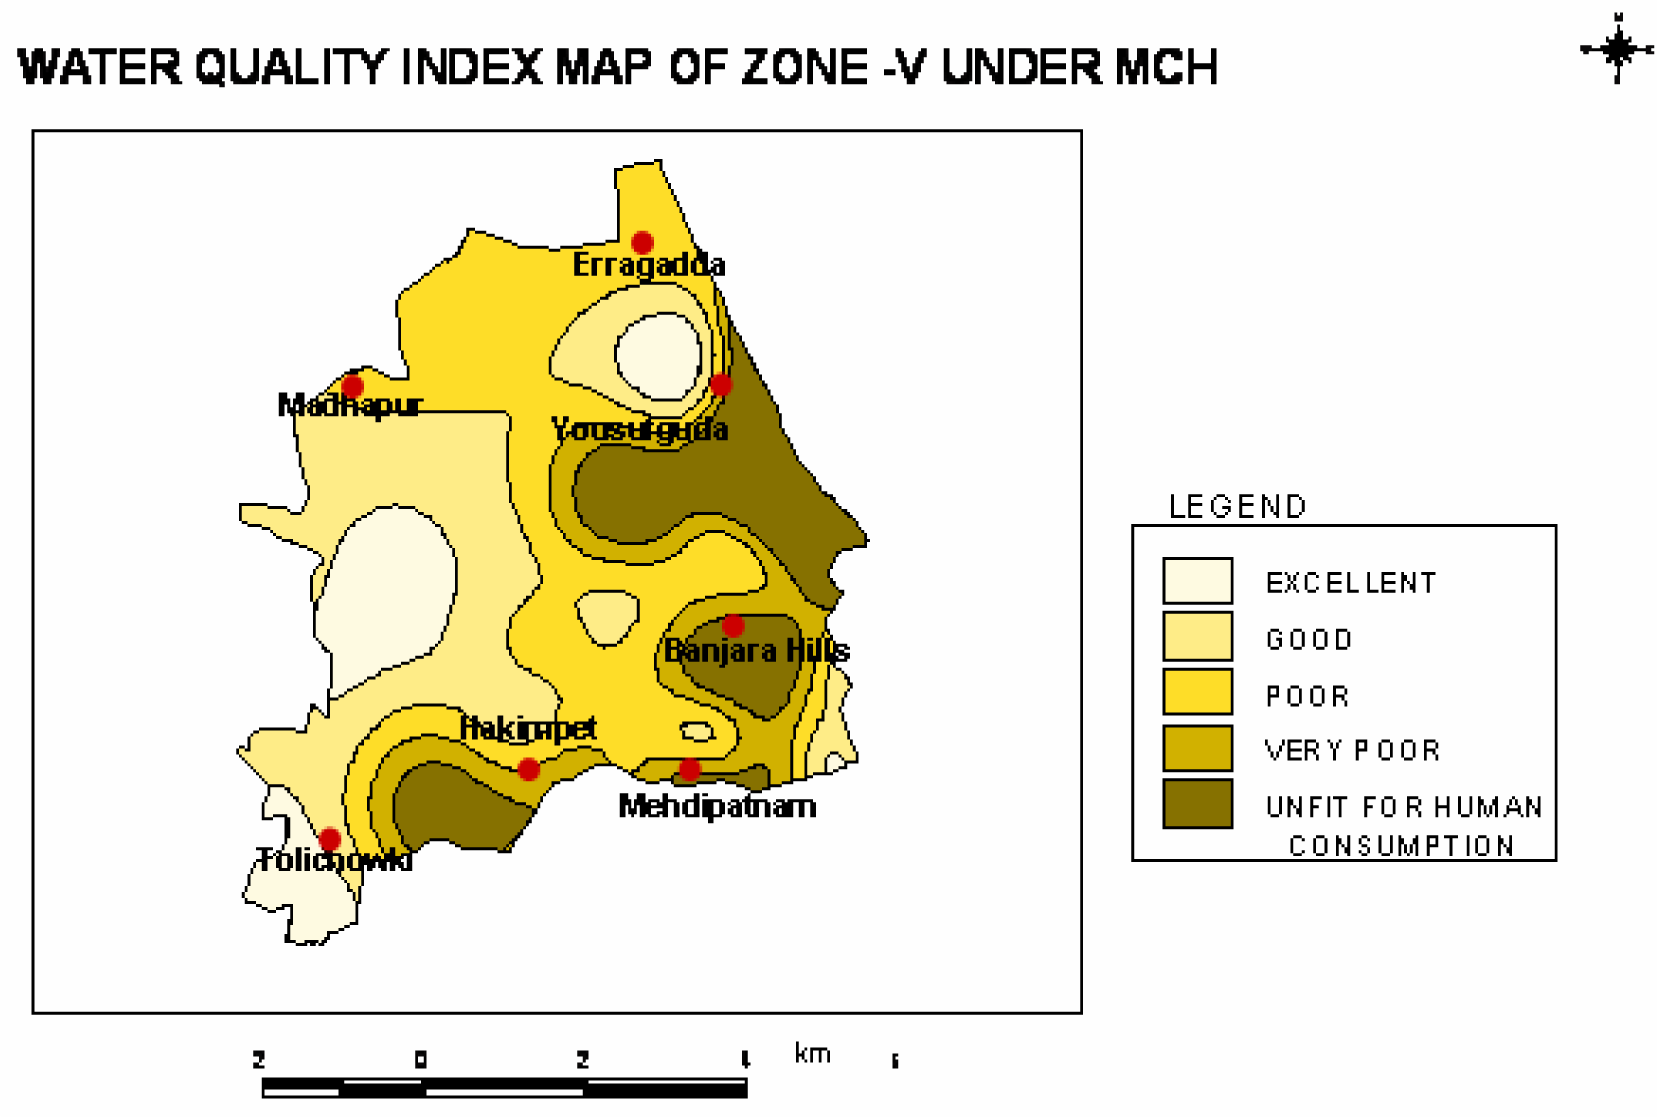
18 &
19]. Water quality index values revealed that the ground water at six locations of the study area was of good quality with the WQI ranging in between 0–50 and therefore can be used for human consumption. Eight samples were of poor quality with WQI ranging in between 50–75 and six samples were of very poor quality and cannot be used for domestic purposes. The WQI was found to be above 100 in areas like NVT Nagar and Road No.10 of Banjara Hills, Yellaredduguda, Erragadda and Motinagar and therefore cannot be used for human consumption. The WQI map is shown in
Fig 7.
Since major portion of the groundwater samples were collected from residential category, the major land use class of the study area, the impact of different residential classes on water quality is discussed. The correlation of land use with water quality as depicted in
Table 4 and
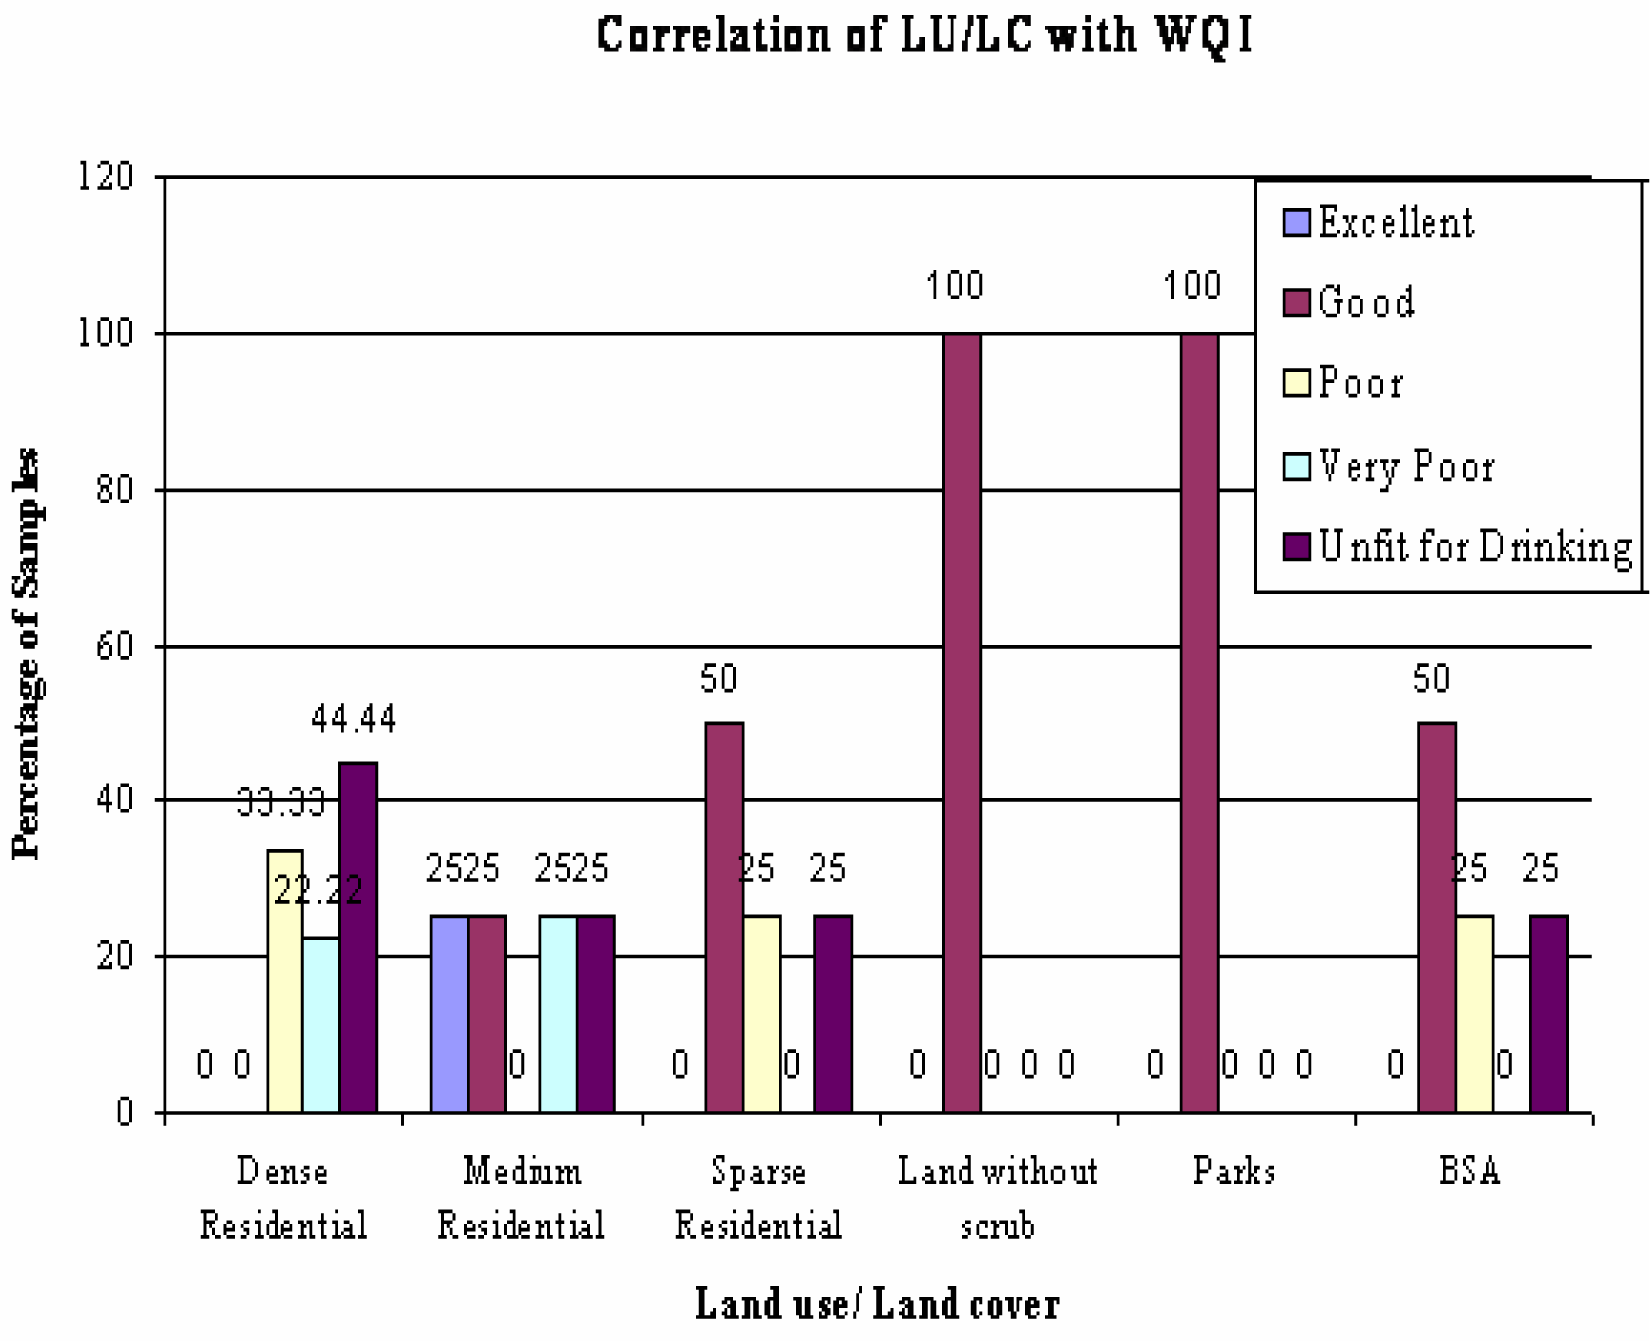
Fig. 8 indicate that the extent of water quality deterioration has a linear correlation with the residential land use subdivided into dense, medium and sparse based on density of population.
Of the nine samples collected and analyzed in dense residential area, four samples (44.44%) were rated as unfit, two (22.22%) as very poor, and the remaining three samples (33.33%) as poor. Four samples were collected from medium residential area, which exhibited excellent (25%), good (25%), very poor (25%) and unfit (25%) quality. Of the four samples collected in sparse residential land use, two samples (50%) exhibited good water quality and the remaining two samples exhibited poor (25%) and unfit (25%) quality. It is observed that the number of samples rated as poor, very poor and unfit in dense residential areas were high when compared to the medium and sparse residential areas. The samples exhibiting good water quality were comparatively greater in sparse residential areas than medium (25%) residential land use class. There were no samples exhibiting good water quality in dense residential class. Five samples collected from BSA land use in areas like Banjara Hills, Mehdipatnam and Erragadda exhibited good (50%), poor (25%) and unfit (25%) quality. From the results obtained it is clear that the residential land use with varying population densities play a major role on the ground water quality of the area.
Conclusion
Based on the correlation between water quality and the existing land use type, the problematic areas of the zone were identified. The results indicate that certain parameters such as nitrates, TDS, chlorides and fluorides were beyond the permissible limits in areas, which are densely residential and industrial. The overall view of the water quality index of the present study zone showed a satisfactory result with most of the area having a WQI of < 50 in areas nearby VN bus stop and Road No.4 of Banjara hills, Jubilee Hills, Mehdipatnam where the ground water quality was good. But few areas like Yousufguda, Erragadda, Sheikpet and Hakimpet had a higher WQI value indicating the deteriorated water quality. Therefore comprehensive sewerage system for safe disposal of wastes should be developed to safeguard ground water quality in most of the residential areas.
The analysis of the results drawn at various stages of the work revealed that integration of Remote Sensing and GIS are effective tools for the preparation of various digital thematic layers and maps showing spatial distribution of various water quality parameters. Overlaying spatial distribution water quality maps on Satellite imagery is a very authenticate concept to identify the water quality problems and to correlate them with the land use to interpret the reasons for deterioration of environmental quality.
Monitoring of pollution patterns and its trends with respect to urbanization is an important task for achieving sustainable management of groundwater. An integrated Remote sensing and GIS study proves to be an essential tool to evaluate and quantify the impacts of land use / land cover on ground water quality. Spatial distribution maps of various pollution parameters are used to demarcate the locational distribution of water pollutants in a comprehensive manner and help in suggesting groundwater pollution control and remedial measures in a holistic way.


