Introduction
Motor vehicles, which are a very significant part of this urban environment, are also the main source of urban noise emission, contributing about 55% to the total noise [
1–
2]. The growing vehicle population gives rise to unrestrained noise pollution and associated health effects and can cause both short term as well as long term psychological and physiological disorders. Noise is a very complex phenomenon in its physical aspect, as well as in its psychological and medical dimensions. In consequence, it is practically indispensable to measure, predict or describe noise in a simplified way [
3]. The CPCB (Central Pollution Control Board) of India in its notification on Ambient Air Quality standard for Noise, which has been included as an air pollutant under section 20 of Amended Air Act of 1987 and has laid down the ambient noise standards [
4]. The effects of noise are seldom catastrophic, and are often only transitory, but adverse effects can be cumulative with prolonged or repeated exposure. Sleep disruption, the masking of speech and television, and the inability to enjoy one's property or leisure time impair the quality of life. In addition, noise can interfere with the teaching and learning process, disrupt the performance of certain tasks, and increase the incidence of antisocial behavior [
5].
The present work was planned with the following objectives:
- a)
To study road traffic noise levels at various locations and compare with prescribed standards
- b)
To assess the noise environment in its spatial and temporal dimensions.
- c)
To prepare suitable noise zone maps for identifications of hotspots.
Materials and Methods
For assessment of road traffic noise due to vehicular movement the sampling, analysis and interpretation tools were selected to give most realistic results. The study area, Asansol, situated in West Bengal, comprises of fifty wards; out of which thirty five analysis zones (sampling locations) were selected that represents the state of city in terms of receiver density. The local community is exposed to high noise levels, whose chief source is road traffic [
6–
7]. The sampling locations comprised of industrial, commercial, residential and sensitive areas. A Digital Sound Level Meter, Type 2 with Frequency Weighting Network as per IEC651 specifications, frequency range of 31.5Hz to 8,000Hz and measuring range between 0 – 150 dB was used for the study. A ‘B & K’ (Bruel & Kjaer) multi-function acoustic calibrator (Model: 4226) was used for calibration at 94.0dB (A) before and after sampling. All reading was taken on the ‘A-Weighting’ frequency network, at a height of about 1.5 meters from ground level and on the ‘Fast’ range Time Weighting. The ‘A’ weighting characteristic and ‘Fast’ range is simulated as ‘Human Ear Listening’ response. All measurements were carried out during working days and under suitable climatic conditions. For the proper assessment and analysis of the results the following Noise Indices were computed:
LAeq: Hourly A-weighted equivalent sound level;
Ldn: Day-Night average sound level (DNL); and
Lmax & Lmin: Max. & Min noise level during sampling.
TNI: Traffic Noise Index;
For the purpose of developing Noise Risk Zones (NRZ) in the Asansol metropolis, a evaluation criteria was adopted which resulted in Six Zones based on noise intensity level [
8]. The Noise Risk Zones are useful in assessment of the extent and noise exposure of the area and helps in identification of noise hot-spots. The criteria are summarized in
Table 1.
Results and Discussion
The noise sampling locations were categorized into four major zones, based on guidelines of CPCB, each of them with a particular noise emission limit. The analysis is done on the basis of spatial and temporal variation of road traffic noise in the study area. The
Table 2 &
Table 3 summarize the traffic noise parameters at the survey locations according to noise zones, whereas
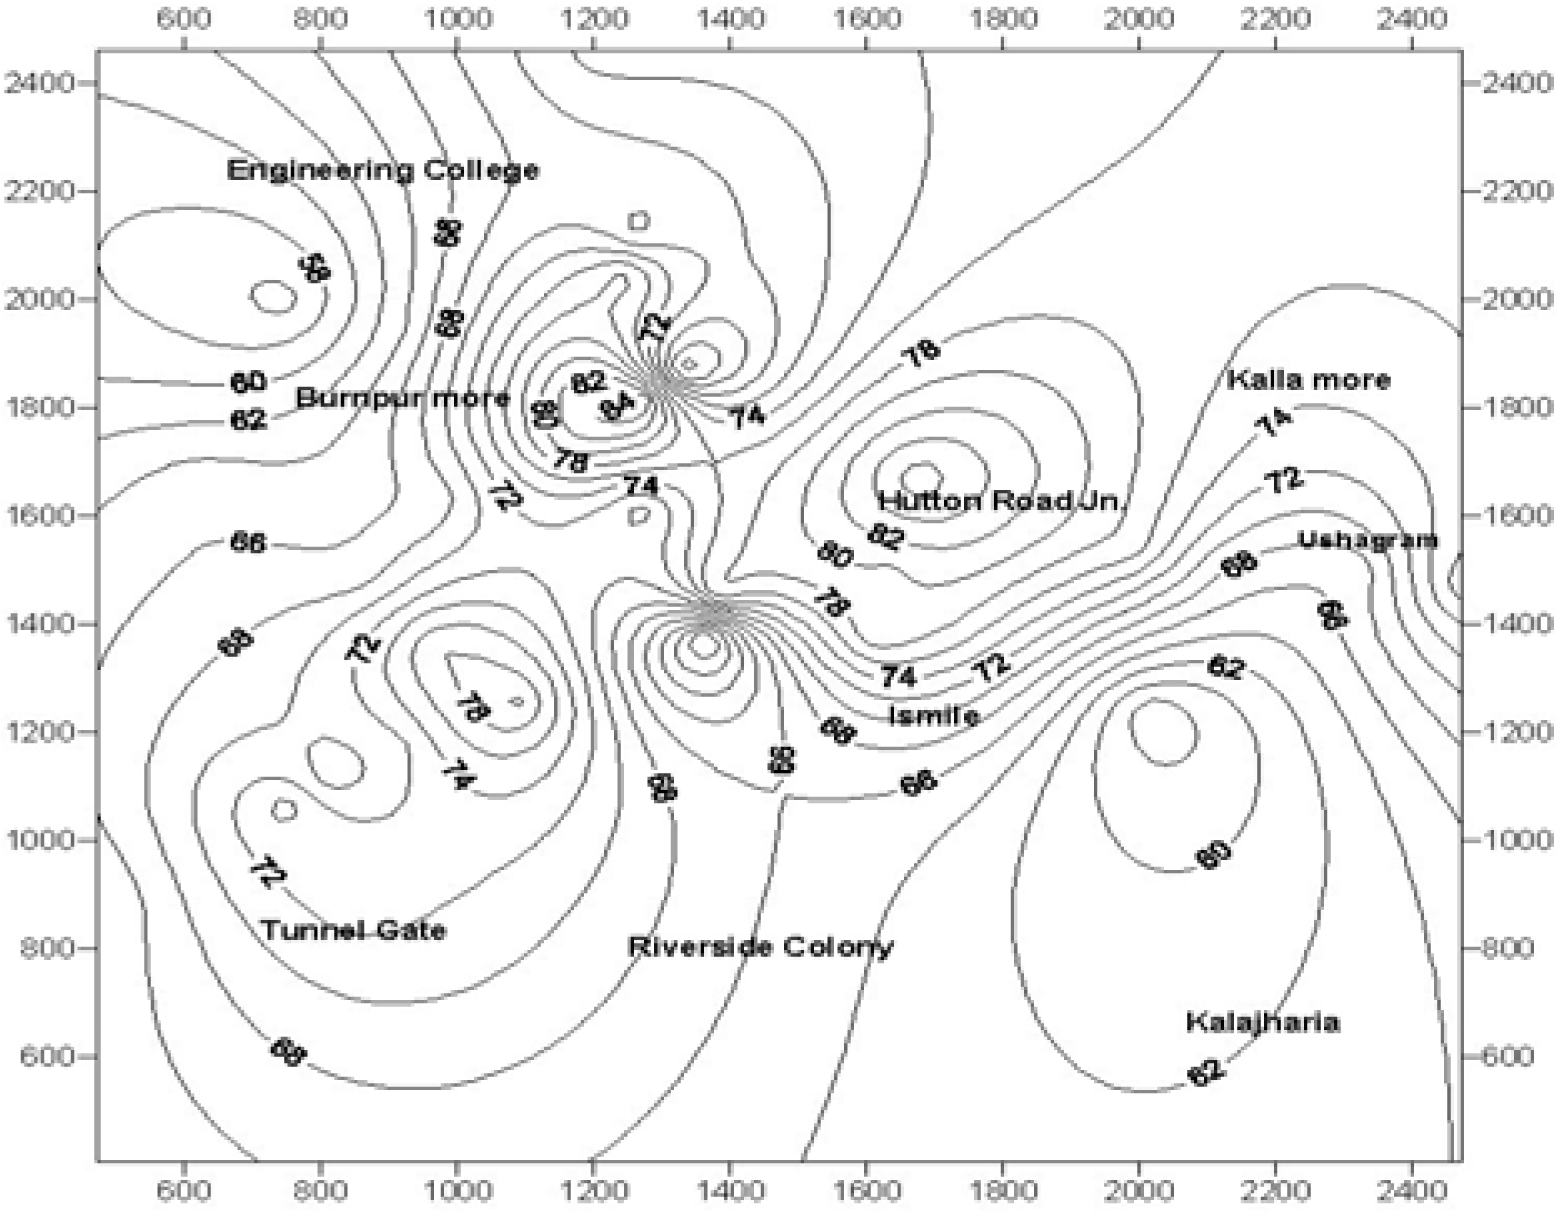
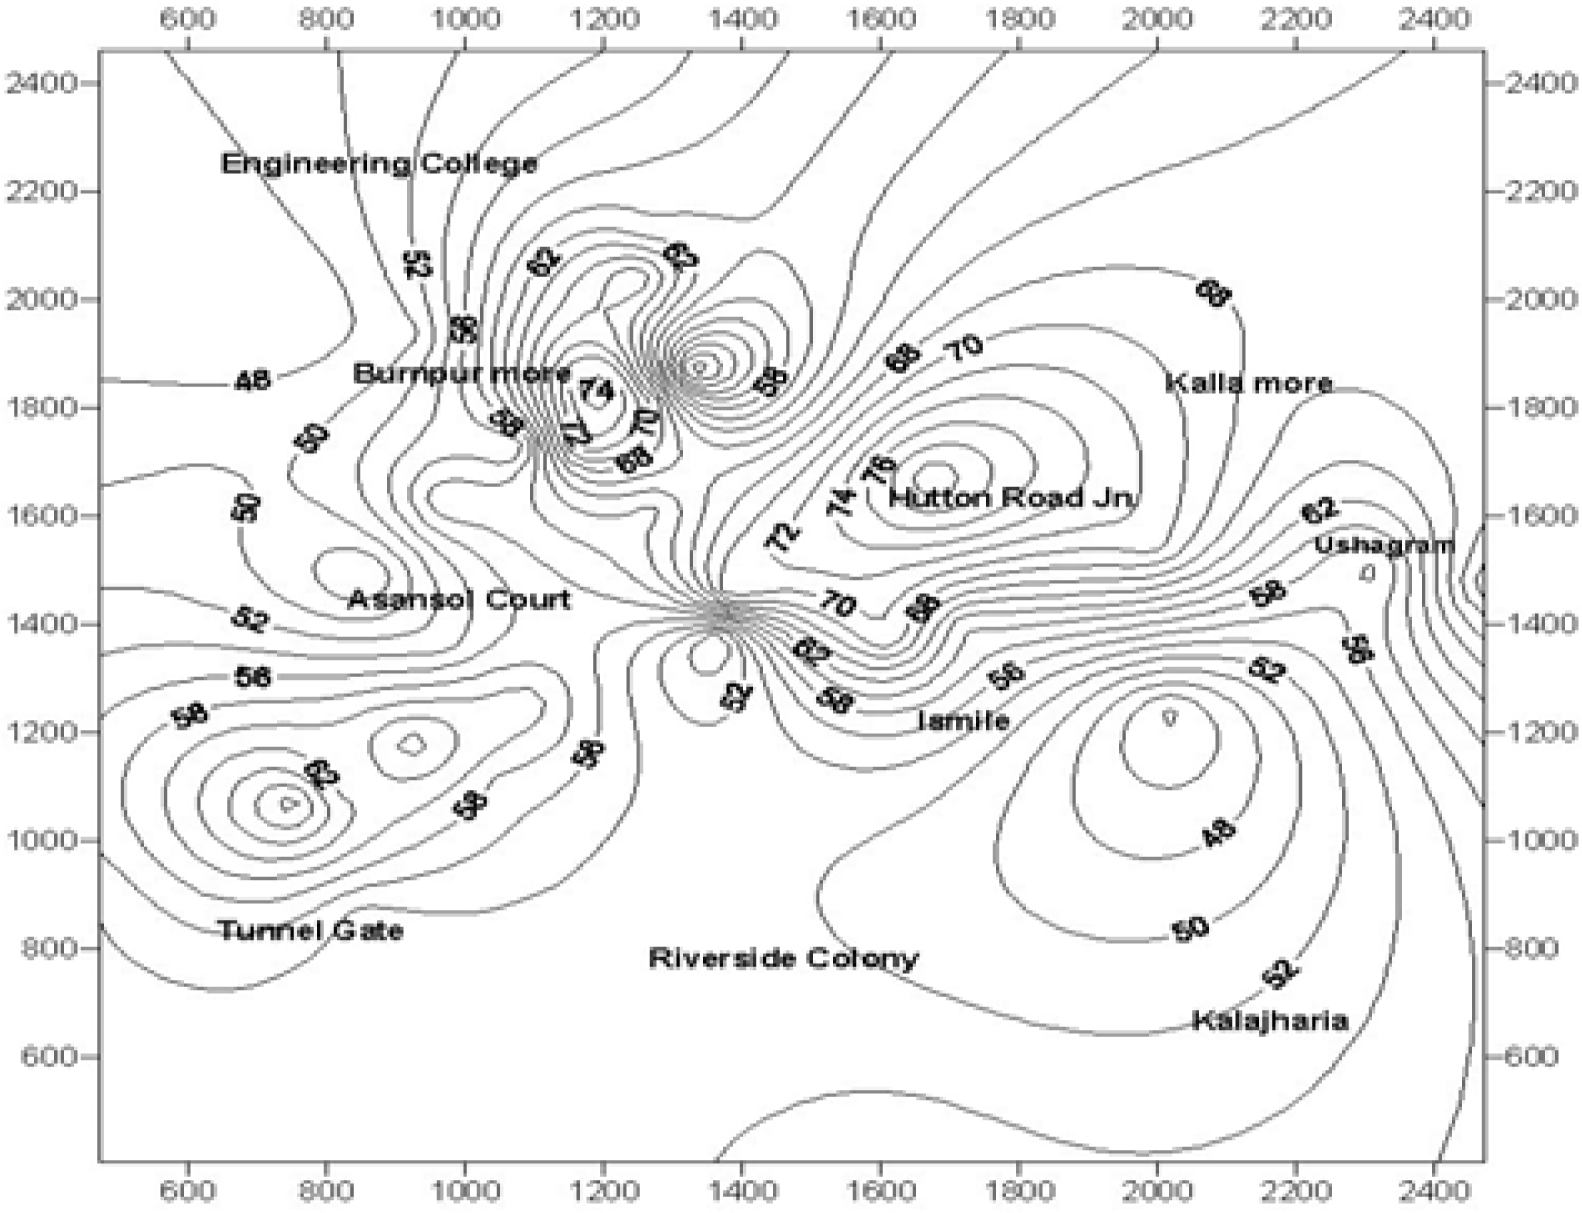
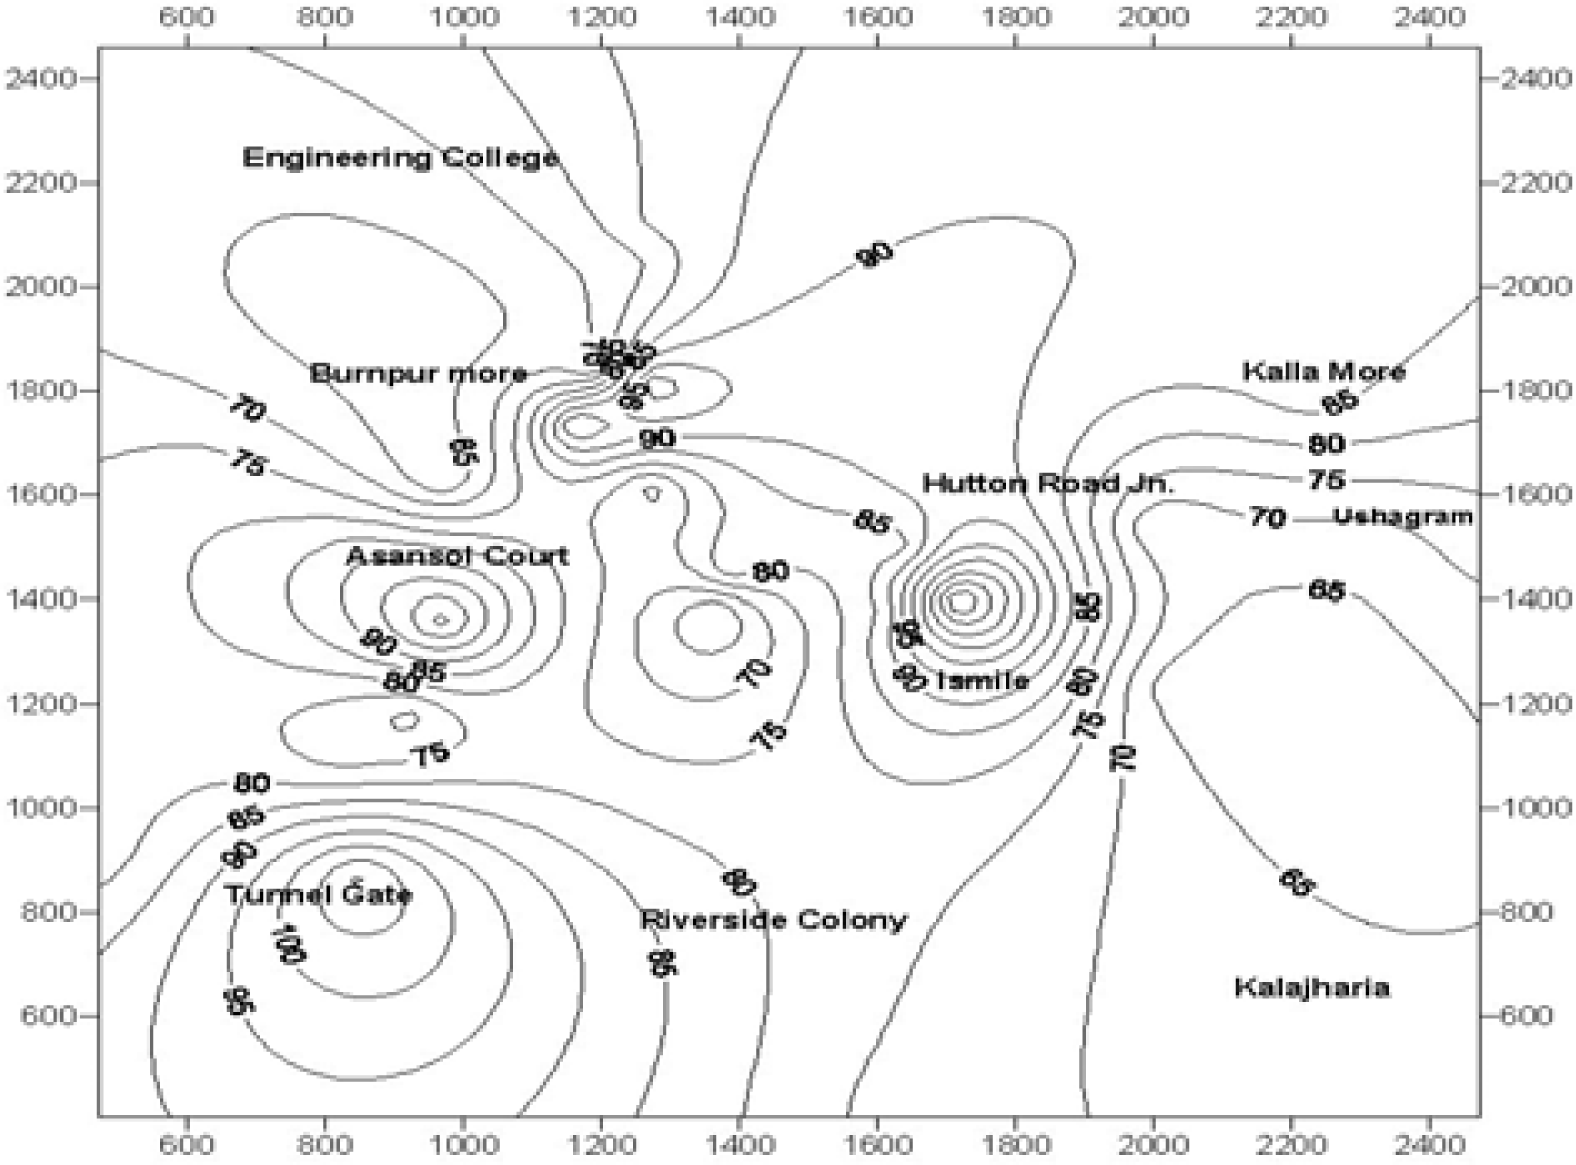
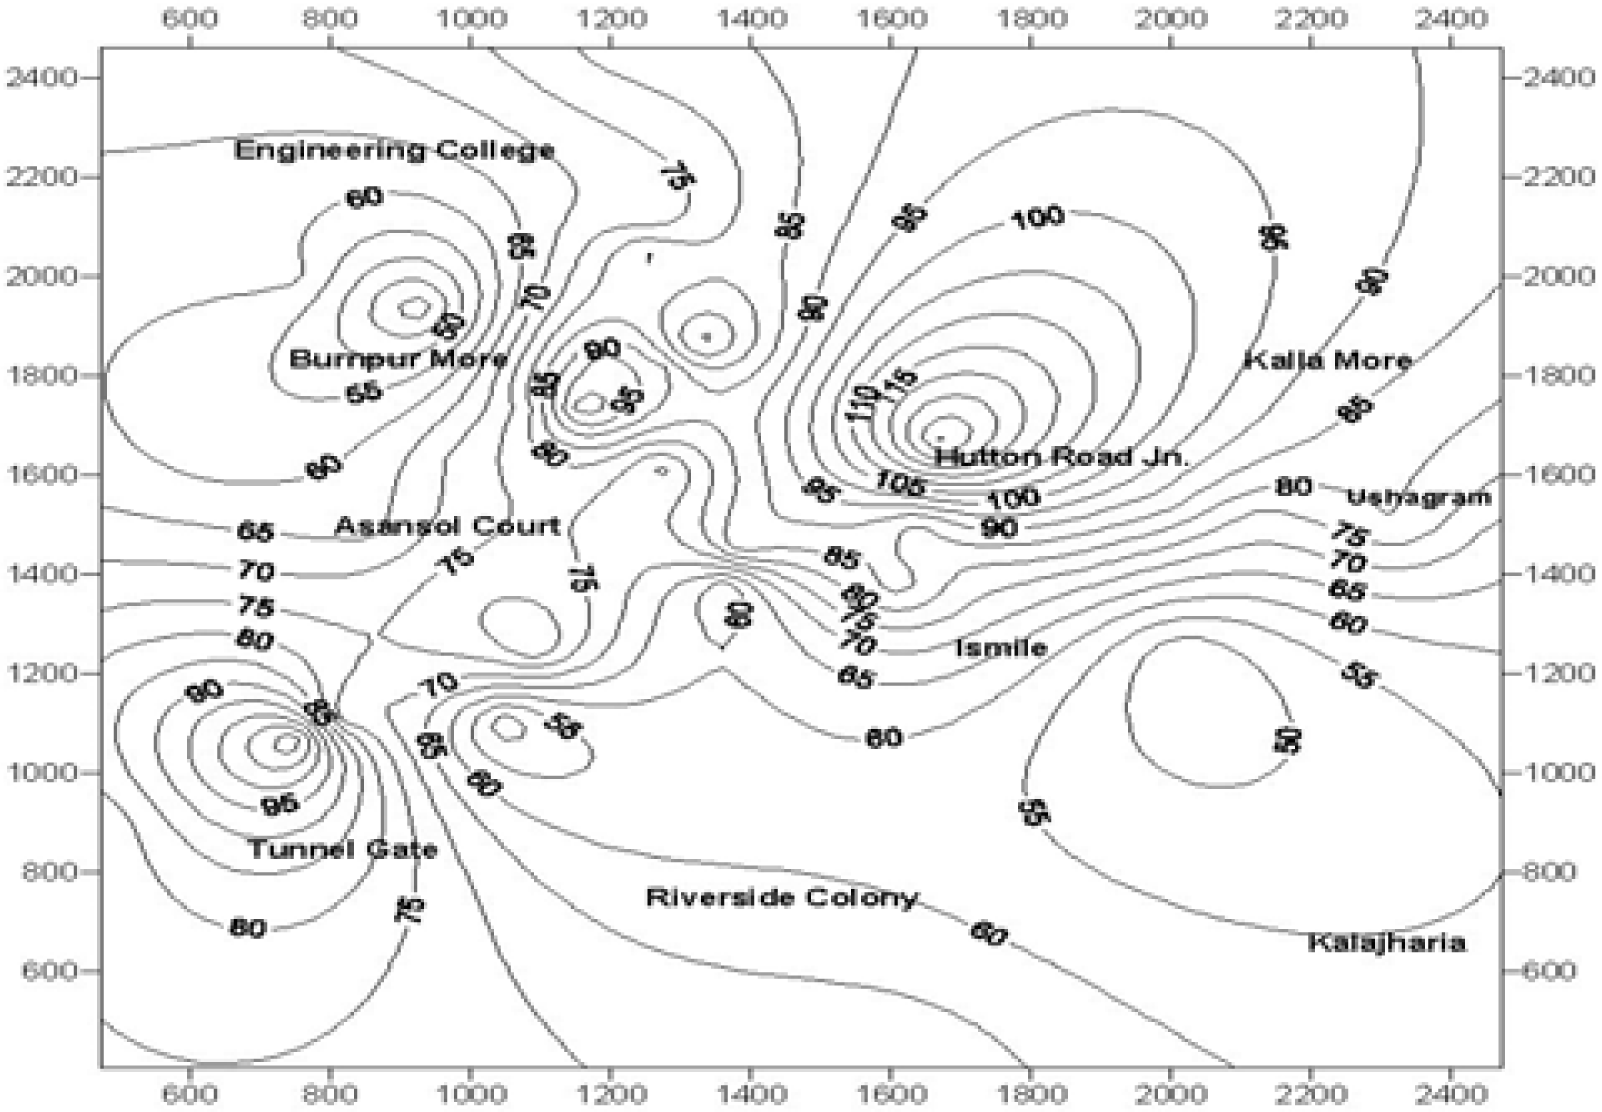
Figure 1 and
Figure 5 shows the noise maps generated based on the study. The details of traffic parameters are given in
Table 4. The Noise Risk zones based on monitored noise levels along with suggested land use plan is given in
Table 5.
Industrial Zone
The monitoring locations were selected based on proximity of roadways to industrial units like gates, along boundary area. The noise level in this zones varied from 65.7 to 76.7 dB(A) during day time and 45.5 and 59.9 dB(A) during night time. The Day-Night equivalent noise level (Ldn) varied between 66.8 and 78.0 dB(A), being higher that the prescribed limit of 55.0 dB(A) by the European Union (E.U.) The Lmax is highest at the SCOP gate site; this being an important entry and exit point of the steel plant. Although no nearby residential quarters are present nearby, but a bus stand is present which is quite frequently used by commuters, who thus are exposed to this high noise when at the stand. Being an industrial gate a number of security guards and officers are always present at the locations, which are vulnerable to occupational noise exposure. A continuous exposure may lead to hearing loss and noise induced permanent threshold shift (NIPTS). Based on the day night noise levels in this zone, they can be classified under 'Tolerable to Medium Impact Zone'. Although the average Traffic flow per hour is moderate but the instantaneous noise produced by heavy vehicles is significantly high.
Commercial Zone
Being an urban area, commercial establishments are numerous, varying between isolated ones to clusters of shops in the form of markets, shopping complexes, etc. Commercial establishments are present alongside 75% of all the roadways and in the absence of proper footpaths they tend to sprawl on the roads, which cause frequent traffic congestions and noise hot spots. The shop owners and customers are generally exposed to high noise level throughout the day. The noise level varied from 53.0 to 80.5 dB(A) during daytime, while it ranged between 55.5 and 81.9 dB(A) during nighttime. Although some locations have noise levels below the limits during day time, but all were higher during evening to night time. This may be due to more people using the post dusk period for shopping and leisure activities. Also the movement of heavy trucks during night time is a cause for high noise level. The Ldn values ranged from 66.6 to 87.3 dB(A) during the monitoring period. The Hutton road junction was the nosiest and can be categorized under the 'Extremely High Risk Zone', with average hourly traffic flow in the 'High' category (2000 – 10000 vehicles/hr). The Lmax value is observed at Burnpur Bus stand, which is a transient point for commercial vehicles across the town. This is adjacent to a large daily market catering for all type of retailers. The lack of proper parking lots near the markets, along with poor traffic management creates severe noise emission throughout the day, and especially during the morning and evening peak hours. The frequent honking of horns by the bus drivers to attract potential commuters produces high noise levels in all the commercial areas.
Residential Zone
Noise pollution due to traffic movement is most significant in terms of residential areas. The detrimental effects of such exposure are well established, ranging from annoyance, hearing loss to cardiovascular diseases. In the study area no protection is observed in the residential areas from noise exposure, which is due to ignorance both from the administrative side and as well as from general public. There are no No-Horn signs in the town and those present are either not visible or ignored by the drivers. The noise level in this zones varied from 53.6 to 76.8 dB(A) during day time and 43.5 and 70.0 dB(A) during night time. The Ldn values varied between 53.3 and 79.3 dB(A). The Lmax is highest at the Tunnel gate, which is a workers entry-exit gate from the steel plant, but has residential quarters all around within a 500 meter radius. Although the location is well vegetated with thick green belt, but the noise levels are significantly high during the office hours. The studied locations can be categorized as 'Safe' to Medium Risk' zones in relation to road traffic noise levels.
Sensitive Zone
Noise monitoring sites in sensitive zones consisted of educational institutions, court, religious places and health establishments. The daytime Leq value ranged from 60.8 to 85.6 dB(A) whereas night time Leq value ranged from 54.0 to 73.8 dB(A). The Ldn value varied between 67.6 and 81.3 dB(A). The traffic congestion is observed to be higher in all the location with alarming high count in front of the Asansol Court. The locations of the entire educational and health establishment in the area are adjacent to the G. T. Road and Burnpur Road, the arterial transport route of the city. The court area can be categorized as High Risk zone. Immediate development of green belt in these zones is required to bring down the noise levels within the limits.
Intersection
Major traffic intersections of the town were monitored for noise level. The statistical averages of the hourly traffic pattern in the monitored station are given in
Table 4. The 2-wheeler class is the most accounted type and is one of the annoyance causing groups. The percentage of heavy goods vehicles, which includes the trucks, dumpers, trailers, busses, etc ranges from 0 % to 53.57% with mean of 19.77%. This group is the most significant factor for generation of traffic noise. Stations where heavy vehicular movement was low, had less noise levels. Among the other significant factors that affect traffic noise is the vehicle speed, which ranged between 22.06 kmph to 72.82 kmph, in the study locations. Congestion in the roadways results in higher acceleration & deceleration events which produces higher noise emissions, as evident from the study. As regards to noise levels in the intersections, the L
eq varied between 59.6 and 89.0 dB (A) during daytime, whereas it ranged between 65.3 and 78.7 dB (A) during nighttime. The BNR intersection, an important point for entry and exit from the town, can be categorized under the extremely high risk zone (EHRZ). The location is close to both residential and commercial establishments. The major cause of traffic congestion and high noise level in this location is mainly due to movement of heavy vehicles towards the National highway No.2. Restriction to such movements during the day is required to bring down the high noise level.
Spatial-Temporal Variation
The study area is an industrial town, comprising of 100% urban population and thus, consists of diverse types of land-use patterns. It is observed that among the four zones, the Silence zones has highest average day-time Leq value (73.53 dB(A)), where as Residential zone has lowest value (63.5 dB(A)) and highest average noise level for night time occurs in the Intersection areas (71.18 dB(A)) and lowest in the Industrial areas. Highest average TNI value for day time is observed for Industrial zones and during night time commercial areas accounts for highest TNI value. Average Ldn value is highest in the Traffic intersection zones where as lowest values are in the Residential zones. Applying The Noise Risk Zones criteria it is observed that Hutton Road junction falls under the Extremely High Risk Zones, exposing the traders, consumers and surrounding offices and residential areas to high traffic noise pollution. Through this location the very busy and congested Grand Truck road passes and has the highest traffic volumes throughout the day, evening, as well as during night time. Overall the commercial areas fall under the category of ‘Tolerable’ and ‘Moderate’ Risk Zone. Among the Residential areas majority of the locations falls under the category of ‘Safe’ Noise Risk zone, followed by ‘Moderate Risk zone’. Although the safe zone is those with noise less that 66 dB (A), but the average Leq values of both day & night time are higher than the prescribed CPCB standards. Among the Silence zones most of areas falls under the Moderate Risk and Low Risk Zone. But based on the Leq values and other noise parameters it can be said that noise values are significantly higher both during day time as well as at night time, than the prescribed safe limits. Among the Intersections, the BNR Bridge on the G.T.Road has very high traffic volumes and accounts for extremely high noise levels in and around the site. This falls under the Extremely High Risk Noise Zones and is significant in the sense at residential apartments, homes and health establishments are within 100 meter radius. The Noise Maps produced were very useful in the assessment of noise exposure in the study area. The noise hotspots can easily be observed. The identified Hot-Spots of Traffic Noise are Ashram more (junction), Bodha more, Triveny, Kalyanpur, Ismile more, Burnpur bus stand, Govt. Hospital, Burnpur more, Asansol Court, BNR & Hutton road junction. The roads passing through these areas are the G.T.Road, Bunrpur Road, NH-2, S.B.Gorai Road & Senreligh Road, all being arterial roadways of the city. The maps show that the noise levels are higher near the roadways and tend to change according to the traffic flow pattern and time of the day. Open areas with relatively less traffic movement show reduced noise levels. Overall the noise levels at nearly all the locations are above the CBCP limits.
Conclusion
The noise assessment presented in this study has revealed that even in an urban-industrial, medium sized city such as Asansol, road traffic noise are higher than the limits set up by Central Pollution Control Board of India. The study reveals the fact that type of zone, geographic features, landscape and topography are factors on which noise emission and transmission depends. The open areas have lower noise level during any time of the day because it lacks dense human habitation, commercial establishment and hence has lower vehicular flow. In contrast the well built up area with residential apartments, shopping areas, have higher noise level due to more use of the roads alongside it by all types of public, commercial and private transport vehicles. Based on the noise survey it observed that immediate mitigatory measures are required to control the high road traffic noise emission. Suggestive control methodologies includes control of noise at source of generation itself by employing techniques like-maintenance of automobiles, regular servicing and tuning of vehicles to reduce noise levels, fixing of silencers to automobiles, two wheelers etc., will reduce the noise levels. Control in the transmission path by installation of barriers between noise source and receiver can attenuate the noise levels: the barrier may be either close to the source or receiver; the development of Green belt which can attenuate the sound levels. The degree of attenuation varies with species of greenbelt. The suggestive modified land use pattern based on the noise environment is given in
Table 5. The design of the building incorporating the use of suitable noise absorbing material for wall/door/window/ceiling will reduce the noise levels. Other measures include raising the awareness among local community, more No Horn signs and strict enforcement of laws.


