Article

Sensitivity of Air Pollution-Induced Premature Mortality to Precursor Emissions under the Influence of Climate Change

1
School of Civil and Environmental Engineering, Georgia Institute of Technology, 311 Ferst Drive Atlanta, GA 30332-0512, USA
2
Environmental Research Laboratory, NCSR Demokritos, Patriarchou Gregoriou Str. Aghia Paraskevi 153-10, Greece
3
Department of Surgery, James H. Quillen College of Medicine, East Tennessee State University, Johnson City, TN 37614, USA
4
Stratus Consulting Inc., 1920 L Street, NW; Suite 420, Washington, DC 20036, USA
5
Northeast States for Coordinated Air Use Management (NESCAUM), 89 South Street, Suite 602, Boston, MA 02111, USA
*
Author to whom correspondence should be addressed.
Int. J. Environ. Res. Public Health 2010, 7(5), 2222-2237; https://doi.org/10.3390/ijerph7052222
Submission received: 1 March 2010 / Revised: 23 April 2010 / Accepted: 29 April 2010 / Published: 5 May 2010
(This article belongs to the Special Issue Climate Change and Human Health Impacts and Adaptation)

Abstract

:
The relative contributions of PM2.5 and ozone precursor emissions to air pollution-related premature mortality modulated by climate change are estimated for the U.S. using sensitivities of air pollutants to precursor emissions and health outcomes for 2001 and 2050. Result suggests that states with high emission rates and significant premature mortality increases induced by PM2.5 will substantially benefit in the future from SO2, anthropogenic NOX and NH3 emissions reductions while states with premature mortality increases induced by O3 will benefit mainly from anthropogenic NOX emissions reduction. Much of the increase in premature mortality expected from climate change-induced pollutant increases can be offset by targeting a specific precursor emission in most states based on the modeling approach followed here.

1. Introduction

Air pollution can affect human health, having both short-term (e.g., irritation to the eyes, headaches and coughing) and long-term (e.g., chronic respiratory disease and heart disease) effects [1]. Individual reactions to air pollutants depend on the pollutant type, the exposure duration and health status. Mildest effects include increased medication use and subclinical effects while more severe effects include emergency room visits, hospital admissions, and premature mortality. The young, the elderly, diabetics and those with cardiopulmonary disease, such as asthma or severe bronchitis, are the most vulnerable to air pollution exposure. The World Health Organization using population exposure estimates of PM10 (particulate matter with aerodynamic diameter less than 10 μm) concentrations in the year 2002 estimates that 865,000 people die prematurely each year from causes directly attributable to outdoor air pollution [2]. The U.S. has the third highest levels worldwide with an estimated 41,200 premature deaths per year, following China (275,600) and India (120,600). In a recent estimate of global burden of disease, outdoor air pollution was estimated to account for about 2% of all cardiopulmonary disease and 1.4% of total premature mortality [3]. Much of the concern stems from ozone (O3) and particulate matter (PM). O3 exposure decreases lung function, increases airway reactivity, causes lung inflammation, and decreases exercise capacity. Similarly, PM exposure leads to increased rates of respiratory symptoms and illness, decreased lung function, increased asthma exacerbation and also contributes to impaired cardiovascular responses and altered blood coagulation which may precipitate leg and chest pain, heart attacks, stroke, and ultimately premature mortality [e.g., 4–7]. A recent study [8] examining the long-term ozone exposure and mortality found that ozone and PM2.5 (particulate matter with aerodynamic diameter less than 2.5 μm) contributed independently to increased annual mortality in U.S. However, there is no significant effect of exposure to ozone on the risk of premature mortality from cardiovascular causes when particulates were taken into account, but there is a significant effect of exposure to ozone on the risk of death from respiratory causes.
Due to their suspected human health effects, significant effort has been made to investigate climate change impacts on O3 and PM concentrations [911]. Increases in ground-level O3 concentrations are expected in the future due, in part, to higher temperatures and more frequent stagnation events, while changes in precipitation will modify PM2.5 levels [12]. Further, higher ambient temperatures lead to higher biogenic VOC emissions, so future climate induced emission changes are expected to affect both pollutants’ formation [13]. Mickley et al. [14] suggest that the reduced cyclone frequency in a future warmer climate could increase the severity of summertime pollution in the northeastern and Midwestern United States, although the increase of hurricane strength and precipitation might counteract seasonal pollution in some regions [15]. Hogrefe et al. [16] estimate that regional climate change alone will increase the summertime daily maximum 8-hour average O3 concentration over the eastern United States by 4 ppb in the 2050s. Their results are based on the IPCC A2 emission scenario [17], which is one of the highest future emissions scenarios. Across a number of modeling experiments carried out by different groups, absent accounting for emission decreases to controls, simulated global climate change causes increases of a few to several parts per billion (ppb) in summertime mean maximum daily 8-hour average O3 concentrations over substantial regions of the U.S. [18]. The different modeling experiments in general do not, however, simulate the same regional patterns of change. These differences seem to result largely from variations in the simulated patterns of changes in key meteorological drivers, such as temperature and surface insolation.
Bell et al. [9] estimated that elevated O3 levels would increase daily premature mortality 0.11%–0.27% across 50 U.S. cities in 2050 compared to 2001 based on the IPCC-A2 emissions scenario whereas Knowlton et al. found a 4.5% O3-related mortality increase [19] in the 31 counties of the New York metropolitan area. It has been also suggested [20] that climate change driven air quality-related health effects will be adversely affected in more than 2/3 of the continental U.S. in 2050 compared to 2001 based on the IPCC-A1B emissions scenario [17]. The IPCC-A1B emissions scenario is one of the business-as-usual emission scenarios which is generally viewed as a midrange case that assumes a future world of rapid economic growth with a balance between fossil and nonfossil energy sources. Although these approaches are used to examine the hypothetical situation of what would happen if the predicted future climate conditions occurred when holding the anthropogenic emission inventory and population constant, the information provided enhances the ability of air quality managers to consider global change in their decisions quantifying the controls that will be needed to meet a given air quality standard (climate penalty). Extending the study by Tagaris et al. [20] where the potential health impact of ambient O3 and PM2.5 concentrations modulated by climate change over the United States has been investigated, in this study we assess the relative contribution of O3 and PM2.5 precursor emissions in premature mortality change, estimating the sensitivities of premature mortality to emissions and providing an estimate for the emission reductions needed to offset the related mortalities.

2. Methods

Results of the Goddard Institute for Space Studies (GISS) Global Climate Model (GCM) [21], and components of the Models-3 atmospheric modeling system [22,23] were used to simulate the impact of climate and emissions changes on air quality. The U.S. EPA’s BENMAP ( http://www.epa.gov/air/benmap) is used to translate those air quality changes to health impacts. Details of the modeling approach have been reported elsewhere [13,20,24] and summarized here.

2.1. Meteorology

The Fifth-Generation NCAR/Penn State Mesoscale meteorological Model (MM5) [22] is used to downscale (i.e., increase the spatial and temporal resolution over the chosen modeling domain) NASA’s Goddard Institute for Space Studies (GISS) Global Climate Model (GCM) [21] outputs for years 2001 and 2050 [14,25]. The simulation followed the Intergovernmental Panel on Climate Change (IPCC) A1B emission scenario [17] for greenhouse gases. The GISS GCM was applied at a horizontal resolution of 4° latitude by 5° longitude to simulate current and future climate at global scale [14] while the MM5 is applied in a nested configuration with 108 km horizontal resolution for the outer domain and 36 km for the inner one [25]. The inner domain covers the continental United States, part of Canada, Mexico and nearby oceans.

2.2. Air Quality Modeling

The Community Multiscale Air Quality model (CMAQ) [23] with the SAPRC-99 [26] chemical mechanism is used to simulate pollutant concentrations (i.e., O3 and PM2.5) for both historic and future periods keeping constant boundary conditions for 2001 and 2050 simulations [24]. A uniform grid of 36 km × 36 km horizontal cells with 9 vertical layers is employed in the simulations. Although the emission inventory is kept the same (i.e., emission sources, population, activity levels and pollution controls) emissions are not since some pollutant emissions (e.g., biogenic and mobile sources) depend on meteorology. Higher ambient temperatures lead to higher biogenic VOC emissions, suggesting that climate induced emission changes in a warmer environment will affect pollutant formation. The Decoupled Direct Method 3D (DDM-3D) [2730] is incorporated in the CMAQ to quantify sensitivities of air pollutants to precursor emissions [13]. These sensitivities represent how pollutant concentrations respond to precursor emission changes as if the systems were linear [13]. Although the system is not linear, extensive testing suggests the linear (first-order) response is accurate up to emission changes of the order of 30% for O3 and 20–50% for PM2.5 (depending on species) [3133].

2.3. Health Effects

The U.S. EPA’s Environmental Benefits Mapping and Analysis Program (BenMAP) ver. 2.4.8 ( http://www.epa.gov/air/benmap) was employed to estimate the potential health impact of ambient O3 and PM2.5 concentration changes due to climate change over the U.S. [20]. BenMAP includes a database of age-specific population and disease incidence rates, and a concentration-response functions library for use in analyzing the health effects driven by changes in air quality. The concentrationresponse functions used are consistent with those in recent regulatory analyses [3437]. The O3 mortality toxicity factor is 0.00052, (i.e., a 1 ppbv change in O3 concentrations would lead to a 0.052% change in the expected number of premature deaths) [38] while the PM2.5 mortality toxicity factor is 0.0058 (i.e., a 1 μgm−3 change in PM2.5 concentrations would lead to a 0.58% change in the expected number of premature deaths) [39]. BenMAP does not account for the potential variability in the impacts of different components of PM2.5, and the exposure-response estimates are viewed as uncertain and may vary between parts of the country. Here, the default BenMAP ozone-premature mortality relationship is used and is based on 24-hour averaged ozone levels [20]. Since population, mortality rates and disease incidence rates obtained from 2000 are used the anticipated changes in the population (increasing by 2050) and age-specific mortality rates (expected to continue to decrease) would affect future health estimates.

2.4. Premature Mortality Sensitivity

In order to estimate, here, the relative contribution of PM2.5 and O3 precursor emissions in premature mortality changes for each state in the continental U.S. the following formula is used:
E X ( Y ) = Δ M X Δ C X S X ( Y )
where:
  • EX(Y) is the mortality change induced by changes in pollutant X concentration due to a 1% reduction in precursor Y emissions over the domain
  • ΔCX is the pollutant X concentration change due to climate change
  • ΔMX is the premature mortality change induced by ΔCX
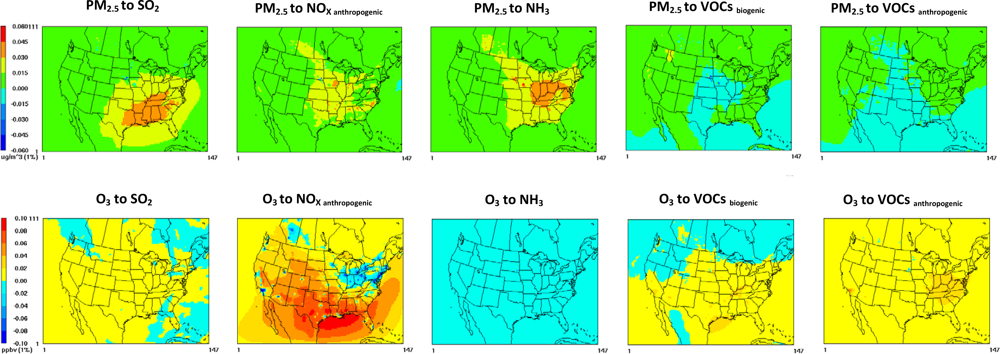
  • SX(Y) is the sensitivity of pollutant X to precursor emissions Y (i.e., concentration responses to a 1% emissions reduction)
  • X: PM2.5 or O3 concentrations
  • Y: SO2, anthropogenic NOX, NH3, biogenic or anthropogenic VOC emissions.
Linear responses of the pollutant concentrations, and the resulting changes in premature mortality, to precursor emissions (i.e., how premature mortality would change to a 1% reduction in SO2, NOx, NH3 or VOC emissions) can be used for emission reductions of up to 25–50%, depending on pollutant and environment, as mentioned above. In this way, the reduction needed in precursor emissions to offset air pollution-induced mortality due to climate change could be estimated for each state. This is the first time, to our knowledge, that an analysis of premature mortality sensitivity to air pollutant precursor emissions is performed.

3. Results and Discussion

A detailed discussion of climate change impact modeling results on meteorology and air quality as well as air pollution related health effects have been presented elsewhere [13,14,20,24,25] and key outputs are presented below.

3.1. Baseline Meteorology

Temperatures in 2050s are modeled to be higher over the U.S. with an average increase between 1 and 3 degrees [24]. During winter and spring warming is between 0 and 3 degrees. Throughout summer warming between 2 and 4 degrees is simulated over the southwestern U.S. [25]. Warming over the midwestern U.S. is found to be less, while in some regions a small cooling is related to changes in cloud cover. During fall, warming of up to 4 degrees occurs over much of the western U.S. Daily rainfall intensity increases in most regions across the continental U.S., but the change in daily rainfall frequency is more spatially variable. As modeled, changes in rainfall frequency are small during winter and spring [25]. Regional changes in precipitation up to ±5 cm yr−1 are simulated for the majority of the states, while in a few states the changes will be higher than ±20 cm yr−1 (more rain is simulated in the southeastern states). Extreme positive changes (higher than 50 cm yr−1) are simulated over the Atlantic Ocean and Gulf of Mexico [40]. During winter and spring the changes in downward solar radiation is about 8 W/m2 in the U.S. [25]. During summer, it reaches 30 W/m2 over Texas. In the Midwest, cloud cover changes reduce solar radiation by up to 30 W/m2. During fall, the change is positive everywhere, with a maximum over the western U.S. of 15 W/m2. The changes in the number of stagnation days during winter and spring are much smaller compared to summer and fall, where the percentage change in stagnation occurrence is very significant [25].

3.2. Baseline Air Quality

Climate change modifies mean summer daily maximum 8-hour average O3 concentration levels by ±3% and mean annual PM2.5 concentrations by −3% to 6% [24]. The lengthening of stagnation events tends to increase summer O3 concentrations particularly during intense episodes near cities while a spatially mixed impact on annual PM2.5 levels is simulated. The latter effect is mainly due to a variable change in precipitation. Stagnation events are predicted to have the most impact in the west, northeast and plains and a small impact is anticipated in the southeast. Climate change alone leads to increasing O3 concentrations in all the examined cities (i.e., Los Angeles, Houston, Chicago, New York, and Atlanta) and more days with daily maximum 8-hour average O3 concentration over the air quality standard are predicted in Los Angeles, New York and Houston. First-order (linear) sensitivities suggest [13] that a 10% reduction in anthropogenic NOX emissions causes 2–4% decreases in maximum ozone concentrations. Reductions in VOC emissions are also beneficial for decreasing O3 levels. Overall, O3 sensitivities to anthropogenic NOX, biogenic VOC, and anthropogenic VOC emissions are predicted to increase only slightly in 2050 compared to 2001 due to climate change. SO2, NH3, anthropogenic NOx and biogenic VOCs were found to be important precursors for PM2.5 formation, with climate change modeled to affect slightly these sensitivities.

3.3. Baseline Health Effects

Air pollution-related premature mortality will be higher in the future in more than 2/3 of the states due to climate changes. Model results find that New York, along with the states in the Great Lakes and the northeastern U.S. will be affected more. Conversely, Texas and the southeastern states will experience a smaller effect [20]. The PM2.5-related health effects dominate the O3-related health effects but the geographic pattern of changes in O3 concentrations is significantly different than the patterns observed for PM2.5. About 4,000 more PM2.5-related premature deaths are projected nationally for 2050 compared to 2001 with more incidents in the Great Lakes area and the northeastern U.S. and less in the southern states. In addition, about 300 more O3-related premature deaths are projected nationally for 2050 compared to 2001. Climate change-related increased O3 health effects are less pronounced in the Great Lakes area and more pronounced for the southern states.

3.4. State Specific PM2.5, O3 and Premature Mortality Sensitivities to Emissions

PM2.5 concentrations are more sensitive to SO2, NOX and NH3 emissions (Figure 1) than other species (e.g., VOCs). Atmospheric SO2 is oxidized to sulfuric acid which reacts with ammonia to form ammonium sulfate while gas-phase NOX, oxidizes to nitric acid which reacts with ammonia to form ammonium nitrate [41]. States which are simulated to be more sensitive to SO2 emissions are those with elevated SO2 emissions such as the eastern states [42] (decreases up to 0.035 μgm−3 in daily state average PM2.5 concentration for a 1% reduction in SO2 emissions), while the western states are less sensitive (decrease between 0.003 and 0.008 μgm−3 in daily state average PM2.5 concentration for a 1% reduction in SO2 emissions). Midwest states are simulated to be more sensitive to anthropogenic NOX emissions since this sub-region experiences relatively large NOX and NH3 emissions [42] (decrease up to 0.026 μgm−3 in daily state average PM2.5 concentration for a 1% reduction in anthropogenic NOX emissions). The sensitivity of PM2.5 to NH3 emissions follows SO2 and NOX spatial distributions and contributes to a decrease of up to 0.04 μgm−3 in daily state average PM2.5 concentration for a 1% reduction in NH3 emissions. The impact of both biogenic and anthropogenic VOC emissions changes to PM2.5 concentration is less important. A 1% reduction in VOC emissions decreases daily state average PM2.5 concentration in few states (up to 0.01 μgm−3 and 0.004 μgm−3 for biogenic and anthropogenic emissions, respectively) and increases daily state average PM2.5 concentration in other states (up to 0.003 μgm−3 and 0.001μgm−3 for biogenic and anthropogenic emissions, respectively).
When NOX and VOCs mix in the presence of sunlight, ground level O3 is formed [41]. The response of ambient O3 formation to reductions in NOx and VOC emissions depends on the relative abundance of NOX and VOCs, as well as meteorological factors. The majority of the states have a positive response to anthropogenic NOX emissions, with a decrease of up to 0.067 ppb in daily state average O3 concentration for a 1% emissions reduction. A few states located in the Midwest and Northeast sub-regions have a negative response, with an increase of up to 0.044 ppb in daily state average O3 concentration for a 1% reduction in anthropogenic NOX emissions. VOC emissions are also important to O3 responses. A 1% reduction in anthropogenic and biogenic VOC emissions are simulated to reduce O3 concentrations up to 0.021 ppb in the eastern states while a minor negative response to biogenic VOC emissions is noticed for the northwestern states (an increase of up to 0.005 ppb in daily state average O3 concentration for a 1% reduction in biogenic VOC emissions). SO2 and NH3 emissions are simulated to have a minor impact (a decrease of up to 0.004 ppb and increase of up to 0.006 ppb in daily state average O3 concentrations for a 1% reduction in SO2 and NH3 emissions, respectively).
States with high emission rates [42] and significant premature mortality increases induced by PM2.5 concentrations modulated by climate change (i.e., midwestern and northeastern U.S. sub-regions) are estimated to substantially benefit from SO2, anthropogenic NOX or NH3 emissions reduction (Table 1). Illinois is simulated to be the state where emissions reduction will most significantly decrease PM2.5-induced premature mortality: a 1% reduction in SO2, anthropogenic NOX or NH3 emissions results in 28, 27 and 40 less incidents, respectively. States with fewer related incidents in the future (e.g., Texas, Florida) will also benefit from emissions reduction. In general, reduction in both anthropogenic and biogenic VOC emissions plays a minor role compared to SO2, anthropogenic NOX and NH3 emissions reduction.
States with premature mortality increases induced by O3 concentrations modulated by climate change are estimated to benefit mainly from anthropogenic NOX emissions reduction. In the majority of the states, anthropogenic NOX emissions reduction will reduce premature death, however, in a few states where VOCs are the limiting precursor for O3 formation, NOX emissions reductions are found to result in an increase (e.g., NJ, IL, OH, PA, IN). This is partly an artifact of using the exposure-response relationship for O3 based on a 24-hour average. 24-hour average O3 levels can respond negatively to NOX emissions when 8-hour maximum levels would respond positively. Texas and California are simulated to be the states that will benefit most: a 1% reduction in anthropogenic NOX emissions results in about 4 less premature deaths. Reduction in both anthropogenic and biogenic VOC emissions are also simulated to be beneficial for the states with high premature mortality increase induced by O3 concentrations modulated by climate change (between 0.6 and 1.7 fewer incidents for a 1% reduction of VOCs). Northwestern states are simulated to have a small increase in premature mortality due to biogenic VOC emissions reduction. As anticipated, SO2 or NH3 emissions reductions only slightly modify O3-related premature mortality since these two pollutants do not have a large impact on ozone formation.
Generally, the effect of emissions reduction in cumulative (total) premature mortality induced by both PM2.5 and O3 changes follows the PM2.5 trend since PM2.5 related mortality has been found higher than that due to O3 [20]. In a few states O3 related premature mortality modulated by anthropogenic NOX and VOC emissions reduction play an important role in the cumulative results (e.g., NJ and RI for NOX, IL, AR, KY and TN for biogenic VOCs, AZ and AL for anthropogenic VOCs) (Table 1).
Reduction in one precursor emission class (i.e., SO2, anthropogenic NOX, NH3, or VOCs) is estimated to be able to offset premature mortality induced by PM2.5 and O3 changes modulated by climate change in most of the states (Table 2). States with increases of more than 400 premature deaths will be able to offset those incidents by reducing SO2 or NH3 emissions. For the majority of the states with less than 400 deaths, the reduction in anthropogenic NOX emissions is estimated to be another feasible option to offset the increased premature mortality from climate-related air pollution increases. Reduction in VOC emissions works best in a few states. Nine states (i.e., IL, LA, KY, MS, IA, NM, DE, KS and VT) will be able to offset premature mortality by reducing 17% or less of their SO2, anthropogenic NOX or NH3 emissions while seven states (i.e., MA, CT, WA, OR, NH, ME, and RI) need reductions in more than one precursor emission class. Although in this study a domain wide emissions reduction has been applied, impacts of precursor emissions on air quality drop quickly with increasing distance between receptor and emission sources [43]. This suggests that emission controls in a specific state will have the major impact in air quality and the induced health effects within that state, except for some of the smaller, downwind states.

4. Conclusions

PM2.5 and O3 induced premature mortality modulated by climate change can be offset in most of the states by reducing only a single precursor emission class (e.g., NOX, SO2) based on the modeling approach followed here. Reduction in SO2 or anthropogenic NOX or NH3 emissions is found to be effective in most of the states although in few states VOC emission reductions can be most effective on a percent basis. Combining reductions in more than one pollutant precursor emission class will give synergistic results. As such, the information provided here will enhance the ability of air quality and public health managers to consider global change in their planning, combining the potential impact of climate change on PM2.5 and O3 - related premature mortalities with PM2.5 and O3 precursor emissions reduction strategies.

Acknowledgments

This work was supported by the National Center for Energy Policy (NCEP) and the U.S. EPA STAR grants: RD83096001, RD82897602, RD83183801 and RD83107601.

References

  1. Curtis, L; Rea, W; Smith-Willis, P; Fenyves, E; Pan, Y. Adverse health effects of outdoor air pollutants. Environ. Int 2006, 32, 815–830. [Google Scholar]
  2. World Health Organization. Estimated Deaths & DALYs Attributable to Selected Environmental Risk Factors; 2007; Available online: www.who.int/quantifying_ehimpacts/countryprofilesebd.xls (accessed on 20 April 2010).
  3. Ostro, B. Outdoor Air Pollution: Assessing the Environmental Burden of Disease at National and Local Levels; WHO Environmental Burden of Disease Series, No 5, World Health Organization: Geneva, Switzerland, 2004; p. viii. [Google Scholar]
  4. Bernard, SM; Samet, JM; Grambsch, A; Ebi, KL; Romieu, I. The potential impacts of climate variability and change on air pollution-related health effects in the United States. Environ. Health Perspect 2001, 109, 199–209. [Google Scholar]
  5. Peng, RD; Dominici, F; Pastor-Barriuso, R; Zeger, SL; Samet, JM. Seasonal analyses of air pollution and mortality in 100 US cities. Am. J. Epidemiol 2005, 161, 585–594. [Google Scholar]
  6. Ballester, F; Medina, S; Boldo, E; Goodman, P; Neuberger, M; Iniguez, C; Kunzli, N. Reducing ambient levels of fine particulates could substantially improve health: A mortality impact assessment for 26 European cities. J. Epidemiol. Community Health 2008, 62, 98–105. [Google Scholar]
  7. Araujo, JA; Barajas, B; Kleinman, M; Wang, XP; Bennett, BJ; Gong, KW; Navad, M; Harkema, J; Sioutas, C; Lusis, AJ; Nel, AE. Ambient particulate pollutants in the ultrafine range promote early atherosclerosis and systemic oxidative stress. Circ. Res 2008, 102, 589–596. [Google Scholar]
  8. Jerrett, M; Burnett, RT; Pope, CA; Ito, K; Thurston, G; Krewski, D; Shi, Y; Calle, E; Thun, M. Long-Term Ozone Exposure and Mortality. N. Engl. J. Med 2009, 360, 1085–1095. [Google Scholar]
  9. Bell, ML; Goldberg, R; Hogrefe, C; Kinney, PL; Knowlton, K; Lynn, B; Rosenthal, J; Rosenzweig, C; Patz, JA. Climate change, ambient ozone, and health in 50 US cities. Clim. Change 2007, 82, 61–76. [Google Scholar]
  10. Ebi, KL; Paulson, JA. Climate change and children. Pediatr. Clin. N. Am 2007, 54, 213–226. [Google Scholar]
  11. Ebi, KL; McGregor, G. Climate change, tropospheric ozone and particulate matter, and health impacts. Environ. Health Perspect 2008, 116, 1449–1455. [Google Scholar]
  12. Jacob, DJ; Winner, DA. Effect of climate change on air quality. Atmos. Environ 2009, 43, 51–63. [Google Scholar]
  13. Liao, K-J; Tagaris, E; Manomaiphiboon, K; Napelenok, SL; Woo, J-H; He, S; Amar, P; Russell, AG. Sensitivity of ozone and fine particulate matter formation to emissions under the impact of potential future climate change. Environ. Sci. Technol 2007, 41, 8355–8361. [Google Scholar]
  14. Mickley, LJ; Jacobs, DJ; Field, BD; Rind, D. Effects of future climate change on regional air pollution episodes in the United States. Geophys. Res. Lett 2004, 31, L24103. [Google Scholar]
  15. Webster, PJ; Holland, GJ; Curry, LA; Chang, HR. Changes in tropical cyclone number, duration and intensity in a warming environment. Science 2005, 309, 1844–1846. [Google Scholar]
  16. Hogrefe, C; Lynn, B; Civerolo, K; Ku, J-Y; Rosenthal, J; Rosenzweig, C; Goldberg, R; Gaffin, S; Knowlton, K; Kinney, PL. Simulating changes in regional air pollution over the eastern United States due to changes in global and regional climate and emissions. J. Geophys. Res 2004, 109, D22301. [Google Scholar]
  17. Intergovernmental Panel on Climate Change (IPCC). Special Report on Emissions Scenarios: A Special Report of Working Group III of the Intergovernmental Panel on Climate Change; Nakićenović, N, Swart, R, Eds.; Cambridge University Press: New York, NY, USA, 2000. [Google Scholar]
  18. Weaver, CP; Liang, X-Z; Zhu, J; Adams, PJ; Amar, P; Avise, J; Caughey, M; Chen, J; Cohen, RC; Cooter, E; Dawson, JP; Gilliam, R; Gilliland, A; Goldstein, AH; Grambsch, A; Guenther, A; Harley, RA; He, S; Hemming, B; Hogrefe, C; Huang, H-C; Hunt, S; Jacob, D; Kinney, P; Kunkel, K; Lamarque, J-F; Lamb, B; Larkin, N; Leung, LR; Liao, K-J; Lin, J; Lynn, BH; Manomaiphiboon, K; Mass, C; McKenzie, D; Mickley, L; O’Neil, S; Nolte, C; Pandis, SN; Racherla, PN; Rosenzweig, C; Russell, AG; Salathe, E; Steiner, AL; Tagaris, E; Tao, Z; Wiedinmyer, C; Williams, A; Winner, D; Woo, J-H; Wu, S; Wuebbles, DJ. A preliminary synthesis of modeled climate change impacts on U.S. regional ozone concentrations. Bull. Am. Meteorol. Soc 2009, 90, 1843–1863. [Google Scholar]
  19. Knowlton, K; Rosenthal, JE; Hogrefe, C; Lynn, B; Gaffin, S; Goldberg, R; Rosenzweig, C; Civerolo, K; Ku, J-Y; Kinney, PL. Assessing ozone-related health impacts under a changing. Climate Environ. Health Perspect 2004, 112, 1557–1563. [Google Scholar]
  20. Tagaris, E; Liao, K-J; DeLucia, AJ; Deck, L; Amar, P; Russell, AG. Potential impact of climate change on air pollution-related human health effects. Environ. Sci. Technol 2009, 43, 4979–4988. [Google Scholar]
  21. Rind, D; Lerner, J; Shah, K; Suozzo, R. Use of on line tracers as a diagnostic tool in general circulation model development: 2. Transport between the troposphere and the stratosphere. J. Geophys. Res. Atmos 1999, 104, 9151–9167. [Google Scholar]
  22. Grell, G; Dudhia, J; Stauffer, DR. A Description of The Fifth Generation Penn State/NCAR Mesoscale Model (MM5), NCAR Tech. Note, NCAR/TN-398+STR, Natl. Cent for Atmos. Res.: Boulder, CO, USA,1994.
  23. Byun, D; Schere, KL. Review of the governing equations, computational algorithms, and other components of the Models-3 Community Multscale Air Quality (CMAQ) modeling system. Appl. Mech. Rev 2006, 59, 51–77. [Google Scholar]
  24. Tagaris, E; Manomaiphiboon, K; Liao, K-J; Leung, L-R; Woo, J-H; He, S; Amar, P; Russell, AG. Impacts of global climate change and emissions on regional ozone and fine particulate matter concentrations over the United States. J. Geophys. Res. Atmos 2007, 112, D14312. [Google Scholar]
  25. Leung, LR; Gustafson, WI. Potential regional climate change and implications to US air quality. Geophys. Res. Lett 2005, 32, L16711. [Google Scholar]
  26. Carter, WPL. Documentation of the SAPRC-99 Chemical Mechanism for VOC Reactivity Assessment, Final Report to CA Air Resources Board, contract no. 92–329, and 95–3082000.
  27. Dunker, AM. Efficient calculation of sensitivity coefficients for complex atmospheric models. Atmos. Environ 1981, 15, 1155–1161. [Google Scholar]
  28. Dunker, AM. The decoupled direct method for calculating sensitivity coefficients in chemical-kinetics. J. Chem. Phys 1984, 81, 2385–2393. [Google Scholar]
  29. Yang, YJ; Wilkinson, JG; Russell, AG. Fast, direct sensitivity analysis of multidimensional photochemical models. Environ. Sci. Technol 1997, 31, 2859–2868. [Google Scholar]
  30. Dunker, AM; Yarwood, G; Ortmann, JP; Wilson, GM. The decoupled direct method for sensitivity analysis in a three dimensional air quality model—Implementation, accuracy, and efficiency. Environ. Sci. Technol 2002, 36, 2965–2976. [Google Scholar]
  31. Hakami, A; Odman, MT; Russell, AG. Nonlinearity in atmospheric response: A direct sensitivity analysis approach. J. Geophys. Res. Atmos 2004, 109, D15303. [Google Scholar]
  32. Cohan, DS; Hakami, A; Hu, YT; Russell, AG. Nonlinear response of ozone to emissions: Source apportionment and sensitivity analysis. Environ. Sci. Technol 2005, 39, 6739–6748. [Google Scholar]
  33. Napelenok, SL; Cohan, DS; Hu, YT; Russell, AG. Decoupled direct 3D sensitivity analysis for particulate matter (DDM-3D/PM). Atmos. Environ 2006, 40, 6112–6121. [Google Scholar]
  34. U. S. EPA. Air Quality Criteria for Particulate Matter; EPA/600/P-99/002aF; Washington, DC, USA, 2004. [Google Scholar]
  35. U.S. EPA. Air Quality Criteria for Ozone and Related Photochemical Oxidants; EPA600/R-05/004aF; Washington, DC, USA, 2006. [Google Scholar]
  36. U.S. EPA. Final Regulatory Impact Analysis: PM2.5 NAAQS.
  37. U. S. EPA. Final Ozone NAAQS Regulatory Impact Analysis.
  38. Bell, ML; McDermott, A; Zeger, SL; Samet, JM; Dominici, F. Ozone and short-term mortality in 95 US urban communities,1987–2000. J. Am. Med. Assoc 2004, 292, 2372–2378. [Google Scholar]
  39. Pope, CA; Burnett, RT; Thun, MJ; Calle, EE; Krewski, D; Ito, K; Thurston, GD. Lung cancer, cardiopulmonary mortality, and long-term exposure to fine particulate air pollution. J. Am. Med. Assoc 2002, 287, 1132–1141. [Google Scholar]
  40. Tagaris, E; Liao, K-J; Manomaiphiboon, K; Woo, J-H; He, S; Amar, P; Russell, AG. Impacts of future climate change and emissions reductions on nitrogen and sulfur deposition over the United States. Geophys. Res. Lett 2008, 35, L08811. [Google Scholar]
  41. Seinfeld, J; Pandis, SN. Atmospheric Chemistry and Physics; John Wiley: Hoboken, NJ, USA, 1998. [Google Scholar]
  42. Woo, J-H; He, S; Tagaris, E; Liao, K-J; Manomaiphiboon, K; Amar, P; Russell, AG. Development of North American emission inventories for air quality modeling under climate change. J. Air Waste Manage. Assoc 2008, 58, 1483–1494. [Google Scholar]
  43. Napelenok, SL; Flabermacher, FD; Akhtar, F; Hu, Y; Russell, AG. Area of influence (AOI) sensitivity analysis: Application to Atlanta, Georgia. Atmos. Environ 2007, 41, 5605–5617. [Google Scholar]
Figure 1. Daily average PM2.5 and O3 sensitivities* per 1% reduction in domain-wide SO2, anthropogenic NOX, NH3, biogenic or anthropogenic VOC emissions in 2050.* Positive sensitivity (+): Reductions in precursor emissions decrease pollutant concentrations.Negative sensitivity (−): Reductions in precursor emissions increase pollutant concentrations.
Ijerph 07 02222f1
Table 1. State specific PM2.5, O3, and total premature mortality change in 2050 compared to 2001 and the sensitivity per 1% reduction in SO2, anthropogenic NOX, NH3, anthropogenic VOC or biogenic VOC emissions.
Mortality Change (number of incidents)
Caused by changes in concentrations*Caused by 1% decrease in SO2 emissionsCaused by 1% decrease in anthropogenic NOx emissionsCaused by 1% decrease in NH3 emissionsCaused by 1% decrease in biogenic VOC emissionsCaused by 1% decrease in anthropogenic VOC emissions
PM2.5O3TotalPM2.5O3TotalPM2.5O3TotalPM2.5O3TotalPM2.5O3TotalPM2.5O3Total
AL−8423−61−6.55−0.01−6.56−3.26−1.05−4.32−4.700.02−4.68−1.19−0.21−1.400.00−0.30−0.30
AZ601979−3.67−0.01−3.67−2.18−1.08−3.25−2.150.01−2.14−2.28−0.18−2.470.00−0.17−0.17
AR−7221−51−6.34−0.01−6.35−4.86−0.62−5.47−5.020.02−5.000.12−0.18−0.060.21−0.190.03
CA−18682−104−7.44−0.02−7.46−11.35−4.77−16.13−8.420.07−8.35−13.50−1.15−14.64−0.93−1.70−2.63
CO58−454−1.40−0.01−1.41−1.07−1.09−2.16−1.450.02−1.43−0.53−0.11−0.640.03−0.09−0.06
CT232−3229−2.710.00−2.71−1.400.18−1.22−4.250.01−4.24−0.75−0.05−0.80−0.39−0.10−0.48
DE8−17−0.870.00−0.87−0.580.03−0.55−1.020.00−1.02−0.04−0.02−0.06−0.09−0.03−0.12
DC202−0.090.00−0.09−0.040.00−0.04−0.110.00−0.11−0.010.00−0.01−0.010.00−0.01
FL−39630−366−21.960.00−21.96−5.41−2.41−7.81−10.570.03−10.55−3.77−0.50−4.260.18−0.56−0.38
GA−16334−129−8.650.00−8.65−4.38−1.24−5.62−6.700.03−6.68−2.10−0.34−2.44−0.10−0.48−0.58
ID23−518−0.360.00−0.36−0.50−0.12−0.62−0.490.00−0.49−1.180.02−1.16−0.02−0.01−0.02
IL396−17379−28.29−0.31−28.60−27.341.19−26.16−40.120.41−39.711.65−3.48−1.83−1.21−4.29−5.50
IN275−5270−8.94−0.01−8.96−8.050.25−7.80−13.980.02−13.970.28−0.200.07−0.68−0.26−0.94
IA32−824−1.98−0.03−2.01−3.39−0.15−3.55−3.560.05−3.510.34−0.120.230.01−0.15−0.14
KS617−0.87−0.03−0.90−0.87−0.97−1.84−0.820.05−0.770.11−0.28−0.170.04−0.23−0.19
KY52860−15.51−0.02−15.54−7.59−0.07−7.66−18.200.02−18.18−0.03−0.31−0.34−0.49−0.36−0.86
LA573289−9.58−0.01−9.59−4.13−1.01−5.14−5.930.02−5.91−0.95−0.28−1.240.11−0.24−0.13
ME46−442−0.670.00−0.67−0.30−0.04−0.34−0.870.00−0.86−0.590.01−0.58−0.05−0.02−0.07
MD90−387−5.560.00−5.56−2.790.09−2.70−6.750.00−6.75−0.39−0.05−0.44−0.54−0.08−0.62
MA328−6322−4.360.00−4.36−1.750.19−1.56−6.220.01−6.20−1.36−0.09−1.45−0.43−0.20−0.63
MI624−43581−11.81−0.04−11.85−8.71−0.01−8.72−17.200.05−17.15−2.47−0.17−2.64−0.72−0.60−1.32
MN218−26192−4.75−0.06−4.81−7.58−0.16−7.74−9.780.09−9.70−1.89−0.04−1.93−0.37−0.12−0.49
MS331447−11.89−0.01−11.90−6.37−0.66−7.02−8.380.01−8.37−1.63−0.12−1.750.15−0.16−0.02
MO−7819−59−25.81−0.03−25.83−24.07−0.59−24.66−28.340.04−28.302.38−0.272.100.41−0.320.08
MT16−412−0.280.00−0.28−0.22−0.08−0.30−0.400.00−0.40−0.290.01−0.280.00−0.01−0.01
NE−19−6−25−2.08−0.01−2.09−2.40−0.20−2.59−2.710.02−2.690.37−0.050.320.14−0.040.10
NV12113−0.440.00−0.44−0.38−0.05−0.43−0.450.00−0.45−0.970.00−0.97−0.020.00−0.02
NH60−258−0.900.00−0.90−0.46−0.01−0.47−1.430.00−1.43−0.570.00−0.57−0.08−0.03−0.10
NJ49716513−11.61−0.02−11.63−6.073.94−2.13−15.750.07−15.68−1.72−1.13−2.85−1.75−1.73−3.48
NM16420−1.910.00−1.92−1.01−0.19−1.20−1.160.00−1.16−0.44−0.02−0.460.06−0.010.05
NY846−3843−15.070.00−15.07−10.770.02−10.75−24.770.00−24.77−3.50−0.02−3.52−1.15−0.05−1.21
NC−959−86−8.22−0.02−8.24−4.66−0.79−5.45−7.670.05−7.62−0.90−0.66−1.56−0.30−0.92−1.21
ND−4−4−8−0.590.00−0.60−0.79−0.03−0.83−0.950.01−0.94−0.040.00−0.050.01−0.010.00
OH566−28538−12.55−0.02−12.57−7.730.85−6.87−20.360.04−20.33−0.40−0.48−0.88−0.93−0.70−1.63
OK−4316−27−7.82−0.01−7.84−5.97−0.75−6.73−6.000.02−5.980.69−0.180.510.28−0.160.12
OR79−1366−1.010.00−1.01−0.95−0.26−1.22−0.950.00−0.95−2.780.04−2.74−0.06−0.02−0.08
PA464−20444−12.560.00−12.56−7.070.38−6.69−18.850.02−18.83−1.30−0.22−1.53−1.08−0.41−1.49
RI43−142−0.630.00−0.63−0.220.12−0.11−0.840.00−0.84−0.14−0.04−0.19−0.07−0.08−0.15
SC−3513−22−3.560.00−3.56−2.04−0.51−2.55−3.150.02−3.13−0.63−0.26−0.90−0.11−0.35−0.46
SD−18−3−21−1.00−0.01−1.01−1.28−0.08−1.36−1.820.01−1.810.11−0.010.10−0.02−0.01−0.03
TN−8521−64−8.33−0.02−8.35−4.11−0.58−4.69−8.080.02−8.06−0.17−0.35−0.52−0.11−0.41−0.52
TX−536161−375−25.23−0.05−25.27−12.13−4.03−16.16−14.120.07−14.051.16−0.930.220.88−0.590.28
UT1−2−1−0.050.00−0.05−0.05−0.10−0.15−0.060.00−0.06−0.060.00−0.060.00−0.01−0.01
VT7−25−0.370.00−0.37−0.32−0.01−0.34−0.710.00−0.70−0.220.00−0.23−0.04−0.02−0.07
VA−21−1−2.880.00−2.88−1.05−0.02−1.07−3.100.00−3.09−0.28−0.06−0.35−0.14−0.10−0.24
WA139−11128−1.930.00−1.93−2.17−0.18−2.36−2.280.01−2.27−4.420.03−4.39−0.12−0.04−0.16
WV43−241−2.730.00−2.73−0.740.01−0.73−2.980.00−2.98−0.20−0.06−0.25−0.11−0.09−0.19
WI196−18178−4.04−0.02−4.06−4.73−0.05−4.77−5.790.04−5.75−0.69−0.08−0.77−0.19−0.18−0.37
WY2−20−0.140.00−0.14−0.07−0.07−0.14−0.170.00−0.17−0.100.00−0.100.000.00−0.01
*Mortality change caused by changes in concentrations has been published in Tagaris et al., 2009 [20].
Table 2. Individual precursor emissions reduction needed relative to 2001 emissions to offset cumulative premature mortality induced by PM2.5 and O3 changes modulated by climate change.
State*Premature mortality**Domain−wide emissions change (%)
SO2anthropogenic NOXNH3biogenic VOCsanthropogenic VOCs

1NY843−56>60−34>60>60

2MI581−49>60−34>60>60

3OH538−43>60−26>60>60

4NJ513−44>60−33>60>60

5PA444−35>60−24>60>60

6IL379−13−14−10>60>60

7MA322>60>60−52>60>60

8IN270−30−35−19>60

9CT229>60>60−54>60>60

10MN192−40−25−20>60>60

11WI178−44−37−31>60>60

12WA128>60−54−56−29>60

13LA89−9−17−15>60>60

14MD87−16−32−13>60>60

15AZ79−22−24−37−32>60

16OR66>60−54>60−24>60

17KY60−4−8−3>60>60

18NH58>60>60−41>60>60

19CO54−38−25−38>60>60

20MS47−4−7−6−27>60

21ME42>60>60−49>60>60

22RI42>60>60−50>60>60

23WV41−15−56−14>60>60

24IA24−12−7−7>60

25NM20−10−17−17−43

26ID18−50−29−37−16>60

27NV13−29−30−29−13>60

28MT12−43−40−30−42>60

29DE7−8−13−7>60−57

30KS7−8−4−9−40−36

31VT5−14−15−7−22>60

32DC2−23−49−18>60>60
*States with premature mortality increase;
**Premature mortality change has been published in Tagaris et al., 2009 [20].

