Satellite Derived Forest Phenology and Its Relation with Nephropathia Epidemica in Belgium


Abstract
:
1. Introduction
2. Methods
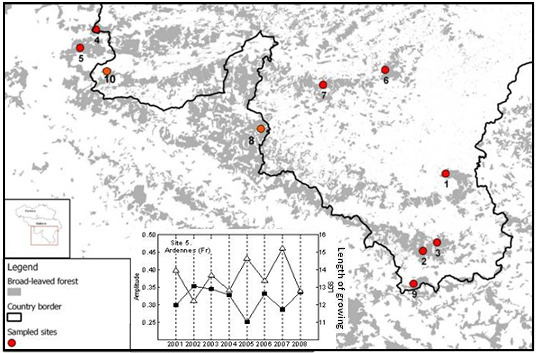
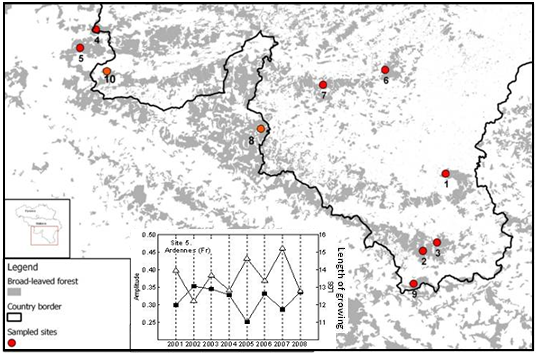
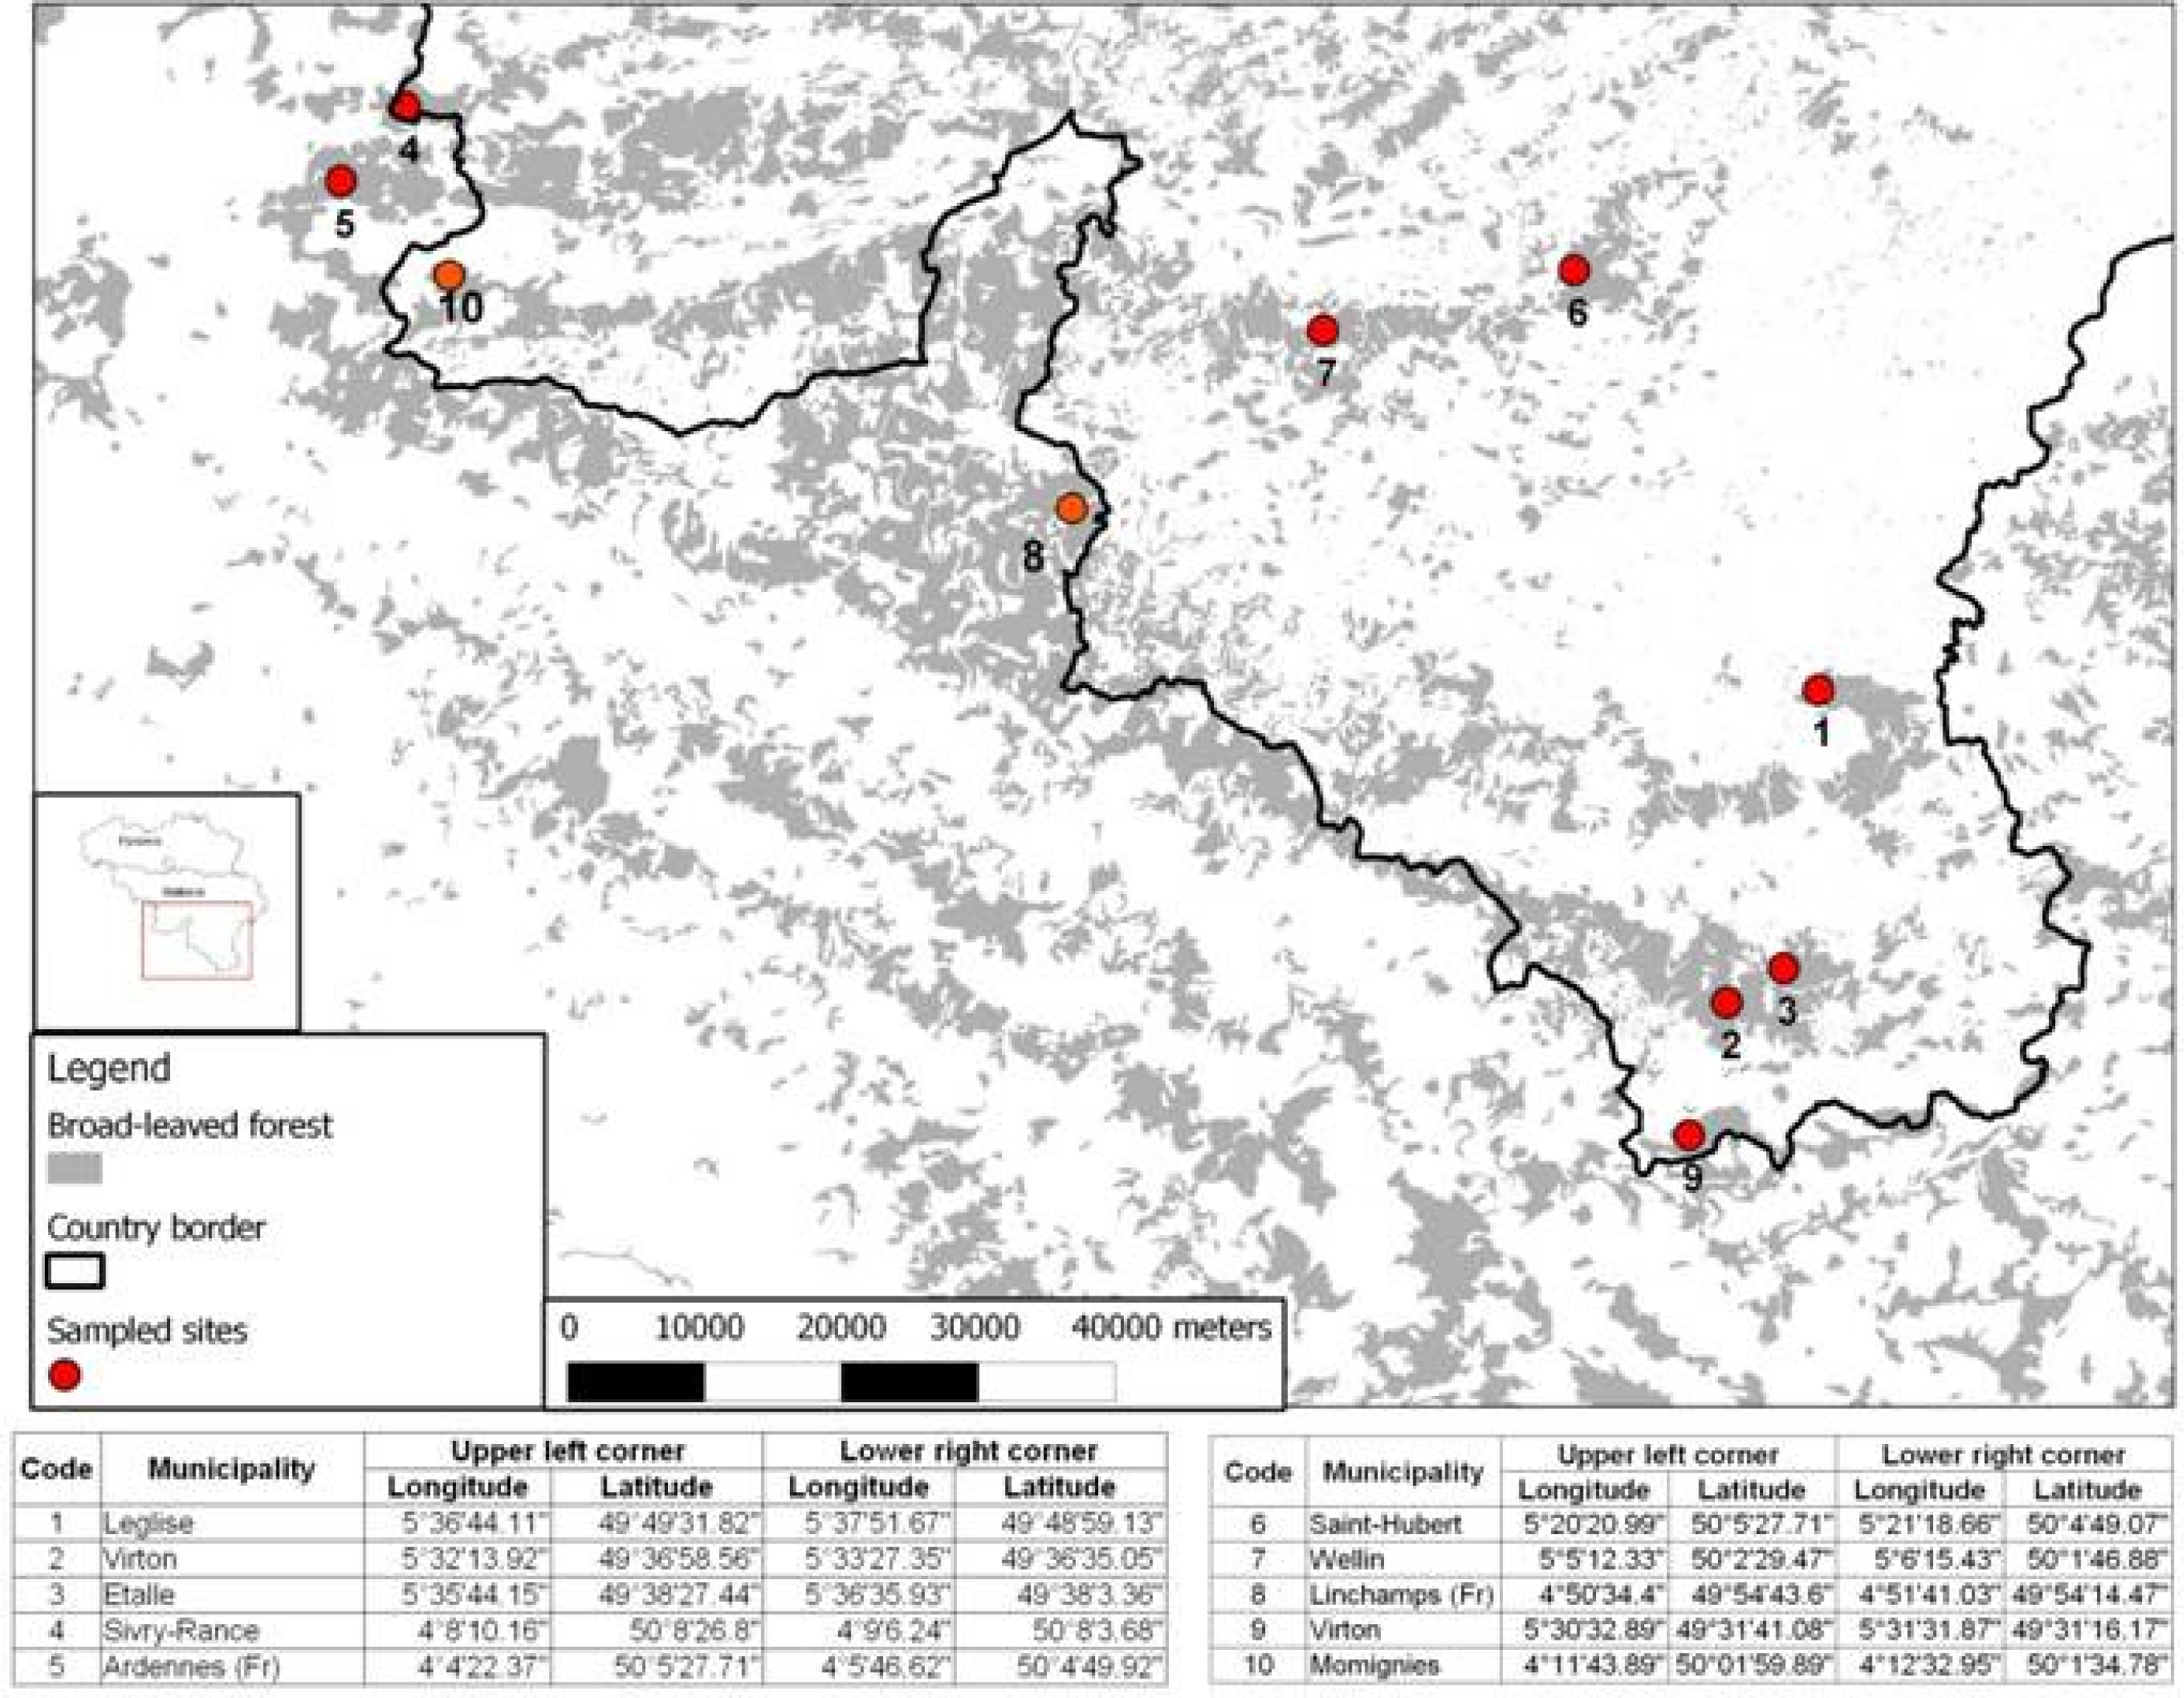
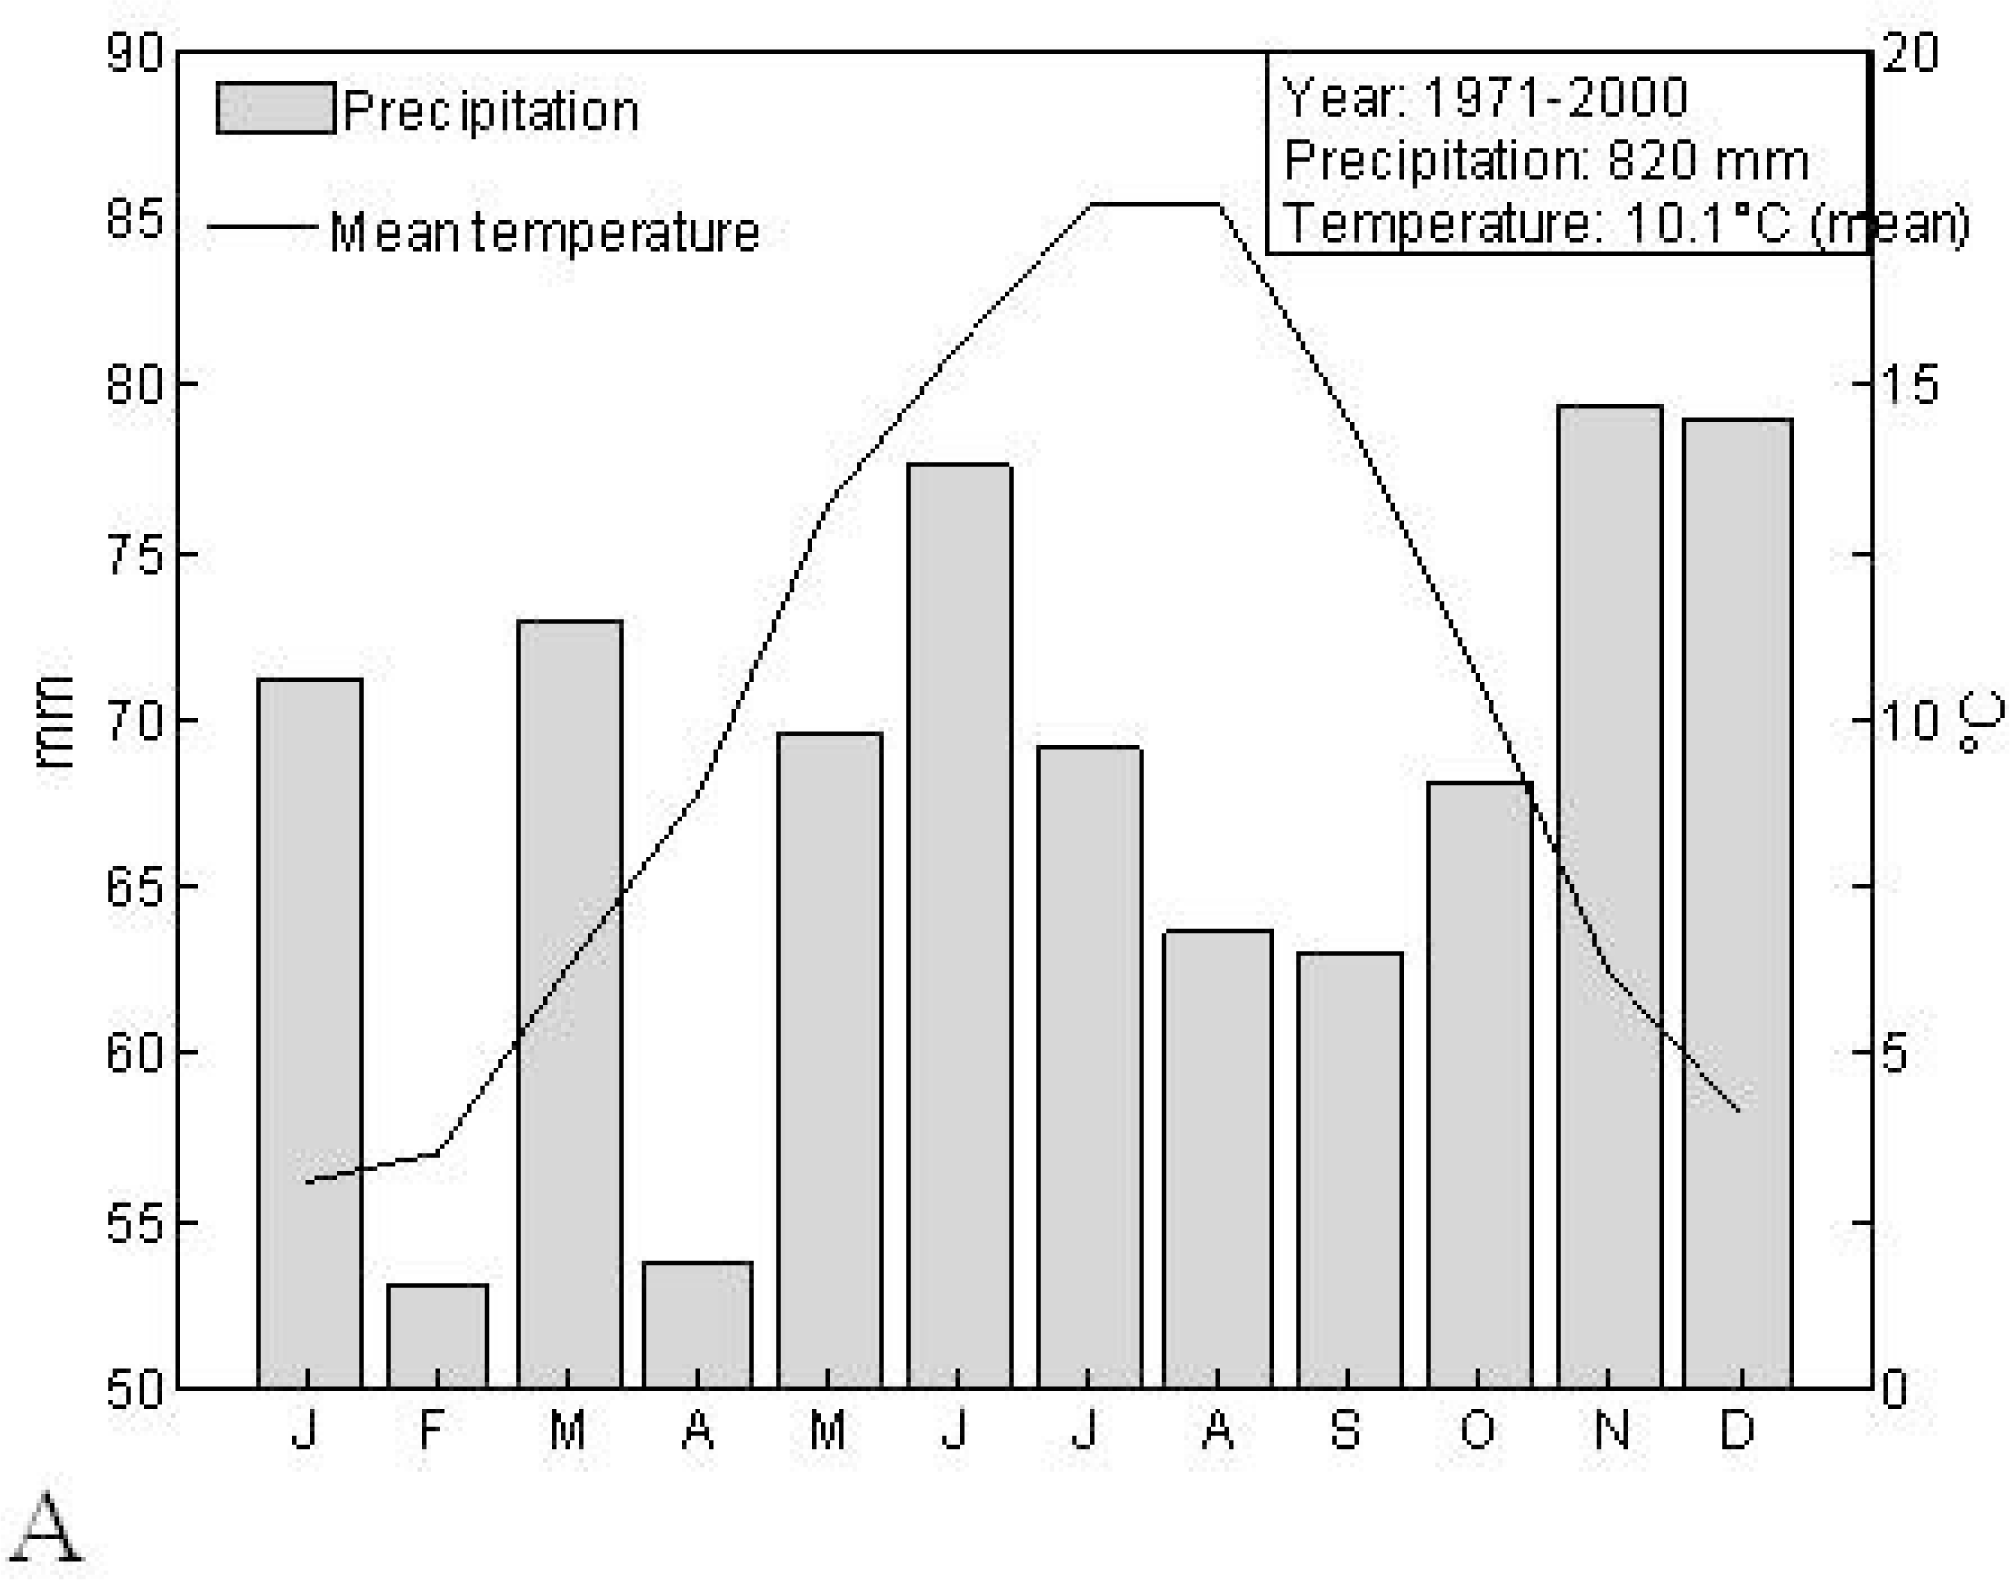
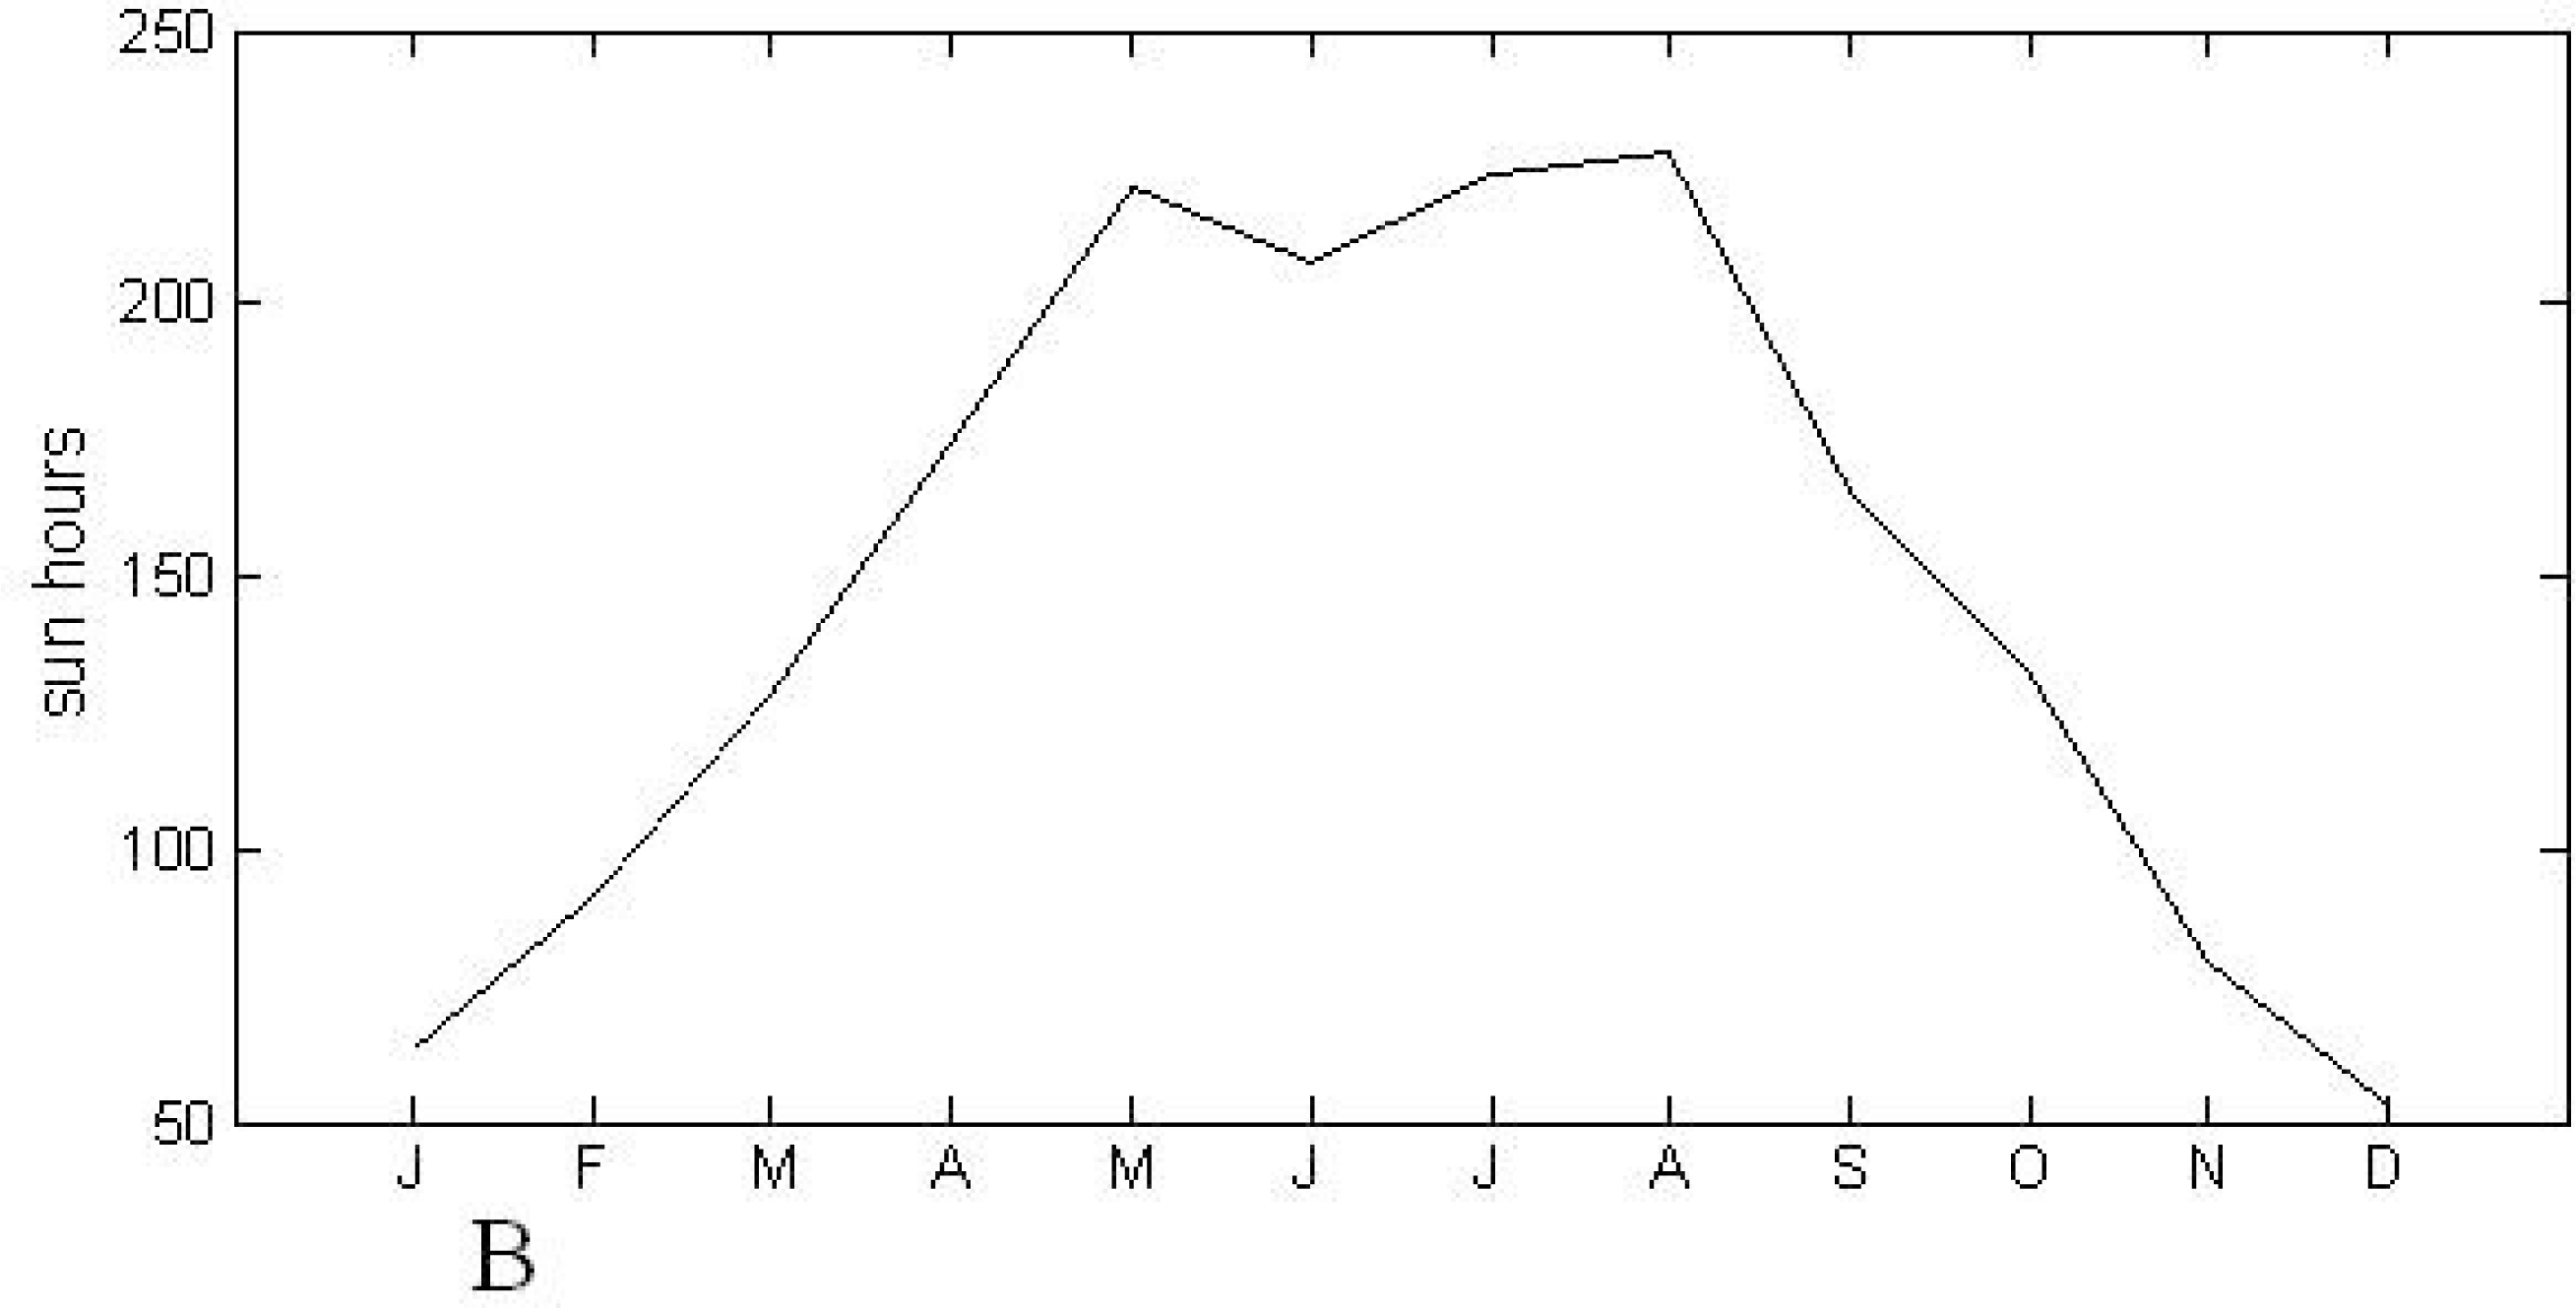
2.1. Study Area
2.2. MODIS EVI Time Series
2.2.1. Extracting EVI values
2.2.2. EVI time series and phenological parameters
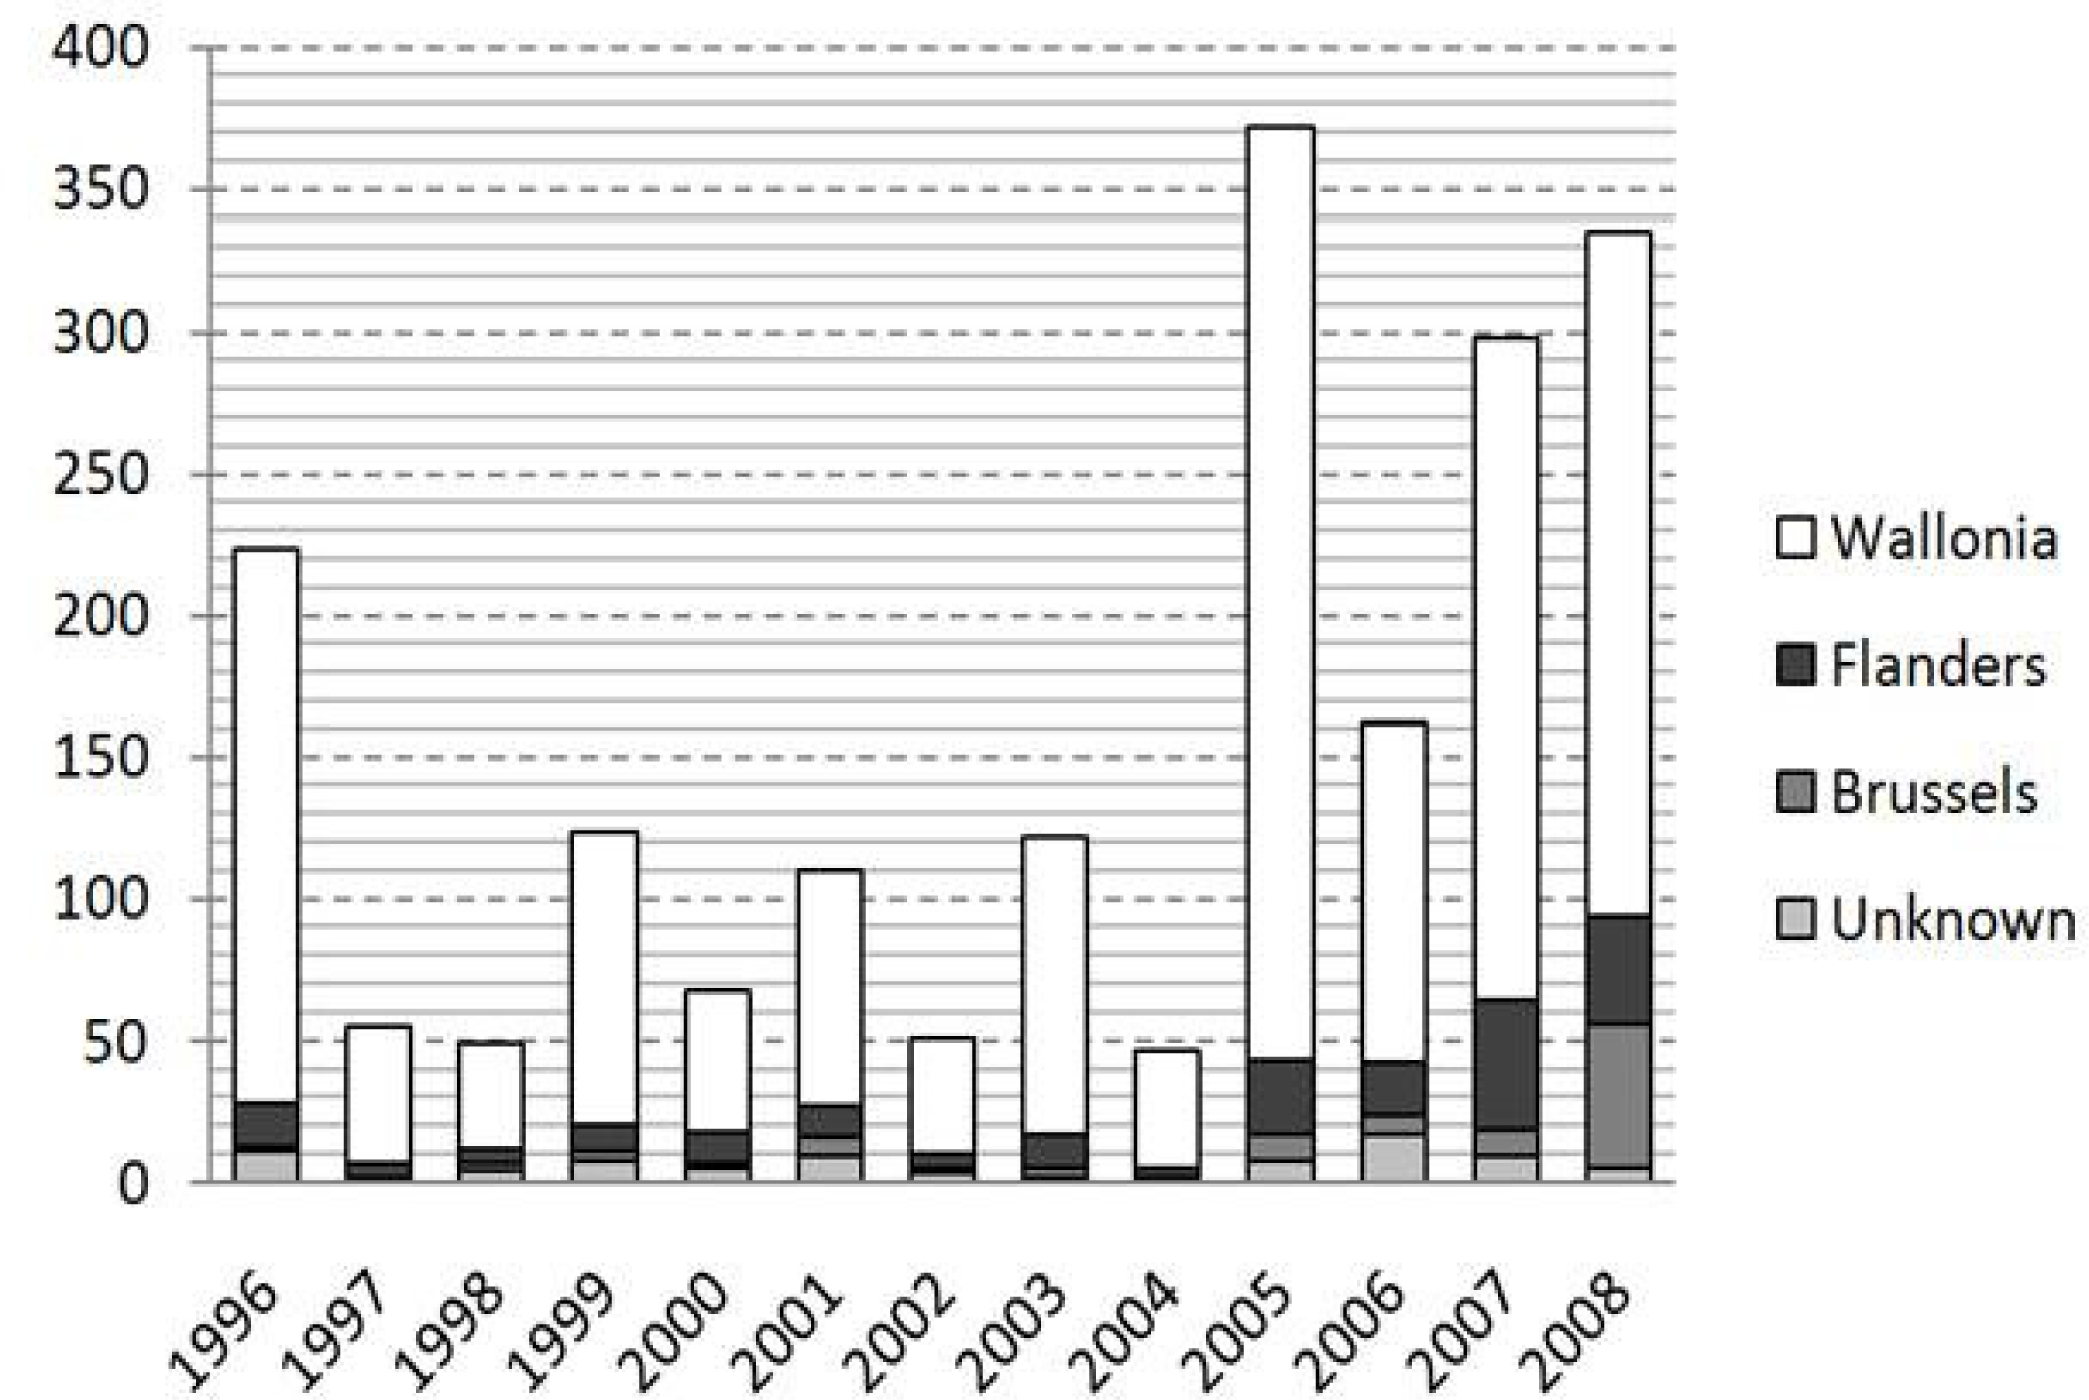
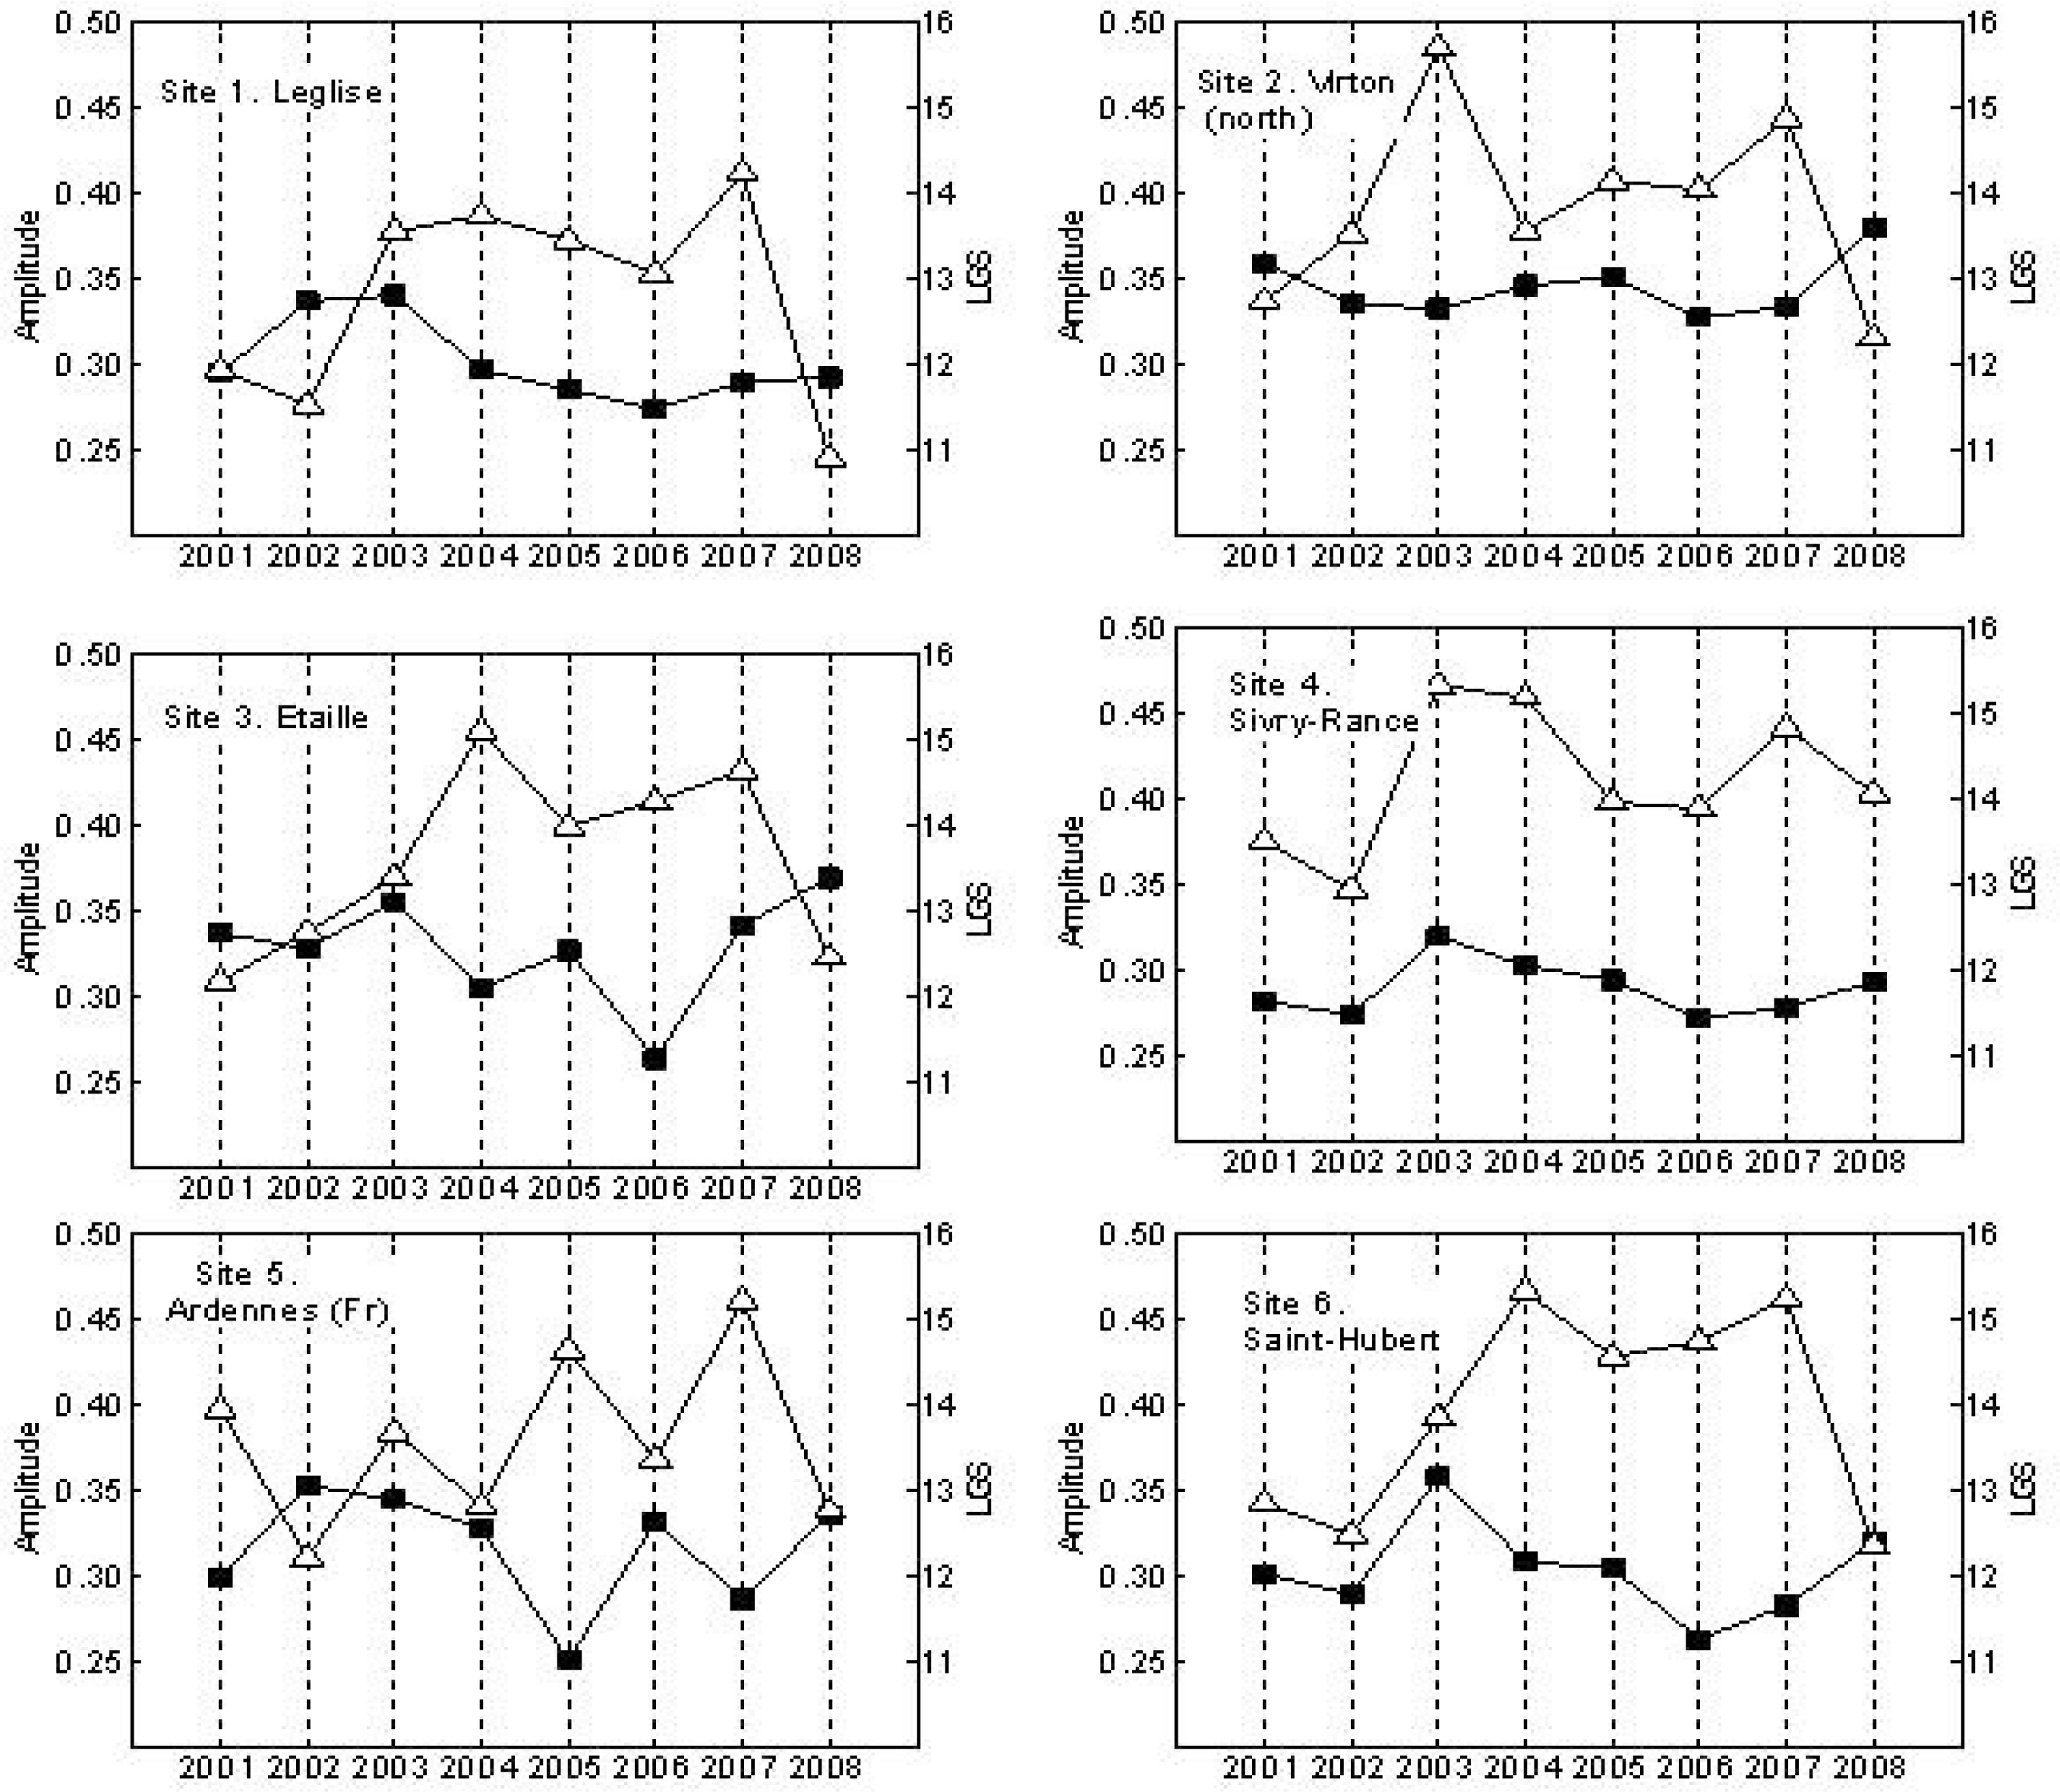
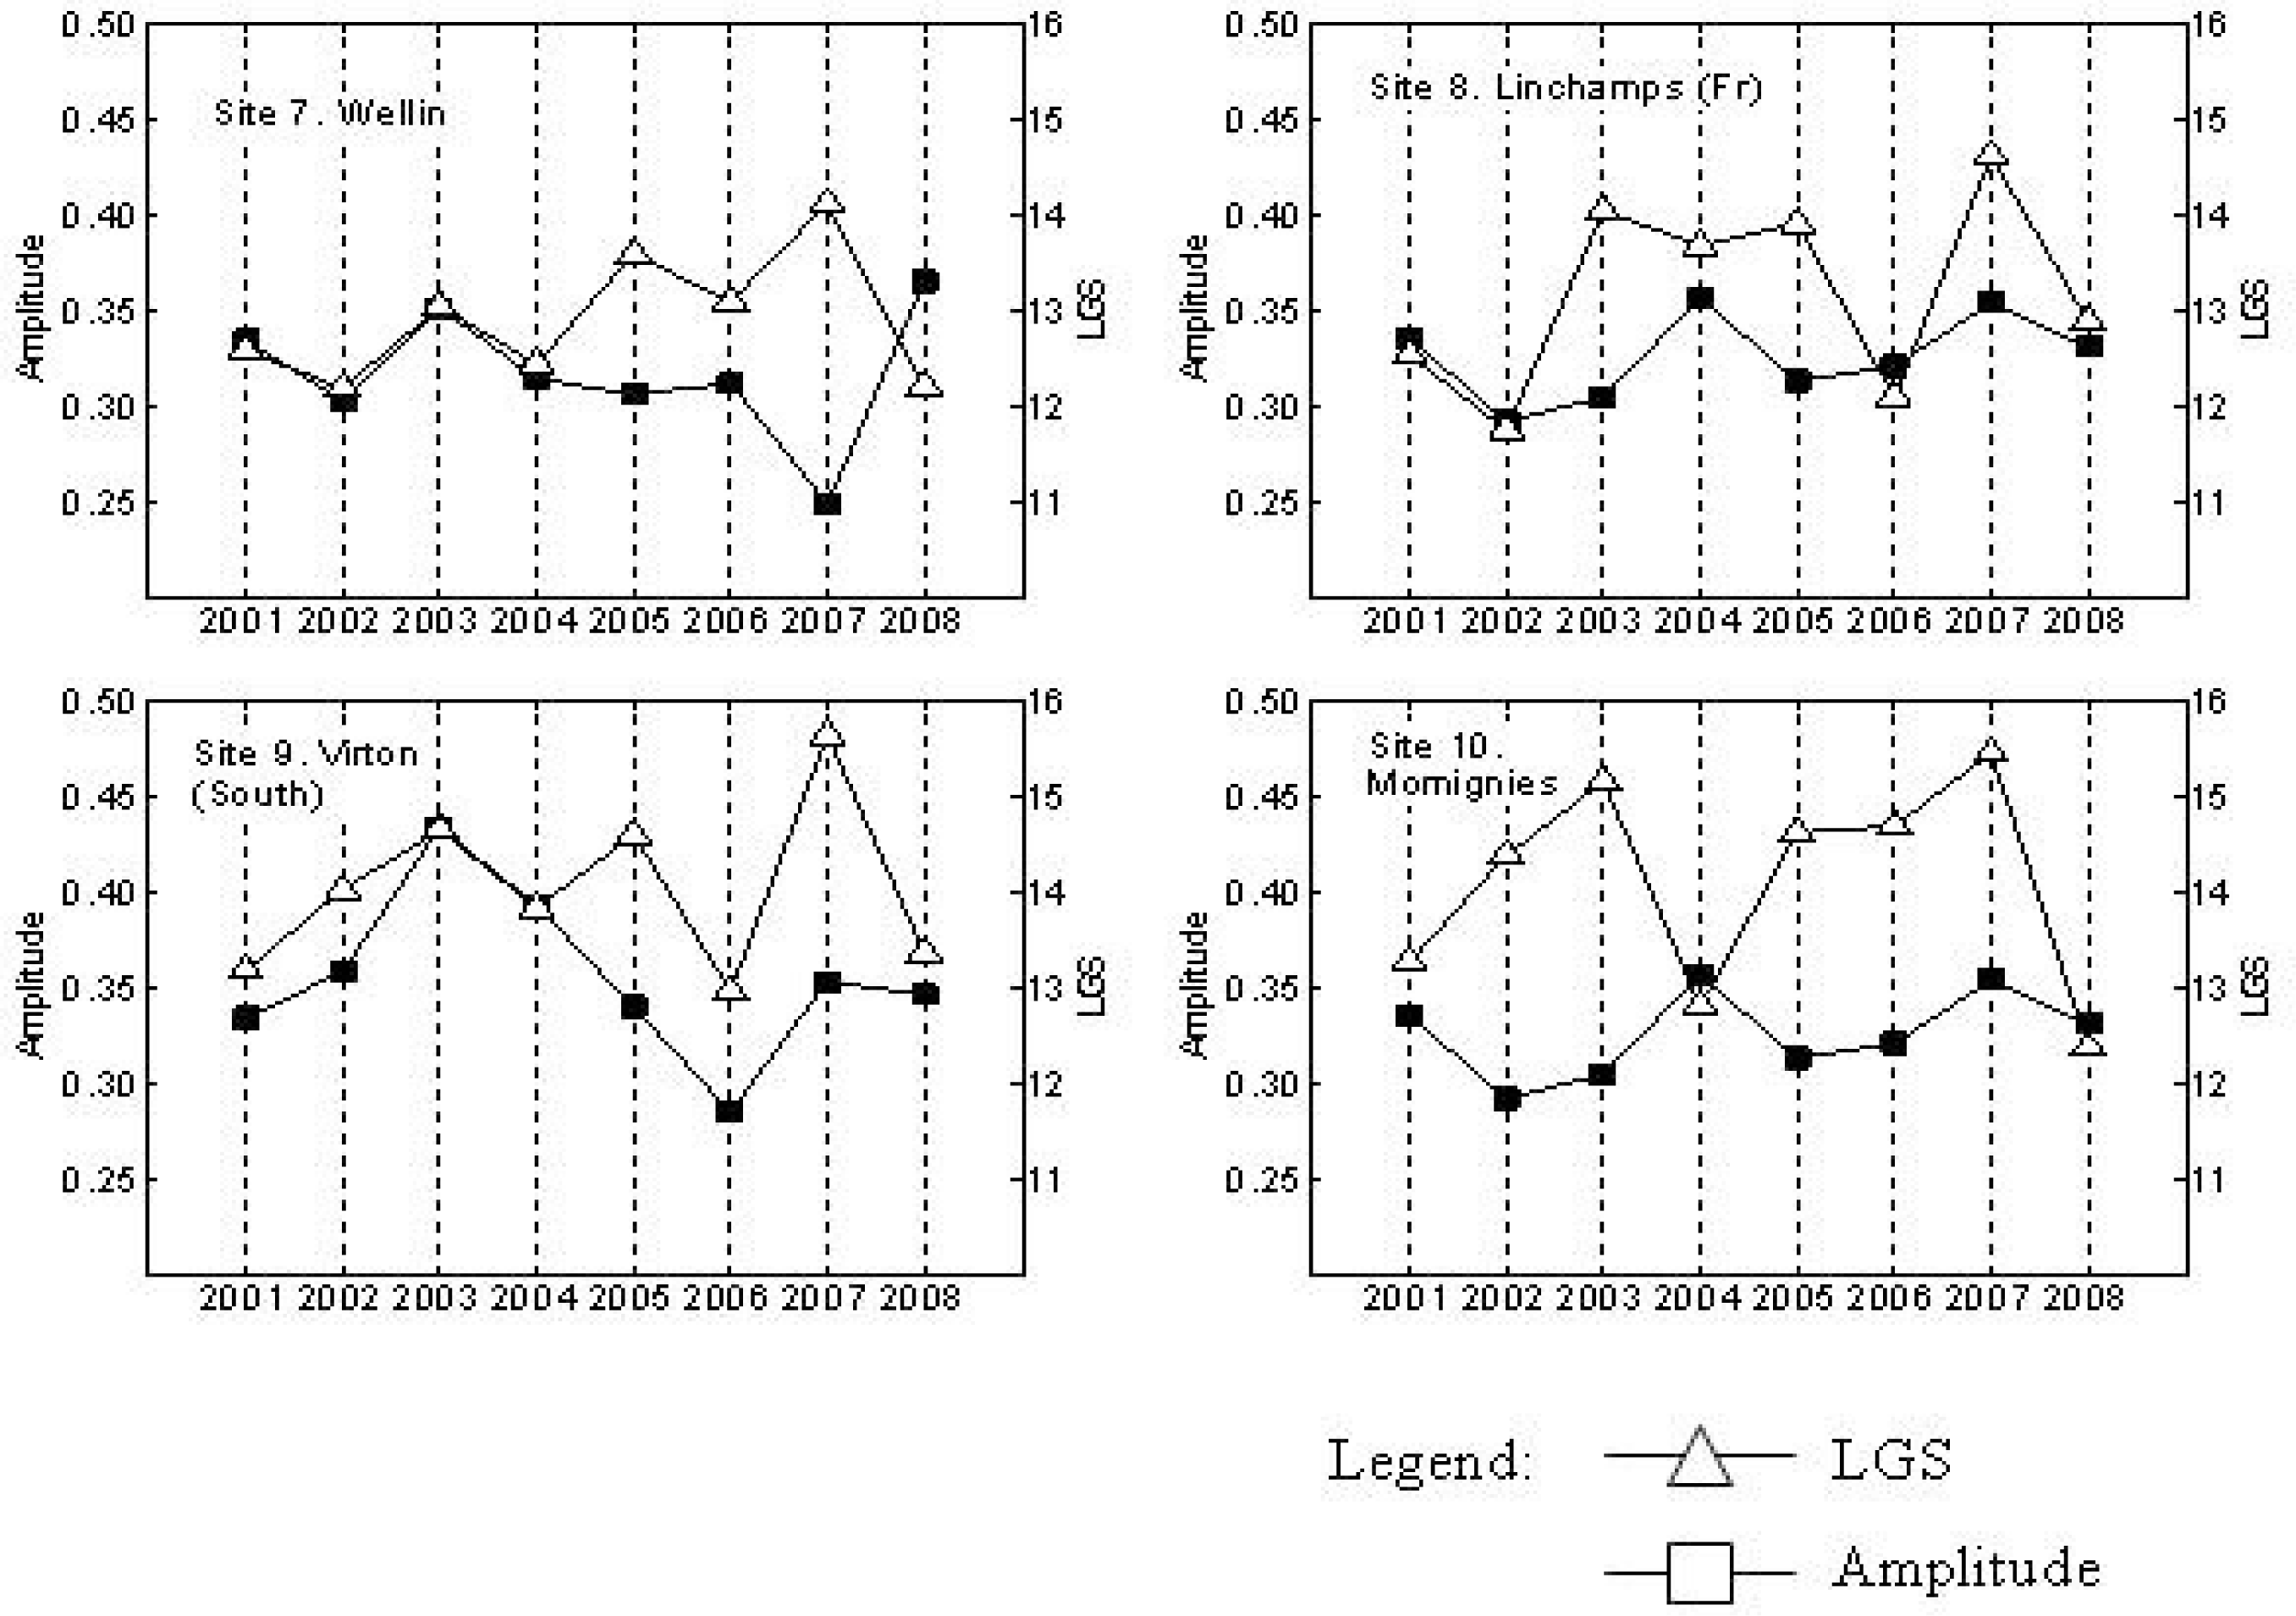
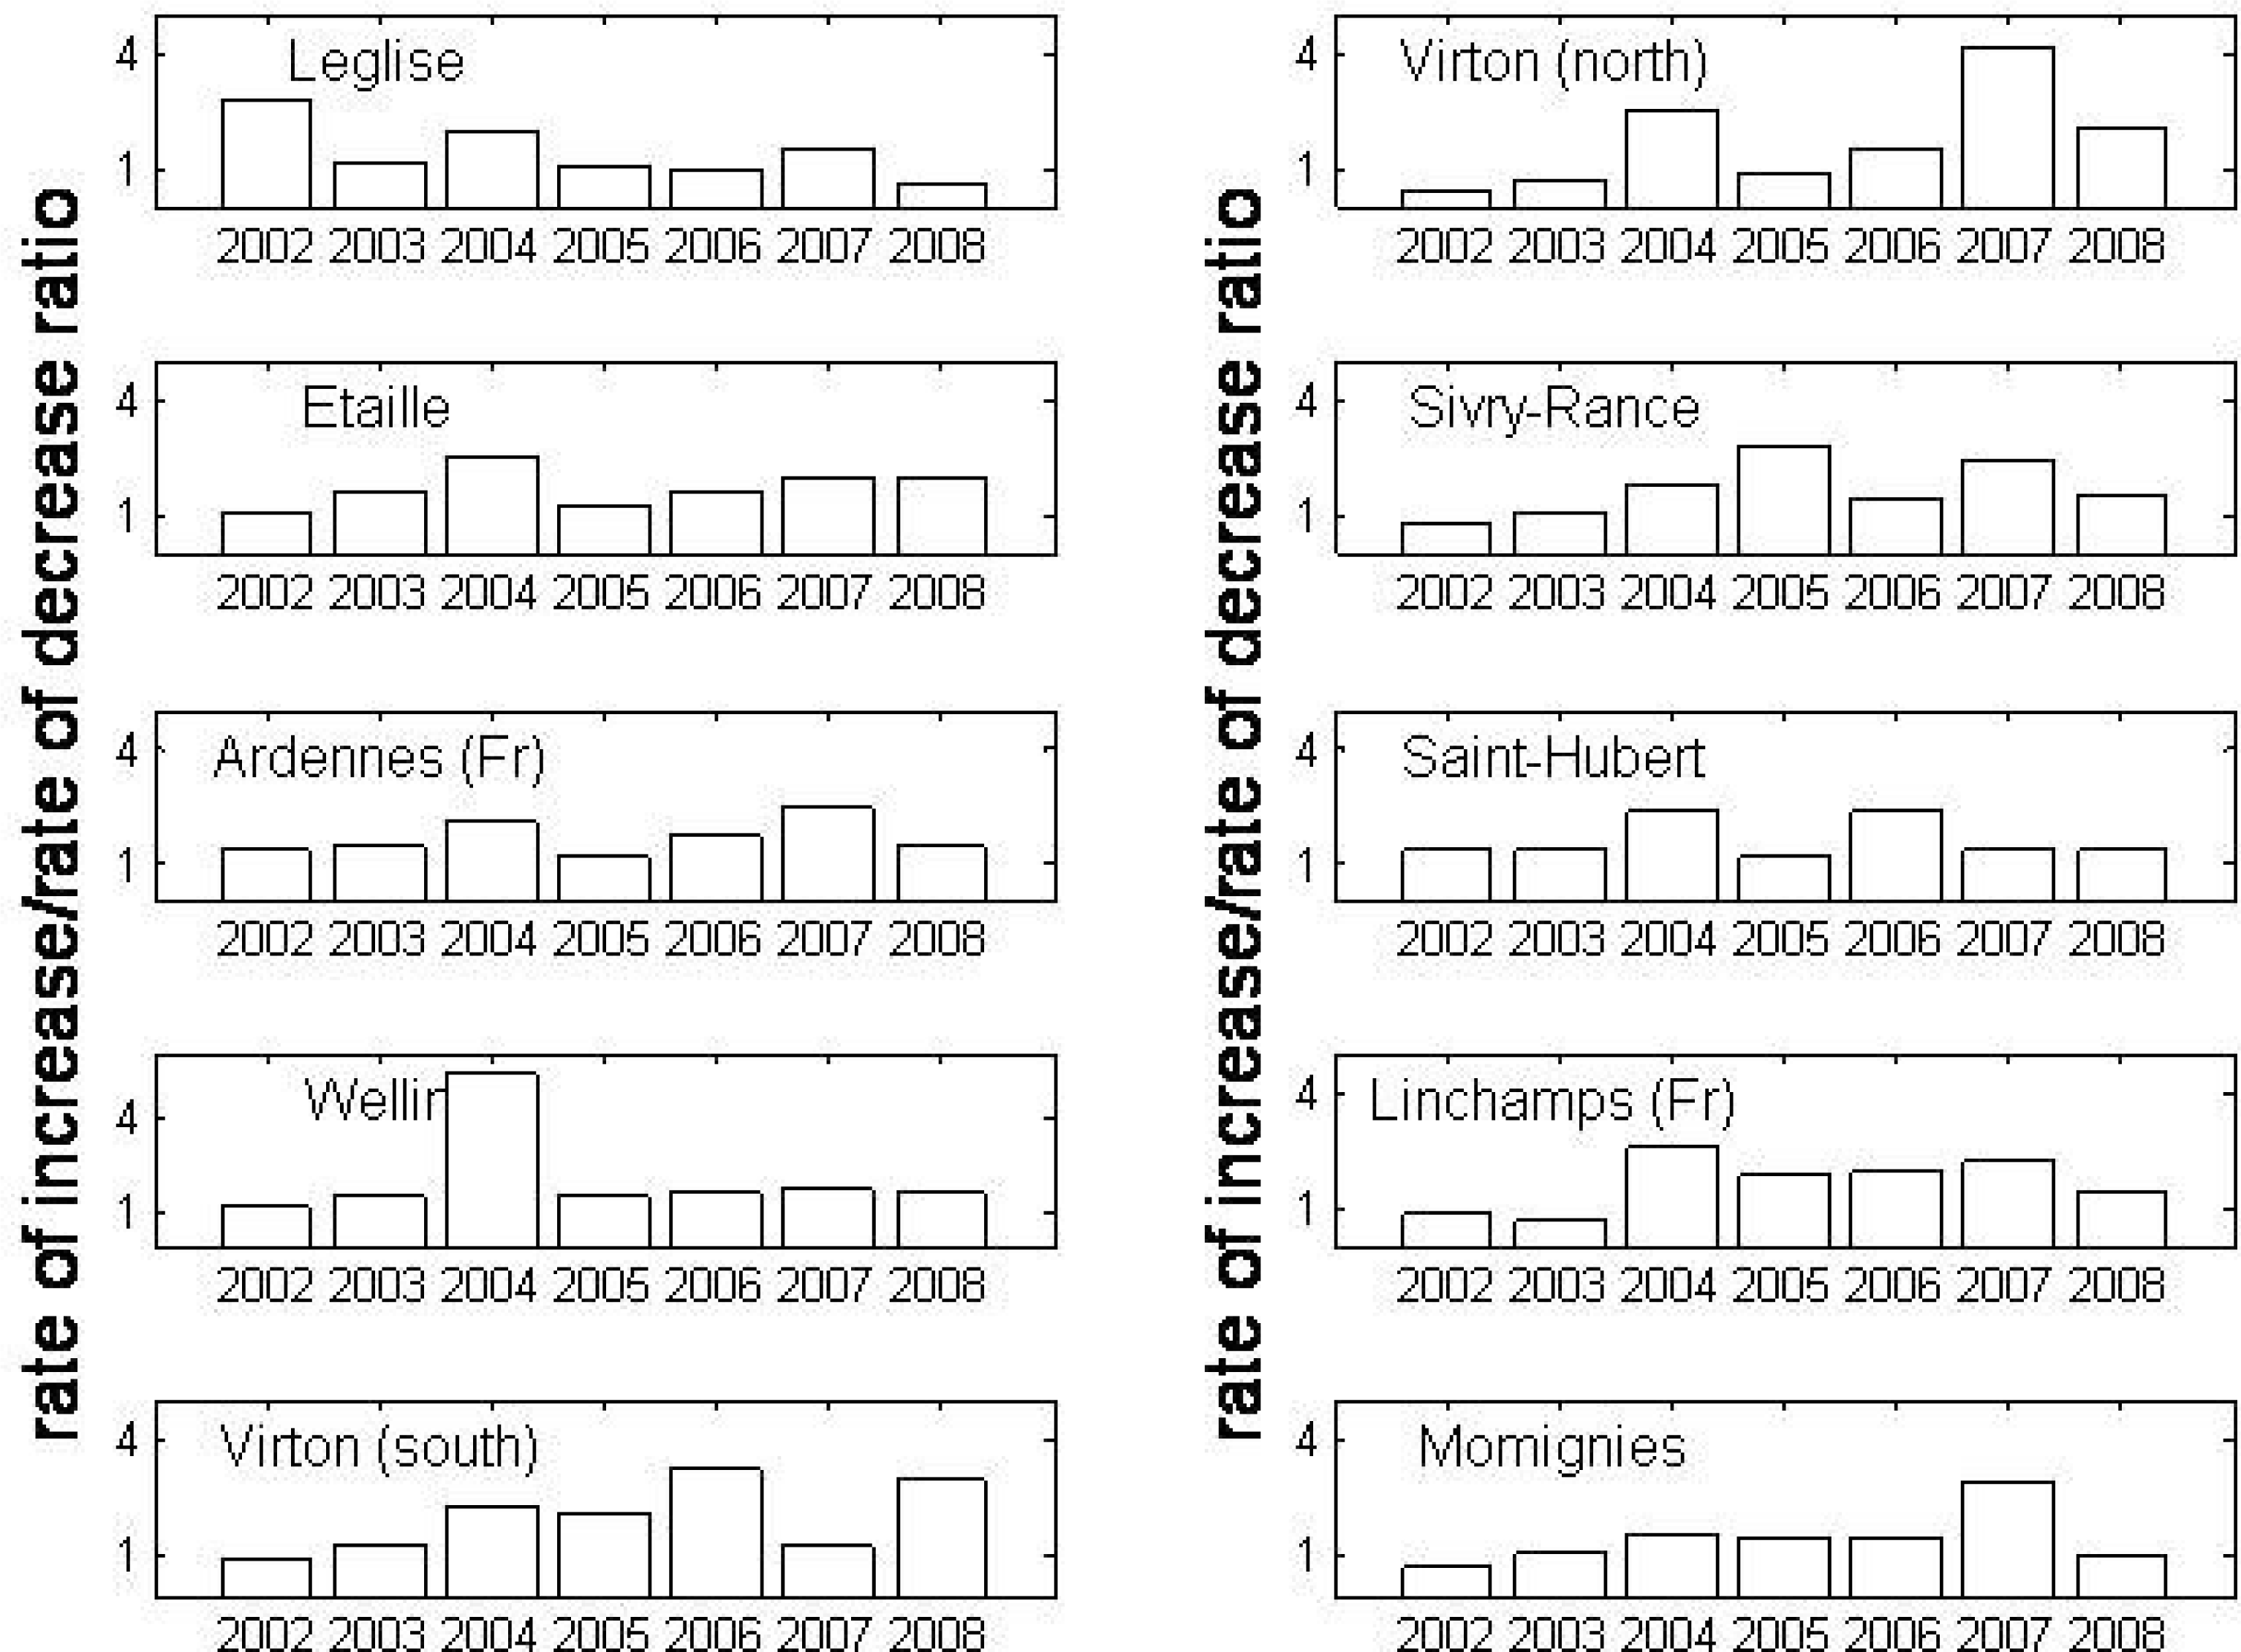
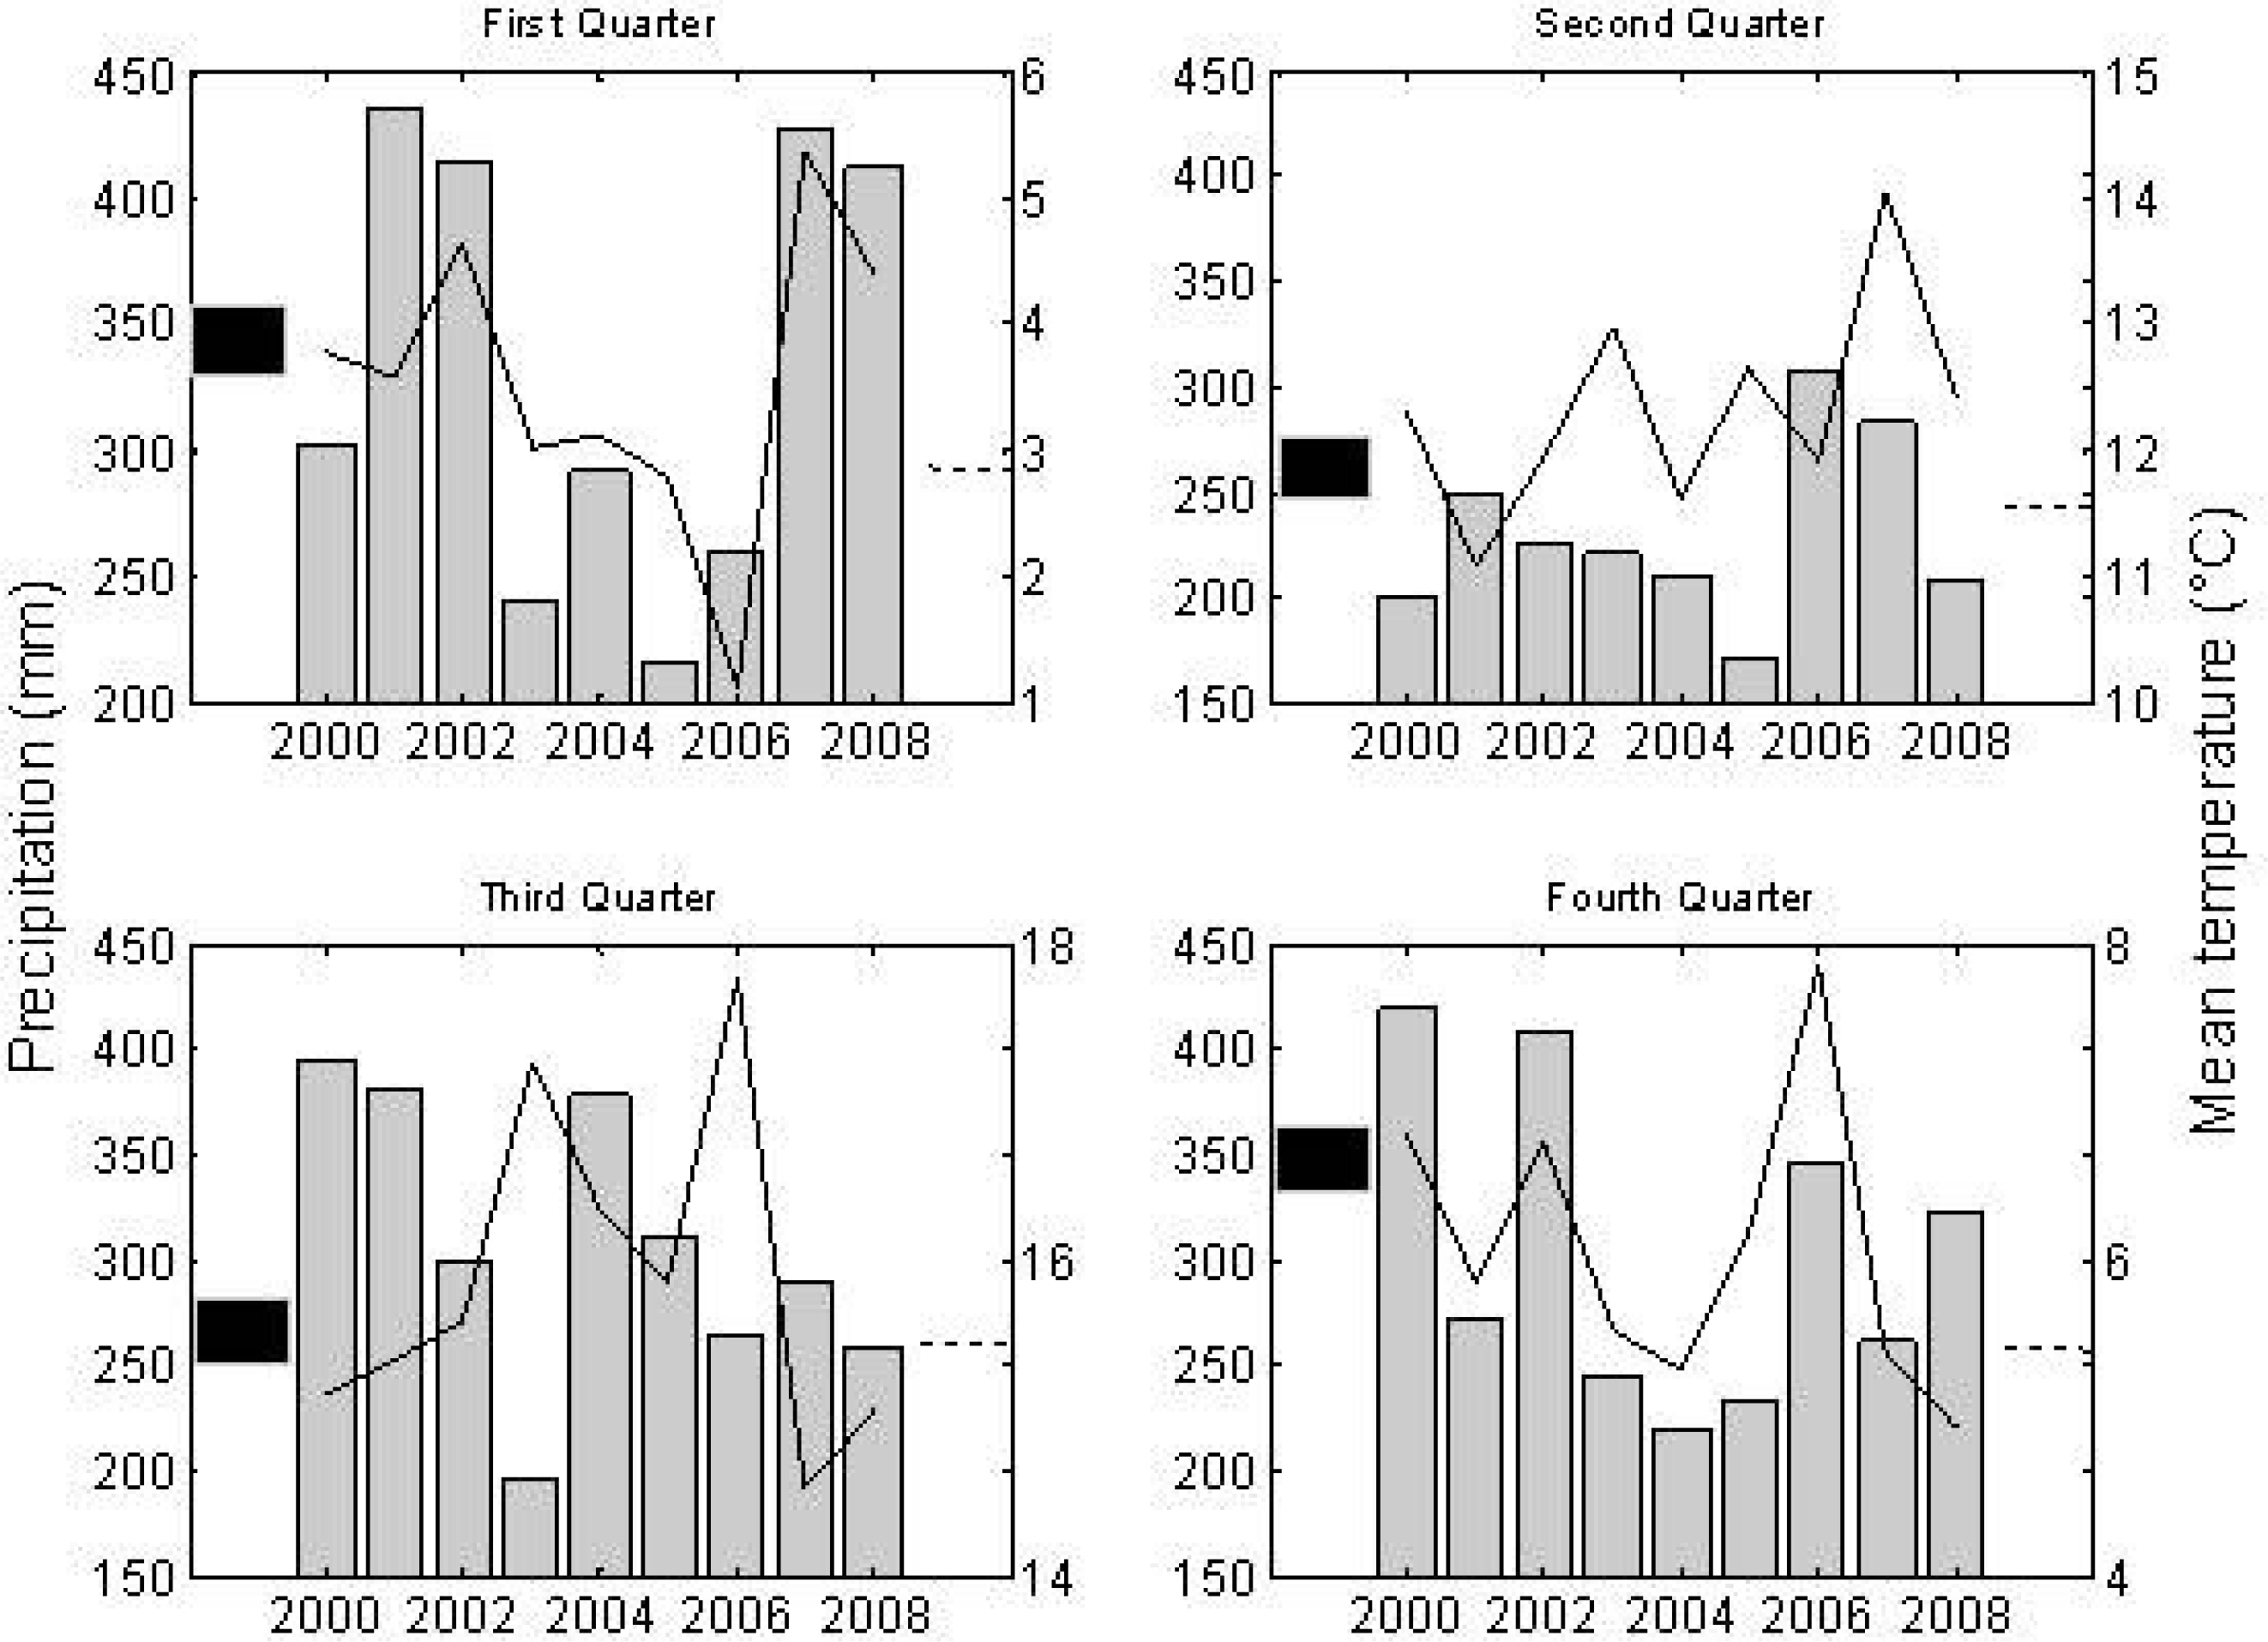
3. Results
4. Discussion
5. Conclusions
Acknowledgments
References
- Maes, P; Clement, J; Gavrilovskaya, I; Van Ranst, M. Hantaviruses: Immunology, Treatment and Prevention. Viral Immunol 2004, 17, 481–497. [Google Scholar]
- Escutenaire, S; Chalon, P; Verhagen, R; Heyman, P; Thomas, I; Karelle-Bui, L; Avsic-Zupanc, T; Lundkvist, A; Pluysnin, A; Pastoret, P. Spatial and temporal dynamics of Puumala hantavirus infection in red bank vole (Clethrionomys glareolus) population in Belgium. Virus Res 2000, 67, 91–107. [Google Scholar]
- Heyman, P; Van Mele, R; Smajlovic, L; Dobly, A; Cochez, C; Vandenvelde, C. Association between habitat and prevalence of hantavirus infections in bank voles (Myodes glareolus) and wood mice (Apodemus sylvaticus). Vector Borne Zoonotic Dis 2009, 9, 141–146. [Google Scholar]
- Clement, J; Maes, P; van Ypersele de Strihou, C; van der Groen, G; Barrios, JM; Verstraeten, WW; van Ranst, M. Beechnuts and outbreaks of nephropathia epidemica (NE): of mast, mice and men. Invited Editorial. Nephrol Dial Transplant, 2010; DOI: 10.1093/ndt/gfq122. [Google Scholar]
- Wolff, J. Population fluctuations of mast-eating rodents are correlated with production of acorns. J. Mammal 1996, 77, 850–856. [Google Scholar]
- Flowerdew, J; Shore, R; Poulton, S; Sparks, T. Live trapping to monitor small mammals in Britain. Mammal Rev 2004, 34, 31–50. [Google Scholar]
- Ostfeld, R; Canham, C; Oggenfus, K; Winchcombe, R; Keesing, F. Climate, deer, rodents and acorns as determinants of variation in Lyme-Disease risk. Plos Biology 2006, 4, 1058–1068. [Google Scholar]
- Shimada, T; Saitoh, T. Re-evaluation of the relationship between rodent populations and acorn masting: a review from the aspects of nutrients and defensive chemicals in acorns. Popul. Ecol 2006, 48, 341–352. [Google Scholar]
- Tersago, K; Verhagen, R; Servais, A; Heyman, P; Ducoffre, G; Leirs, H. Hantavirus disease (nephropathia epidemica) in Belgium: effects of tree seed production and climate. Epidemiol. Infect 2009, 137, 250–256. [Google Scholar]
- Clement, J; Vercauteren, J; Verstraeten, WW; Ducoffre, G; Barrios, JM; Vandamme, M; Maes, P; Van Ranst, M. Relating increasing hantavirus incidences to the changing climate: the mast connection. Int J Health Geogr 2009, 8. DOI:10.1186/1476-072X-8-1.. [Google Scholar]
- Klemola, T; Pettersen, T; Stenseth, N. Trophic interactions in population cycles of voles and lemmings: a model-base synthesis. Adv. Ecol. Res 2003, 33, 75–160. [Google Scholar]
- Begon, M; Telfer, S; Smith, M; Burthe, S; Paterson, S; Lambin, X. Seasonal host dynamics drive the timing of recurrent epidemics in a wildlife population. Proc. Roy. Soc. B: Biol. Sci 2009, 276, 1603–1610. [Google Scholar]
- McCarty, J. Ecological consequences of recent climate change. Conserv. Biol 2001, 15, 320–331. [Google Scholar]
- Beck, L; Lobitz, B; Wood, B. Remote sensing and human health: new sensors and new opportunities. Emerg. Infect. Dis 2000, 6, 217–226. [Google Scholar]
- Glass, G; Yates, T; Fine, J; Shields, T; Kendall, J; Hope, A; Parmenter, C; Peters, C; Ksiazek, T; Li, C; Patz, J; Mills, J. Satellite imagery characterizes local animal reservoir populations of Sin Nombre virus in the southwestern United States. Proc. Natl. Acad. Sci. U.S.A 2002, 99, 16817–16822. [Google Scholar]
- Neteler, M. Modis time series remote sensing for epidemiological modelling. International Symposium on Geoinformatics for Spatial Infrastructure Development in Earth and Allied Sciences, Hanoi, Vietnam, September 2004.
- Ryan Lash, R; Brunsell, N; Peterson, T. Spatiotemporal environmental triggers of Ebola and Marburg virus transmission. Geocarto. Int 2008, 23, 451–466. [Google Scholar]
- Porcasi, X; Calderón, G; Lamfri, M; Gardenal, N; Polop, J; Sabattini, M; Scavuzzo, M. The use of satellite data in modeling population dynamics and prevalence of infection in the rodent reservoir of Junin virus. Ecol. Modell 2005, 185, 437–449. [Google Scholar]
- Glass, G; Cheek, J; Patz, J; Shields, T; Doyle, T; Thoroughman, D; Hunt, D; Enscore, R; Gage, K; Irland, C; Peters; Bryan, R. Using remotely sensed data to identify areas at risk for hantavirus pulmonary syndrome. Emerg. Infect. Dis 2000, 6, 238–247. [Google Scholar]
- Linard, C; Tersago, K; Leirs, H; Lambin, E. Environmental conditions and Puumala virus transmission in Belgium. Int J Health Geogr 2007, 6. DOI:10.1186/1476-072X-6-55.. [Google Scholar]
- Bennett, E; Clement, J; Sansom, P; Hall, I; Leach, S; Medlock, JM. Environmental and ecological potential for enzootic cycles of Puumala hantavirus in Great Britain. Epidemiol Infect 2009. DOI:10.1017/S095026880999029X.. [Google Scholar]
- Schwarz, A; Ranft, U; Piechotowski, I; Childs, J; Brockmann, S. Risk factors for human infection with puumala virus, southwestern Germany. Emerg. Infect. Dis. 2009, 15, pp. 1032–1039.
- IPH. Hantavirus-Objectifs et description du réseau de surveillance. Scientific Institute of Public Health. Available online: http://www.iph.fgov.be/EPIDEMIO/epifr/plabfr/plabanfr/08_053f_v.pdf (accessed on July 20, 2009).
- European Environment Agency. Corine Land Cover. Available online: http://www.eea.europa.eu/themes/landuse/clc-download (accessed on July 15, 2009).
- Mailles, A; Sin, M; Ducoffre, G; Heyman, P; Koch, J; Zeller, H. Larger than usual increase in cases of hantavirus infections in Belgium, France and Germany, June 2005. Euro Surveill. Available online: http://www.eurosurveillance.org/ViewArticle.aspx?ArticleId=2754 (accessed on May 10, 2009).
- Clement, J; McKenna, P; Colson, P; Damoiseaux, Ph; Penalba, C; Halin, P; Lombart, D. Hantavirus epidemic in Europe, 1993. Lancet 1994, 343, 114. [Google Scholar]
- Peel, M; Finlayson, B; McMahon, T. Updated world map of the Köppen-Geiger climate classification. Hydrol. Earth Syst. Sc 2007, 11, 1633–1644. [Google Scholar]
- Koninklijk Meteorologisch Instituut (KMI). De maandnormalen te Ukkel. KMI.
- Menzel, A. Phenology, its importance to the Global Change Community Editorial Comment. Climatic Change 2002, 54, 379–385. [Google Scholar]
- Vermote, E; Vermeulen, A. Atmospheric Correction Algorithm: Spectral Reflectances (MOD09). USGS Land Processes Distributed Active Archive Center. Available online: http://modis.gsfc.nasa.gov/data/atbd/atbd_mod08.pdf (accessed on December 10, 2009).
- Huete, A; Justice, C; Van Leeuwen, W. Modis Vegetation Index (MOD 13) Algorithm theoretical basis document.
- Liu, H; Huete, A. A Feedback based modification of the NDVI to minimize canopy background and atmospheric noise. IEEE Trans. Geosci. Remot. Sen 1995, 33, 457–465. [Google Scholar]
- USGS. Land Processes Distributed Active Archive Center. Surface Reflectance 8-Day L3 Global 500 m. Available online: https://lpdaac.usgs.gov/lpdaac/products/modis_products_table/surface_reflectance/8_day_l3_global_500m/mod09a1 (accessed on April 14, 2009).
- Région Wallone; Gembloux Faculté Universitaire des sciences agronomiques. Projet de Cartographie Numérique de l'Occupation du Sol en Wallonie. Carte Numérique d'Occupation su Sol de Wallonie [CD-ROM]. Belgium, 2007.
- Jönsson, P; Eklundh, L. TIMESAT-a program for analyzing time-series of satellite sensor data. Comput. Geosci 2004, 30, 833–845. [Google Scholar]
- Stenseth, N; Bjornstad, O; Saitoh, T. Seasonal forcing on the dynamics of Clethrionomys rufocanus: modeling geographic gradients in population dynamics. Res. Pop. Ecol 1998, 40, 85–95. [Google Scholar]
- Linderholm, H. Growing season changes in the last century. Agr. Forest Meteorol 2006, 137, 1–14. [Google Scholar]
- Lindner, M; Maroshek, M; Netherer, S; Kremer, A; Barbati, A; García-Gonzalo, J; Seidl, R; Delzon, S; Corona, P; Kolström, M; Lexer, M; Marchetti, M. Climate change impacts, adaptive capacity and vulnerability of European forest ecosystems. Forest Ecol. Manag 2010, 259, 698–709. [Google Scholar]
- Clement, J; Underwood, P; Ward, D; Pilaski, J; LeDuc, J. Hantavirus outbreak during military manoeuvres in Germany. Lancet 1996, 347, 336. [Google Scholar]
- Clement, J; Maes, P; Van Ranst, M. Hantaviruses in the Old and New World. In Emerging Viruses in Human Populations; Tabor, E, Ed.; Elsevier: London, UK, 2007; Volume 16, pp. 161–177. [Google Scholar]


| Site | Slope | p | Site | Slope | p |
|---|---|---|---|---|---|
| 1. Leglise | 0.3525 | 0.04324* | 6. Saint-Hubert | 0.4432 | 0.0162* |
| 2. Virton (North) | 0.2089 | 0.29213 | 7. Wellin | 0.2496 | 0.0332* |
| 3. Etaille | 0.3943 | 0.02538* | 8. Momignies | 0.2375 | 0.2218 |
| 4. Sivry-Rance | 0.1604 | 0.39400 | 9. Virton (South) | 0.1871 | 0.3277 |
| 5. Ardennes (Fr) | 0.2532 | 0.21977 | 10. Linchamps (Fr) | 0.2496 | 0.27595 |
| Year | 1995 | 1996 | 1997 | 1998 | 1999 | 2000 | 2001 | 2002 | 2003 | 2004 | 2005 | 2006 | 2007 | 2008 | 2009 | |
|---|---|---|---|---|---|---|---|---|---|---|---|---|---|---|---|---|
| Rating | Beech | +++ | o | o | ++ | o | +++ | o | +++ | o | +++ | o | +++ | + | o | + |
| Native oak | +++ | o | o | +++ | o | +++ | o | o | o | +++ | o | + | +++ | o | + | |
| Site | A | B | Site | A | B | ||||
|---|---|---|---|---|---|---|---|---|---|
| r | p | r | p | r | p | r | p | ||
| 1 | −0.628 | 0.0952 | 0.729 | 0.0400* | 6 | −0.364 | 0.3749 | 0.784 | 0.0214* |
| 2 | −0.483 | 0.2250 | 0.732 | 0.0391* | 7 | −0.786 | 0.0206* | 0.669 | 0.0696 |
| 3 | −0.266 | 0.5243 | 0.657 | 0.0768 | 8 | −0.597 | 0.1185 | 0.709 | 0.0487* |
| 4 | −0.382 | 0.3501 | 0.489 | 0.2183 | 9 | −0.692 | 0.0569 | 0.669 | 0.0696 |
| 5 | −0.811 | 0.0147* | 0.760 | 0.0285* | 10 | −0.179 | 0.6710 | 0.726 | 0.0416* |
© 2007 by the authors; licensee Molecular Diversity Preservation International, Basel, Switzerland. This article is an open-access article distributed under the terms and conditions of the Creative Commons Attribution license (http://creativecommons.org/licenses/by/3.0/).
Share and Cite
Barrios, J.M.; Verstraeten, W.W.; Maes, P.; Clement, J.; Aerts, J.-M.; Haredasht, S.A.; Wambacq, J.; Lagrou, K.; Ducoffre, G.; Ranst, M.V.; et al. Satellite Derived Forest Phenology and Its Relation with Nephropathia Epidemica in Belgium. Int. J. Environ. Res. Public Health 2010, 7, 2486-2500. https://doi.org/10.3390/ijerph7062486
Barrios JM, Verstraeten WW, Maes P, Clement J, Aerts J-M, Haredasht SA, Wambacq J, Lagrou K, Ducoffre G, Ranst MV, et al. Satellite Derived Forest Phenology and Its Relation with Nephropathia Epidemica in Belgium. International Journal of Environmental Research and Public Health. 2010; 7(6):2486-2500. https://doi.org/10.3390/ijerph7062486
Chicago/Turabian StyleBarrios, José Miguel, Willem W. Verstraeten, Piet Maes, Jan Clement, Jean-Marie Aerts, Sara Amirpour Haredasht, Julie Wambacq, Katrien Lagrou, Geneviève Ducoffre, Marc Van Ranst, and et al. 2010. "Satellite Derived Forest Phenology and Its Relation with Nephropathia Epidemica in Belgium" International Journal of Environmental Research and Public Health 7, no. 6: 2486-2500. https://doi.org/10.3390/ijerph7062486