Appendix
Table S1.
National sample demographic characteristics.
Table S1.
National sample demographic characteristics.
| U.S. | Canada | Malta |
|---|
| Gender | | | |
| Male | 48% | 48% | 49% |
| Female | 52% | 52% | 51% |
| Age group | | | |
| 18–24 yrs | 11% | 11% | 12% |
| 25–34 yrs | 19% | 16% | 16% |
| 35–44 yrs | 19% | 20% | 16% |
| 45–54 yrs | 18% | 20% | 21% |
| 55–64 yrs | 18% | 15% | 18% |
| 65–74 yrs | 11% | 65+ yrs: 18% | 11% |
| 75+ yrs | 5% | | 6% |
| Education level | | | |
| Less than high school: 13% | | Primary: 17% |
| High school: 32% | High school or less: 25% | Secondary: 48% |
| Some college: 28% | College: 28% | Post-secondary: 18% |
| Bachelor’s degree or higher: 27% | University +: 46% | Tertiary: 17% |
Table S2.
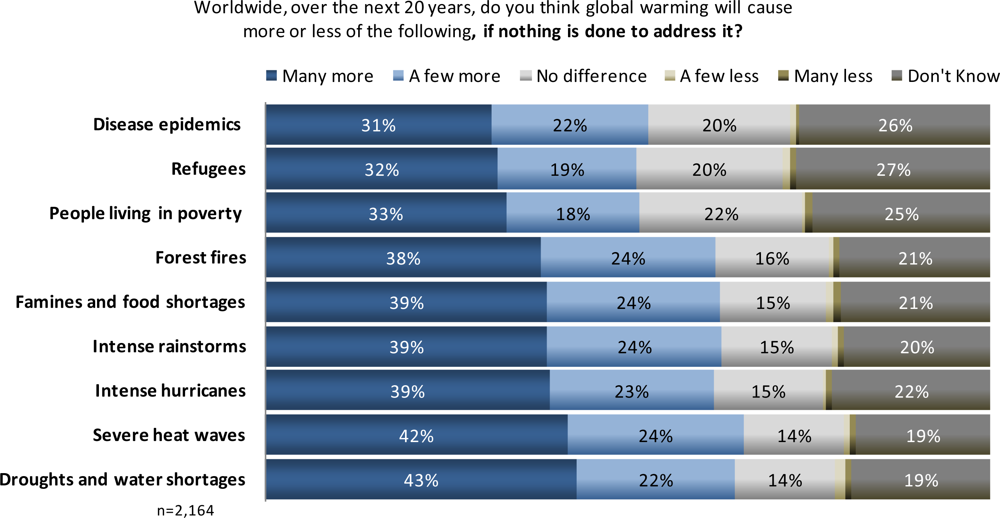
U.S. perceptions of global warming impacts by educational level; Worldwide over the next 20 years, do you think global warming will cause more or less of the following, if nothing is done to address it?
Table S2.
U.S. perceptions of global warming impacts by educational level; Worldwide over the next 20 years, do you think global warming will cause more or less of the following, if nothing is done to address it?
| % | National average | Less than high school | High school | Some college | Bachelor's degree or higher |
|---|
| Droughts and water shortages | | | | | |
| Many more | 43 | 50 | 38 | 42 | 46 |
| A few more | 22 | 14 | 24 | 20 | 25 |
| No difference | 14 | 7 | 13 | 15 | 16 |
| A few less | 1 | 3 | 1 | 1 | 1 |
| Many less | 1 | 1 | 1 | 2 | 0 |
| Don’t know | 19 | 25 | 23 | 20 | 11 |
| χ2, p < 0.01; n = 2,129 | | | | | |
| People living in poverty | | | | | |
| Many more | 33 | 34 | 29 | 34 | 38 |
| A few more | 18 | 19 | 21 | 16 | 18 |
| No difference | 22 | 12 | 21 | 24 | 27 |
| A few less | 0 | 1 | 1 | 0 | 0 |
| Many less | 1 | 1 | 0 | 2 | 1 |
| Don’t know | 25 | 32 | 28 | 25 | 17 |
| χ2, p < 0.01; n = 2,137 | | | | | |
| Disease epidemics | | | | | |
| Many more | 31 | 40 | 28 | 31 | 31 |
| A few more | 22 | 13 | 23 | 22 | 23 |
| No difference | 20 | 9 | 18 | 21 | 25 |
| A few less | 1 | 1 | 1 | 0 | 1 |
| Many less | 1 | 0 | 0 | 1 | 1 |
| Don’t know | 26 | 38 | 29 | 25 | 19 |
| χ2, p < 0.01; n = 2,131 | | | | | |
| Intense hurricanes | | | | | |
| Many more | 39 | 38 | 36 | 40 | 42 |
| A few more | 23 | 16 | 24 | 23 | 23 |
| No difference | 15 | 8 | 14 | 15 | 20 |
| A few less | 0 | 1 | 1 | 0 | 1 |
| Many less | 1 | 0 | 1 | 2 | 1 |
| Don’t know | 22 | 37 | 25 | 20 | 14 |
| χ2, p < 0.01; n = 2,141 | | | | | |
| Intense rainstorms | | | | | |
| Many more | 39 | 42 | 35 | 39 | 42 |
| A few more | 24 | 19 | 27 | 22 | 25 |
| No difference | 15 | 8 | 14 | 16 | 19 |
| A few less | 1 | 1 | 2 | 0 | 0 |
| Many less | 1 | 0 | 0 | 2 | 1 |
| Don’t know | 20 | 31 | 22 | 21 | 12 |
| χ2, p<0.01; n = 2,130 | | | | | |
| Severe heat waves | | | | | |
| Many more | 42 | 43 | 37 | 42 | 45 |
| A few more | 24 | 18 | 26 | 24 | 26 |
| No difference | 14 | 8 | 13 | 14 | 18 |
| A few less | 1 | 1 | 1 | 0 | 1 |
| Many less | 1 | 0 | 0 | 2 | 0 |
| Don’t know | 19 | 30 | 22 | 17 | 10 |
| χ2, p<0.01; n = 2,136 | | | | | |
| Famines and food shortages | | | | | |
| Many more | 39 | 44 | 34 | 38 | 43 |
| A few more | 24 | 14 | 25 | 24 | 27 |
| No difference | 15 | 9 | 14 | 16 | 17 |
| A few less | 1 | 2 | 1 | 0 | 1 |
| Many less | 1 | 1 | 1 | 2 | 0 |
| Don’t know | 21 | 30 | 25 | 20 | 12 |
| χ2, p < 0.01; n = 2,140 | | | | | |
Table S3.
U.S. perceptions of global warming impacts by income level; Worldwide over the next 20 years, do you think global warming will cause more or less of the following, if nothing is done to address it?
Table S3.
U.S. perceptions of global warming impacts by income level; Worldwide over the next 20 years, do you think global warming will cause more or less of the following, if nothing is done to address it?
| % | National average | Less than $25,000 | $25,000 to $34,999 | $35,000 to $49,999 | $50,000 to $74,999 | $75,000 to $99,999 | $100,000 or more |
|---|
| Droughts and water shortages | | | | | | | |
| Many more | 43 | 49 | 44 | 41 | 42 | 40 | 42 |
| A few more | 22 | 15 | 22 | 21 | 24 | 28 | 25 |
| No difference | 14 | 9 | 12 | 13 | 15 | 16 | 19 |
| A few less | 1 | 3 | 0 | 2 | 1 | 2 | 1 |
| Many less | 1 | 1 | 3 | 0 | 1 | 1 | 0 |
| Don’t know | 19 | 24 | 18 | 23 | 17 | 13 | 13 |
| χ2, p < 0.01; n = 2,112 | | | | | | | |
| People living in poverty | | | | | | | |
| Many more | 33 | 35 | 35 | 33 | 34 | 30 | 32 |
| A few more | 19 | 18 | 20 | 15 | 17 | 20 | 23 |
| No difference | 23 | 16 | 18 | 22 | 24 | 31 | 26 |
| A few less | 0 | 1 | 0 | 1 | 0 | 0 | 0 |
| Many less | 1 | 0 | 3 | 1 | 1 | 1 | 0 |
| Don’t know | 24 | 31 | 23 | 28 | 23 | 19 | 18 |
| χ2, p < 0.01; n = 2,120 | | | | | | | |
| Disease epidemics | | | | | | | |
| Many more | 31 | 35 | 34 | 34 | 29 | 27 | 29 |
| A few more | 22 | 21 | 20 | 19 | 24 | 22 | 25 |
| No difference | 20 | 12 | 18 | 17 | 21 | 28 | 25 |
| A few less | 1 | 1 | 1 | 1 | 1 | 0 | 1 |
| Many less | 1 | 0 | 0 | 0 | 1 | 1 | 0 |
| Don’t know | 26 | 31 | 26 | 30 | 24 | 22 | 20 |
| χ2, p < 0.01; n = 2,117 | | | | | | | |
| Intense hurricanes | | | | | | | |
| Many more | 39 | 44 | 37 | 39 | 40 | 38 | 36 |
| A few more | 23 | 17 | 20 | 23 | 26 | 27 | 25 |
| No difference | 15 | 11 | 14 | 14 | 13 | 17 | 24 |
| A few less | 0 | 1 | 0 | 0 | 0 | 1 | 1 |
| Many less | 1 | 0 | 3 | 0 | 1 | 1 | 0 |
| Don’t know | 21 | 27 | 26 | 24 | 20 | 17 | 14 |
| χ2, p < 0.01; n = 2,123 | | | | | | | |
| Intense rainstorms | | | | | | | |
| Many more | 39 | 45 | 37 | 39 | 39 | 34 | 38 |
| A few more | 24 | 17 | 25 | 24 | 25 | 31 | 25 |
| No difference | 15 | 10 | 13 | 14 | 15 | 18 | 22 |
| A few less | 1 | 1 | 0 | 0 | 1 | 1 | 0 |
| Many less | 1 | 0 | 3 | 0 | 1 | 1 | 0 |
| Don’t know | 20 | 26 | 22 | 22 | 19 | 15 | 14 |
| χ2, p < 0.01; n = 2,114 | | | | | | | |
| Severe heat waves | | | | | | | |
| Many more | 42 | 47 | 39 | 40 | 42 | 41 | 39 |
| A few more | 25 | 17 | 28 | 23 | 27 | 27 | 28 |
| No difference | 14 | 10 | 14 | 12 | 11 | 19 | 21 |
| A few less | 1 | 2 | 0 | 0 | 1 | 0 | 1 |
| Many less | 1 | 0 | 3 | 0 | 1 | 1 | 0 |
| Don’t know | 18 | 23 | 17 | 24 | 18 | 12 | 11 |
| χ2, p < 0.01; n = 2,125 | | | | | | | |
| Famines and food shortages | | | | | | | |
| Many more | 39 | 43 | 42 | 37 | 39 | 36 | 39 |
| A few more | 24 | 17 | 21 | 26 | 26 | 25 | 28 |
| No difference | 15 | 10 | 15 | 12 | 15 | 20 | 18 |
| A few less | 1 | 2 | 0 | 1 | 0 | 1 | 1 |
| Many less | 1 | 0 | 3 | 1 | 1 | 1 | 0 |
| Don’t know | 20 | 28 | 18 | 23 | 19 | 17 | 14 |
| χ2, p < 0.01; n = 2,125 | | | | | | | |
Table S4.
U.S. perceptions of global warming impacts by age category; Worldwide over the next 20 years, do you think global warming will cause more or less of the following, if nothing is done to address it?
Table S4.
U.S. perceptions of global warming impacts by age category; Worldwide over the next 20 years, do you think global warming will cause more or less of the following, if nothing is done to address it?
| % | National average | 18–29 | 30–44 | 45–59 | 60+ |
|---|
| Droughts and water shortages | | | | | |
| Many more | 43 | 40 | 43 | 47 | 42 |
| A few more | 22 | 22 | 24 | 20 | 22 |
| No difference | 14 | 16 | 14 | 12 | 14 |
| A few less | 1 | 1 | 1 | 2 | 2 |
| Many less | 1 | 2 | 0 | 1 | 1 |
| Don’t know | 19 | 20 | 18 | 19 | 20 |
| χ2, p = 0.130; n = 2,128 | | | | | |
| People living in poverty | | | | | |
| Many more | 33 | 27 | 30 | 42 | 32 |
| A few more | 18 | 20 | 21 | 15 | 18 |
| No difference | 22 | 28 | 22 | 18 | 23 |
| A few less | 0 | 1 | 1 | 0 | 0 |
| Many less | 1 | 2 | 0 | 1 | 0 |
| Don’t know | 25 | 23 | 26 | 23 | 27 |
| χ2, p < 0.01; n = 2,133 | | | | | |
| Disease epidemics | | | | | |
| Many more | 31 | 28 | 29 | 34 | 32 |
| A few more | 22 | 26 | 22 | 20 | 20 |
| No difference | 20 | 21 | 22 | 17 | 19 |
| A few less | 1 | 0 | 1 | 1 | 0 |
| Many less | 1 | 0 | 0 | 1 | 1 |
| Don’t know | 26 | 25 | 25 | 27 | 29 |
| χ2, p = 0.098; n = 2,135 | | | | | |
| Intense hurricanes | | | | | |
| Many more | 39 | 35 | 40 | 43 | 37 |
| A few more | 23 | 25 | 26 | 19 | 21 |
| No difference | 15 | 15 | 14 | 15 | 16 |
| A few less | 0 | 0 | 1 | 0 | 0 |
| Many less | 1 | 2 | 1 | 1 | 0 |
| Don’t know | 22 | 23 | 19 | 21 | 25 |
| χ2, p < 0.028; n = 2,138 | | | | | |
| Intense rainstorms | | | | | |
| Many more | 39 | 35 | 38 | 44 | 38 |
| A few more | 24 | 26 | 24 | 22 | 25 |
| No difference | 15 | 16 | 16 | 14 | 15 |
| A few less | 1 | 1 | 2 | 0 | 0 |
| Many less | 1 | 2 | 1 | 1 | 0 |
| Don’t know | 20 | 20 | 20 | 20 | 21 |
| χ2, p < 0.061; n = 2,133 | | | | | |
| Severe heat waves | | | | | |
| Many more | 42 | 39 | 44 | 45 | 38 |
| A few more | 24 | 23 | 27 | 21 | 26 |
| No difference | 14 | 15 | 13 | 14 | 13 |
| A few less | 1 | 1 | 1 | 1 | 1 |
| Many less | 1 | 2 | 0 | 1 | 1 |
| Don’t know | 19 | 21 | 16 | 18 | 21 |
| χ2, p < 0.186; n = 2,140 | | | | | |
| Famines and food shortages | | | | | |
| Many more | 39 | 32 | 38 | 44 | 39 |
| A few more | 24 | 26 | 27 | 21 | 21 |
| No difference | 15 | 17 | 15 | 13 | 15 |
| A few less | 1 | 1 | 1 | 1 | 1 |
| Many less | 1 | 2 | 1 | 2 | 1 |
| Don’t know | 21 | 23 | 19 | 20 | 22 |
| χ2, p < 0.034; n = 2,139 | | | | | |
Table S5.
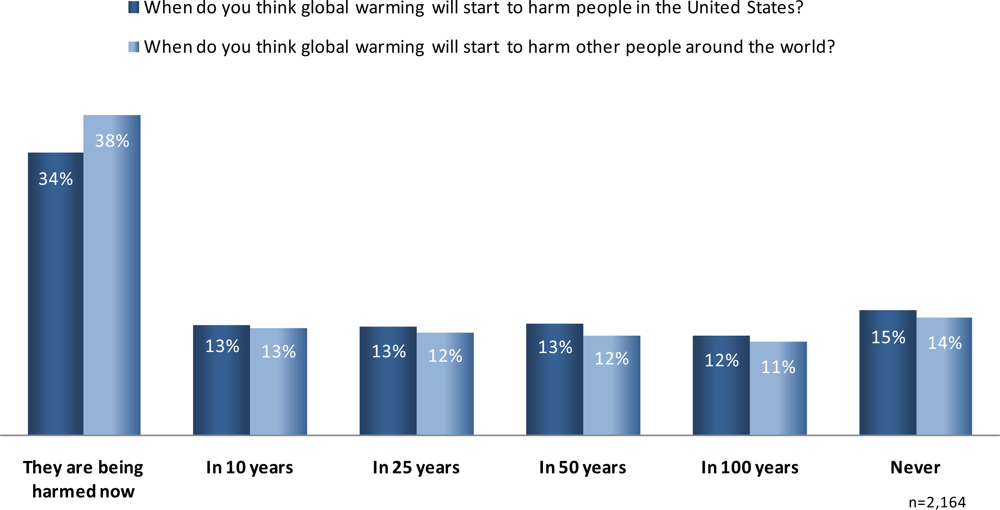
U.S. perceptions of timing of harm to people in the United States by educational level; When do you think global warming will start to harm people in the United States?
Table S5.
U.S. perceptions of timing of harm to people in the United States by educational level; When do you think global warming will start to harm people in the United States?
| National average | Less than high school | High school | Some college | Bachelor's degree or higher |
|---|
| They are being harmed now | 34 | 32 | 35 | 34 | 34 |
| In 10 years | 13 | 15 | 14 | 10 | 14 |
| In 25 years | 13 | 15 | 13 | 12 | 13 |
| In 50 years | 13 | 14 | 15 | 13 | 11 |
| In 100 years | 12 | 11 | 11 | 14 | 11 |
| Never | 15 | 13 | 12 | 17 | 16 |
| χ2, p = 0.258; n = 2,097 | | | | | |
Table S6.
U.S. perceptions of timing of harm to people in the United States by income level; When do you think global warming will start to harm people in the United States?
Table S6.
U.S. perceptions of timing of harm to people in the United States by income level; When do you think global warming will start to harm people in the United States?
| National average | Less than $25,000 | $25,000 to $34,999 | $35,000 to $49,999 | $50,000 to $74,999 | $75,000 to $99,999 | $100,000 or more |
|---|
| They are being harmed now | 34 | 40 | 43 | 30 | 35 | 28 | 28 |
| In 10 years | 13 | 14 | 12 | 13 | 11 | 12 | 17 |
| In 25 years | 13 | 12 | 12 | 10 | 19 | 13 | 11 |
| In 50 years | 13 | 13 | 13 | 16 | 13 | 11 | 14 |
| In 100 years | 12 | 9 | 7 | 15 | 9 | 18 | 11 |
| Never | 15 | 11 | 12 | 17 | 13 | 18 | 20 |
| χ2, p = 0.258; n = 2,082 | | | | | | | |
Table S7.
U.S. perceptions of timing of harm to people in the United States by age; When do you think global warming will start to harm people in the United States?
Table S7.
U.S. perceptions of timing of harm to people in the United States by age; When do you think global warming will start to harm people in the United States?
| National average | 18–29 | 30–44 | 45–59 | 60+ |
|---|
| They are being harmed now | 34 | 30 | 30 | 41 | 33 |
| In 10 years | 13 | 12 | 16 | 11 | 14 |
| In 25 years | 13 | 17 | 11 | 12 | 13 |
| In 50 years | 13 | 14 | 15 | 10 | 15 |
| In 100 years | 12 | 13 | 14 | 11 | 10 |
| Never | 15 | 14 | 13 | 16 | 15 |
| χ2, p < 0.01; n = 2,097 | | | | | |
Table S8.
U.S. perceptions of timing of harm to people worldwide by educational level; When do you think global warming will start to harm other people around the world?
Table S8.
U.S. perceptions of timing of harm to people worldwide by educational level; When do you think global warming will start to harm other people around the world?
| National average | Less than high school | High school | Some college | Bachelor's degree or higher |
|---|
| They are being harmed now | 38 | 35 | 41 | 36 | 39 |
| In 10 years | 13 | 15 | 11 | 12 | 13 |
| In 25 years | 12 | 14 | 12 | 12 | 12 |
| In 50 years | 12 | 12 | 13 | 12 | 11 |
| In 100 years | 11 | 9 | 12 | 12 | 10 |
| Never | 14 | 15 | 12 | 16 | 15 |
| χ2, p = 0.513; n = 2,090 | | | | | |
Table S9.
U.S. perceptions of timing of harm to people worldwide by income level; When do you think global warming will start to harm other people around the world?
Table S9.
U.S. perceptions of timing of harm to people worldwide by income level; When do you think global warming will start to harm other people around the world?
| National average | Less than $25,000 | $25,000 to $34,999 | $35,000 to $49,999 | $50,000 to $74,999 | $75,000 to $99,999 | $100,000 or more |
|---|
| They are being harmed now | 38 | 46 | 45 | 34 | 38 | 32 | 33 |
| In 10 years | 13 | 10 | 13 | 12 | 13 | 13 | 16 |
| In 25 years | 12 | 12 | 12 | 10 | 16 | 12 | 10 |
| In 50 years | 12 | 10 | 11 | 14 | 12 | 12 | 12 |
| In 100 years | 11 | 9 | 7 | 14 | 9 | 14 | 12 |
| Never | 14 | 12 | 11 | 16 | 11 | 17 | 17 |
| χ2, p < 0.01; n = 2,073 | | | | | | | |
Table S10.
U.S. perceptions of timing of harm to people worldwide by age category; When do you think global warming will start to harm other people around the world?
Table S10.
U.S. perceptions of timing of harm to people worldwide by age category; When do you think global warming will start to harm other people around the world?
| National average | 18–29 | 30–44 | 45–59 | 60+ |
|---|
| They are being harmed now | 38 | 30 | 37 | 45 | 39 |
| In 10 years | 13 | 13 | 15 | 10 | 12 |
| In 25 years | 12 | 18 | 9 | 11 | 13 |
| In 50 years | 12 | 14 | 14 | 8 | 13 |
| In 100 years | 11 | 11 | 13 | 11 | 9 |
| Never | 14 | 13 | 13 | 15 | 14 |
| χ2, p < 0.01; n = 2,091 | | | | | |
Table S11.
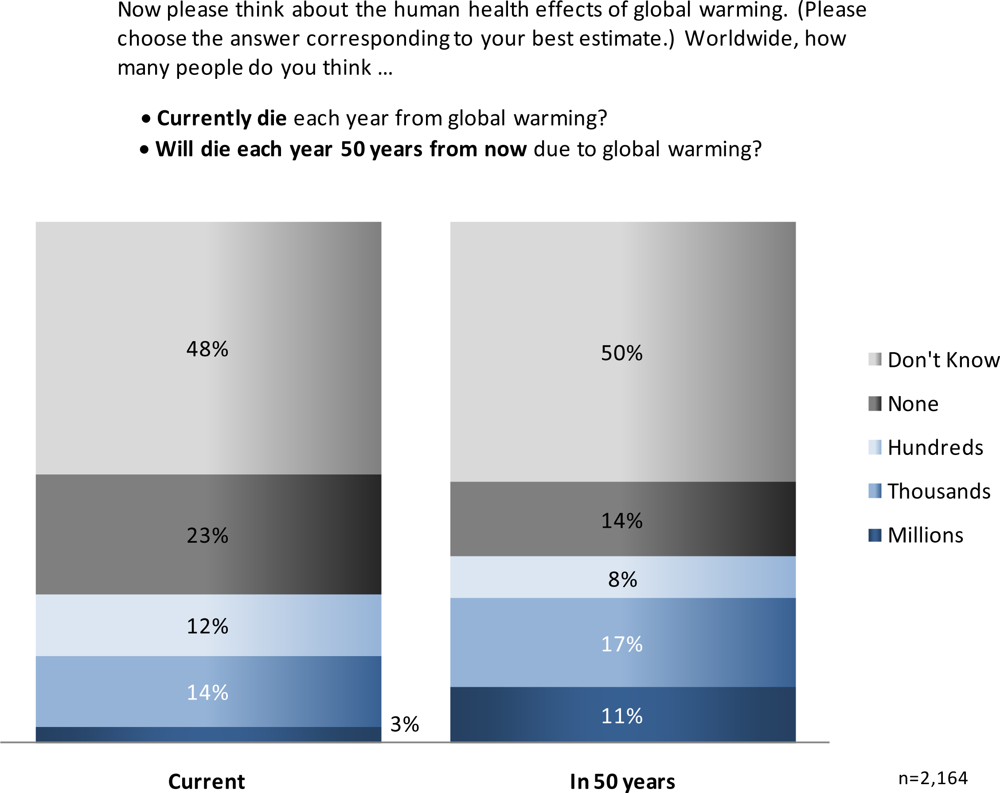
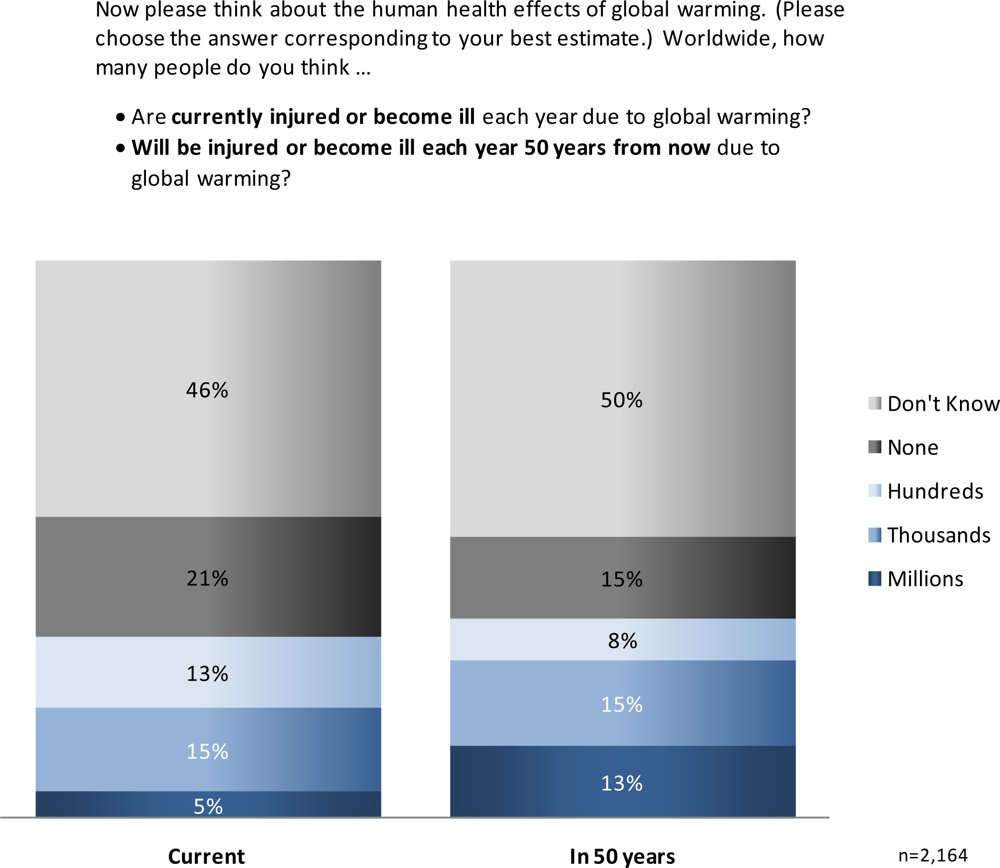
U.S. perceptions of morbidity and mortality rates by educational level; Now please think about the human health effects of global warming. (Please choose the answer corresponding to your best estimate.) Worldwide, how many people do you think?
Table S11.
U.S. perceptions of morbidity and mortality rates by educational level; Now please think about the human health effects of global warming. (Please choose the answer corresponding to your best estimate.) Worldwide, how many people do you think?
| % | National average | Less than high school | High school | Some college | Bachelor's degree or higher |
|---|
| Currently die each year due to global warming? | | | | | |
| Millions | 3 | 3 | 3 | 3 | 4 |
| Thousands | 14 | 12 | 12 | 11 | 19 |
| Hundreds | 12 | 13 | 9 | 14 | 12 |
| None | 23 | 20 | 20 | 24 | 27 |
| Don't Know | 48 | 52 | 56 | 48 | 38 |
| χ2, p<0.01; n = 2,138 | | | | | |
| Will die each year 50 years from now due to global warming? | | | | | |
| Millions | 11 | 10 | 6 | 13 | 15 |
| Thousands | 17 | 14 | 16 | 14 | 22 |
| Hundreds | 8 | 6 | 9 | 8 | 8 |
| None | 14 | 15 | 11 | 16 | 15 |
| Don't Know | 50 | 56 | 57 | 49 | 40 |
| χ2, p<0.01; n = 2,147 | | | | | |
| Are currently injured or become ill each year due to global warming? | | | | | |
| Millions | 5 | 6 | 3 | 5 | 5 |
| Thousands | 15 | 15 | 13 | 14 | 19 |
| Hundreds | 13 | 10 | 11 | 15 | 15 |
| None | 21 | 21 | 17 | 23 | 24 |
| Don't Know | 46 | 48 | 56 | 43 | 36 |
| χ2, p < 0.01; n = 2,143 | | | | | |
| Will be injured or become ill each year 50 years from now due to global warming? | | | | | |
| Millions | 13 | 12 | 9 | 13 | 17 |
| Thousands | 15 | 13 | 14 | 14 | 19 |
| Hundreds | 7 | 8 | 8 | 7 | 8 |
| None | 15 | 14 | 12 | 17 | 15 |
| Don't Know | 50 | 53 | 57 | 49 | 41 |
| χ2, p<0.01; n = 2,124 | | | | | |
Table S12.
U.S. perceptions of morbidity and mortality rates by income level; Now please think about the human health effects of global warming. (Please choose the answer corresponding to your best estimate.) Worldwide, how many people do you think?
Table S12.
U.S. perceptions of morbidity and mortality rates by income level; Now please think about the human health effects of global warming. (Please choose the answer corresponding to your best estimate.) Worldwide, how many people do you think?
| % | National average | Less than $25,000 | $25,000 to $34,999 | $35,000 to $49,999 | $50,000 to $74,999 | $75,000 to $99,999 | $100,000 or more |
|---|
| Currently die each year due to global warming? | | | | | | | |
| Millions | 3 | 4 | 1 | 5 | 3 | 2 | 4 |
| Thousands | 14 | 17 | 15 | 11 | 13 | 12 | 17 |
| Hundreds | 12 | 8 | 10 | 9 | 14 | 15 | 8 |
| None | 23 | 17 | 22 | 24 | 23 | 30 | 17 |
| Don't Know | 48 | 55 | 52 | 51 | 47 | 41 | 55 |
| χ2, p<0.01; n = 2,120 | | | | | | | |
| Will die each year 50 years from now due to global warming? | | | | | | | |
| Millions | 11 | 11 | 7 | 11 | 12 | 10 | 14 |
| Thousands | 17 | 16 | 19 | 12 | 15 | 20 | 21 |
| Hundreds | 8 | 7 | 4 | 10 | 12 | 6 | 7 |
| None | 15 | 9 | 14 | 15 | 15 | 18 | 19 |
| Don't Know | 50 | 57 | 55 | 53 | 46 | 46 | 39 |
| χ2, p < 0.01; n = 2,125 | | | | | | | |
| Are currently injured or become ill each year due to global warming? | | | | | | | |
| Millions | 5 | 5 | 4 | 5 | 4 | 4 | 5 |
| Thousands | 15 | 17 | 16 | 14 | 14 | 13 | 16 |
| Hundreds | 13 | 9 | 9 | 12 | 15 | 16 | 15 |
| None | 22 | 14 | 20 | 21 | 21 | 28 | 26 |
| Don't Know | 46 | 54 | 51 | 48 | 45 | 38 | 38 |
| χ2, p < 0.01; n = 2,120 | | | | | | | |
| Will be injured or become ill each year 50 years from now due to global warming? | | | | | | | |
| Millions | 13 | 14 | 8 | 10 | 13 | 15 | 16 |
| Thousands | 15 | 14 | 20 | 13 | 13 | 15 | 19 |
| Hundreds | 8 | 7 | 3 | 8 | 11 | 7 | 6 |
| None | 15 | 9 | 14 | 16 | 15 | 17 | 19 |
| Don't Know | 50 | 56 | 55 | 54 | 47 | 46 | 40 |
| χ2, p < 0.01; n = 2,103 | | | | | | | |
Table S13.
U.S. perceptions of morbidity and mortality rates by age; Now please think about the human health effects of global warming. (Please choose the answer corresponding to your best estimate.) Worldwide, how many people do you think?
Table S13.
U.S. perceptions of morbidity and mortality rates by age; Now please think about the human health effects of global warming. (Please choose the answer corresponding to your best estimate.) Worldwide, how many people do you think?
| % | National average | 18–29 | 30–44 | 45–59 | 60+ |
|---|
| Currently die each year due to global warming? | | | | | |
| Millions | 3 | 2 | 2 | 4 | 3 |
| Thousands | 14 | 12 | 13 | 17 | 12 |
| Hundreds | 12 | 15 | 13 | 10 | 9 |
| None | 23 | 28 | 22 | 21 | 22 |
| Don't Know | 48 | 42 | 50 | 48 | 53 |
| χ2, p = 0.001; n = 2,141 | | | | | |
| Will die each year 50 years from now due to global warming? | | | | | |
| Millions | 11 | 11 | 10 | 14 | 8 |
| Thousands | 17 | 17 | 21 | 14 | 14 |
| Hundreds | 8 | 11 | 8 | 8 | 7 |
| None | 14 | 16 | 14 | 15 | 12 |
| Don't Know | 50 | 45 | 47 | 49 | 59 |
| χ2, p < 0.01; n = 2,147 | | | | | |
| Are currently injured or become ill each year due to global warming? | | | | | |
| Millions | 5 | 4 | 4 | 7 | 4 |
| Thousands | 15 | 16 | 15 | 17 | 13 |
| Hundreds | 13 | 18 | 13 | 12 | 9 |
| None | 21 | 24 | 22 | 20 | 21 |
| Don't Know | 46 | 38 | 47 | 45 | 54 |
| χ2, p < 0.01; n = 2,120 | | | | | |
| Will be injured or become ill each year 50 years from now due to global warming? | | | | | |
| Millions | 13 | 12 | 13 | 16 | 10 |
| Thousands | 15 | 17 | 17 | 14 | 13 |
| Hundreds | 7 | 9 | 8 | 7 | 6 |
| None | 15 | 17 | 14 | 15 | 14 |
| Don't Know | 50 | 46 | 48 | 48 | 57 |
| χ2, p < 0.01; n = 2,103 | | | | | |
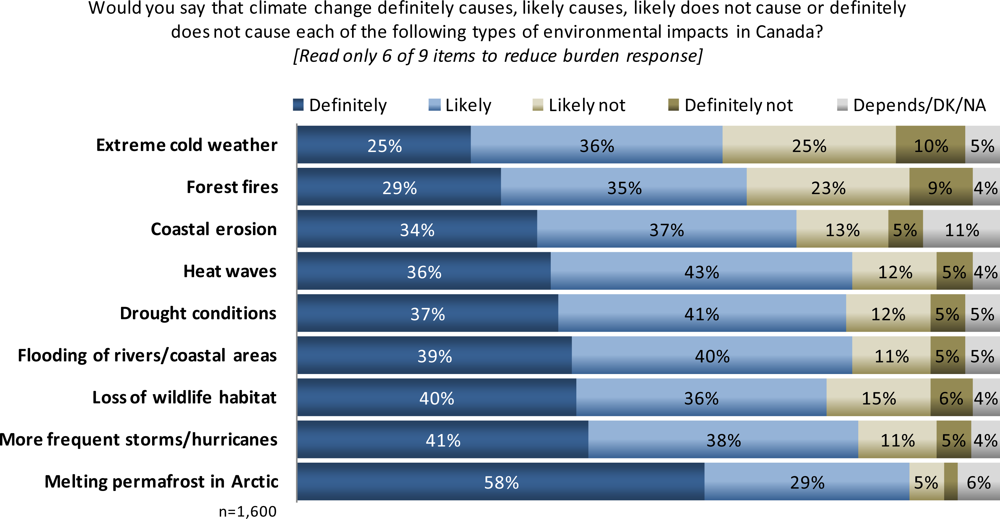
Table S14.
Canadian perceptions of environmental impacts resulting from climate change by age; I will now read you a list of potential risks to the health of Canadians. Please tell me whether you think each of the following poses a major risk, a moderate risk, a minor risk, or no risk at all to the health of Canadians. [Read only 8 of 12 items to reduce burden response] (n = 1,600).
| National average | 18–34 | 35–49 | 50–64 | 65+ |
|---|
| Obesity (n = 938) | 70 | 61 | 74 | 73 | 71 |
| Heart disease (n = 1,146) | 65 | 59 | 70 | 72 | 73 |
| Air pollution (n = 1,154) | 62 | 59 | 64 | 65 | 62 |
| Chemical pollution (n = 1,145) | 58 | 46 | 64 | 60 | 60 |
| Second-hand smoke (n = 1,139) | 57 | 56 | 54 | 58 | 65 |
| Pesticides in food (n = 919) | 46 | 32 | 50 | 53 | 52 |
| Climate change (n = 902) | 32 | 35 | 32 | 30 | 28 |
| Pandemic flu epidemics (n = 1,159) | 29 | 23 | 26 | 34 | 39 |
| Heat waves (n = 916) | 20 | 18 | 16 | 23 | 26 |
| West Nile virus (n = 1,168) | 16 | 13 | 15 | 16 | 22 |
| Extreme cold weather (n = 1,165) | 15 | 14 | 10 | 17 | 19 |
| Tap water (n = 903) | 14 | 15 | 14 | 13 | 15 |
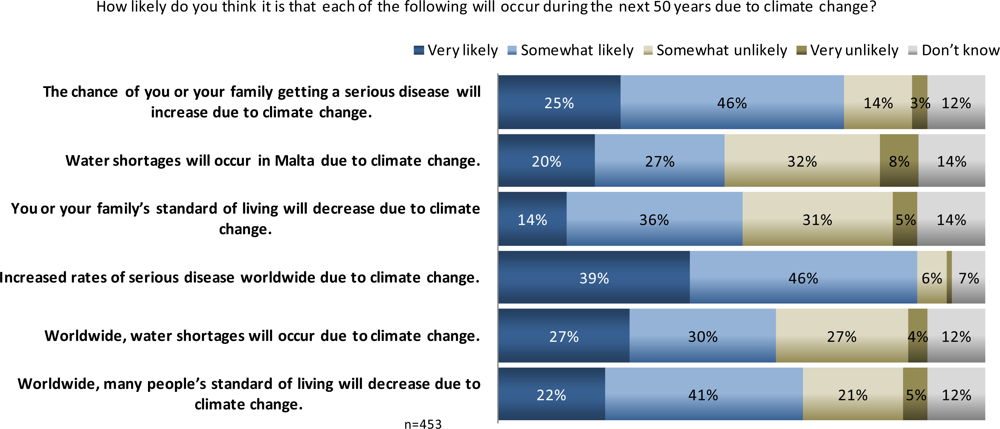
Table S15.
Maltese perceptions of likelihood of health risks resulting from climate change by age; How likely do you think it is that each of the following will occur during the next 50 years due to climate change? [Index: 1 = very unlikely to 4 = very likely]
Table S15.
Maltese perceptions of likelihood of health risks resulting from climate change by age; How likely do you think it is that each of the following will occur during the next 50 years due to climate change? [Index: 1 = very unlikely to 4 = very likely]
| National average | 18–34 | 35–54 | 55+ |
|---|
| Worldwide, many people’s standard of living will decrease due to climate change. | 2.85 | 2.82 | 2.94 | 2.76 |
| Worldwide, water shortages will occur due to climate change. | 2.85 | 2.82 | 2.99 | 2.73 |
| Increased rates of serious disease worldwide due to climate change. | 3.28 | 3.24 | 3.36 | 3.22 |
| You or your family’s standard of living will decrease due to climate change. | 2.65 | 2.57 | 2.73 | 2.64 |
| Water shortages will occur in Malta due to climate change. | 2.66 | 2.52 | 2.75 | 2.67 |
| The chance of you or your family getting a serious disease will increase due to climate change. | 3.00 | 2.96 | 2.99 | 3.05 |
Table S16.
Maltese perceptions of likelihood of health risks resulting from climate change by educational level; How likely do you think it is that each of the following will occur during the next 50 years due to climate change? [Index: 1 = very unlikely to 4 = very likely]
Table S16.
Maltese perceptions of likelihood of health risks resulting from climate change by educational level; How likely do you think it is that each of the following will occur during the next 50 years due to climate change? [Index: 1 = very unlikely to 4 = very likely]
| National average | Primary / No education | Secondary | Post secondary | Tertiary |
|---|
| Worldwide, many people’s standard of living will decrease due to climate change. | 2.85 | 2.75 | 2.93 | 2.83 | 2.72 |
| Worldwide, water shortages will occur due to climate change. | 2.85 | 2.51 | 2.85 | 2.90 | 3.04 |
| Increased rates of serious disease worldwide due to climate change. | 3.28 | 3.25 | 3.33 | 3.21 | 3.26 |
| You or your family’s standard of living will decrease due to climate change. | 2.65 | 2.57 | 2.76 | 2.65 | 2.47 |
| Water shortages will occur in Malta due to climate change. | 2.66 | 2.60 | 2.73 | 2.54 | 2.64 |
| The chance of you or your family getting a serious disease will increase due to climate change. | 3.00 | 3.16 | 3.05 | 2.85 | 2.92 |
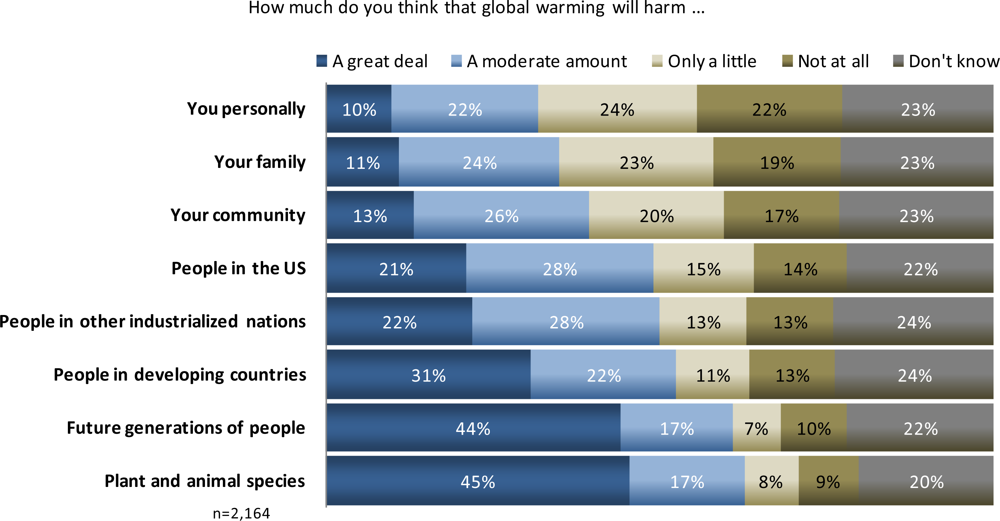
Table S17.
U.S. perceptions of how much people will be harmed by educational level; How much do you think global warming will harm?
Table S17.
U.S. perceptions of how much people will be harmed by educational level; How much do you think global warming will harm?
| National average | Less than high school | High school | Some college | Bachelor's degree or higher |
|---|
| You personally | | | | | |
| A great deal | 10 | 19 | 9 | 8 | 7 |
| A moderate amount | 22 | 18 | 20 | 22 | 25 |
| Only a little | 24 | 18 | 20 | 27 | 29 |
| Not at all | 22 | 17 | 21 | 23 | 24 |
| Don't know | 23 | 29 | 31 | 20 | 15 |
| A great deal | 10 | 19 | 9 | 8 | 7 |
| Don't know | 22 | 18 | 20 | 22 | 25 |
| χ2, p < 0.01; n = 2,139 | | | | | |
| Your family | | | | | |
| A great deal | 11 | 18 | 10 | 10 | 10 |
| A moderate amount | 24 | 19 | 24 | 25 | 26 |
| Only a little | 23 | 21 | 19 | 24 | 27 |
| Not at all | 19 | 14 | 16 | 21 | 21 |
| Don't know | 23 | 28 | 31 | 20 | 15 |
| χ2, p < 0.01; n = 2,135 | | | | | |
| Your community | | | | | |
| A great deal | 13 | 20 | 12 | 13 | 12 |
| A moderate amount | 26 | 21 | 26 | 25 | 30 |
| Only a little | 20 | 14 | 18 | 23 | 23 |
| Not at all | 17 | 13 | 14 | 19 | 20 |
| Don't know | 23 | 32 | 30 | 20 | 15 |
| χ2, p < 0.01; n = 2,137 | | | | | |
| People in the United States | | | | | |
| A great deal | 21 | 28 | 20 | 20 | 21 |
| A moderate amount | 28 | 21 | 26 | 29 | 33 |
| Only a little | 15 | 9 | 15 | 17 | 16 |
| Not at all | 14 | 11 | 12 | 15 | 16 |
| Don't know | 22 | 31 | 28 | 19 | 14 |
| χ2, p < 0.01; n = 2,145 | | | | | |
| People in other modern industrialized countries | | | | | |
| A great deal | 22 | 25 | 21 | 22 | 23 |
| A moderate amount | 28 | 19 | 27 | 27 | 33 |
| Only a little | 13 | 9 | 12 | 15 | 15 |
| Not at all | 13 | 9 | 11 | 15 | 15 |
| Don't know | 24 | 37 | 29 | 22 | 15 |
| χ2, p < 0.01; n = 2,137 | | | | | |
| People in developing countries | | | | | |
| A great deal | 31 | 31 | 24 | 32 | 40 |
| A moderate amount | 22 | 17 | 26 | 19 | 21 |
| Only a little | 10 | 6 | 11 | 13 | 10 |
| Not at all | 13 | 10 | 10 | 15 | 15 |
| Don't know | 24 | 36 | 30 | 21 | 14 |
| χ2, p < 0.01; n = 2,134 | | | | | |
| Future generations of people | | | | | |
| A great deal | 44 | 45 | 36 | 45 | 51 |
| A moderate amount | 17 | 12 | 20 | 16 | 16 |
| Only a little | 7 | 6 | 8 | 7 | 7 |
| Not at all | 10 | 8 | 7 | 11 | 13 |
| Don't know | 22 | 28 | 28 | 21 | 13 |
| χ2, p < 0.01; n = 2,130 | | | | | |
Table S18.
U.S. perceptions of how much people will be harmed by income level; How much do you think global warming will harm?
Table S18.
U.S. perceptions of how much people will be harmed by income level; How much do you think global warming will harm?
| National average | Less than $25,000 | $25,000 to $34,999 | $35,000 to $49,999 | $50,000 to $74,999 | $75,000 to $99,999 | $100,000 or more |
|---|
| You personally | | | | | | | |
| A great deal | 10 | 13 | 6 | 12 | 8 | 9 | 8 |
| A moderate amount | 22 | 19 | 24 | 22 | 22 | 21 | 24 |
| Only a little | 24 | 20 | 20 | 20 | 25 | 31 | 29 |
| Not at all | 22 | 15 | 24 | 24 | 22 | 26 | 24 |
| Don't know | 23 | 34 | 25 | 23 | 22 | 13 | 14 |
| χ2, p < 0.01; n = 2,123 | | | | | | | |
| Your family | | | | | | | |
| A great deal | 11 | 14 | 8 | 13 | 11 | 8 | 11 |
| A moderate amount | 24 | 20 | 29 | 22 | 26 | 27 | 24 |
| Only a little | 23 | 21 | 17 | 22 | 24 | 27 | 27 |
| Not at all | 19 | 10 | 22 | 20 | 18 | 25 | 22 |
| Don't know | 23 | 35 | 24 | 23 | 22 | 13 | 15 |
| χ2, p < 0.01; n = 2,121 | | | | | | | |
| Your community | | | | | | | |
| A great deal | 13 | 17 | 11 | 13 | 13 | 9 | 14 |
| A moderate amount | 26 | 24 | 30 | 25 | 27 | 27 | 25 |
| Only a little | 21 | 18 | 14 | 18 | 22 | 28 | 24 |
| Not at all | 17 | 8 | 19 | 18 | 17 | 22 | 21 |
| Don't know | 23 | 33 | 25 | 26 | 21 | 14 | 15 |
| χ2, p < 0.01; n = 2,124 | | | | | | | |
| People in the United States | | | | | | | |
| A great deal | 22 | 28 | 22 | 20 | 20 | 20 | 18 |
| A moderate amount | 28 | 25 | 26 | 28 | 31 | 28 | 30 |
| Only a little | 15 | 10 | 11 | 14 | 17 | 21 | 19 |
| Not at all | 14 | 7 | 18 | 14 | 13 | 18 | 17 |
| Don't know | 22 | 30 | 24 | 25 | 19 | 13 | 16 |
| χ2, p < 0.01; n = 2,128 | | | | | | | |
| People in other modern industrialized countries | | | | | | | |
| A great deal | 22 | 28 | 21 | 22 | 21 | 23 | 18 |
| A moderate amount | 27 | 23 | 25 | 25 | 32 | 28 | 32 |
| Only a little | 13 | 11 | 11 | 12 | 13 | 18 | 17 |
| Not at all | 13 | 6 | 16 | 13 | 13 | 17 | 17 |
| Don't know | 24 | 32 | 27 | 28 | 21 | 15 | 17 |
| χ2, p < 0.01; n = 2,126 | | | | | | | |
| People in developing countries | | | | | | | |
| A great deal | 32 | 33 | 28 | 29 | 29 | 34 | 37 |
| A moderate amount | 22 | 21 | 18 | 20 | 24 | 23 | 21 |
| Only a little | 11 | 7 | 10 | 11 | 13 | 13 | 10 |
| Not at all | 13 | 7 | 16 | 13 | 13 | 16 | 16 |
| Don't know | 24 | 32 | 27 | 27 | 22 | 14 | 16 |
| χ2, p < 0.01; n = 2,123 | | | | | | | |
| Future generations of people | | | | | | | |
| A great deal | 44 | 44 | 41 | 38 | 42 | 50 | 51 |
| A moderate amount | 17 | 14 | 18 | 17 | 22 | 15 | 14 |
| Only a little | 7 | 6 | 6 | 10 | 7 | 7 | 7 |
| Not at all | 10 | 5 | 12 | 11 | 8 | 13 | 14 |
| Don't know | 22 | 31 | 23 | 24 | 21 | 14 | 13 |
| χ2, p < 0.01; n = 2,111 | | | | | | | |
Table S19.
U.S. perceptions of how much people will be harmed by age category; How much do you think global warming will harm?
Table S19.
U.S. perceptions of how much people will be harmed by age category; How much do you think global warming will harm?
| National average | 18–29 | 30–44 | 45–59 | 60+ |
|---|
| You personally | | | | | |
| A great deal | 10 | 8 | 13 | 11 | 6 |
| A moderate amount | 22 | 23 | 21 | 23 | 21 |
| Only a little | 24 | 27 | 26 | 22 | 21 |
| Not at all | 22 | 25 | 20 | 19 | 23 |
| Don't know | 23 | 18 | 20 | 25 | 27 |
| χ2, p < 0.01; n = 2,144 | | | | | |
| Your family | | | | | |
| A great deal | 11 | 8 | 13 | 13 | 9 |
| A moderate amount | 24 | 25 | 22 | 25 | 25 |
| Only a little | 23 | 27 | 25 | 20 | 21 |
| Not at all | 19 | 21 | 19 | 17 | 18 |
| Don't know | 23 | 19 | 20 | 25 | 28 |
| χ2, p = 0.001; n = 2,139 | | | | | |
| Your community | | | | | |
| A great deal | 13 | 12 | 14 | 16 | 10 |
| A moderate amount | 26 | 25 | 25 | 26 | 28 |
| Only a little | 20 | 24 | 23 | 17 | 19 |
| Not at all | 17 | 20 | 16 | 16 | 16 |
| Don't know | 23 | 19 | 22 | 25 | 27 |
| χ2, p = 0.004; n = 2,136 | | | | | |
| People in the United States | | | | | |
| A great deal | 21 | 18 | 19 | 27 | 20 |
| A moderate amount | 28 | 30 | 32 | 24 | 27 |
| Only a little | 15 | 17 | 14 | 14 | 15 |
| Not at all | 14 | 17 | 13 | 13 | 12 |
| Don't know | 22 | 18 | 22 | 22 | 25 |
| χ2, p = 0.001; n = 2,128 | | | | | |
| People in other modern industrialized countries | | | | | |
| A great deal | 22 | 19 | 18 | 27 | 24 |
| A moderate amount | 28 | 30 | 33 | 23 | 25 |
| Only a little | 13 | 15 | 12 | 12 | 15 |
| Not at all | 13 | 16 | 13 | 13 | 10 |
| Don't know | 24 | 21 | 24 | 24 | 27 |
| χ2, p < 0.01; n = 2,138 | | | | | |
| People in developing countries | | | | | |
| A great deal | 31 | 31 | 31 | 35 | 29 |
| A moderate amount | 21 | 23 | 22 | 19 | 22 |
| Only a little | 11 | 11 | 11 | 9 | 12 |
| Not at all | 13 | 16 | 12 | 13 | 10 |
| Don't know | 24 | 19 | 24 | 24 | 27 |
| χ2, p = 0.045; n = 2,136 | | | | | |
| Future generations of people | | | | | |
| A great deal | 44 | 45 | 44 | 46 | 40 |
| A moderate amount | 17 | 16 | 19 | 15 | 17 |
| Only a little | 7 | 8 | 7 | 5 | 10 |
| Not at all | 10 | 13 | 8 | 11 | 7 |
| Don't know | 22 | 18 | 21 | 23 | 26 |
| χ2, p = 0.001; n = 2,130 | | | | | |
Table S20.
U.S. concern about who will be impacted by global warming by educational level; How concerned are you about the impact of global warming on…. [all people, all children, your children, people in the U.S., you, your health].[not at all concerned = 1, extremely concerned =7]
Table S20.
U.S. concern about who will be impacted by global warming by educational level; How concerned are you about the impact of global warming on…. [all people, all children, your children, people in the U.S., you, your health].[not at all concerned = 1, extremely concerned =7]
| National average | Less than high school | High school | Some college | Bachelor's degree or higher |
|---|
| All people | | | | | |
| 7 | 24 | 31 | 25 | 22 | 22 |
| 6 | 16 | 16 | 15 | 17 | 17 |
| 5 | 19 | 14 | 18 | 20 | 20 |
| 4 | 19 | 19 | 23 | 17 | 16 |
| 3 | 8 | 8 | 7 | 9 | 7 |
| 2 | 5 | 6 | 5 | 5 | 6 |
| 1 | 9 | 6 | 8 | 10 | 11 |
| χ2, p = 0.016; n = 2,135 | | | | | |
| All children | | | | | |
| 7 | 30 | 45 | 31 | 26 | 26 |
| 6 | 17 | 13 | 15 | 21 | 18 |
| 5 | 17 | 9 | 18 | 16 | 21 |
| 4 | 16 | 17 | 18 | 15 | 13 |
| 3 | 7 | 8 | 6 | 8 | 5 |
| 2 | 5 | 3 | 5 | 5 | 6 |
| 1 | 8 | 5 | 8 | 8 | 10 |
| χ2, p<0.01; n=2,129 | | | | | |
| Your children | | | | | |
| 7 | 30 | 39 | 29 | 29 | 26 |
| 6 | 15 | 14 | 13 | 16 | 18 |
| 5 | 15 | 13 | 16 | 14 | 15 |
| 4 | 15 | 17 | 18 | 15 | 12 |
| 3 | 6 | 7 | 6 | 7 | 6 |
| 2 | 5 | 3 | 5 | 4 | 6 |
| 1 | 14 | 8 | 13 | 14 | 17 |
| χ2, p < 0.01; n = 2,109 | | | | | |
| People in the U.S. | | | | | |
| 7 | 21 | 27 | 23 | 19 | 18 |
| 6 | 16 | 17 | 14 | 17 | 16 |
| 5 | 19 | 13 | 19 | 20 | 21 |
| 4 | 21 | 20 | 23 | 19 | 21 |
| 3 | 8 | 14 | 7 | 9 | 7 |
| 2 | 6 | 4 | 6 | 5 | 7 |
| 1 | 9 | 5 | 8 | 10 | 10 |
| χ2, p < 0.01; n = 2,141 | | | | | |
| You | | | | | |
| 7 | 21 | 23 | 24 | 21 | 17 |
| 6 | 14 | 19 | 11 | 13 | 15 |
| 5 | 17 | 14 | 18 | 20 | 16 |
| 4 | 21 | 25 | 22 | 19 | 20 |
| 3 | 9 | 7 | 7 | 12 | 10 |
| 2 | 7 | 4 | 7 | 6 | 9 |
| 1 | 11 | 8 | 11 | 10 | 13 |
| χ2, p < 0.01; n = 2,117 | | | | | |
| Your health | | | | | |
| 7 | 24 | 38 | 25 | 22 | 18 |
| 6 | 15 | 14 | 14 | 15 | 17 |
| 5 | 17 | 13 | 15 | 20 | 18 |
| 4 | 19 | 16 | 22 | 19 | 17 |
| 3 | 9 | 8 | 8 | 9 | 10 |
| 2 | 6 | 4 | 6 | 6 | 8 |
| 1 | 10 | 7 | 10 | 10 | 13 |
| χ2, p < 0.01; n = 2,134 | | | | | |
| Your lifestyle | | | | | |
| 7 | 13 | 24 | 13 | 13 | 9 |
| 6 | 10 | 10 | 10 | 8 | 11 |
| 5 | 17 | 17 | 16 | 19 | 14 |
| 4 | 25 | 23 | 28 | 24 | 24 |
| 3 | 12 | 8 | 10 | 14 | 14 |
| 2 | 10 | 8 | 10 | 9 | 12 |
| 1 | 13 | 11 | 13 | 13 | 15 |
| χ2, p < 0.01; n = 2,126 | | | | | |
| Your future | | | | | |
| 7 | 21 | 33 | 23 | 19 | 16 |
| 6 | 15 | 19 | 14 | 16 | 15 |
| 5 | 19 | 11 | 16 | 22 | 22 |
| 4 | 19 | 15 | 23 | 17 | 18 |
| 3 | 9 | 10 | 9 | 10 | 10 |
| 2 | 6 | 7 | 6 | 6 | 7 |
| 1 | 10 | 6 | 10 | 10 | 13 |
| χ2, p < 0.01; n = 2,131 | | | | | |
Table S21.
U.S. concern about who will be impacted by global warming by income level; How concerned are you about the impact of global warming on…. [all people, all children, your children, people in the U.S., you, your health].[not at all concerned = 1, extremely concerned =7]
Table S21.
U.S. concern about who will be impacted by global warming by income level; How concerned are you about the impact of global warming on…. [all people, all children, your children, people in the U.S., you, your health].[not at all concerned = 1, extremely concerned =7]
| National average | Less than $25,000 | $25,000 to $34,999 | $35,000 to $49,999 | $50,000 to $74,999 | $75,000 to $99,999 | $100,000 or more |
|---|
| All people | | | | | | | |
| 7 | 25 | 34 | 25 | 21 | 23 | 21 | 20 |
| 6 | 17 | 19 | 12 | 18 | 17 | 17 | 15 |
| 5 | 19 | 14 | 20 | 18 | 20 | 23 | 19 |
| 4 | 19 | 17 | 18 | 20 | 23 | 17 | 16 |
| 3 | 7 | 6 | 9 | 9 | 7 | 6 | 8 |
| 2 | 5 | 3 | 7 | 4 | 5 | 8 | 7 |
| 1 | 9 | 7 | 10 | 10 | 7 | 9 | 14 |
| χ2, p < 0.01; n = 2,113 | | | | | | | |
| All children | | | | | | | |
| 7 | 30 | 44 | 25 | 29 | 27 | 26 | 25 |
| 6 | 17 | 15 | 14 | 18 | 19 | 20 | 16 |
| 5 | 17 | 13 | 22 | 15 | 19 | 18 | 19 |
| 4 | 16 | 14 | 18 | 14 | 18 | 16 | 14 |
| 3 | 7 | 6 | 8 | 9 | 7 | 4 | 7 |
| 2 | 5 | 3 | 5 | 6 | 3 | 6 | 7 |
| 1 | 8 | 6 | 7 | 9 | 7 | 9 | 13 |
| χ2, p < 0.01; n = 2,113 | | | | | | | |
| Your children | | | | | | | |
| 7 | 30 | 39 | 24 | 30 | 27 | 29 | 25 |
| 6 | 15 | 14 | 13 | 16 | 17 | 17 | 15 |
| 5 | 15 | 12 | 17 | 13 | 18 | 15 | 13 |
| 4 | 15 | 14 | 19 | 13 | 17 | 15 | 17 |
| 3 | 7 | 7 | 8 | 9 | 7 | 3 | 5 |
| 2 | 5 | 4 | 5 | 4 | 4 | 7 | 6 |
| 1 | 13 | 11 | 13 | 14 | 11 | 15 | 19 |
| χ2, p = 0.01; n = 2,095 | | | | | | | |
| People in the U.S. | | | | | | | |
| 7 | 21 | 32 | 21 | 20 | 18 | 17 | 16 |
| 6 | 16 | 19 | 10 | 14 | 16 | 15 | 17 |
| 5 | 19 | 14 | 20 | 22 | 22 | 19 | 18 |
| 4 | 21 | 18 | 19 | 19 | 26 | 26 | 18 |
| 3 | 8 | 9 | 10 | 10 | 7 | 6 | 8 |
| 2 | 6 | 3 | 9 | 4 | 4 | 7 | 9 |
| 1 | 9 | 6 | 11 | 10 | 6 | 10 | 13 |
| χ2, p < 0.01; n = 2,119 | | | | | | | |
| You | | | | | | | |
| 7 | 21 | 34 | 19 | 21 | 18 | 16 | 14 |
| 6 | 14 | 13 | 12 | 17 | 15 | 15 | 12 |
| 5 | 17 | 15 | 16 | 17 | 19 | 22 | 17 |
| 4 | 21 | 19 | 23 | 17 | 23 | 20 | 22 |
| 3 | 9 | 7 | 11 | 10 | 10 | 8 | 9 |
| 2 | 7 | 4 | 9 | 6 | 5 | 8 | 10 |
| 1 | 11 | 8 | 11 | 12 | 10 | 11 | 15 |
| χ2, p < 0.01; n = 2,095 | | | | | | | |
| Your health | | | | | | | |
| 7 | 24 | 39 | 20 | 25 | 19 | 16 | 17 |
| 6 | 16 | 13 | 10 | 19 | 15 | 19 | 16 |
| 5 | 17 | 14 | 22 | 12 | 20 | 18 | 16 |
| 4 | 18 | 15 | 21 | 16 | 21 | 21 | 17 |
| 3 | 9 | 7 | 9 | 11 | 10 | 6 | 10 |
| 2 | 6 | 5 | 6 | 6 | 5 | 8 | 9 |
| 1 | 10 | 7 | 11 | 11 | 9 | 11 | 15 |
| χ2, p < 0.01; n = 2,114 | | | | | | | |
| Your lifestyle | | | | | | | |
| 7 | 13 | 22 | 15 | 15 | 7 | 8 | 10 |
| 6 | 10 | 12 | 8 | 8 | 10 | 9 | 11 |
| 5 | 17 | 15 | 18 | 15 | 18 | 20 | 15 |
| 4 | 25 | 23 | 20 | 25 | 30 | 28 | 22 |
| 3 | 12 | 10 | 16 | 14 | 12 | 10 | 12 |
| 2 | 10 | 7 | 13 | 8 | 11 | 12 | 12 |
| 1 | 13 | 11 | 12 | 14 | 13 | 13 | 18 |
| χ2, p < 0.01; n = 2,105 | | | | | | | |
| Your future | | | | | | | |
| 7 | 21 | 33 | 22 | 23 | 16 | 14 | 16 |
| 6 | 16 | 17 | 6 | 17 | 17 | 18 | 15 |
| 5 | 19 | 16 | 20 | 15 | 20 | 23 | 20 |
| 4 | 19 | 15 | 21 | 17 | 25 | 19 | 17 |
| 3 | 9 | 7 | 11 | 12 | 8 | 9 | 9 |
| 2 | 6 | 5 | 11 | 6 | 5 | 7 | 8 |
| 1 | 10 | 7 | 8 | 11 | 9 | 10 | 14 |
| χ2, p < 0.01; n = 2,107 | | | | | | | |
Table S22.
U.S. concern about who will be impacted by global warming by age category; How concerned are you about the impact of global warming on…. [all people, all children, your children, people in the U.S., you, your health].[not at all concerned = 1, extremely concerned =7]
Table S22.
U.S. concern about who will be impacted by global warming by age category; How concerned are you about the impact of global warming on…. [all people, all children, your children, people in the U.S., you, your health].[not at all concerned = 1, extremely concerned =7]
| National average | 18–29 | 30–44 | 45–59 | 60+ |
|---|
| All people | | | | | |
| 7 | 24 | 24 | 18 | 29 | 26 |
| 6 | 16 | 16 | 18 | 16 | 15 |
| 5 | 18 | 19 | 21 | 17 | 17 |
| 4 | 19 | 18 | 20 | 17 | 20 |
| 3 | 8 | 8 | 8 | 6 | 8 |
| 2 | 5 | 4 | 6 | 5 | 6 |
| 1 | 9 | 11 | 8 | 10 | 7 |
| χ2, p = 0.028; n = 2,136 | | | | | |
| All children | | | | | |
| 7 | 30 | 30 | 26 | 34 | 32 |
| 6 | 17 | 16 | 22 | 15 | 16 |
| 5 | 17 | 17 | 17 | 18 | 16 |
| 4 | 16 | 17 | 16 | 14 | 15 |
| 3 | 7 | 6 | 7 | 5 | 8 |
| 2 | 5 | 5 | 4 | 4 | 6 |
| 1 | 8 | 9 | 9 | 9 | 7 |
| χ2, p = 0.072; n = 2,130 | | | | | |
| Your children | | | | | |
| 7 | 30 | 30 | 27 | 33 | 29 |
| 6 | 15 | 17 | 19 | 11 | 15 |
| 5 | 15 | 14 | 16 | 14 | 15 |
| 4 | 15 | 16 | 15 | 15 | 15 |
| 3 | 7 | 7 | 6 | 5 | 8 |
| 2 | 5 | 4 | 3 | 6 | 5 |
| 1 | 14 | 12 | 14 | 16 | 11 |
| χ2, p = 0.016; n = 2,111 | | | | | |
| People in the U.S. | | | | | |
| 7 | 21 | 20 | 17 | 24 | 23 |
| 6 | 16 | 16 | 15 | 17 | 16 |
| 5 | 19 | 19 | 22 | 17 | 19 |
| 4 | 21 | 21 | 23 | 22 | 19 |
| 3 | 8 | 7 | 9 | 7 | 10 |
| 2 | 6 | 5 | 5 | 5 | 7 |
| 1 | 9 | 12 | 8 | 9 | 7 |
| χ2, p = 0.060; n = 2,142 | | | | | |
| You | | | | | |
| 7 | 21 | 23 | 18 | 25 | 19 |
| 6 | 14 | 13 | 13 | 15 | 14 |
| 5 | 17 | 18 | 19 | 15 | 18 |
| 4 | 21 | 21 | 23 | 21 | 19 |
| 3 | 9 | 9 | 9 | 8 | 10 |
| 2 | 7 | 6 | 7 | 7 | 8 |
| 1 | 11 | 10 | 11 | 11 | 12 |
| χ2, p = 0.343; n = 2,119 | | | | | |
| Your health | | | | | |
| 7 | 24 | 22 | 20 | 28 | 24 |
| 6 | 15 | 17 | 17 | 14 | 14 |
| 5 | 17 | 19 | 16 | 18 | 15 |
| 4 | 19 | 16 | 20 | 19 | 18 |
| 3 | 9 | 10 | 9 | 6 | 11 |
| 2 | 6 | 4 | 7 | 6 | 7 |
| 1 | 10 | 11 | 9 | 9 | 11 |
| χ2, p = 0.032; n = 2,136 | | | | | |
| Your lifestyle | | | | | |
| 7 | 13 | 15 | 10 | 15 | 12 |
| 6 | 10 | 9 | 8 | 10 | 11 |
| 5 | 17 | 17 | 17 | 18 | 15 |
| 4 | 25 | 24 | 27 | 25 | 25 |
| 3 | 12 | 9 | 14 | 11 | 13 |
| 2 | 10 | 11 | 9 | 9 | 11 |
| 1 | 13 | 13 | 14 | 12 | 14 |
| χ2, p = 0.124; n = 2,126 | | | | | |
| Your future | | | | | |
| 7 | 21 | 24 | 18 | 24 | 20 |
| 6 | 15 | 16 | 16 | 16 | 14 |
| 5 | 19 | 20 | 21 | 17 | 16 |
| 4 | 19 | 18 | 18 | 20 | 19 |
| 3 | 10 | 8 | 11 | 8 | 11 |
| 2 | 6 | 4 | 6 | 6 | 10 |
| 1 | 10 | 10 | 9 | 10 | 10 |
| χ2, p = 0.014; n = 2,133 | | | | | |
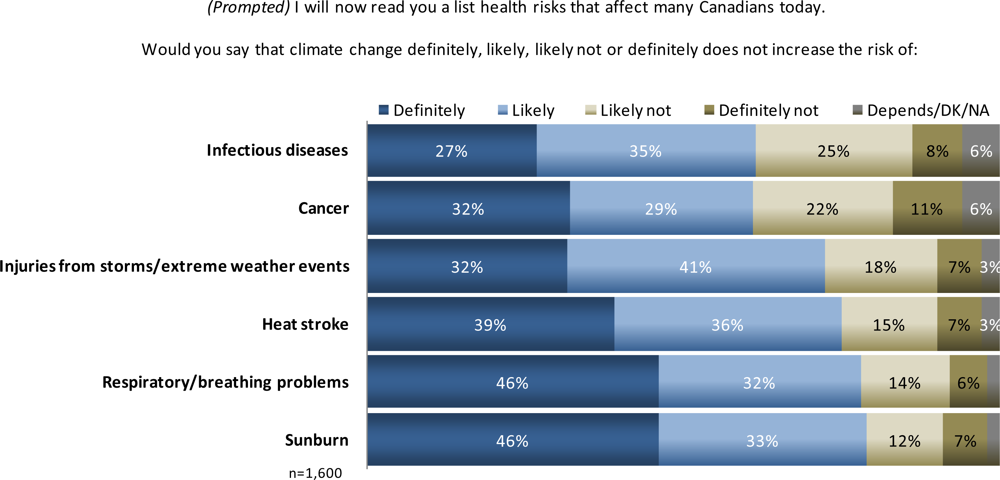
Table S23.
Canadian perceptions of likelihood of increased specific risks by education level; (Prompted) I will now read you a list health risks that affect many Canadians today. Would you say that climate change definitely, likely, likely not or definitely does not increase the risk of: (n = 1,600). Percent of definitely responses
| National average | Less than high school | High school graduate | Some college | University degree |
|---|
| Respiratory/breathing problems | 46 | 51 | 47 | 49 | 42 |
| Sunburn | 46 | 55 | 49 | 45 | 44 |
| Heat stroke | 39 | 43 | 42 | 40 | 35 |
| Injuries from storms/extreme weather | 32 | 41 | 30 | 33 | 30 |
| Cancer | 32 | 38 | 34 | 31 | 32 |
| Infectious diseases | 27 | 30 | 31 | 27 | 24 |
| n= | 1,600 | 168 | 257 | 582 | 577 |
Table S24.
Canadian perceptions of likelihood of increased specific risks by income level; (Prompted) I will now read you a list health risks that affect many Canadians today. Would you say that climate change definitely, likely, likely not or definitely does not increase the risk of: (n = 1,600). Percent of definitely responses.
| National average | Less than $40,000 | $40,000–$74,999 | $75,000 to $99,999 | $100,000+ |
|---|
| Respiratory/breathing problems | 46 | 51 | 46 | 46 | 37 |
| Sunburn | 46 | 49 | 47 | 46 | 36 |
| Heat stroke | 39 | 40 | 40 | 39 | 30 |
| Injuries from storms/extreme weather | 32 | 36 | 33 | 29 | 25 |
| Cancer | 32 | 35 | 32 | 31 | 26 |
| Infectious diseases | 27 | 29 | 28 | 29 | 18 |
| n= | 1,600 | 392 | 435 | 201 | 299 |
Figure S1.
Maltese perceptions of risk of death from climate change by educational level.
Figure S1.
Maltese perceptions of risk of death from climate change by educational level.


