Article

Relative Pesticide and Exposure Route Contribution to Aggregate and Cumulative Dose in Young Farmworker Children

1
Environmental Health Sciences, Mel and Enid Zuckerman College of Public Health, University of Arizona, 1295 N. Martin Ave, PO Box 245210, Tucson, AZ 85724, USA
2
Department of Natural Sciences and Math, Eugene Lang College, The New School, 65 West 11th Street, New York, NY 10011, USA
3
Environmental and Occupational Health, College of Public Health, University of Arkansas for Medical Sciences, 4301 W. Markham, Slot 820, Little Rock, AR 72207, USA
4
Exposure Research Group, Department of Civil and Environmental Engineering, Stanford University, 473 Via Ortega, Stanford, CA 94305, USA
5
Center for Children’s Environmental Health Research, School of Public Health, University of California Berkeley, 140 Warren Hall, Berkeley, CA 94720, USA
*
Author to whom correspondence should be addressed.
Int. J. Environ. Res. Public Health 2012, 9(1), 73-96; https://doi.org/10.3390/ijerph9010073
Submission received: 19 October 2011 / Revised: 21 December 2011 / Accepted: 22 December 2011 / Published: 3 January 2012
(This article belongs to the Special Issue Cumulative Health Risk Assessment)

Abstract

:
The Child-Specific Aggregate Cumulative Human Exposure and Dose (CACHED) framework integrates micro-level activity time series with mechanistic exposure equations, environmental concentration distributions, and physiologically-based pharmacokinetic components to estimate exposure for multiple routes and chemicals. CACHED was utilized to quantify cumulative and aggregate exposure and dose estimates for a population of young farmworker children and to evaluate the model for chlorpyrifos and diazinon. Micro-activities of farmworker children collected concurrently with residential measurements of pesticides were used in the CACHED framework to simulate 115,000 exposure scenarios and quantify cumulative and aggregate exposure and dose estimates. Modeled metabolite urine concentrations were not statistically different than concentrations measured in the urine of children, indicating that CACHED can provide realistic biomarker estimates. Analysis of the relative contribution of exposure route and pesticide indicates that in general, chlorpyrifos non-dietary ingestion exposure accounts for the largest dose, confirming the importance of the micro-activity approach. The risk metrics computed from the 115,000 simulations, indicate that greater than 95% of these scenarios might pose a risk to children’s health from aggregate chlorpyrifos exposure. The variability observed in the route and pesticide contributions to urine biomarker levels demonstrate the importance of accounting for aggregate and cumulative exposure in establishing pesticide residue tolerances in food.

1. Introduction

Passage of the Food Quality Protection Act (FQPA) in 1996 required that in determining pesticide residue limits for food, the United States Environmental Protection Agency (US EPA) take into account the health risks associated with aggregate (multiple route) and cumulative (multiple chemicals exhibiting a common mechanism of toxicity) pesticide exposure and incorporate an additional safety factor to protect children. Subsequently, multiple studies have been completed to measure organophosphate (OP) pesticides in multiple exposure media (e.g., air, water, food, dust, soil) as well as in children’s urine [1,2,3]. Typically only the non-specific metabolites common to OPs are quantified in urine to provide a measure of exposure to this class of pesticides, but this does not provide levels of exposure to individual pesticides [4]. However, methods are needed to quantify the contribution of each route and pesticide to the levels of non-specific biomarkers in urine and provide estimates of aggregate and cumulative dose, necessary for comparing to toxicological benchmarks like the US EPA Reference Dose [5,6]. Dose estimates for each exposure route and pesticide are essential for performing the aggregate and cumulative risk assessments necessary for setting food tolerance levels under the FQPA.
Many aggregate exposure and dose models assume a fractional absorption without taking into account the physiological pharmacokinetic processes of uptake [7,8,9,10]. However, even for a widely studied chemical like chlorpyrifos, there is not a consensus on the appropriate absorption fractions for each route. Due to variations in these absorption fractions and other assumptions, studies evaluating residential aggregate exposure and dose to chlorpyrifos identify different dominant exposure routes [11,12,13]. More recently, a physiologically-based pharmacokinetic (PBPK) model was developed to estimate aggregate absorption of chlorpyrifos [6]. However, the model developers did not account for many of the physiological differences between young children and adults. Furthermore they assumed no dermal exposure and utilized conservative assumptions for non-dietary exposure factors. The resulting model substantially underestimated chlorpyrifos metabolite levels in children’s urine, and it is not clear if this is due to an inadequate representation of children’s physiology or underestimation of aggregate chlorpyrifos exposure.
The first objective of this study was to develop a new model, the Child-Specific Aggregate Cumulative Human Exposure and Dose (CACHED) framework, by linking our previously developed aggregate and cumulative exposure model [14,15] with a child-specific PBPK model (Figure 1). The second objective is to validate CACHED with non-specific OP pesticide metabolite levels in urine obtained from children. The third objective of this study was to use CACHED to assess the relative contributions of multiple OP pesticides and exposure routes to absorbed dose and estimate risk for a population of young farmworker children as a case study. While all children may be exposed to pesticides through drinking water, diet and residential-use pathways [1,16,17], potential sources of additional pesticide exposure for children in farmworker homes includes aerosol drift from agriculture, and occupational take-home contamination on clothing, shoes or skin [18,19,20,21]. These potential sources of additional pesticide exposure unique to the farmworker child may contribute the greatest proportion towards non-dietary exposure routes. Assessment of route and chemical contribution towards aggregate exposure and dose is therefore of particular importance for this sensitive population to ensure that pesticide food tolerances are protective of susceptible populations.
Figure 1. Child-Specific Aggregate Cumulative Human Exposure and Dose (CACHED) model framework including cumulative, aggregate and PBPK capabilities. Modules highlighted in yellow are from Cumulative Aggregate Simulation of Exposure (CASE) [15].
Ijerph 09 00073 g001

2. Experimental Section

2.1. Study Population

The study population for these modeling simulations has been described previously [3,14,22]. Briefly, pesticide measurements were obtained from indoor and outdoor air, surface and toy wipes, house dust, duplicate diets, union suits and sock dosimeters, and urine from 20 children residing in the Salinas Valley of California [3,23]. In a second study, activity patterns were obtained via videotaping methodologies from 23 children in this region, including 11 children who participated in the first study [22]. The activities quantified were: time spent indoors and outdoors and sequential dermal and mouthing contacts. All children were between 6 and 27 months of age, of Mexican origin and lived with at least one farmworker.

2.2. Aggregate Cumulative Exposure Model and Estimates

We have previously used the Cumulative and Aggregate Simulation of Exposure (CASE) model to estimate inhalation, dermal and non-dietary ingestion exposure to two OP pesticides, chlorpyrifos and diazinon, for this population [14,15]. CASE is a physical-stochastic model that integrates complex human behavior through detailed activity patterns known as micro-level activity time series, with mechanistic exposure equations and Monte Carlo simulations of parameter distributions. Micro-level activity time series provide a second-by-second documentation of the child’s dermal and mouthing contacts and microenvironments visited. In this work, five thousand simulations were completed with each set of activity patterns obtained from each farmworker children (n = 23) in conjunction with parameter distributions developed from residential pesticide concentrations measured in farmworker residences from the same community (n = 20) to achieve a total of 115,000 unique exposure estimates (Table 1). Chlorpyrifos and diazinon were selected because of their widespread agricultural use in the Salinas Valley during the study period, common mechanism of toxicity, non-specific OP metabolites, and prevalence in residential environments and density of available literature data necessary for providing model input parameters. Although chlorpyrifos and diazinon were detected in all media from these homes, no families reported residential applications of these pesticides. Therefore we assumed that these measurements represent variability that children in this unique population might encounter within their homes and throughout the Salinas Valley.
Table 1. Farmworker children’s route-specific exposure estimates [14].
PesticideRouteRangeMeanMedian
ChlorpyrifosInhalation (ng/m3)0.37–10.811.871.83
Dermal (ng/cm2)0.01–0.770.100.08
Non-Dietary Ingestion (ng/h kg)0.31–15.032.792.54
Dietary Ingestion (ng/h kg) a0–30.953.671.59
DiazinonInhalation (ng/m3)0.08–140.034.263.97
Dermal (ng/cm2)0.01–0.240.050.04
Non-Dietary Ingestion (ng/h kg)0.23–4.231.521.43
Dietary Ingestion (ng/h kg) a0–3.300.490.35
a Dietary ingestion exposure estimates are from current work. See Section 2.3.

2.3. Dietary Exposure Estimates

To complete the calculation of aggregate dose, it was necessary for us to estimate dietary exposures for this population [24]. Food diaries meeting the demographic characteristics (i.e., ethnicity, age, gender) were extracted from the US Department of Agriculture (USDA) Food Commodity Intake Database [25]. There were 342 unique commodities obtained from the food diaries meeting the demographic criteria. Residue levels for chlorpyrifos and diazinon were assigned to each commodity. These residue values were extracted from the following databases: California Pesticide Monitoring Database 1986–1993, US Food and Drug Administration (US FDA) Compliance and Surveillance Monitoring Program 1992–1994, USDA Microbiological and Residue Computer Information System 1990–1995, Pesticide Residue Information System 1987–1994, USFDA Total Diet Study 1982–1984 and 1994–1999, USDA Pesticide Data Program 1994–1998 and 1999–2000 and US Fish and Wildlife 1995. If multiple databases provided values for the same commodity, a weighted average was calculated based upon the number of samples in each database. Dietary exposure was calculated for each of the food diaries as:
Ijerph 09 00073 i001
where Eq is the dietary exposure corresponding to food diary q [μg/kg h], Cj is the residue concentration for commodity j [μg/g], p is the number of commodities in food diary q and Iqj is the food intake rate of commodity j for food diary q [g/kg h]. To correspond with the non-dietary exposure estimates 5000 random samples of dietary exposure were obtained for each child from food diaries that corresponded to their demographic characteristics (Table 1).
As part of the quantitative exposure assessment in the 20 farmworker homes, duplicate diets and food diaries were collected for the children who provided urine samples [3]. Since only 4% and 2% of the duplicate diet samples had detectable values for chlorpyrifos and diazinon, respectively, comparison of model estimates and measured values was based on treating non-detected values as equal to 0, half the limit of detection, and the limit of detection (Figure 2). Modeled estimates for both chlorpyrifos and diazinon correspond well to the measured values from the duplicate diets.
Figure 2. Comparison between dietary exposure estimates and duplicate diet measurements [3], with non-detected values (ND) equal to zero, half the limit of detection (LOD), or LOD.
Ijerph 09 00073 g002

2.4. Development of Child-Specific PBPK Model

We developed a PBPK model capable of estimating aggregate and cumulative dose based on simultaneous exposures to chlorpyrifos and diazinon [24,26]. Within our PBPK model, separate PBPK modules are used to characterize the chemical-specific distributions of chlorpyrifos, diazinon, and their metabolites in the body. Two existing PBPK models developed for chlorpyrifos and diazinon independently provided the basis for their modules as well as for their oxon-analogs [27,28]. These modules are linked through additional modules we created for diethyl phosphate (DEP) and diethylthiophosphate (DETP)—the common metabolites for both chloryrifos and diazinon—and are collectively described as dialkyl phosphates (DAPs) for this study. To complete estimation of aggregate dose, we added additional sub-modules to account for absorption of chlorpyrifos and diazinon across the lungs, and altered the skin modules to account for diffusion across the stratum corneum and viable epidermis. A mass balance was performed for each compartment, resulting in a series of differential equations that were solved utilizing an ordinary differential equation solver for stiff equations (i.e., ode15s) in Matlab (Student Version, Release 14, The MathWorks, 2004).
For ethical reasons there are no children volunteer studies, therefore we validated our PBPK model with published studies where adult volunteers were exposed to chlorpyrifos and diazinon [29,30,31]. The input parameters required for the model are: volumes and blood flow rates of various organs in the body, chemical-specific tissue-air partition coefficients, fraction of chemical bound to plasma proteins, ingestion and dermal absorption parameters, metabolic parameters, and chemical-specific urinary clearance rates. These parameters were obtained from the experimental literature, estimated or optimized during model development. Complete model details including detailed code and validation of the model in adults is presented elsewhere [24,26].
Children are not merely miniature adults and the processes controlling the absorption, distribution, metabolism, and excretion of chemical toxins are likely to be immature or altered [32]. We calculated age-specific tissue volumes and perfusion rates as a function of body weight, height and gender according to methods described by Price et al. [33]. Age-specific alveolar air volumes and ventilation rates were obtained from ICRP [34]. We assumed a linear relationship between ages. Chemical-specific tissue:air partition coefficients were estimated according to Poulin and Krishnan [35], as a function of tissue composition (i.e., water and lipids). We estimated age-specific tissue:air partition coefficients as a function of tissue composition at different ages obtained from ICRP [36]. For our metabolic parameters, the maximum velocity (Vmax) was scaled as a function of liver mass assuming a constant microsomal protein content. We assumed the value of the Michaelis-Menten coefficient (Km) was constant with age [37]. The first-order rate constants for the metabolism of DETP and DEP were also scaled as a function of body weight to obtain age-specific values. Age-specific urinary clearance rates were estimated as a function of age-specific partition coefficients and glomerular filtration rates according to the methods in Bjorkman [38] utilizing data from Behrman et al. [39]. Creatinine excretion was also estimated as a function of age according to data from ICRP [34]. Assuming that chemical toxins behave similarly to pharmaceuticals, age-specific chemical protein binding fractions were estimated according to the equation derived by McNamara and Alcorn [40]. Hand surface area, necessary for estimating dermal absorption from hand contacts was estimated as a function of age using values presented in the US EPA Child-Specific Exposure Factors Handbook [41]. According to these methods, we calculated PBPK parameters for each child as a function of their age, height, weight, and gender (Table 2). A summary of the PBPK parameters estimated for the children are in Table 3. Complete equations and data sets are available in Beamer [24].
Table 2. Farmworker children’s demographics and physiological characteristics.
Age GroupGendernAge (Months)Weight (kg)Height (cm)
RangeMedianRangeMedianRangeMedian
InfantsMale56–1298.7–12.39.569–7671
Female86–1386.8–10.98.666–7069
ToddlersMale520–262311.8–12.512.376–8986
Female522–272611.4–16.012.386–9388
Table 3. PBPK parameters used for the child-specific model estimated using each child’s age, height and weight. Tissue: Blood partition coefficient only shown for chlorpyrifos as an example.
ParameterCompartment/ChemicalRangeMeanMedian
Compartment Volume (m3)Blood0.0006–0.00120.00090.0008
Brain0.0006–0.00100.00080.0008
Slowly Perfused0.0017–0.00310.00240.0022
Richly Perfused0.00040–0.000780.000570.00055
Fat0.0023–0.00840.00480.0049
Liver0.00022–0.000440.000320.00032
Kidneys0.00004–0.000080.000060.00006
Alveolar Air0.00037–0.000880.000600.00055
Perfusion Rate (m3/h)Brain0.020–0.0310.0260.025
Slowly Perfused0.007–0.0130.0100.009
Richly Perfused0.009–0.0170.0130.013
Fat0.004–0.0150.0090.009
Liver0.013–0.0260.0190.019
Kidneys0.008–0.0160.0110.012
Cardiac Output (m3/h) 0.062–0.1190.0870.087
Ventilation Rate (m3/h) 0.14–0.250.200.22
Renal Clearance (m3/h)Chlorpyrifos0.00038–0.000530.000460.00044
Chlorpyrifos Oxon0.00027–0.000380.000320.00031
Diazinon0.0028–0.00400.00340.0033
Diazinon Oxon0.000001–0.001070.000050.000001
DETP0.0033–0.00470.0040.0038
DEP0.017–0.0240.0210.020
Creatinine Excretion (mol/h) 0.00003–0.000070.000050.00004
Tissue:Blood Partition CoefficientBlood2.09–2.10 × 1062.09 × 1062.09 × 106
Brain4.2–5.14.64.5
Slowly Perfused3.3–3.53.43.4
Richly Perfused3.3–3.53.43.4
Fat86.4–112.3102.5108.7
Liver5.1–5.65.45.3
Kidneys4.1–4.54.34.3
Maximum Velocity Vmax (mol/h)Chlorpyrifos → Chlorpyrifos Oxon0.00009–0.000180.000130.00013
Chlorpyrifos → DETP0.00017–0.000330.000240.00024
Chlorpyrifos Oxon → DEP0.006–0.01170.00860.0087
Diazinon → Diazinon Oxon0.0002–0.000390.000280.00029
Diazinon → DETP0.00031–0.00060.000440.00044
Diazinon Oxon → DEP0.19–0.350.270.27
First Order Metabolism (mol/h)DETP0.5–0.980.720.73
DEP0.23–0.440.320.33
Protein Binding (fraction bound)Chlorpyrifos0.962–0.9630.9620.962
Chlorpyrifos Oxon0.974–0.9760.9750.975
Diazinon0.937–0.9390.9380.937
Diazinon Oxon0.863–0.8680.8650.864
DETP0.912–0.9150.9130.913
DEP0.079–0.0830.0810.08
Hand Surface Area (m2) 0.01–0.0180.0140.013

2.5. Estimation of Cumulative and Aggregate Dose and Urine Concentration

We used the child-specific PBPK model to calculate the concentration of DEP and DETP in urine and aggregate dose from exposure to chlopyrifos and diazinon for the 23 farmworker children (Table 1). Five thousand simulations were completed for each child by randomly selecting, without replacement, their 5000 dietary, inhalation, non-dietary ingestion, and dermal exposure estimates for each chemical. Since temporally-averaged estimates were used for inhalation and dermal exposure and ingestion exposure estimates are in mass per time, the model was run at steady state. Hand rinse studies have confirmed that children’s dermal exposure seems to be at steady state within one hour of a hand cleaning [42]. The ingestion and skin (i.e., diffusivity, skin partition coefficients) absorption parameters were assumed to be constant for all children.
Dermal exposure was only estimated for the hands. In a different study, we have previously quantified surface contacts for 15 different body parts [43]. Although feet have the highest contact frequency, bare hands have a greater contact frequency with surfaces than bare feet. We assumed that the majority of dermal absorption occurred through the hands.
At steady state the mass of chlorpyrifos and diazinon entering a child’s body through absorption must equal the mass of chlorpyrifos, diazinon and their metabolites exiting the body. The mass of chlorpyrifos and diazinon entering the body is their absorbed dose in units of mass per time. Therefore dose was calculated by estimating the mass exiting the body at steady state. In our PBPK model framework chlorpyrifos, diazinon, their respective oxons, DETP and DEP may only exit the body through exhalation and renal excretion. Chlorpyrifos and diazinon may also exit via fecal excretion while DETP and DEP may also be metabolized. Complete equations are provided in Beamer [24].

2.6. Model Evaluation by Comparison with Measured Urine Concentration

To evaluate the CACHED modeling framework the estimated urine concentrations from aggregate exposure to chlorpyrifos and diazinon for the 23 children who participated in video-activity pattern collection were compared with the measured DAP urine concentrations obtained from the 20 children whose houses were sampled for pesticides. We assumed that chlorpyrifos and diazinon exposure account for 100% of these DAP (DETP and DEP) levels in the urine. For the purpose of this analysis we have excluded the dimethyl metabolite levels. Chlorpyrifos and diazinon together account for 96% of the OP pesticides applied in 2002 in Monterey County that metabolize into DEP and DETP [44]. Similarly, together they also account for 99% of the fresh fruit and vegetable samples that had a diethyl OP pesticide residue detected by the USDA as part of the 2002 Pesticide Data Program [45]. Two urine samples were collected for each child during the 24-hour sampling period: one spot sample and one overnight diaper sample [3]. Since the data were not normally distributed, non-parametric tests were used to assess for statistical significance. The Wilcoxon rank sum test was used to determine if there were statistical differences in the measured spot and overnight urine samples and the estimated urine concentrations. Spearman’s rank correlation was used to assess relationships between modeled and measured urine concentrations for the 11 children that participated in both studies [3,22].

2.7. Calculation of Route and Pesticide Contribution to Aggregate Cumulative Dose

The steady state dose and urine concentration was computed for each child, first for exposure from all routes and chemicals simultaneously and subsequently for each route and each chemical separately to assess chemical and route contribution. It was assumed that the absorption from each exposure route and pesticide is independent and that dose and urine concentration could be summed across exposure routes and pesticides. Percent of route and chemical contribution was also calculated to normalize across different dose amounts. Although child-oriented simulations were not completed, whereby each child’s simulations would be only calculated based upon measurements taken from their own home, we did estimate the within- and between-child variability for the simulations to understand the role of environmental concentrations and micro-level activity patterns in the overall variability of this population. We used log-transformed values to estimate within-child and between-child variance according to Rappaport [46]. Dose and urine concentrations were tested for differences between age groups (i.e., infants and toddlers) and genders using the Wilcoxon rank sum test.

2.8. Estimation of Aggregate and Cumulative Risk

To understand the potential risks faced by this vulnerable population we calculated aggregate and cumulative risk metrics utilizing the methods employed by US EPA in their individual aggregate risk assessments of chlorpyrifos and diazinon, as well as their cumulative risk approach for OP pesticides [47,48,49]. Different endpoints are used by the US EPA for aggregate and cumulative risk assessments. For aggregate risk, route-specific margin of exposure was computed for each pesticide by dividing the route-specific no-observable-adverse-effect-level (NOAEL) (Table 4) for plasma and red blood cell cholinesterase inhibition by the estimated exposure route dose for the farmworker children from CACHED [50]. The risk index (RI) is then calculated by dividing the margin of exposure by the route-specific uncertainty factor for inter- and intra-species extrapolation and the FQPA safety factor to protect children’s health. Due to the increased risk from exposure to multiple routes, the aggregate risk index (ARI) is equal to the inverse of the sum of the inverse of each RI. An ARI or RI of less than one suggests a “risk of concern” [50].
Table 4. Toxicity endpoints, uncertainty and FQPA safety factors for calculation of aggregate and route-specific risk from chlorpyrifos and diazinon exposure.
Pesticide DermalInhalationIngestion
chlorpyrifos aNOAEL (mg/kg/day)0.03; 3% absorption0.030.03
uncertainty factor100100100
FQPA safety factor101010
diazinon bNOAEL (mg/kg/day)10.026 c0.02
uncertainty factor300300100
FQPA safety factor111
a [47]; b [48]; c Based on lowest-observable-adverse-effect-level (LOAEL) [48].
US EPA uses benchmark dose10 values (BMD10) instead of NOAEL to compute cumulative risk. For assessment of cumulative risk from OP exposure, BMD10 is based on an estimated 10% reduction in brain cholinesterase activity compared to controls. US EPA has developed relative potency factors (RPF) as the ratio of an OP pesticide BMD10 to that of the index pesticide, methamidphos [49]. The oral RPF is 0.06 and 0.01 for chlorpyrifos and diazinon, respectively. The US EPA did not develop RPFs for the dermal or inhalation routes due to the low risk posed by the remaining residential uses. As a result, the dose estimates for each pesticide were multiplied by the appropriate oral RPF and then risk metrics were computed using the route-specific BMD10, uncertainty factors, and FQPA safety factors for methamidphos (Table 5).
Table 5. Toxicity endpoints, uncertainty and FQPA safety factors for calculation of cumulative risk from methamidphos (index pesticide) exposure a.
FactorDermalInhalationIngestion
BMD10 (mg/kg/day)2.120.390.08
uncertainty factor100100100
FQPA safety factor333
a Note that chlorpyrifos and diazinon dose are converted to methamidphos dose using RPF [49,51].

3. Results and Discussion

Our previous experiences and data collection efforts in this farmworker community [3,22] provide us with an opportunity to evaluate CACHED, and in particular the “microactivity” approach and child-specific PBPK modules. In Figure 3, the estimated DAP urine concentrations (n = 115,000, median = 4.1 nmol DAP/mmol creatinine) simulated from videotaped activity patterns for the farmworker children population is compared with the measured urine concentrations obtained from overnight and spot urine samples (n = 20). No significant differences were found using the Wilcoxon rank sum test between the median modeled values and the measured values from the overnight (median = 0.7 nmol DAP/mmol creatinine, p = 0.08) and spot (median = 7.2 nmol DAP/mmol creatinine, p = 0.31) samples. The median DAP urine concentration estimates for the 11 children that participated in both videotaping and biomarker sampling were positively correlated with the measured values from their overnight (ρ = 0.69, p = 0.02) and spot urine samples (ρ = 0.21, p-value = 0.56). Interestingly, for these 11 children, there is a non-significant positive correlation between their overnight and spot urine samples (ρ = 0.41, p-value = 0.24).
Figure 3. Comparison of DAP urine concentration estimated by CACHED for the children that had their activities videotaped [22] with the DAP concentration measured in the overnight and spot urine samples of farmworker children [3].
Ijerph 09 00073 g003
The CACHED modeling framework was developed to represent the physical processes of exposure and dose through the incorporation of micro-activity time series, exposure mechanisms, and PBPK components. Utilizing careful assumptions for exposure factors and age-specific physiological parameters, CACHED simulations completed with activity patterns and environmental concentrations collected from the same farmworker children population, resulted in realistic estimates of pesticide metabolite concentration in the children’s urine (Figure 3). These simulations also provide a rigorous and successful evaluation of the “microactivity” exposure assessment approach. Young children’s mouthing contacts with hands and non-dietary objects are very frequent (42 events/h), and of short duration (2 s) [22], and realistic representations of these events are necessary to obtain accurate non-dietary ingestion exposure estimates, and to evaluate exposure route contribution. Given that children are not merely miniature adults, functions were created for the PBPK module of CACHED to adjust input parameters based on the demographic characteristics of the individual being simulated. While other PBPK models have been created for children [38,52,53,54,55], unlike the one developed for CACHED, they have not been rigorously or successfully evaluated with biomonitoring data from children [56]. Although we were able to use our model to successfully estimate pesticide metabolite urine concentration for this population of farmworker children, further investigations should be completed to evaluate the model with other populations of children simultaneously exposed to chlorpyrifos and diazinon.
The aggregate cumulative dose estimates for the simulated farmworker children population (n = 115,000) are depicted in Figure 4, as well as the dose estimates for each route for each pesticide. Chlorpyrifos had a median aggregate dose of 0.294 nmol/kg-day, and contributed substantially more to the cumulative dose than diazinon, which had a median aggregate dose of 0.148 nmol/kg-day. Dietary exposure contributed the most to the higher aggregate dose estimates for chlorpyrifos (Table 6), however below the 65th percentile, non-dietary ingestion exposure contributed substantially. Non-dietary ingestion exposure was the primary exposure route for diazinon. Neither inhalation nor dermal exposure contributed substantially to aggregate exposure for chlorpyrifos or diazinon. Even though chlorpyrifos contributed more to cumulative dose in general, there were simulations where diazinon contributed the most to cumulative dose, as evident by the range in Table 6. This demonstrates how important it is to account for exposure to multiple pesticides in determining food tolerances under the FQPA, in particular for diazinon. The non-dietary ingestion exposure route contributed the most to aggregate dose (Table 6), also demonstrating how important it is to account for exposure from routes other than dietary ingestion. Dietary ingestion was the second most significant route for aggregate dose. However, as evident by the range of proportional contributions, there were simulations when dietary exposure and even inhalation exposure were the most significant routes. The variability observed in the route and pesticide contributions to dose simulated by CACHED (Table 6) confirms the importance of accounting for aggregate and cumulative exposure in establishing pesticide residue tolerances in food under the FQPA.
Figure 4. Population dose distributions for each route, pesticide, and for cumulative and aggregate simulations (n = 115,000).
Ijerph 09 00073 g004
Table 6. Dose estimations (nmol/kg-day) for the farmworker children population (n = 115,000) by pesticide and route.
PesticideRouteRangeMeanMedian
chlorpyrifosdermal0.000–0.003(0.0–1.5%)0.001(0.3%)0.001(0.2%)
inhalation0.000–0.011(0.0–5.3%)0.002(0.9%)0.002(0.8%)
non-dietary ingestion0.023–1.206(1.5–84.5%)0.189(56.6%)0.175(59.2%)
dietary0.000–2.120(0.0–94.4%)0.252(42.2%)0.109(39.4%)
aggregate a0.031–2.43(28.2–96.8%)0.444(67.5%)0.314(65.7%)
diazinondermal0.000–0.003(0.0–1.4%)0.001(0.5%)0.001(0.4%)
inhalation0.000–0.166(0.0–42.4%)0.006(4.8%)0.006(4.0%)
non-dietary ingestion0.018–0.365(1.2–60.1%)0.123(72.1%)0.113(76.2%)
dietary0.000–0.260(0.0–56.0%)0.039(22.6%)0.314(18.6%)
aggregate a0.028–0.551(3.2–71.8%)0.169(32.5%)0.158(34.3%)
cumulativedermal0.000–0.005(0.0–2.9%)0.001(0.3%)0.001(0.3%)
inhalation0.001–0.170(0.1–43.5%)0.009(2.1%)0.009(1.7%)
non-dietary ingestion0.051–1.48(3.0–99.1%)0.312(59.5%)0.292(62.4%)
dietary0.000–2.20(0.0–96.5%)0.290(38.1%)0.150(34.7%)
aggregate0.061–2.78 0.613 0.496
a percent contribution of pesticide to cumulative dose.
Our results indicate that the absorbed dose from dermal exposure is two orders of magnitude lower than that from either ingestion route. Because bare hands have the greatest contact frequency we only estimated dermal absorption from the hands. However, this may have underestimated the contribution of dermal absorption. As part of the environmental sampling completed in the farmworker households, the children wore union suits and socks that were later analyzed for pesticide loading [3]. Our dermal exposure estimates for the hand were comparable to the pesticide loading on the socks [14]. We did not estimate dermal absorption for the feet because the children for the most part were wearing shoes and socks. However even had we included dermal absorption from the feet our absorbed dermal dose would approximately double and still be two orders of magnitude lower than other routes. The pesticide loading on the union suits was an order of magnitude lower than on the socks. For example, the mean chlorpyrifos loading was 0.01 ng/cm2 and 0.11 ng/cm2 for the union suit and socks, respectively. Given that the children were clothed and the lower pesticide loading on other parts of the body, it is not likely that dermal absorption from these other body parts would have contributed substantially to aggregate dose. Future investigations should be completed that examine relative dermal exposure from different body parts in relation to contact frequency, duration, surface area and clothing.
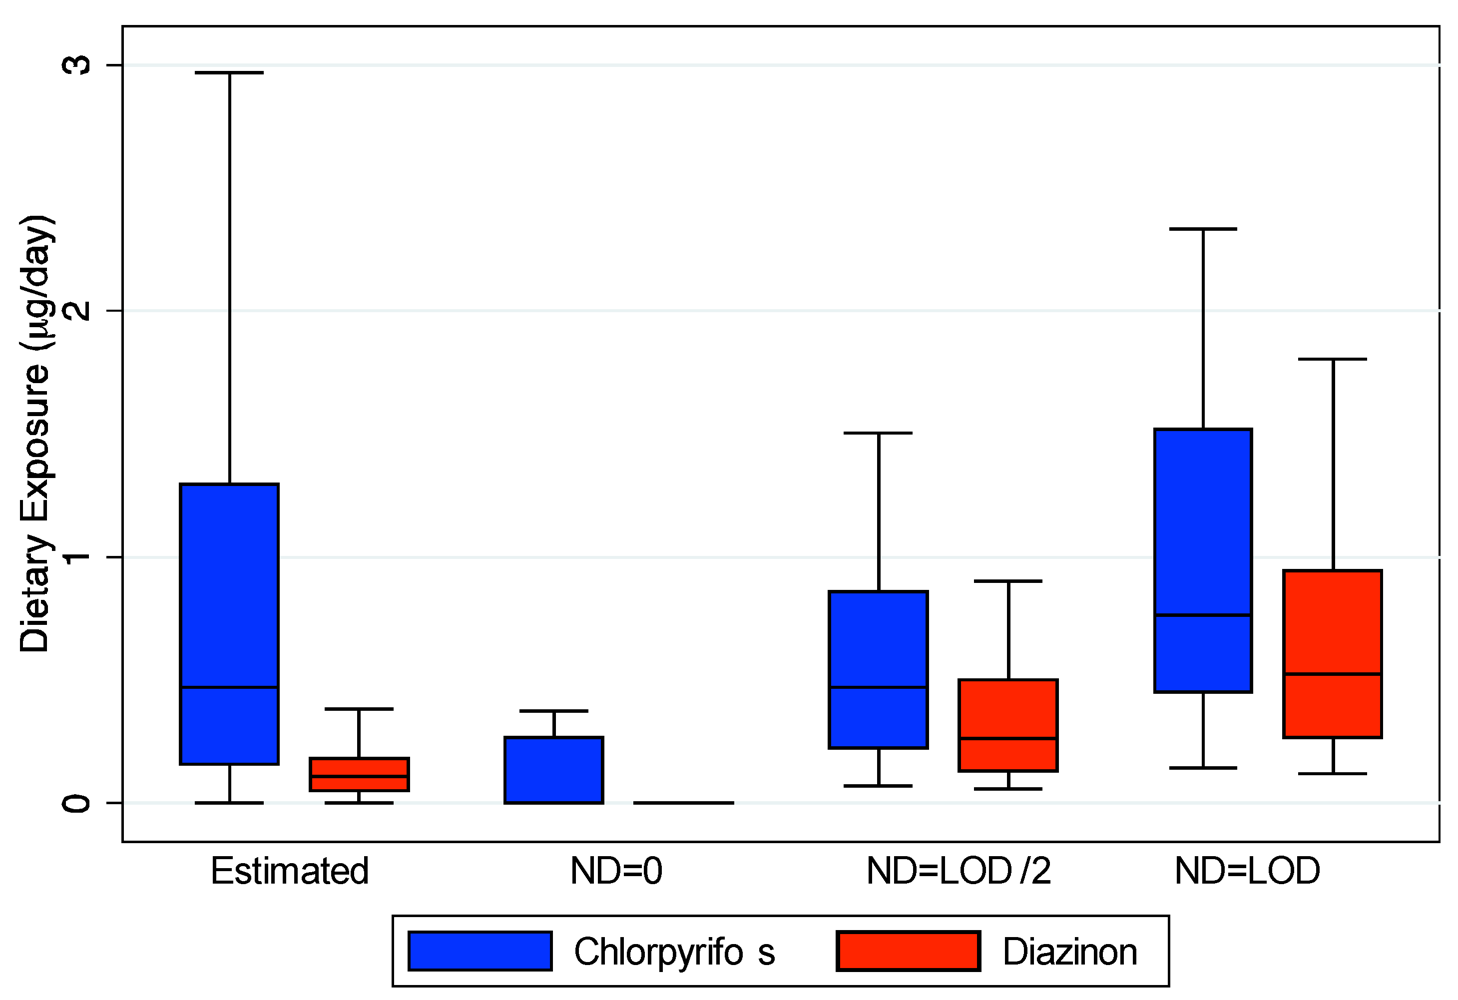
Our estimation of dietary exposure utilizing food diaries and pesticide residue values from national databases does not account for any contribution of ingestion exposure from handling the food by the child or other family members. In addition, the food may have higher pesticide residues depending upon how it is stored in these homes that may have increased residential pesticide contamination due to proximity to agricultural fields or through direct contact with contaminant surfaces [57]. Although few pesticides were detected in the duplicate diet measurements, these measurements do account for potential contamination during food storage and preparation. As our estimated exposures are similar to the duplicate diet measurements (Figure 2), these additional potential sources of dietary exposure may not be substantial. However, due to their young age, the children in our study ate mostly with their hands. Simulations from a different study indicate that children’s handling of food can account for 20–80% of their dietary intake [58]. A major limitation of our current study is that we do not account for these additional sources of dietary exposure, thus underestimating the contribution of this route to aggregate dose. Although these exposures do contribute to overall dietary exposure, they should be quantified separately so that food tolerances developed under the FQPA take into account these additional exposures unique to children. It is also not currently clear how food handling may affect other routes of exposures. For example, it may decrease dermal exposure as a removal mechanism which in turn may decrease their non-dietary ingestion exposure.
Non-dietary ingestion exposure contributes most to aggregate cumulative dose and is a function of the children’s hand-to-mouth and object-to-mouth frequency. Hand-to-mouth frequency is highest during eating events and thus there is substantial non-dietary exposure while a child is handling food as well. Given that the mouthing frequencies quantified in these children [22] exceed US EPA’s recommendations for use in risk assessments [49], risk estimates based on their guidelines might underestimate the potential risk of residential pesticide exposure in children.
There was much higher within-child variability than between-child variability for absorbed cumulative dose for cumulative aggregate, inhalation and dietary exposure (Table 7). However, there was much greater between-child variability compared to within-child variability for cumulative absorbed dose from non-dietary ingestion and dermal exposure. These findings are consistent with our analyses of exposures in this population [14]. Given that we used the same pesticide concentration and exposure factor distributions for each child, and the within-child variability is so small, the variability between children for dermal and non-dietary ingestion dose is most likely attributed to their individual activity patterns even after accounting for differences in their physiology. There is over an order of magnitude difference in the non-dietary ingestion dose for the child with lowest exposure and the child with the highest exposure, highlighting that some children may be at substantially higher risk for residential pesticide exposure. In setting appropriate food tolerances under the FQPA, it is important that they are protective of at-risk children exhibiting unique activity patterns. Considering the recent associations with neurodevelopment and attention deficit/hyperactivity disorder and organophosphate pesticide exposure [59,60,61], it would be important to examine in the future if these children’s increased exposure is as a function of increased activity during the first few years of life.
Table 7. Within-child and between-child variance calculated for the 5000 simulations for each of the 23 children according to Rappaport [46].
PesticideRouteWithin-Child VarianceBetween-Child Variance
ChlorpyrifosDermal0.010.26
Inhalation0.040.04
Non-dietary ingestion0.030.39
Dietary8.350.98
Aggregate0.430.13
DiazinonDermal0.010.23
Inhalation0.180.06
Non-dietary ingestion0.020.37
Dietary5.120.51
Aggregate0.070.16
CumulativeDermal0.010.24
Inhalation0.090.04
Non-dietary ingestion0.020.38
Dietary5.050.79
Aggregate0.270.12
As in our analyses of our exposure simulations, no significant differences were observed in absorbed dose for any route as a function of gender for either chlorpyrifos or diazinon [14]. However, several significant differences in absorbed dose were identified between infants (6–13 months) and toddlers (20–26 months) (Figure 5). Toddlers had a higher dietary dose on a per body weight basis than infants (p = 0.02). Conversely, infants had a higher non-dietary ingestion (p = 0.008) and aggregate diazinon dose than toddlers (p = 0.02). Both of these findings have particular importance for setting appropriate pesticide tolerances for food under the FQPA. Toddlers may be the most at-risk group for direct ingestion of pesticides from food, and special consideration should be given to their increased food consumption rates. Infants, however, are of particular concern because they receive a substantially larger dose from routes other than food ingestion, highlighting the importance of accounting for these routes of exposure in determining allowable pesticide levels on food.
Figure 5. Significant differences (p < 0.05) between infants and toddlers in aggregate diazinon and cumulative dietary and non-dietary ingestion dose (nmol/kg-day).
Ijerph 09 00073 g005
The computed RIs and ARI for the farmworker children population according to the methods used by US EPA for aggregate exposure to chlorpyrifos and diazinon [47,48] and cumulative aggregate exposure to organophosphate pesticides [49] are presented in Table 8. According to these metrics, only less than 4% of the estimated non-dietary ingestion and aggregate diazinon doses pose a risk for this population. Conversely, while none of the children in the population (n = 115,000) are potentially at risk from inhalation exposure to chlorpyrifos, approximately 4%, 57%, 83% and 98% are at risk from dermal, dietary, non-dietary ingestion and aggregate exposure to chlorpyrifos. As demonstrated in Table 8, none of the exposure scenarios present a risk from cumulative exposure to chlorpyrifos and diazinon. However, the toxicological endpoint used for cumulative risk is the BMD10, which is much higher than the NOAEL used for risk estimates of singular pesticides (Table 4 and Table 5). Given the very different results, it is not clear if the aggregate risk assessments using the NOAEL are too conservative or if the cumulative risk assessments using the BMD10 are not protective enough. However, several adverse effects on neurodevelopment in children have already been associated with urinary DAP metabolite levels in the larger cohort of Latino children in our agricultural study community [59,60,61]. This highlights the importance in determining more specific endpoints for risk analysis of pesticide exposure in children.
Table 8. Route-specific and aggregate risk indices for farmworker children simulations (n = 115,000) from chlorpyrifos, diazinon and cumulative exposure. An ARI or RI of less than one suggests a “risk of concern” [50].
PesticideRouteRangeMeanMedian
Chlorpyrifos aDermal0.5–10.34.64.3
Inhalation5.9–78.636.134.7
Non-dietary ingestion0.05–Inf4.20.7
Dietary0.04–2.40.70.5
Aggregate0.02–1.10.30.2
Diazinon aDermal5280–42,10019,20019,500
Inhalation13.6–25953.446.2
Non-dietary ingestion1.8–Inf1,07023.0
Dietary0.5–29.07.45.8
Aggregate0.4–13.24.44.0
Cumulative bDermal163,000–2,800,0001,280,0001,220,000
Inhalation9130–96,30045,00043,300
Non-dietary ingestion16.0–Inf2310257
Dietary12.4–780217161
Aggregate7.7–48010591
a Calculated using parameters for aggregate risk in Table 4; b Calculated using parameters for cumulative risk Table 5.
While the modeled DAP urine concentration was quite similar to measured values collected from children in the same population (Figure 3), the aggregate dose estimates are quite different than estimates from other studies (Table 9). Other studies assumed values for necessary exposure factors, activity, and absorption fractions for each route to estimate aggregate dose from environmental concentrations, making it complicated to compare aggregate and route-specific dose estimates. O’Rourke and colleagues [62] calculated “theoretical” absorbed daily dose assuming 100% clearance from the maximum DAP urine concentration measured in agricultural children 3–5 years old in Arizona. This resulted in aggregate dose estimates for chlorpyrifos and diazinon that were about an order of magnitude higher than the estimates from CACHED. Wilson and colleagues [13] assumed that the contribution of dermal exposure is negligible, and their estimates for children 2–5 years old in North Carolina were lower than the estimates from CACHED, especially for diazinon. In a follow up study in the same population, estimated aggregate exposures for diazinon under-predicted urinary measurements by an order of magnitude [63]. While these were not farmworker children, the environmental concentrations, with the exception of outdoor air, measured in their homes were comparable to the values in the farmworker children’s homes [3]. The differences between these studies and the current study underscore how differences in the methods and assumptions used can result in very different estimates of absorbed dose and aggregate risk.
Similarly, Lu et al. estimated aggregate chlorpyrifos dose for children in Washington using a linked exposure-PBPK model and from the TCP urine levels directly [6]. They indicated that there model only reasonably predicted TCP metabolite levels for the two children who had chlorpyrifos quantified in their duplicate diet measurements. However, these children had comparable measured TCP levels in their urine with those that were assumed to have no dietary exposure. Assuming no-dietary exposure for children with duplicate diets may have underestimated their dietary exposures substantially (Figure 2). Similarly they assumed no dermal exposure, only 20 hand-to-mouth contacts per day, and 100 mg/day of dust ingestion. We have previously demonstrated that these assumptions may vastly underestimate dermal and non-dietary ingestion exposure [14], which our current analyses demonstrate are important components of aggregate exposure. Similarly, Lu et al. [6] did not adjust many of the PBPK parameters that are likely to be altered in young children such as partition coefficients, clearance rates and protein binding [6]. In our model these are some of the most sensitive parameters [24,26]. It is likely that both inadequacies in aggregate exposure estimation and in developing their child-specific PBPK model, led to their models underestimation of TCP levels in urine.
A few studies have provided route-specific dose estimates for chlorpyrifos. Pang and colleagues [11] estimated aggregate chlorpyrifos dose for 80 individuals over the age of 10 in Maryland. While their median estimate was lower than the CACHED estimates their reported range and mean values were comparable. Pang et al. [11] also report the dose for each route, and determined inhalation of indoor air to account for 85% of aggregate dose (Table 9). They assumed 100% absorption of chlorpyrifos inhaled, which resulted in an inhalation dose much higher than the estimates from CACHED which were based on blood:air partition coefficients and child-specific ventilation rates. However, their estimated values for dose from the other routes are much lower than the current study, especially from ingestion for which they assumed 50% absorption. Morgan et al. [12] also report aggregate and route-specific chlorpyrifos dose estimates for children <1 to 5 years in North Carolina. While they did include dermal exposure, they used lower absorption fractions for inhalation and ingestion than Wilson et al. [13]. This resulted in estimates that were much lower than Wilson et al. [13] and the values in this current study (Table 9). Their estimated values for each exposure route were lower than the CACHED estimates, especially for dietary and non-dietary ingestion. Morgan and colleagues [12] also measured TCP in the children’s urine. Their aggregate dose estimates were unable to account for over 60% of the measured metabolite levels in urine. In contrast, the success of CACHED to simulate the DAP urine concentration of the farmworker children (Figure 3) demonstrates the importance of utilizing a model that accounts for the physical process of exposure and dose, and incorporates micro-level activity patterns based on real children. Activity patterns from videotape were collected as part of the studies in Arizona and North Carolina [12,13,62]. Thus, these studies could provide a unique opportunity to further evaluate the CACHED modeling framework and assess the relative contribution of exposure routes to aggregate risk in different children populations.
Table 9. Comparison of route-specific and aggregate dose estimates from CACHED and other studies.
StudyUnitsStatisticDermalInhalationDietaryNon-DietaryAggregate
Currentng/kg-dayRange0.1–1.20.1–3.90.0–7438.0–42310.9–853
Mean0.30.988.266.2157
Median0.20.938.161.4110
ng/dayRange0.8–13.31.5–42.50.0–809686.8–4609118.4–9302
Mean2.79.49627221,696
Median2.29.64026561,128
Morgan [12]ng/kg-dayRange0.0–11.90.0–30.30.0–3.30.0–10,2000.5–179
Mean0.12.10.32858.1
Median0.00.80.10.03
Pang [11]ng/dayRange0.0–2410.0–13,9000.0–10,2000.0–21713.5–12,800
Mean4.35942854.31,390
Median0.01030.00.0112
O’Rourke [62]ng/kg-dayRange 2,430–13,000
Mean 6006
Median 2590
Wilson [13]ng/kg/dayRange 10.6–329
Mean 76.1
Median 30.0
Wilson [63]ng/kg/dayRange 0.86–164
Mean
Median 8.22
Lu ng/kg/dayRange <1–2302
(Predicted) [6] Mean 180
Median 4
Lu ng/kg/dayRange 40–1320
(Measured) [6] Mean 420
Median 330
Children’s aggregate and cumulative risk from exposure to multiple pesticides via multiple routes involves many complex mechanisms and processes. The CACHED modeling framework was developed in an attempt to describe these processes through mathematical calculations, with a particular emphasis on the complex mechanisms governing dermal and non-dietary ingestion exposure. Given the complexity of these exposure routes and the PBPK components, and the numerous assumptions made in developing the equations and selecting appropriate parameter values, it is remarkable that the estimates from CACHED were not significantly different from what was measured in the children. However, there are still several mechanisms of dermal and non-dietary exposure that should be explored in the future [14]. For example, our modeling efforts did not account for non-dietary ingestion exposure from handling of food with contaminated hands or for dermal exposure to body parts other than the hands. For both the exposure and PBPK components there are still several parameters for which there is limited experimental data and assumptions had to be made. For dermal exposure more data is needed regarding the transfer of pesticides to the hands in residential settings, where the pesticides may be present in numerous phases (e.g., a residue or adhered to dust particles). There is also not much experimental data for two of the key parameters for non-dietary ingestion exposure: surface area of mouthing or saliva removal efficiency. Additional data on these parameters would also help refine estimates. The PBPK model is most sensitive to partition coefficients and the fraction of pesticide or metabolite bound to plasma proteins. There are currently very few experimental values for these parameters for chlorpyrifos and diazinon and virtually no experimental data for their metabolites. For our purposes these parameters were estimated and optimized during the initial PBPK model evaluation. Furthermore, there is also no experimental data for these parameters in children. Although the assumptions we have made in calculating these parameters for children seems to be adequate from the model evaluation, it would be helpful in the future to verify these assumptions with experimental measurements to refine future exposure models for children.

4. Conclusions

The CACHED modeling framework was developed with an attempt to represent the physical processes of exposure and dose through incorporation of micro-level activity time series, exposure mechanisms, and PBPK components. Utilizing careful assumptions for exposure factor and age-specific physiological parameters, CACHED simulations using micro-activities and environmental concentrations collected from the same farmworker children population resulted in realistic estimates of pesticide metabolite concentration in the children’s urine. These simulations with the CACHED framework provide a rigorous yet successful evaluation of the “microactivity” exposure assessment approach. Young children’s mouthing contacts with hands and non-dietary objects are very frequent (42 events/h) and of short duration (2 s) [22], and detailed estimations of these events are necessary to obtain accurate non-dietary ingestion exposure estimates, and to evaluate exposure route contribution. These simulations also represent the first time that a PBPK model was successfully evaluated using biomarker measurements from children.
Analysis of the route and chemical contribution of the dose estimates from CACHED demonstrate non-dietary ingestion exposure is the most significant route and chlorpyrifos is the dominant pesticide. However, dietary exposure contributes the most to risk from aggregate chlorpyrifos exposure. The between-child variability observed in the route and pesticide contributions to dose and resulting DAP urine concentration, indicates the importance of accounting for aggregate and cumulative exposure in establishing pesticide residue tolerances in food under the FQPA and that certain children may be most at-risk due to their unique behaviors. The risk metrics computed from the CACHED estimates, which are based on measured pesticide levels in the homes of real farmworker children, indicate that over 95% of these exposure scenarios might pose a potential risk to children in this community from aggregate chlorpyrifos exposure even after the ban for residential use. Given that adverse neurodevelopment outcomes have been associated with pesticide exposures in this community, and none of the families that participated in the measurement study reported any residential use of OP pesticides [3], it is important to determine the contribution of the agricultural spray drift and occupational take-home exposure pathways to these risk estimates to determine if farmworker children have increased risk compared to other children. The CACHED modeling framework could be used in the future to test intervention scenarios, aimed at reducing the risk to these children.

Acknowledgements

The authors would like to thank the families for their participation in the study and field and laboratory staff that collected the data, as well as Brenda Eskenazi for her guidance. This project was funded by Stanford NIH Graduate Training Program in Biotechnology, EPA Star Grant (#RA2936201), CHAMCOS (EPA grant #R826709 and NIEHS grant #5P01 ES09605), the UPS Foundation (#2DDA103), and the Superfund Basic Research Program at the University of Arizona (NIEHS Grant ES04940). This research has not been subjected to federal peer and policy review. The authors declare no conflict of interest.

References

  1. Fenske, R.A.; Kissel, J.C.; Lu, C.S.; Kalman, D.A.; Simcox, N.J.; Allen, E.H.; Keifer, M.C. Biologically based pesticide dose estimates for children in an agricultural community. Environ. Health Perspect. 2000, 108, 515–520. [Google Scholar]
  2. Wilson, N.K.; Chuang, J.C.; Iachan, R.; Lyu, C.; Gordon, S.M.; Morgan, M.K.; Ozkaynak, H.; Sheldon, L.S. Design and sampling methodology for a large study of preschool children’s aggregate exposures to persistent organic pollutants in their everyday environments. J. Expo. Anal. Environ. Epidemiol. 2004, 14, 260–274. [Google Scholar]
  3. Bradman, A.; Whitaker, D.; Quiros, L.; Castorina, R.; Henn, B.C.; Nishioka, M.; Morgan, J.; Barr, D.B.; Harnly, M.; Brisbin, J.A.; et al. Pesticides and their metabolites in the homes and urine of farmworker children living in the Salinas Valley, CA. J. Expo. Sci. Environ. Epidemiol. 2007, 17, 331–349. [Google Scholar] [CrossRef] [PubMed]
  4. Barr, D.B.; Bravo, R.; Weerasekera, G.; Caltabiano, L.M.; Whitehead, R.D., Jr.; Olsson, A.O.; Caudill, S.P.; Schober, S.E.; Pirkle, J.L.; Sampson, E.J. Concentrations of dialkyl phosphate metabolites of organophosphorus pesticides in the US population. Environ. Health Perspect. 2004, 112, 186–200. [Google Scholar]
  5. Hubal, E.A.C.; Sheldon, L.S.; Burke, J.M.; McCurdy, T.R.; Barry, M.R.; Rigas, M.L.; Zartarian, V.Z.; Freeman, N.C.G. Children’s exposure assessment: A review of factors influencing children’s exposure, and the data available to characterize and assess that exposure. Environ. Health Perspect. 2000, 108, 475–486. [Google Scholar]
  6. Lu, C.; Holbrook, C.M.; Andres, L.M. The implications of using a Physiologically Based Pharmacokinetic (PBPK) model for pesticide risk assessment. Environ. Health Perspect. 2010, 118, 125–130. [Google Scholar]
  7. Matoba, Y.; Takimoto, Y.; Kato, T. Indoor behavior and risk assessment following residual spraying of d-phenothrin and d-tetramethrin. Am. Ind. Hyg. Assoc. J. 1998, 59, 191–199. [Google Scholar]
  8. Baugher, D.G.; Bray, L.D.; Breckenridge, C.B.; Crouch, E.A.C.; Farrier, D.S.; MacIntosh, D.L.; Mellon, J.E.; Sielken, R.L.; Stevens, J.T. Cumulative and Aggregate Risk Evaluation System (CARES) Conceptual Model. In Proceedings of the FIFRA Scientific Advisory Panel Meeting, Arlington, VA, USA, 1999.
  9. Price, P.S.; Young, J.S.; Chaisson, C.F. Assessing aggregate and cumulative pesticide risks using a probabilistic model. Ann. Occup. Hyg. 2001, 45, S131–S142. [Google Scholar]
  10. Williams, P.R.D.; Holicky, K.C.; Paustenbach, D.J. Current methods for evaluating children’s exposure for use in health risk assessment. J. Child. Health 2003, 1, 41–98. [Google Scholar]
  11. Pang, Y.H.; MacIntosh, D.L.; Camann, D.E.; Ryan, B. Analysis of aggregate exposure to chlorpyrifos in the NHEXAS-Maryland investigation. Environ. Health Perspect. 2002, 110, 235–240. [Google Scholar]
  12. Morgan, M.K.; Sheldon, L.S.; Croghan, C.W.; Jones, P.A.; Robertson, G.L.; Chuang, J.C.; Wilson, N.K.; Lyu, C.W. Exposures of preschool children to chlorpyrifos and its degradation product 3, 5, 6-trichloro-2-pyridinol in their everyday environments. J. Expo. Anal. Environ. Epidemiol. 2005, 15, 297–309. [Google Scholar] [CrossRef] [PubMed]
  13. Wilson, N.K.; Chuang, J.C.; Lyu, C.; Menton, R.; Morgan, M.K. Aggregate exposures of nine preschool children to persistent organic pollutants at day care and at home. J. Expo. Sci. Environ. Epidemiol. 2003, 13, 187–202. [Google Scholar]
  14. Beamer, P.I.; Canales, R.A.; Bradman, A.; Leckie, J.O. Farmworker children’s residential non-dietary exposure estimates from micro-level activity time series. Environ. Int. 2009, 35, 1202–1209. [Google Scholar]
  15. Canales, R.A.; Leckie, J.O. Application of a stochastic model to estimate children’s short-term residential exposure to lead. Stoch. Environ. Res. Risk Assess. 2007, 21, 737–745. [Google Scholar]
  16. Melnyk, L.J.; Berry, M.R.; Sheldon, L.S. Dietary exposure from pesticide application on farms in the agricultural health pilot study. J. Expo. Anal. Environ. Epidemiol. 1997, 7, 61–80. [Google Scholar]
  17. USEPA, Nonoccupational Pesticide Exposure Study (NOPES) Final Report; United States Environmental Protection Agency: Washington, DC, USA, 1990.
  18. Bradman, M.A.; Harnly, M.E.; Draper, W.; Seidel, S.; Teran, S.; Wakeham, D.; Neutra, R. Pesticide exposures to children from California’s Central Valley: Results of a pilot study. J. Expo. Anal. Environ. Epidemiol. 1997, 7, 217–234. [Google Scholar]
  19. Eskenazi, B.; Bradman, A.; Castorina, R. Exposures of children to organophosphate pesticides and their potential adverse health effects. Environ. Health Perspect. 1999, 107, 409–419. [Google Scholar]
  20. Fenske, R.A.; Lu, C.S.; Simcox, N.J.; Loewenherz, C.; Touchstone, J.; Moate, T.F.; Allen, E.H.; Kissel, J.C. Strategies for assessing children’s organophosphorus pesticide exposures in agricultural communities. J. Expo. Anal. Environ. Epidemiol. 2000, 10, 662–671. [Google Scholar]
  21. Fenske, R.A.; Lu, C.S.; Barr, D.; Needham, L. Children’s exposure to chlorpyrifos and parathion in an agricultural community in Central Washington State. Environ. Health Perspect. 2002, 110, 549–553. [Google Scholar]
  22. Beamer, P.; Key, M.E.; Ferguson, A.C.; Canales, R.A.; AuYeung, W.; Leckie, J.O. Quantified activity pattern data from 6-to-27-month-old farmworker children for use in exposure assessment. Environ. Res. 2008, 108, 239–246. [Google Scholar]
  23. Bradman, A. Corrigendum: Pesticides and their metabolites in the homes and urine of farmworker children living in the Salinas Valley, CA. J. Expo. Sci. Environ. Epidemiol. 2009, 19, 694–695. [Google Scholar]
  24. Beamer, P. Development of a Model to Estimate Aggregate and Cumulative Exposure and Dose in Young Children. 2007. [Google Scholar]
  25. USEPA, Food Commodity Intake Database Version 2.1 [CD-ROM]; Office of Pesticide Programs and US Department of Agriculture, Agricultural Research Service: Springfield, VA, USA, 2000.
  26. Beamer, P.I.; Leckie, J.O. Development of a cumulative and aggregate PBPK model for chlorpyrifos and diazinon. J. Expo. Sci. Environ. Epidemiol. 2011. in revision.. [Google Scholar]
  27. Timchalk, C.; Nolan, R.J.; Mendrala, A.L.; Dittenber, D.A.; Brzak, K.A.; Mattsson, J.L. A Physiologically Based Pharmacokinetic and Pharmacodynamic (PBPK/PD) model for the organophosphate insecticide chlorpyrifos in rats and humans. Toxicol. Sci. 2002, 66, 34–53. [Google Scholar]
  28. Poet, T.S.; Kousba, A.A.; Dennison, S.L.; Timchalk, C. Physiologically based pharmacokinetic/pharmacodynamic model for the organophosphorus pesticide diazinon. Neurotoxicology 2004, 25, 1013–1030. [Google Scholar]
  29. Nolan, R.J.; Rick, D.L.; Freshour, N.L.; Saunders, J.H. Chlorpyrifos—Pharmacokinetics in human volunteers. Toxicol. Appl. Pharmacol. 1984, 73, 8–15. [Google Scholar]
  30. Garfitt, S.J.; Jones, K.; Mason, H.J.; Cocker, J. Exposure to the organophosphate diazinon: Data from a human volunteer study with oral and dermal doses. Toxicol. Lett. 2002, 134, 105–113. [Google Scholar]
  31. Griffin, P.; Mason, H.; Heywood, K.; Cocker, J. Oral and dermal absorption of chlorpyrifos: A human volunteer study. Occup. Environ. Med. 1999, 56, 10–13. [Google Scholar]
  32. Milsap, R.L.; Jusko, W.J. Pharmacokinetics in the infant. Environ. Health Perspect. 1994, 102, 107–110. [Google Scholar]
  33. Price, P.S.; Conolly, R.B.; Chaisson, C.F.; Gross, E.A.; Young, J.S.; Mathis, E.T.; Tedder, D.R. Modeling interindividual variation in physiological factors used in PBPK models of humans. Crit. Rev. Toxicol. 2003, 33, 469–503. [Google Scholar]
  34. International Commission on Radiological Protection, Report of the Task Group on Reference Man. International Committee on Radiological Protection; ICRP: Ottawa, Canada, 2003.
  35. Poulin, P.; Krishnan, K. Molecular structure-based prediction of the partition coefficients of organic chemicals for physiological pharmacokinetic models. Toxicol. Mech. Methods 1996, 6, 117–137. [Google Scholar]
  36. International Commission on Radiological Protection, Report of the Task Group on Reference Man. International Committee on Radiological Protection; ICRP: Ottawa, Canada, 1975.
  37. Ramsey, J.C.; Andersen, M.E. A physiologically based description of the inhalation pharmacokinetics of styrene in rats and humans. Toxicol. Appl. Pharmcol. 1984, 73, 159–175. [Google Scholar]
  38. Bjorkman, S. Prediction of drug disposition in infants and children by means of Physiologically Based Pharmacokinetic (PBPK) modelling: Theophylline and midazolam as model drugs. Br. J. Clin. Pharmacol. 2005, 59, 691–704. [Google Scholar]
  39. Behrman, R.E.; Kliegman, R.M.; Jenson, H.B. Nelson Textbook of Pediatrics; Saunders: Philadelphia, PA, USA, 2004. [Google Scholar]
  40. McNamara, P.J.; Alcorn, J. Protein binding predictions in infants. Am. Assoc. Pharm. Sci. J. 2002, 4, 19–26. [Google Scholar]
  41. USEPA, Child-Specific Exposure Factors Handbook (Final Report); EPA/600/R-06/096F; United States Environmental Protection Agency: Washington, DC, USA, 2008.
  42. Freeman, N.C.G.; Hore, P.; Black, K.; Jimenez, M.; Sheldon, L.; Tulve, N.; Lioy, P.J. Contributions of children’s activities to pesticide hand loadings following residential pesticide application. J. Expo. Anal. Environ. Epidemiol. 2005, 15, 81–88. [Google Scholar]
  43. Ferguson, A.C.; Canales, R.A.; Beamer, P.; AuYeung, W.; Key, M.; Munninghoff, A.; Lee, K.T.W.; Robertson, A.; Leckie, J.O. Video methods in the quantification of children’s exposures. J. Expo. Anal. Environ. Epidemiol. 2006, 16, 287–298. [Google Scholar]
  44. Department of Pesticide Regulation, California Environmental Protection Agency. Pesticide Use Reporting 2002 Summary Data. Available online: http://www.cdpr.ca.gov/docs/pur/pur02rep/02_pur.htm (accessed on 3 January 2012).
  45. USDA, Pesticide Data Program: Annual Summary Calendar Year 2002; United States Department of Agriculture: Washington, DC, USA, 2004.
  46. Rappaport, S.M. Interpreting Levels of Exposures to Chemical Agents. In Patty’s Industrial Hygiene, 5th; Harris, R.L., Ed.; John Wiley & Sons, Inc.: New York, NY, USA, 2000; Volume 1, pp. 679–745. [Google Scholar]
  47. USEPA, Interim Reregistration Eligibility Decision for Chlorpyrifos; EPA 738-R-01-007; United States Environmental Protection Agency: Washington, DC, USA, 2002.
  48. USEPA, Interim Reregistration Eligibility Decision for Diazinon; EPA 738-R-04-0006; United States Environmental Protection Agency: Washington, DC, USA, 2004.
  49. USEPA, Organophosphorus Cumulative Risk Assessment—2006 Update; EPA-HQ-OPP-2006-0618; United States Environmental Protection Agency: Washington, DC, USA, 2006.
  50. USEPA, General Principles for Performing Aggregate Exposure and Risk Assessments; Item No. 6043; United States Environmental Protection Agency: Washington, DC, USA, 2001.
  51. USEPA, Interim Reregistration Eligibility Decision for Methamidphos; Case no. 0043; United States Environmental Protection Agency: Washington, DC, USA, 2002.
  52. Gentry, P.R.; Covington, T.R.; Mann, S.; Shipp, A.M.; Yager, J.W.; Clewell, H.J. Physiologically based pharmacokinetic modeling of arsenic in the mouse. J. Toxicol. Environ. Health A 2004, 67, 43–71. [Google Scholar] [CrossRef] [PubMed]
  53. Pelekis, M.; Gephart, L.A.; Lerman, S.E. Physiological-model-based derivation of the adult and child pharmacokinetic intraspecies uncertainty factors for volatile organic compounds. Regul. Toxicol. Pharmacol. 2001, 33, 12–20. [Google Scholar]
  54. Clewell, R.A.; Gearhart, J.M. Pharmacokinetics of toxic chemicals in breast milk: Use of PBPK models to predict infant exposure. Environ. Health Perspect. 2002, 110, A333–A337. [Google Scholar]
  55. Price, K.; Haddad, S.; Krishnan, K. Physiological modeling of age-specific changes in the pharmacokinetics of organic chemicals in children. J. Toxicol. Environ. Health A 2003, 66, 417–433. [Google Scholar]
  56. Ginsberg, G.; Hattis, D.; Sonawane, B. Incorporating pharmacokinetic differences between children and adults in assessing children’s risks to environmental toxicants. Toxicol. Appl. Pharmacol. 2004, 198, 164–183. [Google Scholar]
  57. Melnyk, L.J.; Byron, M.Z.; Brown, G.G.; Clayton, C.A.; Michael, L.C. Pesticides on household surfaces may influence dietary intake of children. Environ. Sci. Technol. 2011, 45, 4594–4601. [Google Scholar]
  58. Akland, G.G.; Pellizzari, E.D.; Hu, Y.; Roberds, M.; Rohrer, C.A.; Leckie, J.O.; Berry, M.R. Factors influencing total dietary exposures of young children. J. Expo. Anal. Environ. Epidemiol. 2000, 10, 710–722. [Google Scholar]
  59. Bouchard, M.F.; Bellinger, D.C.; Wright, R.O.; Weisskopf, M.G. Attention-deficit/hyperactivity disorder and urinary metabolites of organophosphate pesticides. Pediatrics 2010, 125, e1270–e1277. [Google Scholar]
  60. Eskenazi, B.; Marks, A.R.; Bradman, A.; Harley, K.; Barr, D.B.; Johnson, C.; Morga, N.; Jewell, N.P. Organophosphate pesticide exposure and neurodevelopment in young mexican-american children. Environ. Health Perspect. 2007, 115, 792–798. [Google Scholar]
  61. Bouchard, M.F.; Chevrier, J.; Harley, K.G.; Kogut, K.; Vedar, M.; Calderon, N.; Trujillo, C.; Johnson, C.; Bradman, A.; Boyd Barr, D. Prenatal exposure to organophosphate pesticides and IQ in 7-year old children. Environ. Health Perspect. 2011, 119, 1189–1195. [Google Scholar]
  62. O’Rourke, M.K.; Lizardi, P.S.; Rogan, S.P.; Freeman, N.C.; Aguirre, A.; Saint, C.G. Pesticide exposure and creatinine variation among young children. J. Expo. Anal. Environ. Epidemiol. 2000, 10, 672–681. [Google Scholar]
  63. Wilson, N.K.; Strauss, W.J.; Iroz-Elardo, N.; Chuang, J.C. Exposures of preschool children to chlorpyrifos, diazinon, pentachlorophenol, and 2,4-dichlorophenoxyacetic acid over 3 years from 2003 to 2005: A longitudinal model. J. Expo. Sci. Environ. Epidemiol. 2010, 20, 546–558. [Google Scholar] [CrossRef] [PubMed]

