Article

Assessing Local Communities’ Willingness to Pay for River Network Protection: A Contingent Valuation Study of Shanghai, China

Shanghai Key Laboratory of Urbanization and Ecological Restoration, East China Normal University, Shanghai 200062, China
*
Author to whom correspondence should be addressed.
Int. J. Environ. Res. Public Health 2012, 9(11), 3866-3882; https://doi.org/10.3390/ijerph9113866
Submission received: 17 August 2012 / Revised: 3 October 2012 / Accepted: 15 October 2012 / Published: 26 October 2012
(This article belongs to the Special Issue Health Economics)

Abstract

:
River networks have experienced serious degradation because of rapid urbanization and population growth in developing countries such as China, and the protection of these networks requires the integration of evaluation with ecology and economics. In this study, a structured questionnaire survey of local residents in Shanghai (China) was conducted in urban and suburban areas. The study examined residents’ awareness of the value of the river network, sought their attitude toward the current status, and employed a logistic regression analysis based on the contingent valuation method (CVM) to calculate the total benefit and explain the socioeconomic factors influencing the residents’ willingness to pay (WTP). The results suggested that residents in Shanghai had a high degree of recognition of river network value but a low degree of satisfaction with the government’s actions and the current situation. The study also illustrated that the majority of respondents were willing to pay for river network protection. The mean WTP was 226.44 RMB per household per year. The number of years lived in Shanghai, the distance from the home to the nearest river, and the amount of the bid were important factors that influenced the respondents’ WTP. Suggestions for comprehensive management were proposed for the use of policy makers in river network conservation.

1. Introduction

A river network is a general feature of landscapes in Nature. It is formed by the river mainstreams and their tributaries in the river basin. The number and structure of river networks result from the interaction between the environment and human activity. River networks meet people’s daily needs, improve water quality, protect against floods, and even furnish an extraordinary regional environmental and cultural landform [1]. In China, rapid urbanization and industrialization after the 1980s has reshaped the landscape in both urban and suburban areas, and consequently, the Chinese river network has suffered extensive destruction. This destruction has become a problem that demands a prompt solution. To provide better protection for the river network, the benefits or services provided by the river network need to be evaluated, and the attitudes of local communities that are very significant for the conservation of the river network need to be identified.
Previous studies related to river networks primarily examined their natural attributes, such as structure, water quality improvement, sediment, flood control and flow dynamics, or their artificial attributes, such as measures of restoration and reconstruction [2,3,4,5,6,7]. However, few studies have considered the social-ecological service function of river networks and their value.
The contingent valuation method (CVM), which explores individuals’ willingness to pay (WTP) for a change in public goods and serves to detect the costs and benefits that a society receives, is a very commonly used method for the valuation of non-market goods [8]. It was first used by Davis to estimate the benefits of outdoor recreation in a Maine (USA) backwoods area [9]. Subsequently, the CVM was extensively developed throughout the 1970s and 1980s and finally received a major endorsement when the US National Oceanic and Atmospheric Administration (NOAA) proposed the first federal government guidelines for the use of the method in environmental policy analysis in 1993 [10]. The high-frequency use of the CVM and its subsequent federal authorization helped to make the CVM a broadly accepted method of environmental valuation. Since then, the CVM has been widely used to measure the value of types of environmental goods and the improvement of their status. The method has been used to evaluate goods such as air quality, water quality, ecosystem services, biodiversity, and wildlife [11,12,13,14,15,16] and has even been applied in the fields of waste and resource management [17,18].
Studies concerning the benefits furnished by rivers and evaluations of the river environment or river restoration have increased rapidly in recent years with the increase in awareness of the aesthetic, ecological and environmental, and public social functions of rivers [19,20]. The most widely discussed topics are the benefits of the river ecosystem and river habitat restoration, as in the research of Loomis et al. [13], Gürlük [21] and Heide et al. [22]. In addition, Amigues et al. [23] and Holmes et al. [24] evaluated the benefits or costs of the restoration of riparian zones in the contiguous areas of rivers. Other investigations have examined the benefits of river water quality improvement [12,25,26,27,28]. Additionally, Willis and Garrod [29], Berrens et al. [30] and Ojeda et al. [31] tested the values of flow alleviation in rivers, and Carson et al. [32] and Thomas and Blakemore [33] discussed wildlife and its habitat in rivers. Furthermore, Clayton and Mendelsohn [34] and Corrigan et al. [35] have discussed the value of watchable wildlife and considered aesthetic value.
As a result of the overall topography of China, river deltas are the typical landform in eastern China. In the eastern plain areas, such as the Yangtze River Delta or the Pearl River Delta, it is more appropriate to study the value of the river network than that of a selected river. However, studies of the value of the river network are still generally lacking in China. Therefore, through the application of the CVM, this article has the following aims:
  • (1) Estimate the benefit of river network protection and analyze factors affecting the WTP and the regional disparity in the WTP between urban and suburban areas.
  • (2) Evaluate the public’s awareness of and attitude toward the river network and its protection.
  • (3) Propose suggestions for the integrated protection of the river network based on the above results.
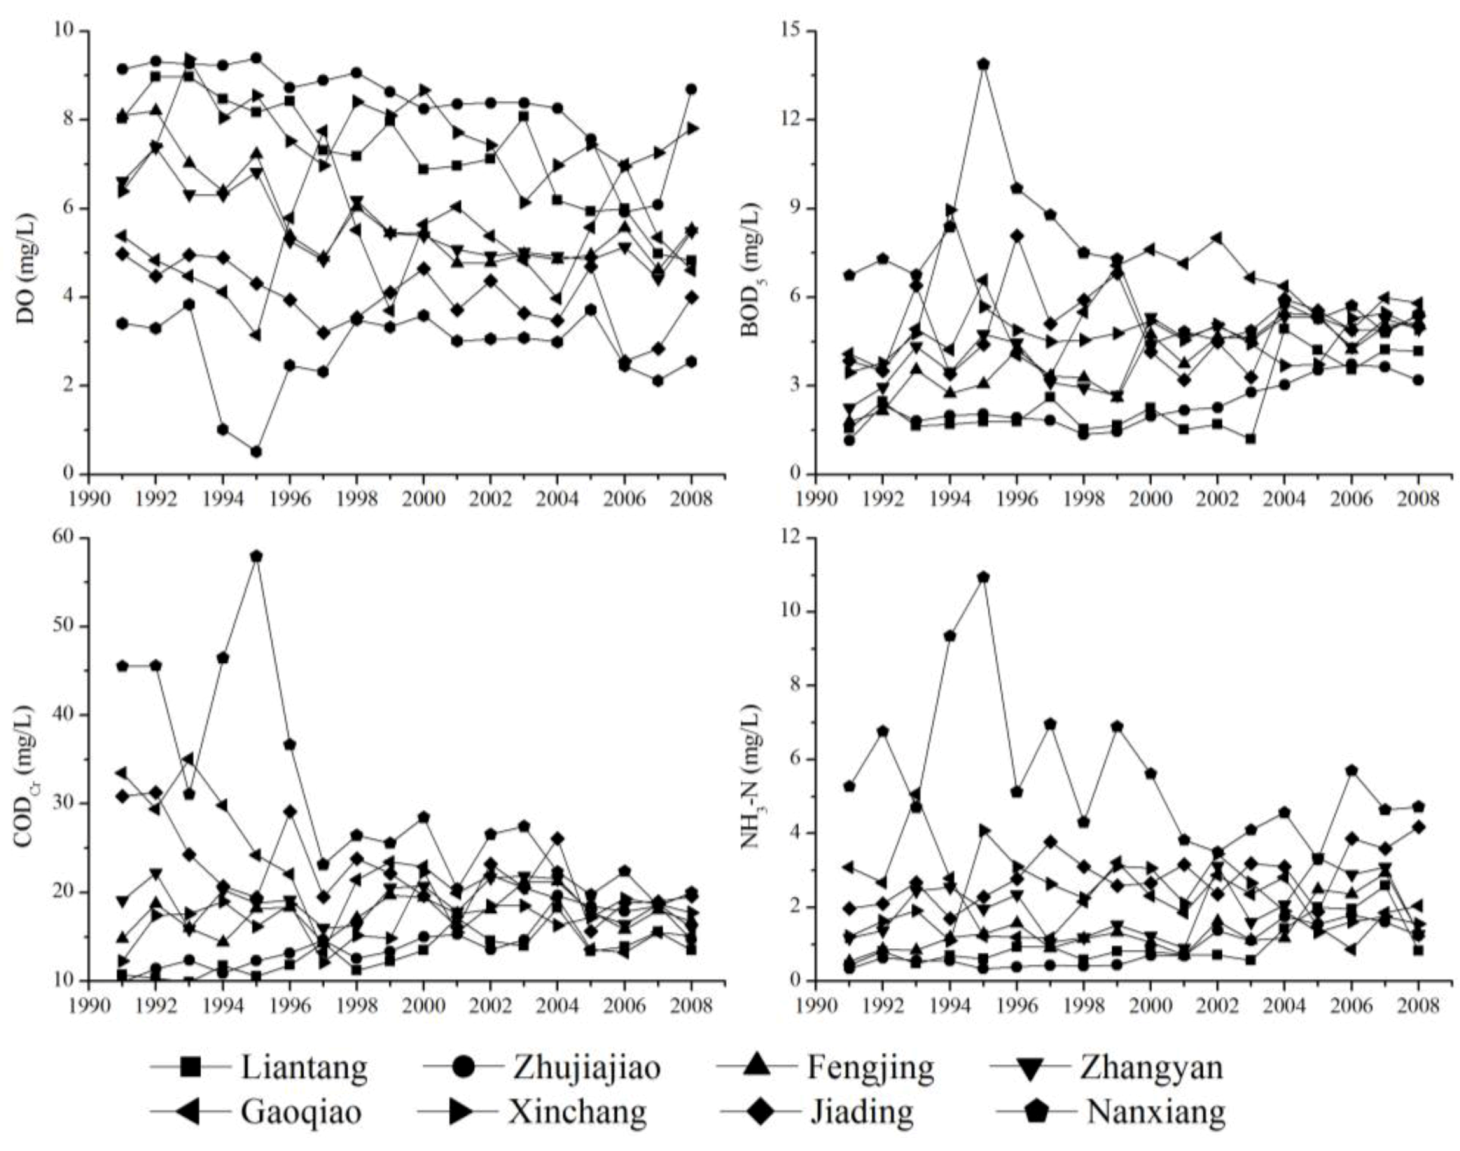
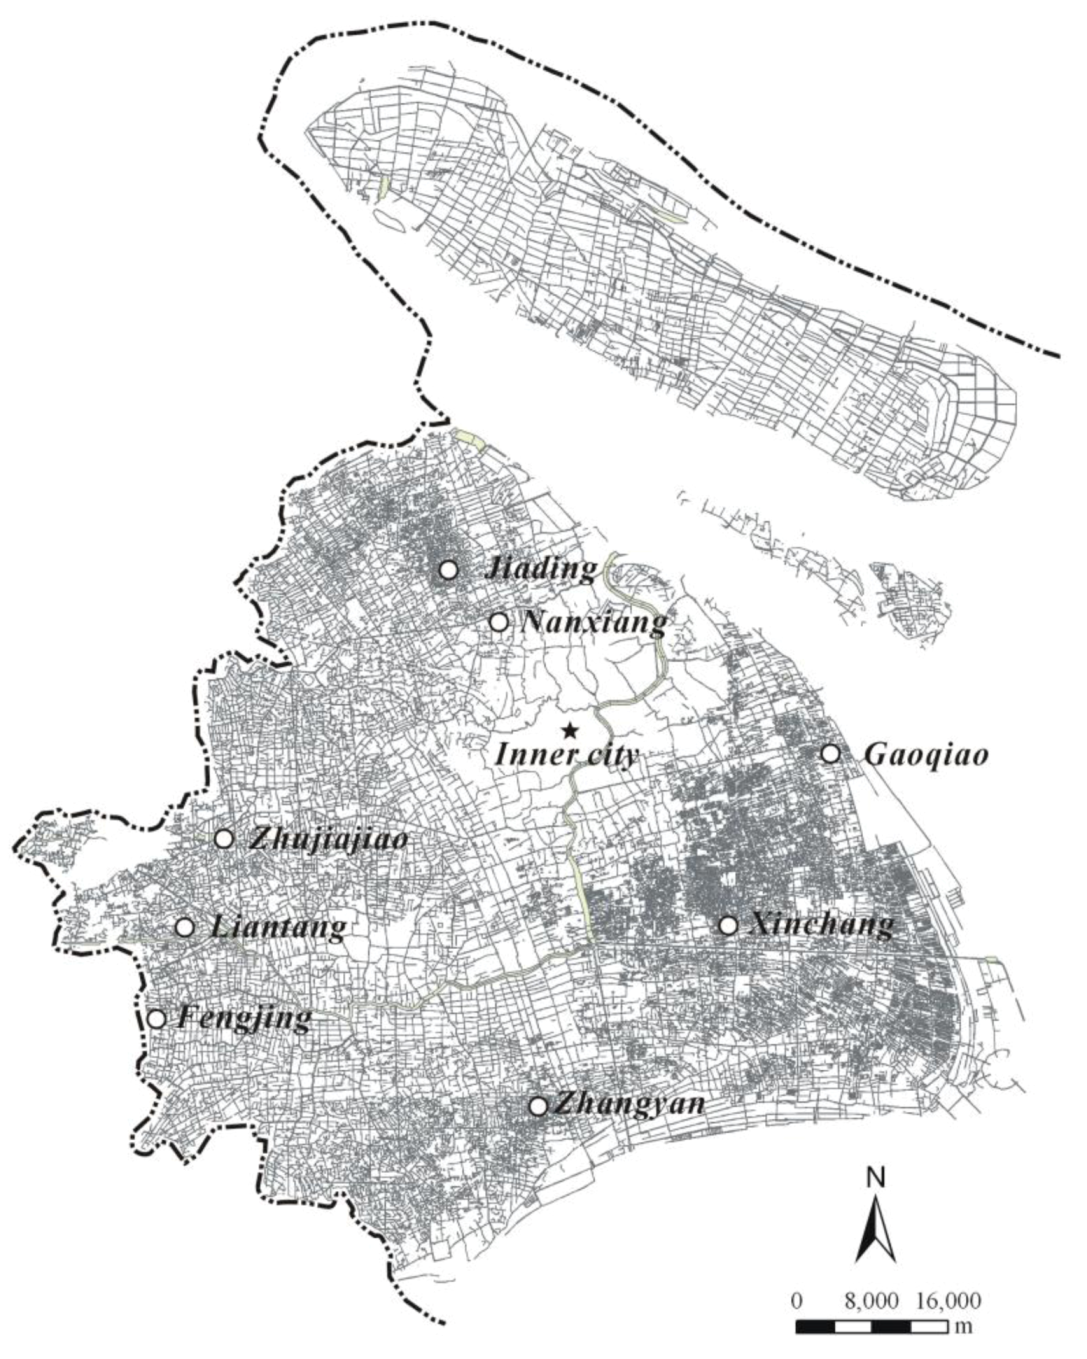
2. Study Area

Shanghai, with a population of more than 20 million in 2010, is one of the largest cities in China. Located at the mouth of the Yangtze River Delta, it is a traditional plain river network area with a high density of rivers. Based on the Shanghai River Survey Report in 2006, there were 33,127 rivers in Shanghai (Figure 1), with a river density of 3.93 km/km2 and a percentage of water area as high as 10.1% [36].
Figure 1. River network in Shanghai and sampling sites.
Ijerph 09 03866 g001
Rapid industrialization has quickly and dramatically changed the appearance of the inner city. During recent decades, human activities have had substantial effects on the river ecosystem. Urban expansion caused a serious and irreversible degradation of the river network structure, and increasing amounts of industrial and domestic pollution unavoidably produced a deterioration of water quality, the “black and stinky” phenomenon. According to the Shanghai Water Resource Bulletin and the Shanghai Environmental Quality Report, surface water quality in Shanghai during the past 30 years has experienced a phase of fast degradation, followed by a phase of slow degradation. After 1996, due to marked progress in urban sewage disposal, the surface water quality has been gradually improved [37].
During the same period, the number and length of rivers have decreased, and the richness of the structure and development of tributaries has been limited. A river network comprising different levels of branches was becoming a network of mainstreams with fewer branches. These changes produced a simplification of the structure of the river network and an inhibition of the development of the river structure. Simultaneously, the historical and cultural values preserved with the rivers were disappearing.
The surface water quality data for eight sampling sites on the tributaries of the river network are selected from the Shanghai Annual Report of Environment Quality 1990–2008. Figure 2 indicates a significant difference in water quality among these river network towns. Evaluated by the Environmental Quality Standard for Surface Water (GB 3838-2002), this dataset shows that organic pollution, which is characterized by five day’s biochemical oxygen demand (BOD5) and chemical oxygen demand (CODCr), has improved but still does not meet the requested standards. In addition, ammonia nitrogen (NH3-N) substantially exceeded the standard and became the principal water quality problem. Moreover, the dissolved oxygen (DO) levels of these sites showed persistent fluctuations. Overall, the water quality of the river network in Shanghai was unsatisfactory in terms of both the requested standards and the demands of living and tourism.
Figure 2. Water quality status of river network around sampling sites in Shanghai.
Ijerph 09 03866 g002

3. Materials and Methods

3.1. Design of Questionnaire

First, a pretest study was used to reduce biases, such as sequencing, information, hypothetical and strategic biases [38], which might affect the respondents to express a WTP. This pretest study was performed with the payment card (PC) method prior to the normal survey to improve the questionnaire and to adjust the series of bid amounts [39]. In the formal survey, a dichotomous-choice contingent valuation method (DC-CVM) format was employed, because it is more cognitively manageable and more similar to the real buying scenario compared to PC format [13,40,41,42].
The DC-CVM study questionnaire includes four sections in reference to other literature [23,43,44,45].
The first part includes questions about respondent’s socioeconomic information, for example, age, profession, educational level, household population, household income, distance to the nearest river from the respondent’s home, number of years lived in Shanghai and environmental education. The second part is used to explore residents’ awareness of and attitudes about river network values. In the third section, it detects residents’ satisfaction with river network protection. Additionally, the fourth part, which contains the principal valuation questions, aims to evaluate the average WTP and the reasons for the choice of a WTP. The main valuation questions are listed below:
  • Would you pay money to financially assist the government for the improvement of river network (raise connectivity of river network, improve water quality, build riparian zone to make it a proper place for amusement and recreation?
    A. Yes (Please follow with Question 2) B. No
  • Considering your household expenditures, are you willing to pay (a bid amount) money (per month) from your household income for river network improvement in the next 5 years so that the government could implement this program?
    A. Yes B. No
In this format, the residents were asked to choose among eight bid amounts: 2, 5, 10, 20, 50, 100, 200, and 500 RMB (US$ 1 = RMB 6.5).

3.2. Data Collection and Valuation Approach

Usually, mail, telephone or face-to-face methods are used in contingent valuation surveys. Of these methods, the face-to-face survey is the most controllable and effective [13,23,30]. However, it is time-consuming [45]. Through face-to-face interviews, the respondents could become acquainted with the concept of the river network, and the purpose of the survey could be presented by the investigators. From March through September 2011, the team conducted a face-to-face questionnaire survey in eight suburban towns (Figure 1) and six urban open spaces (including two university campuses, two residential areas, and two public parks) in Shanghai.
The theoretical model to explain one’s WTP is based on the income compensation function if we regard the WTP as the desired benefit measure [16]. In the equation below, P is the prices for the marketed goods, q1 is the benefit of the environmental change, q0 is the baseline of the environmental goods of interest, Q is the vector of other public goods, I is the income and C is the vector of the respondent’s characteristics which affect their tastes and preferences:
Ijerph 09 03866 i001
A binary logistic regression model was used to identify the significant variables affecting the WTP. Hanemann (1984, 1989) specified the method for calculating the probability that interviewees would pay a given amount of money based on a quantitative choice model [46,47]. The basic formula is:
Ijerph 09 03866 i002
Correspondingly, the mathematical expectation of WTP is:
Ijerph 09 03866 i003
where α and β are coefficients to be estimated with logit statistical techniques and A is the amount of money the household was asked to pay. PASW 18.0 software was used to perform a logistic regression to calculate the factors influencing the WTP choices.

4. Results and Discussion

The answers to the questionnaire survey were collected, and invalid questionnaires were identified and removed. These invalid questionnaires included 45 incomplete questionnaires (7.5%) and 24 false questionnaires (4%). In the false questionnaires, the willingness to pay for a bid amount was not consistent with the household income. In all, 531 of 600 questionnaires were valid, corresponding to a validity rate of 88.5%. The percentages of valid questionnaires were 38.5% for the urban surveys and 61.5% for the suburban surveys (Table 1). These values were generally representative of Shanghai.

4.1. Socioeconomic Characteristics

The results of the statistical analysis showed that the younger generation (people between 20 and 30 years of age) were the majority (41.43%). “Ordinary workers” represented approximately one-third of the respondents. The overall educational level of the interviewees was relatively low. Approximately 20% of the respondents had a bachelor’s degree or above. A family with three members was the most frequent family structure, 45.9% of the total, but families that had four or more members also represented a large proportion of the total (37.1%). The household incomes of the respondents varied within relatively wide limits, but most household incomes ranged between 1,000 and 8,000 RMB per month. Most respondents lived near rivers. For 51.07% of the respondents, the distance to the nearest river from their home was less than 500 m. More than 60% of the respondents lived in Shanghai longer than five years. The percentage of respondents who had relatives or friends engaged in an environmental protection or water resource career was high (34.1%).
Table 1. Descriptive statistics of socio-economic characteristics of the respondents.
ItemResponsePercentage (%)ItemResponsePercentage (%)
Age≤208.85Household income (RMB per month)0–5001.88
21–3041.43500–1,0003.58
31–4019.021,000–2,00011.68
41–5014.122,000–3,00015.07
51–609.233,000–5,00020.90
>607.345,000–8,00019.59
JobCivil Servant1.328,000–10,0007.72
Researcher1.1310,000–15,0006.59
Manager6.9715,000–20,0005.84
Medical staff1.5120,000–30,0003.20
Teacher1.69>30,0003.95
Worker35.40Distance to river0–500 m51.04
Private enterprise11.11500–1,000 m22.22
Farmer2.821,000–2,000 m12.81
Student14.882,000–3,000 m4.14
Retired9.793,000–5,000 m3.20
Unemployed2.82>5,000 m6.59
Others10.55Years lived in Shanghai<1 Year11.11
Education levelMiddle school and below22.031–5 Years27.87
High school38.795–10 Years18.27
Vocational school17.8910–20 Years14.69
University14.50>20 Years28.06
Graduated6.59Job-related influenceYes36.16
Household population11.69No63.84
26.40DistrictUrban38.5
345.95Suburban61.5
421.09
516.01
≥68.85

4.2. Value Orientation toward River Network

In all, 84.99% of the respondents stated that the river network was a characteristic element that was representative of water towns in Shanghai and the surrounding areas. Of the five features of rivers included in the questionnaire (river form, water quality, riparian zone, velocity and volume, and aquatic life), water quality and aquatic life received more attention than the other features. These results indicated that the local residents attached great importance to the concept of the river network and paid most attention to the primary need, water quality (aquatic life is recognized as a symbol of good water quality). This finding agreed with Maslow’s theory of hierarchy of needs [48].
The interviewees were asked to rank values associated with the river network (eco-environmental value, water town cultural value, and historical heritage value) and structural indexes (river quantity, river structure, and river connectivity) based on their relative importance. For calibration, the most important option is assigned 3; the second most important option, 2; and the last one is assigned 1.
467 respondents reported their rankings about importance of river network values. The result showed that the majority of respondents (58.12%) selected “eco-environmental value” as the most important (total score is 1,143), followed by “historical heritage value” (26.41% of the respondents ranked it the first and its total score is 890) and “water town cultural value” (12.47% of the respondents ranked it the first and its total score is 769). This result indicated that, compared to the values in the esthetic and cultural dimensions, basic living requirement was more important in this period of development and environmental restoration in Shanghai.
481 respondents reported their rankings about importance of river structure. After data calibration, the feature “river connectivity” received the highest score of 1,118 (with 55.10% of the respondents ranked it the first important), followed by “river structure” (scored 960 with 27.86% support of the supreme importance) and “river quantity” (scored 778 with 17.05% support of the supreme importance). This result indicated that although the non-professionals did not achieve a comprehensive understanding of the concept “river connectivity” through indexes, they intuitively recognized its importance for maintaining the integrity of the river network ecosystem [49].

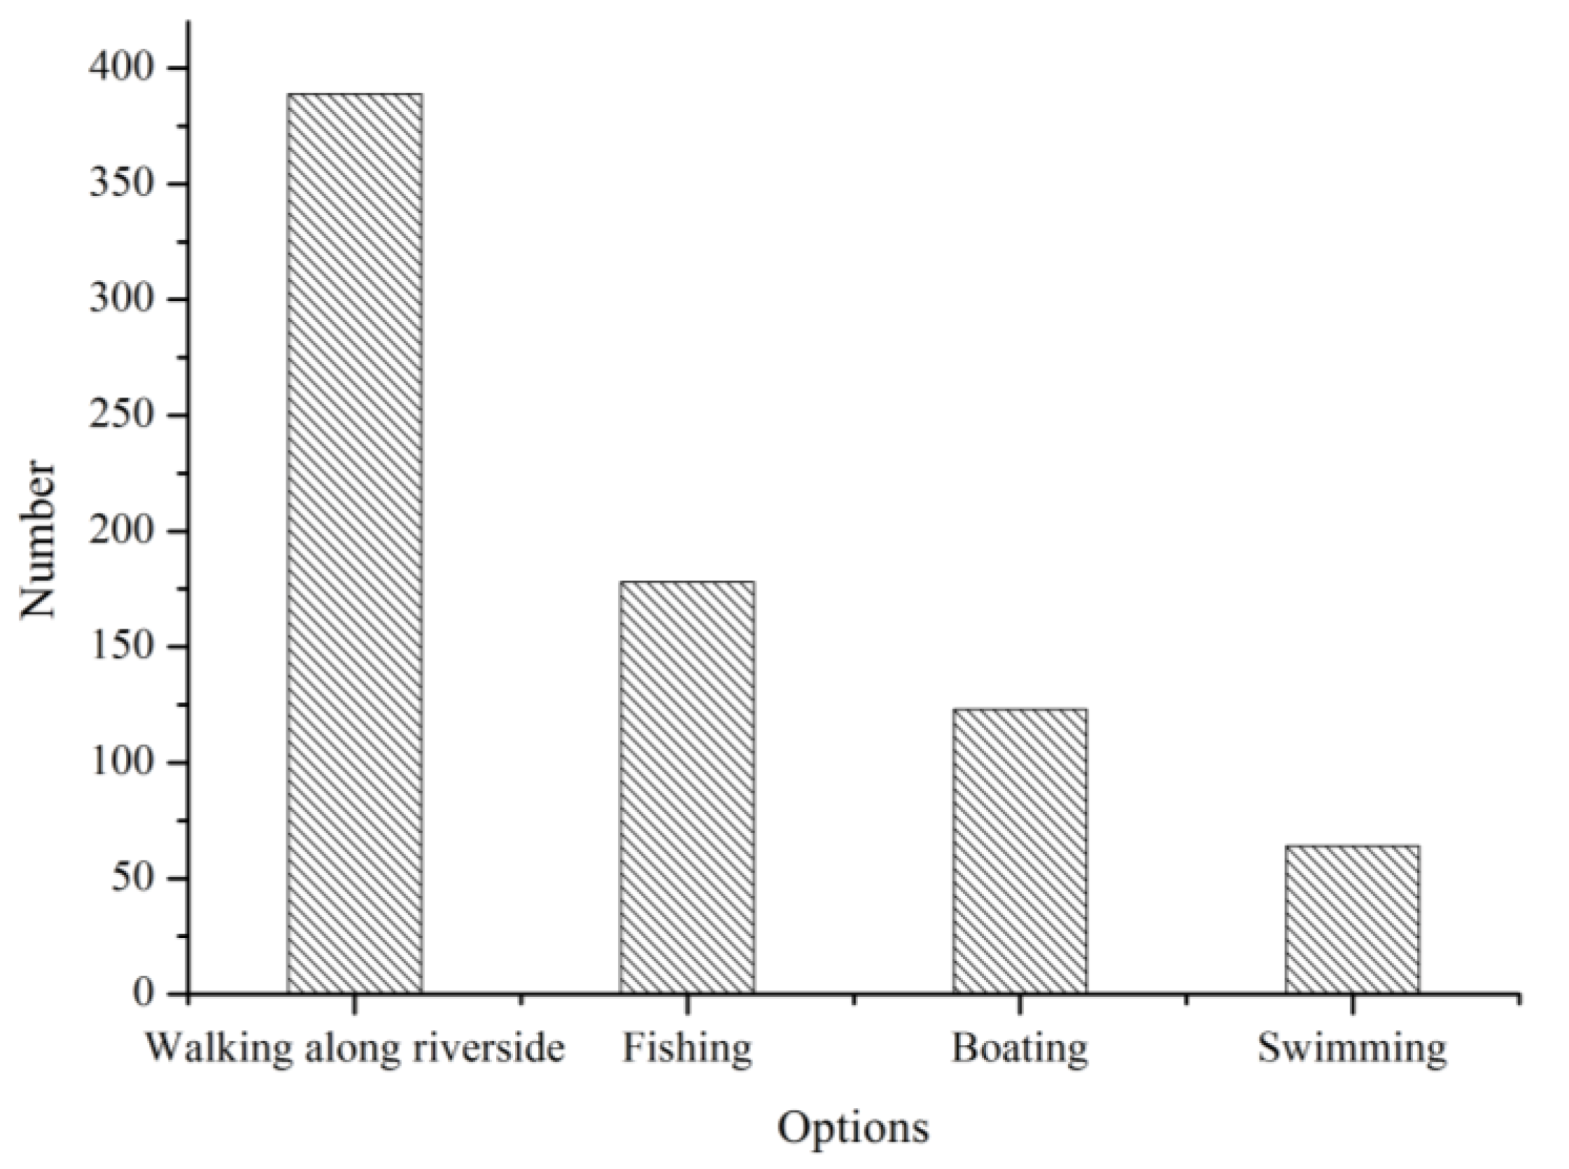
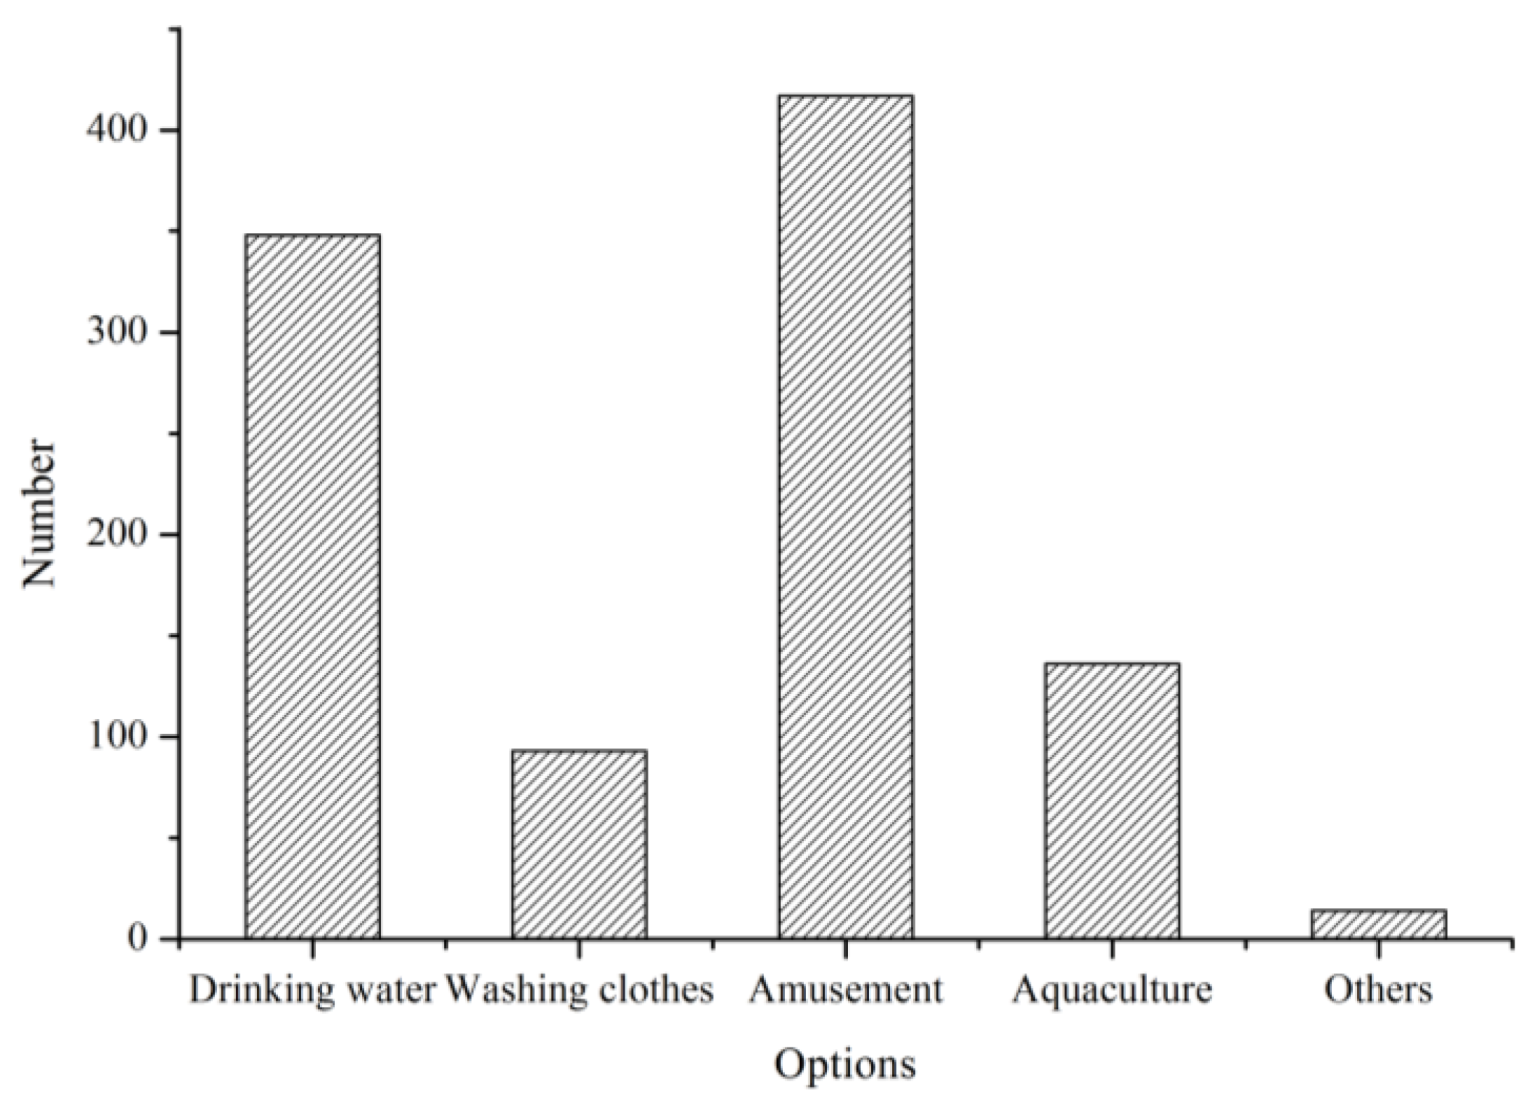
4.3. Recognition of Functions and Services

The questionnaire responses about the function of the river network showed that the entertainment function and the drinking water resource function were most frequently cited by the respondents (78.53% and 65.53%, respectively). Few people used the river network for aquaculture or as a washing place because of the widespread use of the piped water supply and because of the mistrust of river water quality. The responses about the entertainment function indicated that a large portion of the respondents chose to walk along the riverside (73.25%), and that many respondents chose to go fishing (33.52%) or boating (23.16%). In contrast, few respondents (12.05%) chose to swim (Figure 3 and Figure 4). It appeared that the respondents were participating indirectly in the activities supported by the river network. This result may demonstrate the degradation of river quality in terms of condition and accessibility.
Figure 3. Frequencies of utilization of functions and services.
Ijerph 09 03866 g003
Figure 4. Frequencies of utilization of entertainment functions.
Ijerph 09 03866 g004

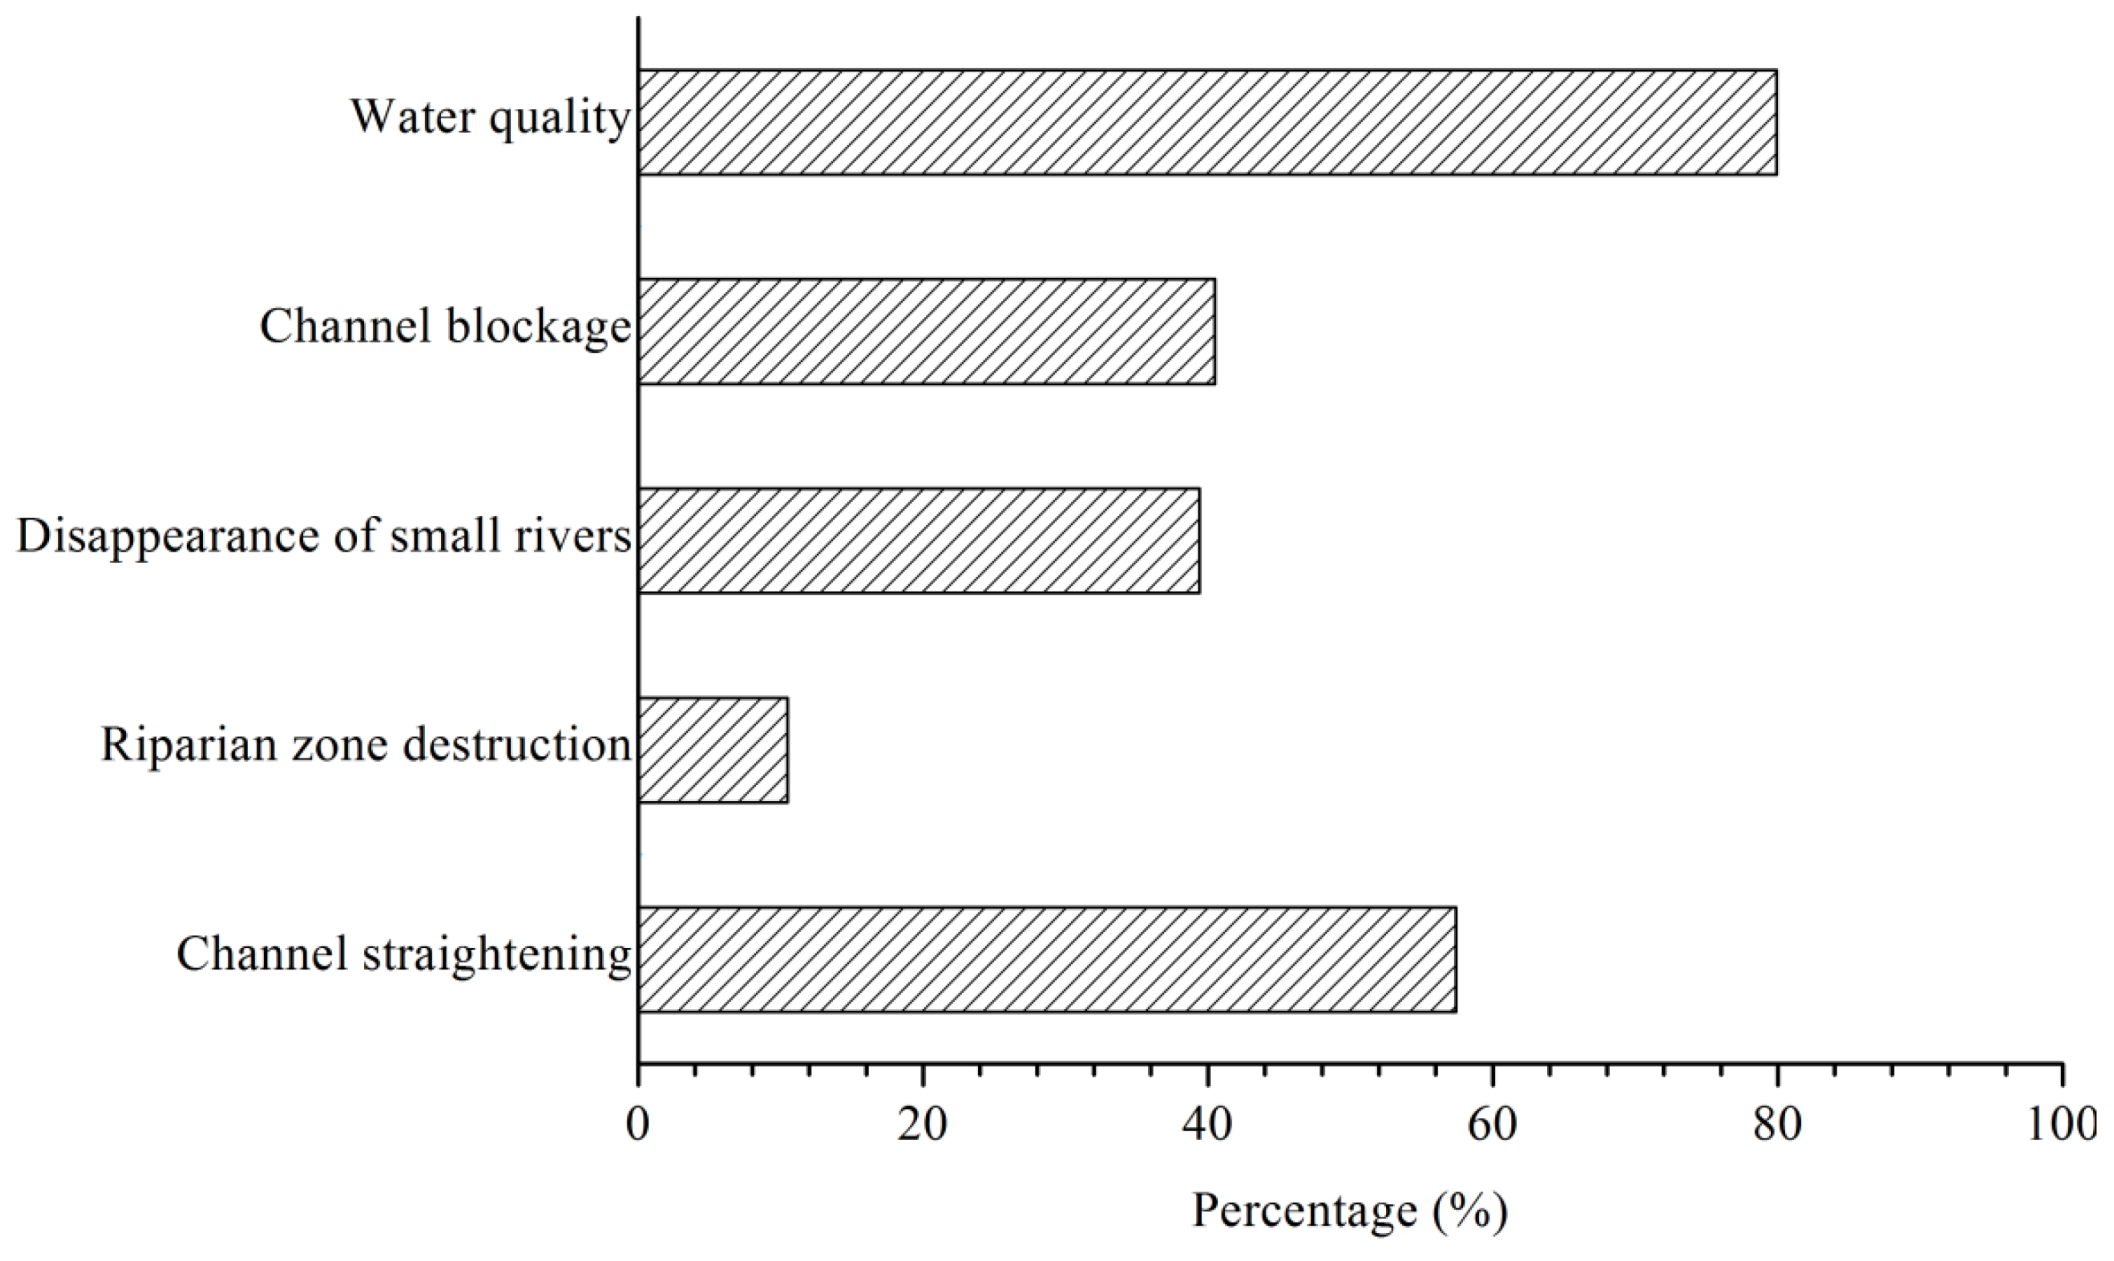
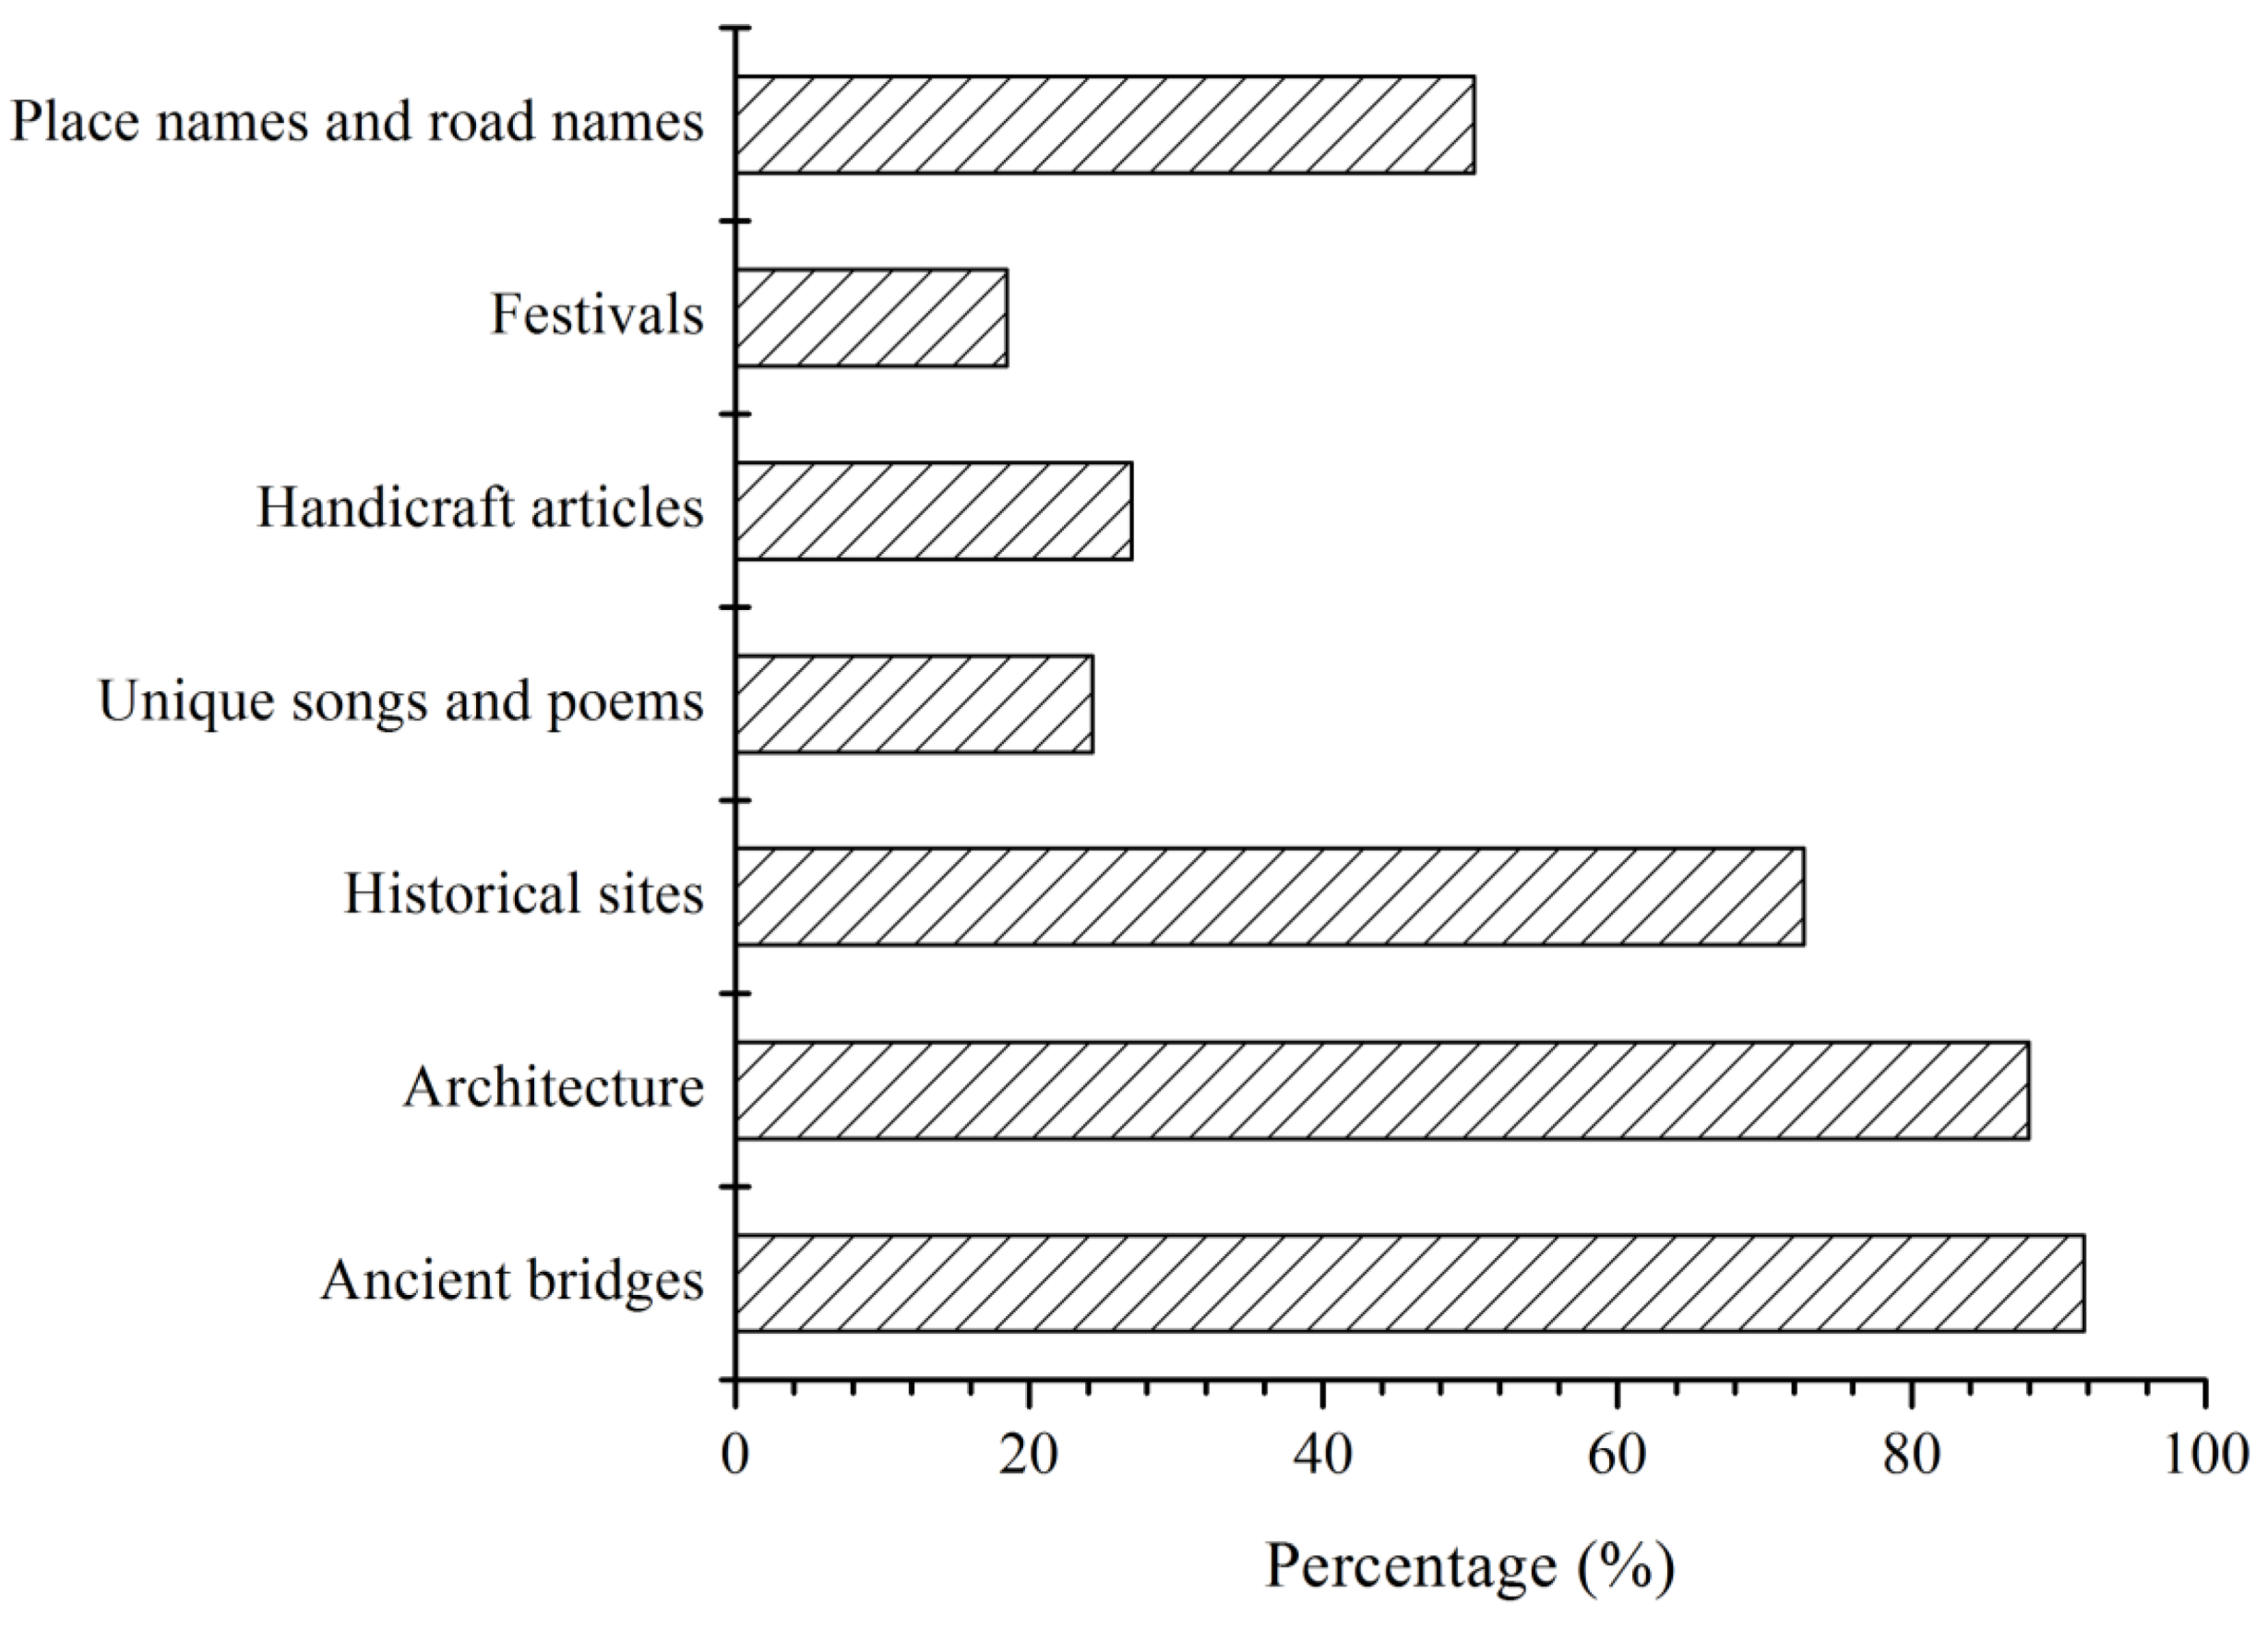
4.4. Awareness of Destruction and Protection

Two multiple-choice questions were asked about the destruction of the river network. The results of the statistical analysis showed that most respondents recognized the degradation of water quality (79.9%) and channel blockage (57.4%). In all, 39.6% and 40.5% of the respondents chose “destruction of riparian zone” and “landfill of small rivers”, respectively. Only 10.5% chose “channel straightening”. These results indicated that the respondents were very sensitive to the factor of water quality. Thus, river quality improvement was identified as a pressing task (Figure 5).
Figure 5. Respondents’ awareness of river network degradation.
Ijerph 09 03866 g005
In addition, most respondents felt that ancient bridges, water town architecture and historical sites had been damaged by different extents (Figure 6). This result indicated that the material elements of the cultural values associated with water towns received the most attention. According to Liu et al. [50], the abstract elements of the cultural values (place names and road names, unique songs and poems, handicraft articles, and festivals) had suffered significant losses during the past few years. The results of this survey indicated that such cultural extinction was relatively unimportant to the local residents surveyed.
Figure 6. Respondents’ awareness of disappearance of cultural elements related to the river network.
Ijerph 09 03866 g006
The respondents were also asked to rate the government’s protection of the current river network and to rate their satisfaction with the results of current river network protection. In all, 53.67% of the respondents felt that the government’s protection was “not bad”, 21.47% thought it was “weak”, and only 12.05% were pleased with the government’s protection. Moreover, only 6.40% of the respondents felt satisfied with the current situation, and 17.70% were disappointed (Table 2). This result revealed that only a small quotient of the citizens thought highly of the government, while a large majority of the respondents believed that there was development space for the managers to improve their work. The more strict policies, more powerful actions, and more reasonable planning in the field of river network protection should be proposed at the first opportunity.
Table 2. Respondents’ attitude of protection.
Government’s Degree of ProtectionSatisfaction with Current Situation
OptionsNumberPercentage (%)OptionsNumberPercentage (%)
Powerful6412.05Satisfied346.40
Not bad28553.67Tolerable40275.71
Weak11421.47Disappointed9417.70
Not clear6812.81

4.5. Estimation of WTP and the Total Benefit

Among all 531 respondents, 70.24% (373 people) of the sample reported a positive WTP, whereas 29.75% (158 people) reported a zero WTP (Table 3). The respondents who reported a zero WTP were asked a follow-up question to explore their reasons. A large majority answered “have no extra income” (36.71%), and 1.27% felt the river network was already sufficiently good and did not need protection. Reasons other than a lack of value or the inability to afford a positive WTP were considered a protest vote [51,52,53]. In this survey, 28.48% of the respondents reported zero WTP because they considered river network protection a responsibility of government, and 22.78% believed that they had paid taxes related to river network protection. Otherwise, 1.27% thought that others would contribute to the government, and 9.49% chose “other reasons”, primarily “a mistrust of funds’ application”.
Table 3. Descriptive statistics of WTP distribution.
Bid Amount25102050100200500Sum
Sample size7370727170685948531
WTP > 04963495346483530373
WTP = 0247231824202418158
Y(WTP > 0)%95.9296.8387.7684.9171.7454.1722.8616.67
N(WTP = 0)%4.083.1712.2415.0928.2645.8377.1483.33
The acceptance of the lowest bid (5 RMB) was 95.92%, and that of the highest bid (500 RMB) was 16.67% (Table 3). The mean WTP was calculated with Eqaution (2) above after excluding the effect of 0WTP and protest responses, as suggested by Hanemann (1989) [47] and Heckman (1978) [54]. The mean WTP found by this study was 226.44 RMB per household per month with the median WTP of 110.375 RMB and the 95% confidence interval of [173.33, 341.51]. According to the most recent report, the number of households in Shanghai was 8.2533 million in 2010. Thus, the value of the river network was 22.43 billion RMB per year. Additionally, this survey showed that “voluntary labor” was the leading activity selected by respondents as a mechanism for contributing to river network protection projects, followed by “donate money” and “resource taxes”.

4.6. Factors Influencing WTP

Table 4 shows that the distance between the home and the river, the number of years lived in Shanghai, and the amount of the bid were statistically significant at the 5% level. The coefficients of these three variables were all negative, but the coefficients of the other variables did not show these effects. The results indicated that people who lived closer to rivers were more willing to pay for protection. This finding was reasonable because the river network was more strongly associated with their homes and daily lives. However, the results also showed that people living in Shanghai for a longer period were not as willing to pay for river network protection as new immigrants. The explanation of this result might be that the original residents who had experienced the improvement of the water environment after the 1980s were satisfied with the current status and might be older people who were retired and frugal. In contrast, the new residents were primarily young people who are more concerned about environmental problems and could contribute money more easily.
Table 4. Results from binary logistic regression (WTP > 0, N = 373).
BS.E.WalsdfSignificanceExp (B)
AGE0.0240.1150.04410.8341.024
JOB0.0190.0540.11610.7341.019
EDU (educational level)−0.0070.1380.00210.9600.993
PEO (household population)−0.0460.1320.12010.7290.955
INC (household income)0.1080.0712.32610.1271.114
DIS (distance from river)−0.2410.0917.10110.0080.786
LYS (years in Shanghai)−0.2340.1144.20810.0400.792
PRO (environmentally related job)−0.0380.2970.01710.8980.963
A (payment amount)−0.0120.00248.34510.0000.988
Constant2.6491.0636.21510.01314.140
2LogLikelihood325.502
Cox & Snell R Squared0.271

4.7. Regional Difference in WTP

The analysis showed that the mean WTP of the suburban respondents was high, 626.36 RMB per household per month (95% confidence interval of [489.35, 869.94]), whereas the mean WTP of the urban respondents was only 33.08 RMB per household per month (95% confidence interval of [23.77, 54.42]) (Table 5). This pattern differed strongly from the current economic characteristics of rural and urban areas in Shanghai. First, the WTP calculated by the CVM was always overvalued because people do not actually need to pay for the bid they choose. In rural areas, the educational level of the residents was relatively low. These respondents might choose a high bid amount but lack a comprehensive understanding or careful consideration of the choice. Second, the river network was more accessible to rural residents, whereas the access of the urban citizens to the river was blocked by buildings and flood prevention walls.
Table 5. Regional difference between urban and suburban areas.
Area BS.E.WalsdfSignificanceExp (B)
Urban areaA (payment amount)−0.0100.00218.86410.0000.990
Constant−0.9361.7700.27910.5970.392
2LogLikelihood127.678
Cox & Snell R Squared0.235
SuburbanA(payment amount)−0.0070.00136.24710.0000.993
Constant4.3721.22212.80210.00079.223
2LogLikelihood269.420
Cox & Snell R Squared0.213
Moreover, because the daily lives of the rural residents were more tightly connected with the functions of the river network, the people who lived in the rural areas might choose to devote more attention to the protection of the network. Unfortunately, no significant factors other than the bid were found in the separate logistic regressions for the urban and suburban areas.

4. Conclusions and Recommendations

The findings of this survey are as follows:
  • (1) The river network was valued by most local residents in Shanghai, and its eco-environmental value was the most important of the values examined. Water quality and aquatic life were the aspects of the river network that were ranked most highly, and river connectivity ranked higher than river structure and quantity.
  • (2) The functions of the river network as a drinking water resource and as a place used for entertainment were the most frequently recognized services furnished by the river network. In the area of entertainment, indirect uses were more frequently cited than direct uses.
  • (3) The destruction of the river network and the degradation of its functions have attracted wide public attention. Decreases in water quality and channel blockage were the most frequently cited forms of deterioration. Material elements of culture, such as bridges, architectures and historical sites, were the focal points in the area of cultural loss. Few residents were satisfied with the current situation and the protection given by the government. More powerful and effective actions for river network protection are needed.
  • (4) The mean WTP in the study area was 226.44 RMB per household per month, or 22.43 billion RMB per year within the boundaries of Shanghai. The number of years lived in Shanghai, the distance from the home to the nearest river and the amount of the bid were factors that significantly affected the WTP. The analysis also found a significant difference in the WTP between the urban and suburban areas. This difference was not consistent with the difference in the income levels between these areas.
Based on the conclusions above, the following suggestions for long-term river network protection in Shanghai are proposed:
  • (1) The water quality in Shanghai has shown improvement after the development of pollution control projects over the past few decades. In the coming years, the government should begin to shift the target of protection from the simple improvement of water quality to the integrated restoration of the entire river network, including its structure and connectivity. Such ideas should be promoted to convince the public. Because the indirect entertainment services along the riverside are most important, measures should be taken to provide ecological passageways, platforms, and waterfront green space.
  • (2) Because of the unique eco-environmental and cultural characteristics of Shanghai, the protection of the river network should be combined with the protection of culture and the development of tourism. The local government should gradually restore the historical features related to the river network.
  • (3) The results of the study show that a large proportion of the local residents are willing to pay for river network improvement and protection, thus, economic policy is identified as a flexible instrument for river network management. Efforts to assess and evaluate the status of the river network need to be initiated, and market-based policy should be proposed based on a larger sample collected in selected districts. Ecological compensation or a reward mechanism based on the CVM results might be introduced to support protection.
This study was a positive attempt to apply valuation method to river network protection. It detected the value of river network from a comprehensive view including the attributes like water quality, river structure, and riparian status. The attempt represented the typical willingness and request of residents lived in the districts which were in the dilemma of whether or not to protect environment and develop. Its results may provide a reference for other researchers interested in river network health, behavioral study, and policy research.

Acknowledgments

This research was supported by the “National Natural Science Foundation of China (No.71073055 and No.41171017)”, the “Ministry of Water Resources” Special Funds for Scientific Research on Public Causes (No.201201072-04)” and the “MOE Key Project of Philosophy and Social Sciences Research (No.11JZD024)”.

Conflict of Interest

The authors declare no conflict of interest.

References and Notes

  1. Ruan, Y.S.; Yuan, F. To the new age of Jiangnan ancient water towns: Protection and proper development of ancient water towns in Jiangnan. Urban Plan. Forum 2010, 2, 35–40. (in Chinese). [Google Scholar]
  2. Muneepeerakul, R.; Bertuzzo, E.; Rinaldo, A.; Rodriguez-Iturbe, I. Patterns of vegetation biodiversity: The roles of dispersal directionality and river network structure. J. Theor. Biol. 2008, 252, 221–229. [Google Scholar] [CrossRef]
  3. Wang, X.M.; Hao, R.; Huo, J.; Zhang, J.F. Modeling sediment transport in river networks. Physica A 2008, 387, 6421–6430. [Google Scholar] [CrossRef]
  4. Huang, Y.; Jiang, D.; Zhuang, D.; Fu, J. Evaluation of hyperspectral indices for chlorophyll-a concentration estimation in Tangxun Lake (Wuhan, China). Int. J. Environ. Res. Public Health 2010, 7, 2437–2451. [Google Scholar] [CrossRef]
  5. Yang, X.Y.; Jin, W. GIS-based spatial regression and prediction of water quality in river networks: A case study in Iowa. J. Environ. Manage. 2010, 91, 1943–1951. [Google Scholar] [CrossRef]
  6. Neeson, T.M.; Wiley, M.J.; Adlerstein, S.A.; Riolo, R.L. River network structure shapes inter-annual feedbacks between adult sea lamprey migration and larval habitation. Ecol. Model. 2011, 222, 3181–3192. [Google Scholar] [CrossRef]
  7. Wu, M.; Wang, Y.; Dong, J.; Sun, C.; Wang, Y.; Sun, F.; Cheng, H. Investigation of spatial and temporal trends in water quality in Daya Bay, South China Sea. Int. J. Environ. Res. Public Health 2011, 8, 2352–2365. [Google Scholar] [CrossRef]
  8. Mitchell, R.C.; Carson, R.T. Using Surveys to Value Public Goods: The Contingent Valuation Method (Resources for the Future); RFF Press: Washington, DC, USA, 1989; pp. 15–52. [Google Scholar]
  9. Davis, R.K. The Value of Outdoor Recreation: An Economic Study of the Maine Woods; Unpublished Ph.D. Dissertation, Harvard University, Cambridge, MA, USA, 1963.
  10. Arrow, K.J.; Solow, R.S.; Leamer, E.; Portney, P.; Radner, R.; Schuman, H. Report of the NOAA Panel on Contingent Valuation, Federal Register 58; CSUEB: Hayward, CA, USA, 1993. [Google Scholar]
  11. Xu, Z.M.; Cheng, G.D.; Zhang, Z.Q.; Su, Z.Y.; Loomis, J. Applying contingent valuation in China to measure the total economic value of restoring ecosystem services in Ejina region. Ecol. Econ. 2003, 44, 345–358. [Google Scholar] [CrossRef]
  12. Bateman, I.J.; Cole, M.A.; Georgiou, S.; Hadley, D.J. Comparing contingent valuation and contingent ranking: A case study considering the benefits of urban river water quality improvements. J. Environ. Manage. 2006, 79, 221–231. [Google Scholar] [CrossRef]
  13. Gürlük, S. The estimation of ecosystem services’ value in the region of Misi rural development project: Results from a contingent valuation survey. Forest Policy Econ. 2006, 9, 209–218. [Google Scholar] [CrossRef]
  14. Wang, X.J.; Zhang, W.; Li, Y.; Yang, K.Z.; Bai, M. Air quality improvement estimation and assessment using contingent valuation method: A case study in Beijing. Environ. Monit. Assess. 2006, 120, 153–168. [Google Scholar] [CrossRef]
  15. García-Llorente, M.; Martín-López, B.; González, J.A.; Alcorlo, P.; Montes, C. Social perceptions of the impacts and benefits of invasive alien species: Implications for management. Biol. Conserv. 2008, 141, 2969–2983. [Google Scholar] [CrossRef]
  16. Antony, J.; Rao, A. Contingent Valuation: A Review with Emphasis on Estimation Procedures. Available online: http://interstat.statjournals.net/YEAR/2010/articles/1007004.pdf (accessed on 24 October 2012).
  17. Salam, M.A.; Noguchi, T.; Alim, M.A. Factors affecting participating farmer’s willingness to pay for the tree farming fund: A study in a participatory forest in Bangladesh. Environ. Monit. Assess. 2006, 118, 165–178. [Google Scholar] [CrossRef]
  18. Afroz, R.; Hanaki, K.; Tudin, R. Factors affecting waste generation: A study in waste management program in Dhaka City, Bangladesh. Environ. Monit. Assess. 2011, 179, 509–519. [Google Scholar] [CrossRef]
  19. Kohlmann, B.; Mitsch, W.J.; Hansen, D.O. Ecological management and sustainable development in the humid tropics of Costa Rica. Ecol. Eng. 2008, 34, 254–266. [Google Scholar] [CrossRef]
  20. Buijs, A.E. Public support for river restoration. A mixed-method study into local residents’ support for and framing of river management and ecological restoration in the Dutch floodplains. J. Environ. Manag. 2009, 90, 2680–2689. [Google Scholar] [CrossRef]
  21. Loomis, J.; Kent, P.; Strange, L.; Fausch, K.; Covich, A. Measuring the total economic value of restoring ecosystem services in an impaired river basin: Results from a contingent valuation survey. Ecol. Econ. 2000, 33, 103–117. [Google Scholar] [CrossRef]
  22. Van der Heide, C.M.; van der Bergh, J.C.J.M.; van Ierland, E.C.; Nunes, P.A.L.D. Economic valuation of habitat defragmentation: A study of the Veluwe, the Netherlands. Ecol. Econ. 2008, 67, 205–216. [Google Scholar] [CrossRef]
  23. Amigues, J.P.; Boulatoff, C.; Desaigues, B.; Gauthier, C.; Keith, J.E. The benefits and costs of riparian analysis habitat preservation: A willingness to accept/willingness to pay contingent valuation approach. Ecol. Econ. 2002, 43, 17–31. [Google Scholar] [CrossRef]
  24. Holmes, T.P.; Bergstrom, J.C.; Huszar, E.; Kask, S.B.; Orr, F., III. Contingent valuation, net marginal benefits, and the scale of riparian ecosystem restoration. Ecol. Econ. 2004, 49, 19–30. [Google Scholar] [CrossRef]
  25. Desvousges, W.H.; Smith, V.K.; Fisher, A. Option price estimates for water quality improvements: A contingent valuation study for the Monongahela River. J. Environ. Econ. Manag. 1987, 14, 248–267. [Google Scholar] [CrossRef]
  26. Lichtkoppler, F.R.; Blaine, T.W. Environmental awareness and attitudes of Ashtabula county voters concerning the Ashtabula river area of concern: 1996–1997. J. Great Lakes Res. 1999, 25, 500–514. [Google Scholar] [CrossRef]
  27. Urama, K.C.; Hodge, I.D. Are stated preferences convergent with revealed preferences? Empirical evidence from Nigeria. Environ. Impact Assess. Rev. 2006, 59, 24–37. [Google Scholar]
  28. Jiang, Y.; Jin, L.S.; Lin, T. Higher water tariffs for less river pollution-Evidence from the Min River and Fuzhou City in China. China Econ. Rev. 2011, 22, 183–195. [Google Scholar] [CrossRef]
  29. Willis, K.G.; Garrod, G.D. Angling and recreation values of low-flow alleviation in rivers. J. Environ. Manag. 1999, 57, 71–83. [Google Scholar] [CrossRef]
  30. Berrens, R.P.; Bohara, A.K.; Silva, C.L.; Brookshire, D.; McKee, M. Contingent values for New Mexico in stream flows: With tests of scope, group-size reminder and temporal reliability. J. Environ. Manage. 2000, 58, 73–90. [Google Scholar] [CrossRef]
  31. Ojeda, M.I.; Mayer, A.S.; Solomon, B.D. Economic valuation of environmental services sustained by water flows in the Yaqui River Delta. Ecol. Econ. 2008, 65, 155–166. [Google Scholar] [CrossRef]
  32. Carson, R.; Hanemann, M.; Steinberg, D. A discrete choice contingent valuation estimate of the value of Kenai King salmon. J. Behav. 1990, 19, 53–68. [Google Scholar]
  33. Thomas, R.H.; Blakemore, F.B. Elements of a cost-benefit analysis for improving salmonid spawning habitat in the River Wye. J. Environ. Manage. 2007, 82, 471–480. [Google Scholar] [CrossRef]
  34. Clayton, C.; Mendelsohn, R. The value of watchable wildlife: A case study of McNeil River. J. Environ. Manage. 1993, 39, 101–106. [Google Scholar] [CrossRef]
  35. Corrigan, J.R.; Egan, K.J.; Downing, J.A. Aesthetic Values of Lakes and Rivers; Elsevier: Amsterdam, Holland, 2009; pp. 14–25. [Google Scholar]
  36. Shanghai Water Authority, Shanghai River Survey Report in 2006; Shanghai Water Authority: Shanghai, China, 2006; pp. 1–6.
  37. Zhang, Y.; Wang, Y.; Ye, W.H. Surface water quality changes in Shanghai City in past 20 years. Acta Scientiae Circumstantiae 2002, 22, 247–251. (in Chinese). [Google Scholar]
  38. Venkatachalam, L. The contingent valuation method: A review. Environ. Impact Assess. Rev. 2004, 24, 89–124. [Google Scholar] [CrossRef]
  39. Kima, S.S.; Wongb, K.K.F.; Choa, M. Assessing the economic value of a world heritage site and willingness to pay determinants: A case of Changdeok Palace. Tourism Manag. 2007, 28, 317–322. [Google Scholar] [CrossRef]
  40. Ramajo-Hernandez, J.; Saz-Salazar, S. Estimating the non-market benefits of water quality improvement for a case study in Spain: A contingent valuation approach. Environ. Sci. Policy. 2012, 22, 47–59. [Google Scholar] [CrossRef]
  41. Ojeda, M.I.; Mayer, A.S.; Solomon, B.D. Economic valuation of environmental services sustained by water flows in the Yaqui River Delta. Ecol. Econ. 2008, 65, 155–166. [Google Scholar] [CrossRef]
  42. Saz-Salazar, S.; Hernández-Sancho, F.; Sala-Garrido, R. The social benefits of restoring water quality in the context of the water framework directive: A comparison of willingness to pay and willingness to accept. Sci. Total. Environ. 2009, 407, 4574–4583. [Google Scholar] [CrossRef]
  43. Johannesson, M.; Johansson, P.O.; Kristrom, B.; Gerdtham, U.G. Willingness to pay for antihypertensive therapy—Further results. J. Health. Econ. 1993, 12, 95–108. [Google Scholar] [CrossRef]
  44. Ryan, M. Valuing psychological factors in the provision of assisted reproductive techniques using the economic instrument of willingness to pay. J. Econ. Psycholy. 1998, 19, 179–204. [Google Scholar] [CrossRef]
  45. Dutta, M.; Banerjee, S.; Hussain, Z. Untapped demand for heritage: A contigent valuation study of Prinsep Ghat, Calcutta. Tourism Manag. 2007, 28, 83–95. [Google Scholar] [CrossRef]
  46. Hanemann, W.M. Welfare valuations in contingent valuation experiments with discrete responses. Am. J. Agr. Econ. 1984, 66, 332–341. [Google Scholar] [CrossRef]
  47. Hanemann, W.M. Welfare valuations in contingent valuation experiments with discrete response data. Am. J. Agr. Econ. 1989, 71, 1057–1061. [Google Scholar] [CrossRef]
  48. Maslow, A.H. A Theory of Human Motivation. Psychol. Rev. 1943, 50, 370–396. [Google Scholar] [CrossRef]
  49. Che, Y.; Yang, K.; Chen, T.; Xu, Q. Assessing a riverfront rehabilitation project using the comprehensive index of public accessibility. Ecol. Eng. 2012, 40, 80–87. [Google Scholar] [CrossRef]
  50. Liu, C.; Jin, Y.; Yang, K.; Che, Y. Protection of ancient water town’s view and culture based on river network: A case study of Zhujiajiao. World Regional Studies 2011, 2, 171–178. (in Chinese). [Google Scholar]
  51. Gonzalez-Caban, A.; Loomis, J.B.; Rodriguez, A.; Hesseln, H. A comparison of CVM survey response rates, protests and willingness-to-pay of Native Americans and general population for fuels reduction policies. J. Forest. Eco. 2007, 13, 49–71. [Google Scholar]
  52. Bateman, I.J.; Carson, R.T.; Day, B.; Hanemann, W.M.; Hanley, N.; Hett, T.; Jones-Lee, M.; Loomes, G.; Mourato, S.; Ozdemiroglu, E.; et al. Economic Valuation with Stated Preference Techniques: A Manual; Edward Elgar, Ltd.: Cheltenham, UK, 2002; pp. 5–35. [Google Scholar]
  53. García-Llorente, M.; Martín-López, B.; Nunes, P.A.; González, J.A.; Alcorlo, P.; Montes, C. Analyzing the social factors that influence willingness to pay for invasive alien species management under two different strategies: Eradication and prevention. Environ. Manag. 2011, 48, 418–435. [Google Scholar]
  54. Heckman, I. Dummy exogenous variables in a simulation equation system. Econometrica 1978, 46, 403–426. [Google Scholar] [CrossRef]

