Article

Determination of Polycyclic Aromatic Hydrocarbons in Industrial Harbor Sediments by GC-MS

Department of Marine Environmental Engineering, National Kaohsiung Marine University, 142 Haijhuan Road, Nanzih District, Kaohsiung City 81157, Taiwan
*
Author to whom correspondence should be addressed.
Int. J. Environ. Res. Public Health 2012, 9(6), 2175-2188; https://doi.org/10.3390/ijerph9062175
Submission received: 7 May 2012 / Revised: 23 May 2012 / Accepted: 5 June 2012 / Published: 11 June 2012
(This article belongs to the Special Issue Mass Spectrometry and Environmental Analysis)

Abstract

:
Analysis of the 16 polycyclic aromatic hydrocarbons (PAHs) of the US Environmental Protection Agency priority pollutant list was carried out in sediment samples of an industrial port in the southern Kaohsiung Harbor of Taiwan which is supposed to be extensively polluted by industrial wastewater discharges. The determination and quantification of PAHs in sediment samples were performed using gas chromatography coupled to mass spectrometry (GC-MS) with the aid of deuterated PAH internal standards and surrogate standards. The total concentrations of the 16 PAHs varied from 4,425 to 51,261 ng/g dw, with a mean concentration of 13,196 ng/g dw. The PAHs concentration is relatively high in the river mouth region, and gradually diminishes toward the harbor region. Diagnostic ratios showed that the possible source of PAHs in the industrial port area could be coal combustion. As compared with the US Sediment Quality Guidelines (SQGs), the various observed levels of PAHs exceeded the effects range median (ERM), and could thus cause acute biological damages. The results can be used for regular monitoring, and future pollution prevention and management should target the various industries in this region for reducing pollution.

1. Introduction

Polycyclic aromatic hydrocarbons (PAHs) are included in the European Union and US Environmental Protection Agency priority pollutant lists because PAHs represent the largest group of compounds that are mutagenic, carcinogenic, and teratogenic [1,2]. They could also pose potential threats to the marine environment. The effect of PAHs is usually widespread and permanent in environmental media. Most PAHs have high hydrophobicity, and can be sorbed strongly by water-borne organic and inorganic particles. They may eventually be brought down to the bottom sediment as a sink in the aquatic system; the PAHs found in the sediments are resistant to bacterial degradation in an anoxic environment. Even under favorable conditions, the sorbed PAHs will be released to the water as an extended source to threaten the aquatic ecosystem through bioaccumulation in food chains [3]. Thus, understanding the distribution, composition, and potential biological impacts is essential and important for appropriately managing PAHs levels in the environment.
Kaohsiung Harbor is situated along the southwestern coast, and it is the largest international port in Taiwan. In addition, it receives effluents from four contaminated rivers, including Love River, Canon River, Jen-Gen River, and Salt River. Among these four rivers, the Salt River flows through the Linhai Industrial Park and the China Steel Plant (the largest steel plant in Taiwan) and is finally discharged into southern Kaohsiung Harbor (Figure 1). In the Linhai Industrial Park, there are more than 482 registered industrial factories that discharge their treated and untreated wastewaters into the Salt River. Results from recent investigations indicate that the industrial port area of southern Kaohsiung Harbor is heavily polluted by PAHs, and the upstream pollutants brought over by the Salt River represent one of the major pollution sources [4,5]. The river receives untreated municipal and industrial wastewater discharges causing serious deterioration of the river water quality and the environmental quality near the river mouth that seriously threaten the water environmental ecological system.
Previously research on PAHs contamination in the surface sediments of Kaohsiung Harbor reported that the highest levels of PAHs were recorded for surface sediment samples collected in the vicinity of river mouth situated in industrial port area of southern Kaohsiung Harbor, indicating more PAHs were accumulated in industrial port area sediments [4,5]. However, the PAH contamination had significant spatial and temporal variations in harbor sediments, and more understanding of the contamination is needed [6]. The present study therefore aimed to investigate: (a) the distribution, composition, and relative pollution levels of PAHs in the sediments of industrial port area in the southern Kaohsiung Harbor, (b) identify possible sources of PAHs and (c) evaluate the potential biological impacts of these pollutants on the environment.

2. Materials and Methods
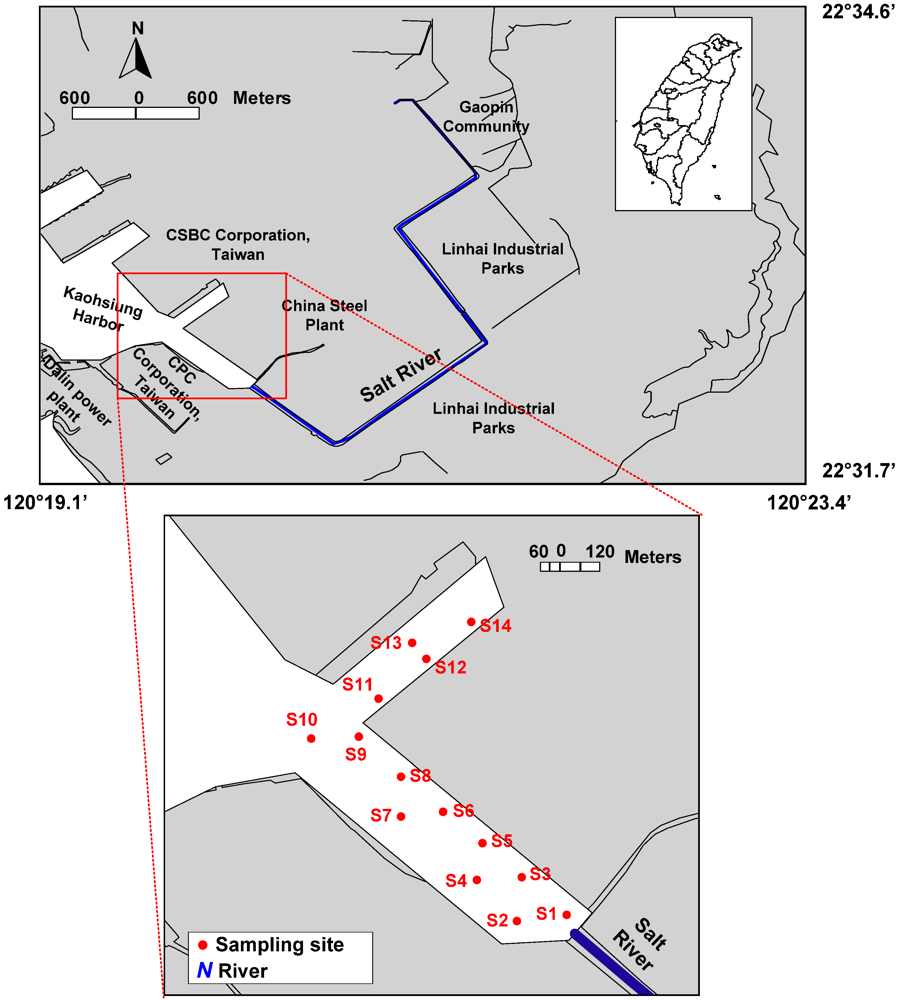
2.1. Sampling

Surface sediment samples were collected at 14 stations located at the industrial port area of southern Kaohsiung Harbor in January 2007 (Figure 1) with an Ekman Dredge Grab aboard a fishing boat. Immediately after collection, the samples were scooped into glass bottles, which had been pre-washed with n-hexane and kept in an icebox, and then transported to the laboratory for analysis. In the laboratory, the samples were freeze-dried for 72 h, ground to pass through a 0.5 mm sieve and fully homogenized [4,5]. The dried sediments were placed at -20 °C in amber glass bottles pre-washed with n-hexane and covered with solvent-rinsed aluminum foil until further processing and analysis.
Figure 1. Map of the study area and sampling locations.
Ijerph 09 02175 g001

2.2. Chemicals

All solvents and reagents used were of trace analysis (TA), chromatographic (HPLC) or ACS grade. Standards of 16 PAHs including naphthalene (NA), acenaphthylene (ACY), acenaphthene (ACE), fluorene (FL), phenantrene (PH), anthracene (AN), fluoranthene (FLU), pyrene (PY), benzo[a]anthracene (BaA), chrysene (CH), benzo[b]fluoranthene (BbF), benzo[k]fluoranthene (BkF), benzo[a]pyrene (BaP), indeno[1,2,3-cd]pyrene (IP), dibenzo[a,h]anthracene (DA), and benzo[g,h,i]perylene (BP) in a 80 mg/L mixture solution were obtained from AccuStandard Chem. Co. (New Haven, CT, USA). Deuterated PAH internal standard solutions (naphthalene-d8, acenaphthene-d10, phenanthrene-d10, chrysene-d12, and perylene-d12) at 4,000 mg/L and surrogate standard solutions (2-fluorobiphenyl and 4-terphenyl-d14) at 2,000 mg/L were obtained from AccuStandard Chem. Co. Internal and surrogate standards were used for sample quantification and quantifying procedural recovery.
PAHs working standards, internal standard mixture solutions and surrogate standard mixture solutions were properly diluted with HPLC grade n-hexane and prepared daily before the analysis. Glassware was washed before use with n-hexane and dried in an oven at 105 °C. Other materials were previously washed with ultrapure water and acetone.

2.3. Sample Preparation

Sediment samples were extracted using a procedure from Chen and Chen [4], which was slightly modified. Briefly, one g (accuracy ± 0.0001 g) of dry and homogenized sediment sample was put into a clean centrifuge tube, and a 1:1 (v/v) acetone/n-hexane (5 mL), and surrogate standard mixture (2-fluorobiphenyl and 4-terphenyl-d14) solutions were then added. Blanks were prepared following the same procedure without adding sediment sample. The standard sample used for quality control was prepared by adding the standard solution to 1:1 (v/v) acetone/n-hexane. All samples were vortexed for 1 min and the mixture was subject to ultrasonic treatment for 15 min for PAH extraction. The sample tubes were then centrifuged at 2,000 rpm for 10 min. After centrifuging, the organic layer containing the extracted compounds was siphoned out with a Pasteur pipette, and the sediment was re-extracted twice with 1:1 (v/v) acetone/n-hexane (5 mL). All extracts were pooled together, and activated copper was added to the combined extract for desulphurization. After subsequent drying over anhydrous sodium sulphate, and concentration to 1.0 mL using a gentle stream of nitrogen, an internal standard mixture (naphthalene-d8, acenaphthene-d10, phenanthrene-d10, chrysene-d12, and perylene-d12) solution was added to the extract to be analyzed using gas chromatography with mass selective detection (GC-MS). Between this study and the previous work [4] the main difference was that in our case the internal standards were increased from three to five types and the capillary column and GC analysis conditions were different too. Moreover, concentrations of PAHs were corrected for the surrogate standard recoveries in this study.

2.4. GC-MS Instrumentation and Conditions

An Agilent 6890N GC (Agilent Technologies, Santa Clara, CA, USA) equipped with an Agilent 7683B Injector (Agilent Technologies, Santa Clara, CA, USA), a 30 m, 0.25 mm i.d. HP-5MS capillary column (Hewlett-Packard, Palo Alto, CA, USA) coated with 5% phenyl-methylsiloxane (film thickness 0.25 μm) and an Agilent 5975 mass selective detector (MSD) was used to separate and quantify the PAH compounds. The samples were injected in the splitless mode at an injection temperature of 300 °C. The transfer line and ion source temperatures were 280 °C and 200 °C. The column temperature was initially held at 40 °C for 1 min, raised to 120 °C at the rate of 25 °C/min, then to 160 °C at the rate of 10 °C/min, and finally to 300 °C at the rate of 5 °C/min, held at final temperature for 15 min. Detector temperature was kept at 280 °C. Helium was used as a carrier gas at a constant flow rate of 1 mL/min. Mass spectrometry was acquired using the electron ionization (EI) and selective ion monitoring (SIM) modes. The ion mass program used for quantification is detailed in Table 1.
Table 1. GC-MS conditions under time scheduled selected ion monitoring.
Time window (min)CompoundNo. of ringsRetention time (min)Molecular massIons m/z window
4.00–9.45Naphthalene-d8 (IS1)27.021136136127,128,129,136,172
Naphthalene27.052128128, 129,127
2-Fluorobiphenyl (SS1)28.297172172
9.45–13.50Acenaphthylene310.128152152, 151,153151,152,153,154,164,166,167
Acenaphthene-d10 (IS2)310.495164164
Acenaphthene310.577154154, 153,152
Fluorene312.049166166, 165,167
13.50–21.50Phenanthrene-d10 (IS3)315.250188188101,176,178,179,188,200,202,203
Phenanthrene315.334178178, 179,176
Anthracene315.526178178, 176,179
Fluoranthene420.224202202, 101,203
Pyrene421.164202202, 200,203
21.50–29.004-Terphenyl-d14 (SS2)422.179244244226,228,229,240,244
Benzo[a]anthracene426.660228228, 229,226
Chrysene-d12 (IS4)426.699240240
Chrysene426.813228228, 226,229
29.00–51.20Benzo[b]fluoranthene531.321252252, 253,125125,138,139,252,253,276,277
Benzo[k]fluoranthene531.431252252, 253,125
Benzo[a]pyrene532.587252252, 253,125
Perylene-d12 (IS5)532.827264264
Indeno[1,2,3-cd]pyrene636.683276276, 138,277
Dibenz[a,h]anthracene536.820278278, 139,279
Benzo[g,h,i]perylene637.616276276, 138,277

2.5. Identification and Quantification

Identity of PAHs in the samples was confirmed by the retention time and abundance of quantification/confirmation ions in the authentic PAHs standards. Sixteen priority PAHs were quantified using the response factors related to the respective internal standards based on five-point calibration curve for individual compounds. In this study, the concentrations of PAHs were corrected for the surrogate standard recoveries, and are expressed on a dry-weight (dw) basis.

3. Results and Discussion

3.1. Analytical Characteristics

Five-point calibration curve (0.08 to 4 ng), procedural blank, check standard and sample duplicates were carried out for every set of samples. The response factors based on the five-point calibration curve for individual compounds showed acceptable relative standard deviation (RSD) values (1.1 to 14.1%), the procedural blank values were always less than the detection limit, the recoveries of individual PAHs in check standards ranged from 87 ± 6% to 128 ± 4% (n = 3) and the relative percent differences of sample duplicates ranged from 7.0 ± 6.0% to 13.3 ± 3.6% (n = 3) for all of the target analyses (Table 2). The surrogate standard recoveries were 94.1 ± 6.6% for 2-fluorobiphenyl and 108.4 ± 8.2% for 4-terphenyl-d14 with sediment samples (n = 17). The detection limits of the analytical procedure were estimated from three times standard deviation from repeated (n = 7) analysis of 16 PAHs (8 pg), and the amount of sample extracted. The detection limits were 0.6 (FL)–5.4 (DA) ng/g dry weight for individual PAHs (Table 2). Reference materials SES-1 (polycyclic aromatic hydrocarbons in spiked estuarine sediment) from National Research Council of Canada (NRCC) were used. Certified and measured concentrations are showed in Table 3 and there is a good agreement among results being the error below 20% for individual PAHs.
Table 2. Response factor, detection limits, recoveries of check standards, and relative percent differences of sample duplicates for individual PAHs in this study.
CompoundResponse factor (RF) (n = 5)Detection Limits DL (ng/g)Check analysis (n = 7) R a (%)Duplication analysis (n = 7) RPD a (%)
Average ± SD aRSD a (%)
Naphthalene2.08 ± 0.178.42.9122 ± 128.7 ± 4.6
Acenaphthylene1.85 ± 0.115.91.487 ± 611.8 ± 3.8
Acenaphthene1.14 ± 0.054.41.9107 ± 99.2 ± 5.0
Fluorene0.86 ± 0.011.10.698 ± 311.2 ± 5.4
Phenanthrene1.09 ± 0.1412.92.3105 ± 910.7 ± 3.3
Anthracene1.28 ± 0.107.62.089 ± 87.0 ± 6.0
Fluoranthene1.17 ± 0.064.81.890 ± 98.9 ± 2.4
Pyrene1.22 ± 0.075.91.790 ± 812.3 ± 2.3
Benzo[a]anthracene0.97 ± 0.1111.62.2105 ± 913.3 ± 3.6
Chrysene1.47 ± 0.2013.72.2105 ± 811.9 ± 7.2
Benzo[b]fluoranthene0.79 ± 0.0911.93.5120 ± 1612.3 ± 4.3
Benzo[k]fluoranthene1.39 ± 0.1410.23.0107 ± 1410.8 ± 2.1
Benzo[a]pyrene0.78 ± 0.034.23.591 ± 1612.3 ± 4.6
Indeno[1,2,3-cd]pyrene0.64 ± 0.069.34.4103 ± 1812.4 ± 6.4
Dibenz[a,h]anthracene0.41 ± 0.0614.15.4112 ± 1411.2 ± 4.9
Benzo[g,h,i]perylene0.72 ± 0.079.95.3128 ± 410.1 ± 7.4
2-Fluorobiphenyl (SS1)1.52 ± 0.095.86-102 ± 77.5 ± 2.5
4-Terphenyl-d14 (SS2)1.41 ± 0.107.09-107 ± 189.2 ± 4.0
a SD: standard deviation; RSD: Relative standard deviation; R: Recoveries; RPD: Relative percent differences.
Table 3. Errors of individual PAHs in reference materials SES-1 (polycyclic aromatic hydrocarbons in spiked estuarine sediment) made in this study.
CompoundsMeasured concentration (ng/g dw)Certified equate concentration (ng/g dw)Error a (%)
#1#2#3
Naphthalene1,8821,9231,9051,70012.0 ± 1.2
Acenaphthene62468864559010.6 ± 5.5
Fluorene63162361555013.3 ± 1.5
Phenanthrene1,1211,1651,1031,0507.6 ± 3.0
Anthracene1517162020.0 ± 5.0
Fluoranthene1,5531,5451,6141,35016.3 ± 2.8
Pyrene2,3112,3822,1542,4004.9 ± 4.9
Benzo[a]anthracene42541042550016.0 ± 1.7
Chrysene1,0551,2841,1481,1008.4 ± 7.2
Benzo[a]pyrene17616513315012.9 ± 3.9
Benzo[g,h,i]perylene59261961269011.9 ± 2.0
Dibenz[a,h]anthracene5415375876007.5 ± 4.6
Indeno[1,2,3-cd]pyrene7277667738005.6 ± 3.1
a average ± standard deviation.

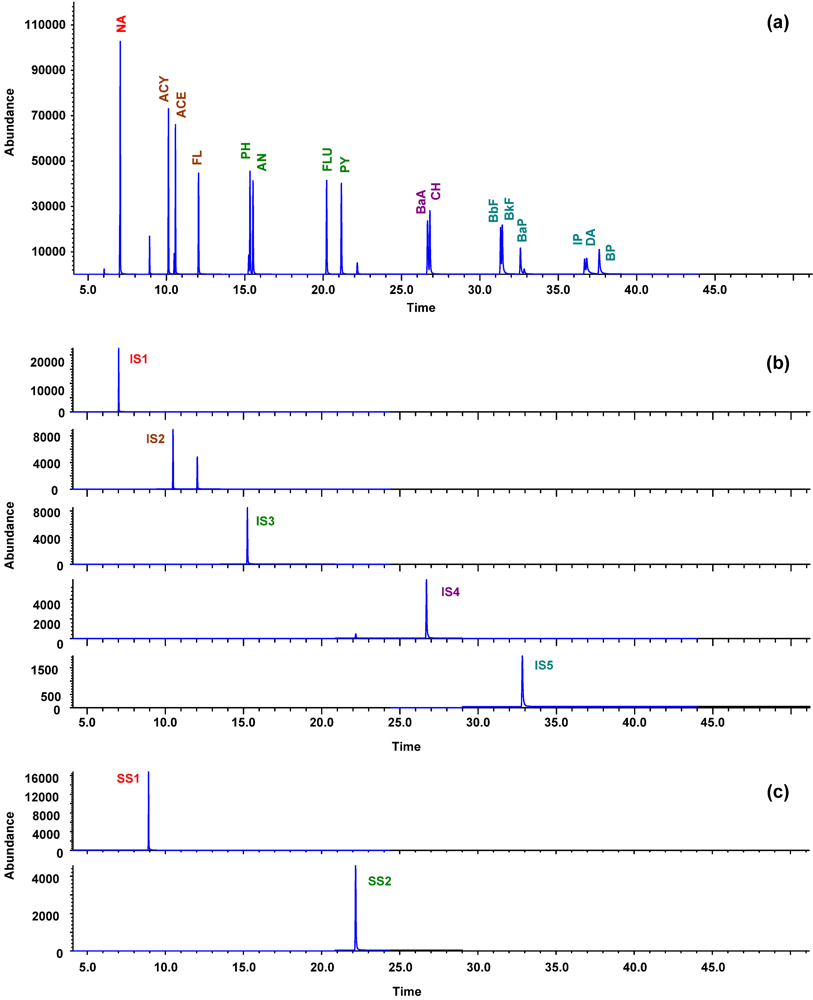
3.2. GC-MS Separation and Identification

Table 2 shows the experimental mass conditions used in the GC-MS analysis. Prior to analyzing the samples, the efficiency of GC-MS for analysis of the target compounds was tested with a standard mixture of 16 PAHs. Figure 2a shows the total ion chromatogram for this analysis. The identities of 16 PAHs were confirmed by the retention time and abundance of quantification/confirmation ions in the authentic PAHs standards. Since the 16 PAHs have significantly different chemical properties and retention times, five isotopic internal standards were used to monitor the 16 PAHs. Naphthalene-d8 with a retention time of 7.021 min was used for the NA. Acenaphthene-d10 with a retention time of 10.495 min was used for the ACY, ACE, and FL within the retention time window of 9.45–13.50 min. Phenanthrene-d10 with a retention time of 15.250 min was used for the PAHs within the retention time range of 13.50–21.50 min. Chrysene-d12 was used for CH and BaA. Perylene-d12 was used for the remaining PAHs. Figure 2(b,c) show the selected ion chromatograms illustrating how the internal standards and surrogate standards effectively cover the 16 PAHs. The separation and quantitation of PAHs in the sediment samples were achieved using the same GC-MS conditions as the standards. Sixteen PAHs were quantified using the response factors related to the respective internal standards based on five-point calibration curve for individual compounds.
Figure 2. (a) GC-MS total ion chromatogram of sixteen PAHs, (b) selected ion chromatograms of the five internal standards, namely naphthalene-d8 (IS1), acenaphthene-d10 (IS2), phenanthrene-d10 (IS3), chrysene-d12 (IS4), and perylene-d12 (IS5), (c) two surrogate standards, 2-fluorobiphenyl (SS1) and 4-terphenyl-d14 (SS2).
Ijerph 09 02175 g002
Table 4. PAH concentration (ng/g dw)in surfaces sediments of industrial port area of southern Kaohsiung Harbor.
Station2-ring3-ring 4-ring 5-ring 6-ring ΣLPAHs aΣHPAHs aΣPAHs a
NA ACE AC FL PH AN FLU PY BaA CH BbF BkF BaP DAIPBP
S11,211 292 1,412 1,370 3,181 206 2,475 1,795 1,925 1,273 1,688 965 957 37 186 354 7,671 11,654 19,325
S22,811 494 6,226 2,964 6,507 2,919 7,817 6,429 2,666 964 3,891 2,196 2,327 332 1,437 1,281 21,921 29,339 51,261
S31,916 396 4,262 2,869 5,256 2,593 6,036 4,950 3,522 2,311 2,638 1,489 1,492 240 925 768 17,291 24,370 41,661
S41,156 159 957 644 2,199 134 1,636 1,284 2,101 1,472 2,245 1,277 729 75 603 269 5,250 11,692 16,941
S5915 5 888 792 2,630 154 2,035 1,550 1,344 1,245 1,495 1,102 539 22 197 220 5,384 9,749 15,133
S6826 14 971 621 1,831 1,684 987 770 1,545 850 1,667 941 473 48 460 379 5,947 8,118 14,065
S72,360 296 2,469 1,420 3,733 2,329 6,468 4,552 1,999 2,154 3,386 1,910 217 189 320 324 12,608 21,519 34,127
S81,836 3 468 859 1,827 360 2,224 2,405 2,913 1,866 3,068 1,022 931 198 294 366 5,353 15,288 20,641
S9973 8 751 723 2,223 2,092 1,447 1,189 1,359 902 1,660 936 1,035 54 208 482 6,771 9,272 16,043
S10934 269 316 274 1,390 1,442 1,585 1,465 1,046 722 2,065 1,165 409 151 540 486 4,624 9,634 14,258
S11440 52 376 184 557 205 460 381 274 149 345 362 154 177 143 167 1,814 2,611 4,425
S12483 106 315 366 683 550 1,068 909 1,178 777 944 533 1,760 269 512 335 2,503 8,286 10,789
S13873 4 598 344 1,245 90 836 663 470 324 1,100 621 314 40 292 289 3,155 4,948 8,103
S141,506 394 2,680 1,876 4,273 262 2,170 1,754 2,908 2,048 2,660 1,501 1,548 114 710 216 10,991 15,628 26,619
ERL b16044161924085.360066526138443063.45521,7004,022
ERM b2,1006405005401,5001,1005,1002,6001,6002,8001,6002603,160960044,792
a ΣLPAHs: sum of NA, ACE, AC, FL, PH, and AN; ΣHPAHs: sum of FLU, PY, BaA, CH, BbF, BkF, BaP, IP, DA, and BP; ΣPAHs: sum of 16 PAHs; b ERL and ERM refers to the effects range low and median [7].

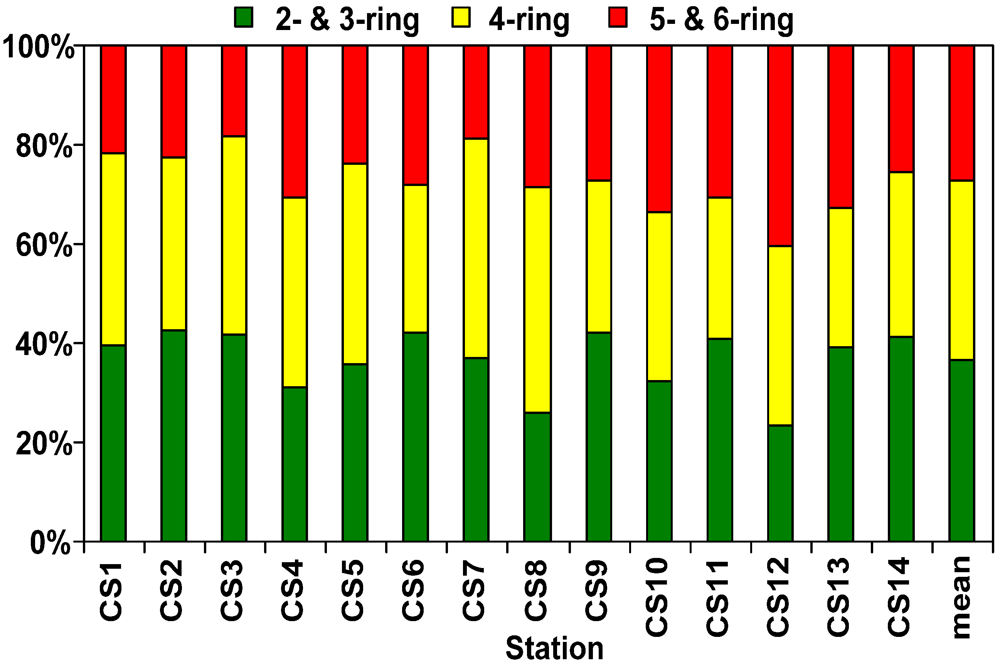
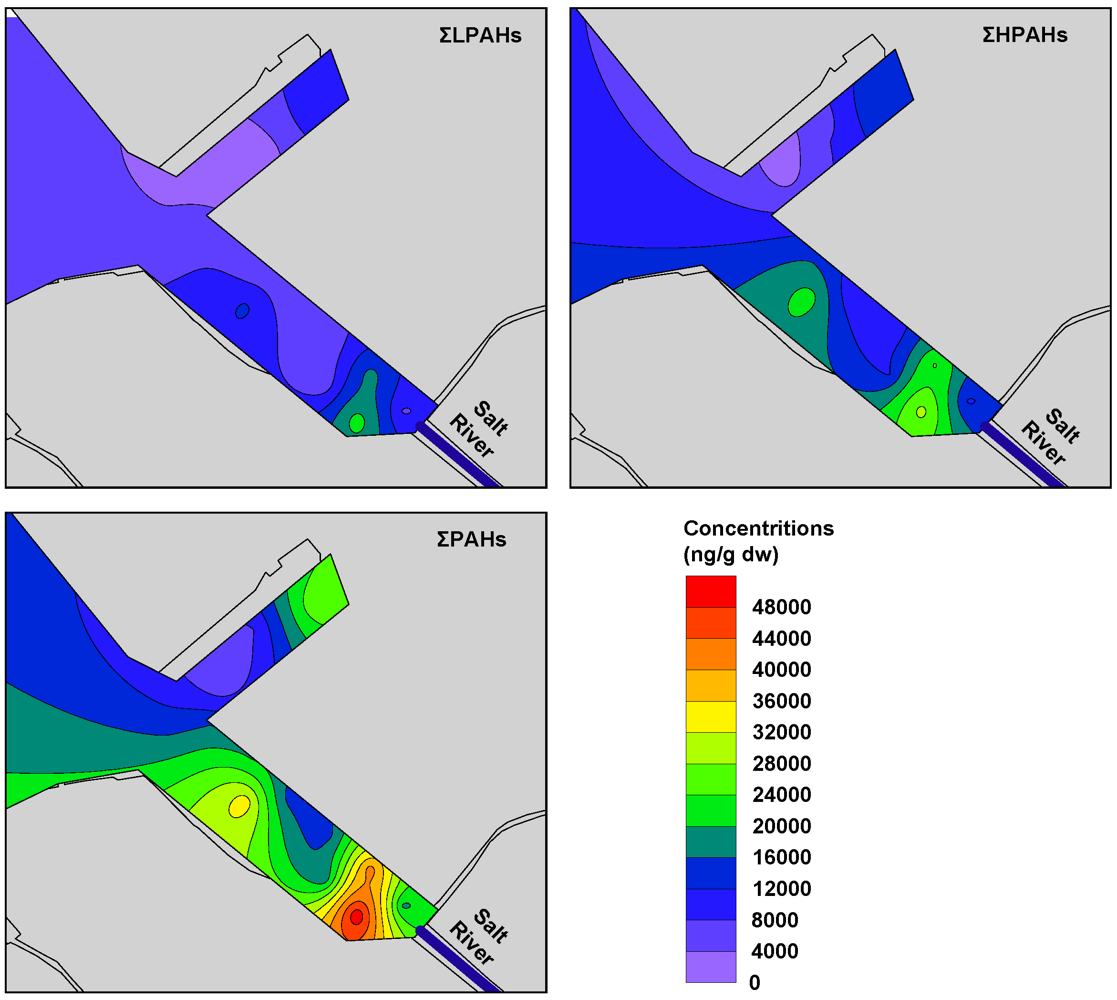
3.3. Distribution and Composition of PAHs

The distribution of 16 PAHs in sediments of industrial port area of southern Kaohsiung Harbor is shown in Table 4. The total amount of PAHs (ΣPAHs) varied from 4,425 to 51,261 ng/g dw, with a mean concentration of 20,957±13,196 ng/g dw. In this study, the average ΣPAHs concentrations were higher than our previous work sampling in the same area in 2006 [4] and 2009 [5], when average ΣPAHs were 13,980 ± 3,254 ng/g dw (n = 3) and 14,616 ± 10,663 ng/g dw (n = 9), respectively. Concentration distributions of ΣPAHs in industrial port area sediment shown in Figure 3 reveal that the sediment PAHs content is relatively higher near the Salt River mouth, and gradually decreases in the direction toward the harbor. This indicates that the major sources of sediment PAHs came from the polluted urban rivers.
According to the number of aromatic rings, the 16 PAHs were divided into three groups: (a) 2- & 3-ring, (b) 4-ring, and (c) 5- & 6-ring PAHs. The 2- & 3-ring PAHs were predominant in sediments from industrial port area of southern Kaohsiung Harbor, ranging from 23% to 43%, with mean of 37% (Figure 4); the percentage compositions are 28–48% (mean of 36%) and 18–40% (mean of 27% )for the 4-ring and 5- & 6-ring PAHs, respectively. The predominance of low and medium molecular weight PAHs in the sediments of this study area reflects the presence of significant combustion products from low temperature pyrolytic processes and/or petrogenic sources [5,8]. The PAHs pollutant level classification was suggested by Baumard et al. [9]: (a) low, 0–100 ng/g; (b) moderate, 100–1,000 ng/g; (c) high, 1,000–5,000 ng/g; and (d) very high, >5,000 ng/g. Sediments from this study area can be characterized as having high to very high PAH pollution. In this study, the composition of PAH congeners and pollution levels were similar to our previous works [4,5]. The result of the study can be confirmed that PAHs had both high extent pollutions and pollutant types in this area, and provided more accurate information for reference of the remediation strategies in the future.
Figure 3. Distributions of ΣLPAH, ΣHPAH, andΣPAHsin sediments fromthe industrial port area of southern Kaohsiung Harbor.
Ijerph 09 02175 g003
Figure 4. PAHs composition in sediments of industrial port area of southern Kaohsiung Harbor, 2- & 3-ring: NA, ACY, ACE, FL, PH, AN. 4-ring: FLU, PY, BaA, CH. 5- & 6-ring: BbF, BkF, BaP, IP, DA, BP.
Ijerph 09 02175 g004
Figure 5. PAHs cross plots for the ratios of FLU/(PY + FLU) vs. AN/(AN + PH).
Ijerph 09 02175 g005

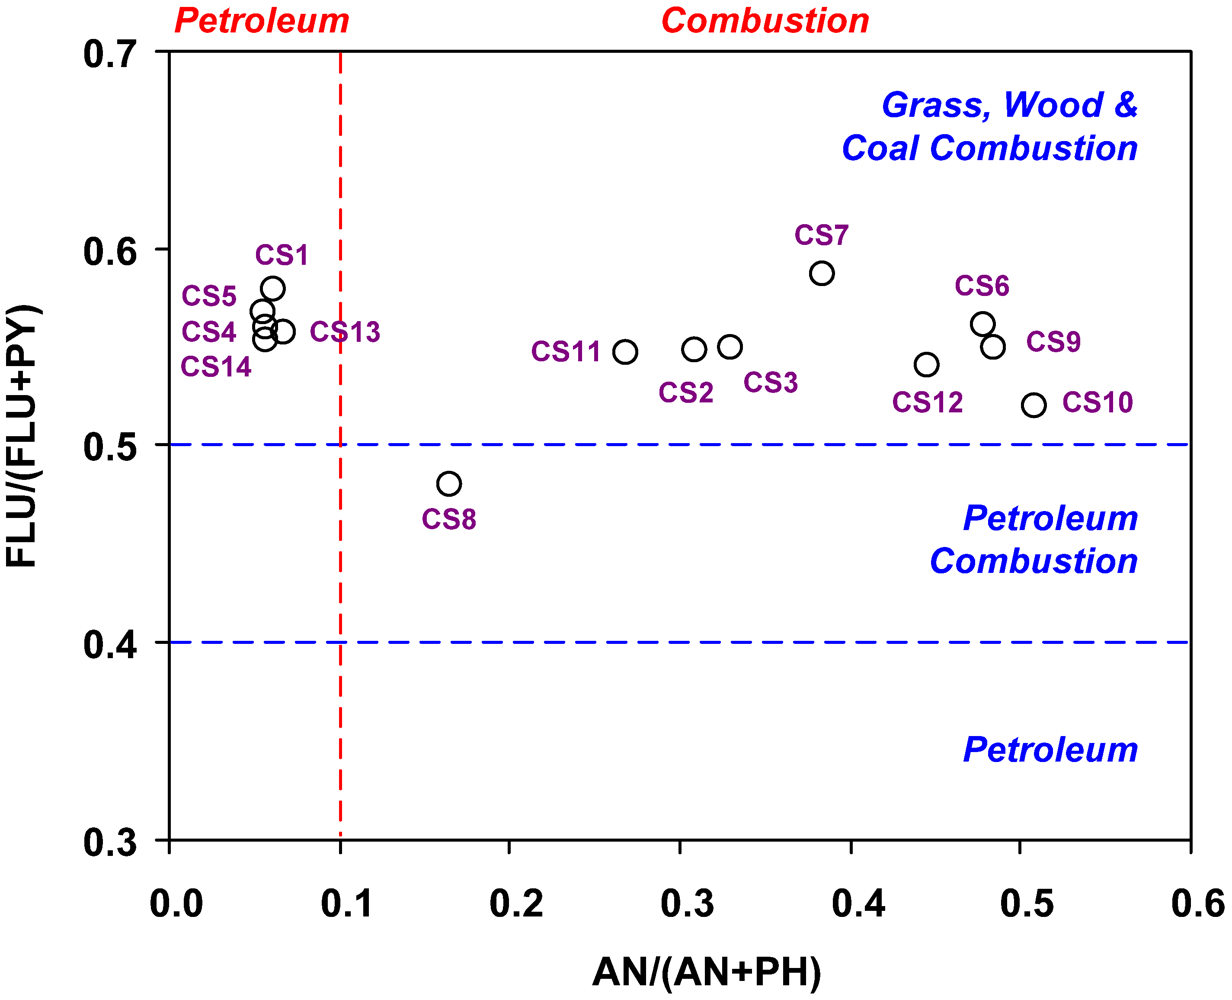
3.4. Sources of PAHs in Sediment

Several PAHs isomeric ratios have been used to identify different sources that contribute PAHs to environmental samples [4,5,10,11]. The common ratios used include AN/(PH + AN) [2,4,12,13,14], and FLU/(FLU + PY) [4,13,14,15]. Ratios of AN/(PH + AN) < 0.1 and FLU/(FLU + PY) < 0.4 usually imply a petrogenic source, whereas ratios of AN/(PH + AN) > 0.1 and FLU/(FLU + PY) > 0.5 suggest a pyrogenic source and combustion source of biomass (grass, wood, or coal combustion), respectively. If the FLU/(FLU + PY) ratio is between 0.4 and 0.5, a combustion of petroleum origin is suggested.
Figure 5 shows the distribution AN/(PH + AN) and FLU/(FLU + PY) ratios in all sediment samples. Results show that ratios of AN/(PH + AN) and FLU/(FLU + PY) were <0.1 and >0.5, respectively at Stations S1, S4, S5, S13, and S14, suggesting that mixed sources could be possible source of PAHs; ratios of AN/(PH + AN) and FLU/(FLU + PY) at Stations 8 were higher than 0.1 and between 0.4 and 0.5, respectively indicate that petroleum combustion sources could be possible source of PAHs; ratios of AN/(PH + AN) and FLU/(FLU + PY) at other stations were higher than 0.1 and 0.5, respectively indicate that coal combustion would make the possible contributions to PAHs. Results from the ratio calculations suggest that PAH input to the industrial port area of southern Kaohsiung Harbor mainly came from domestic oil/coal combustion, because oil/coal burning was used for the energy source in this area [4]. Our previous works showed that coal combustion was the main source of PAHs in the study areas [4,5]. However, the oil combustion and some petrogenic characteristics were also found in the sediments that may be due to the more completed station used in the present study.

3.5. Sediment Biological Effects Based on PAHs

The widely used sediment toxicity screening guidelines of the US National Oceanic and Atmospheric Administration provide two target values to estimate potential biological effects: effects range low (ERL) and effect range median (ERM) [7]. The guideline was developed by comparing various sediment toxicity responses of marine organisms or communities with observed PAH concentrations in sediments. These two values delineate three concentration ranges for each particular chemical. When the concentration is below the ERL, it indicates that biological effects should be rare. If the concentration equals to or is greater than the ERL, but below the ERM, it indicates that a biological effect would occur occasionally. Concentrations at or above the ERM indicate that a negative biological effect would occur frequently. Table 4 shows the measured concentrations of PAHs in comparison with the ERM and ERL values. Among the 14 sediment samples collected, the ΣLPAHs is between ERL and ERM in 3 samples (21%), and exceed ERM in the other samples (79%); the ΣHPAHs is between ERL and ERM in five samples (36%), and exceed ERM in the other samples (64%); the ΣPAHs is between ERL and ERM in 13 samples (93%), and one sample (station S2) exceed ERM. For an individual PAH, they were above ERL but below ERM in three to 14 samples, which indicate that biological effects would occur occasionally. Moreover, except for Station 10 and 11, at least one type of PAHs exceeded the ERM in all stations, which indicates that biological effects would occur frequently.
In addition, a sediment quality guideline of 1,000 ng/g dw total PAHs to protect estuarine fish against several important health effects was suggested by Johnson et al. [16]. According to this guideline, the results of the present study show ΣPAHs exceed 1,000 ng/g dw at all sampling locations and management to reduce adverse environmental effects is urgent.

4. Conclusions

Analysis for 16 PAHs was carried out in sediment samples of an industrial port in the southern Kaohsiung Harbor (Taiwan). The distributions, possible sources and potential biological effects were also evaluated. The total concentrations of 16 PAHs varied from 4,425 to 51,261 ng/g dw, with a mean concentration of 13,196 ng/g dw. The PAH concentration is relatively high in the river mouth region, and gradually diminishes toward the harbor region. This indicates that the major sources of sediment PAHs came from the polluted urban rivers. The possible source of PAHs in the industrial port area could be coal combustion. As compared with the US Sediment Quality Guidelines (SQGs), several of the observed PAH levels exceeded the ERM, and could thus cause acute biological damage. The results should be useful in designing future strategies for environmental protection of the port, with special focus on the area at industrial zone dock.

Acknowledgments

This work was supported by the China Steel Corporation, Taiwan. The authors would like to thank the personnel of the China Steel Corporation for their support throughout this project.

References

  1. Sverdrup, L.E.; Nielsen, T.; Krogh, P.H. Soil ecotoxicity of polycyclic aromatic hydrocarbons in relation to soil sorption, lipophilicity, and water solubility. Environ. Sci. Technol. 2002, 36, 2429–2435. [Google Scholar]
  2. Qiao, M.; Wang, C.; Huang, S.; Wang, D.; Wang, Z. Composition, sources, and potential toxicological significance of PAHs in the surface sediments of the Meiliang Bay, Taihu Lake, China. Environ. Int. 2006, 32, 28–33. [Google Scholar] [CrossRef]
  3. Zhang, C.; Zheng, G. Characterization and Desorption Kinetics of PAHs from Contaminated Sediment in Houston Ship Channel. In 2003 Annual Report; Environmental Institute of Houston, University of Houston-Clear Lake: Houston, TX, USA, 2003; pp. 39–41. [Google Scholar]
  4. Chen, C.W.; Chen, C.F. Distribution, origin and potential toxicological significance of polycyclic aromatic hydrocarbons (PAHs) in sediments of Kaohsiung Harbor, Taiwa. Mar. Pollut. Bull. 2011, 63, 417–423. [Google Scholar] [CrossRef]
  5. Chen, C.W.; Chen, C.F.; Dong, C.D.; Tu, Y.T. Composition and source apportionment of PAHs in sediments at river mouths and channel in Kaohsiung Harbor, Taiwan. J. Environ. Monit. 2012, 14, 105–115. [Google Scholar] [CrossRef]
  6. Ke, L.; Yu, K.S.H.; Wong, Y.S.; Tam, N.F.Y. Spatial and vertical distribution of polycyclic aromatic hydrocarbons in mangrove sediments. Sci. Total Environ. 2005, 340, 177–187. [Google Scholar] [CrossRef]
  7. Long, E.R.; MacDonald, D.D.; Smith, S.L.; Calder, F.D. Incidence of adverse biological effects within ranges of chemical concentrations in marine and estuary sediments. Environ. Manag. 1995, 19, 81–97. [Google Scholar] [CrossRef]
  8. Garcia-Falcon, M.S.; Soto-Gonzalez, B.; Simal-Gandara, J. Evolution of the concentrations of polycyclic aromatic hydrocarbons in burnt woodland soils. Environ. Sci. Technol. 2006, 40, 759–763. [Google Scholar]
  9. Baumard, P.; Budzinski, H.; Garrigues, P. Polycyclic aromatic hydrocarbons (PAHs) in sediments and mussels of the western Mediterranean Sea. Environ. Toxicol. Chem. 1998, 17, 765–776. [Google Scholar] [CrossRef]
  10. Fang, M.D.; Lee, C.L.; Yu, C.S. Distribution and source recognition of polycyclic aromatic hydrocarbons in the sediments of Hsin-Ta Harbour and adjacent coastal areas, Taiwan. Mar. Pollut. Bull. 2003, 46, 941–953. [Google Scholar] [CrossRef]
  11. Jiang, J.J.; Lee, C.L.; Fang, M.D.; Liu, J.T. Polycyclic aromatic hydrocarbons in coastal sediments of southwest Taiwan: An appraisal of diagnostic ratios in source recognition. Mar. Pollut. Bull. 2009, 58, 752–760. [Google Scholar] [CrossRef]
  12. Yunker, M.B.; Macdonald, R.W.; Vingarzan, R.; Mitchell, R.H.; Goyette, D.; Sylvestre, S. PAHs in the Fraser River Basin: A critical appraisal of PAH ratios as indicators of PAH source and composition. Org. Geochem. 2002, 33, 489–515. [Google Scholar] [CrossRef]
  13. Zhang, J.; Cai, L.Z.; Yuan, D.X.; Chen, M. Distribution and sources of polynuclear aromatic hydrocarbons in mangrove surficial sediments of Deep Bay, China. Mar. Pollut. Bull. 2004, 49, 479–486. [Google Scholar] [CrossRef]
  14. Li, G.; Xia, X.; Yang, Z.; Wang, R.; Voulvoulis, N. Distribution and sources of polycyclic aromatic hydrocarbons in the middle and lower reaches of the Yellow River, China. Environ. Pollut. 2006, 144, 985–993. [Google Scholar] [CrossRef]
  15. Magi, E.; Bianco, R.; Ianni, C.; Carro, M.D. Distribution of polycyclic aromatic hydrocarbons in the sediments of the Adriatic Sea. Environ. Pollut. 2002, 119, 91–98. [Google Scholar] [CrossRef]
  16. Johnson, L.L.; Collier, T.K.; Stein, J.E. An analysis in support of sediment quality thresholds for polycyclic aromatic hydrocarbons (PAHs) to protect estuarine fish. Aquat. Conserv. Mar. Freshw. Ecosyst. 2006, 12, 517–538. [Google Scholar]

