Bidding Behavior in the Housing Market under Different Market Regimes


NTNU Business School, Norwegian University of Science and Technology, 7004 Trondheim, Norway
*
Author to whom correspondence should be addressed.
J. Risk Financial Manag. 2018, 11(3), 41; https://doi.org/10.3390/jrfm11030041
Submission received: 25 June 2018
/
Revised: 9 July 2018
/
Accepted: 13 July 2018
/
Published: 15 July 2018
(This article belongs to the Special Issue Housing Market Bubbles, Credit and Crashes)
Abstract
:The aim of this paper is to investigate whether different market regimes affect bidding behavior in housing auctions. Taking advantage of special circumstances in the Norwegian housing market in 2015 and 2016, we conduct a survey involving 1803 respondents in three of Norway’s largest cities, Oslo, Stavanger and Trondheim. In the Norwegian housing market 90 percent of dwellings are sold after an English auction. Norway has a rather homogeneous market, with the same laws, traditions, interest rates and approximately the same tax rates applying across the country. However, in December 2016, the two-year nominal house price increase was 34.8 percent in Oslo and 14.8 percent in Trondheim, whereas prices fell 7.8 percent over the same period in Stavanger. We find that households in booming housing markets appear to believe that a more aggressive bidding strategy is advisable to obtain a dwelling at the lowest possible price, compared with households in bust markets. Evidence suggesting that bidders in booming markets are less likely to decide on a maximum price limit before an auction commences substantiates this finding. In addition, we find that bidders in booming markets have a weaker reliance on real estate agents.
1. Introduction
The aim of this paper is to investigate whether the prevailing housing market regime affects households’ behavior in English auctions, which is the traditional way of selling used residential dwellings in Norway. The auction format makes for a quick and responsive market, in which buyer behavior is more explicitly apparent compared with markets dominated by fixed or negotiated house prices. We conducted a questionnaire survey on the topic of bidding behavior, involving 1803 respondents in three of Norway’s largest cities, Oslo, Stavanger and Trondheim. Norway has a rather homogeneous housing market, with the same laws, traditions, interest rates and approximately the same tax rates applying across the country. However, at the end of 2016, when the survey was conducted, these three cities were subject to very different housing market regimes. While the Oslo market was booming, with a two-year nominal house price growth of 34.8 percent, Stavanger experienced falling house prices, with a two-year house price fall of 7.8 percent, whereas Trondheim had a relatively stable two-year growth of 14.8 percent.
In The General Theory of Employment, Interest and Money (1936), Keynes emphasized long-run expectations and “animal spirits” as possible explanations for instability or disturbances in the economy. Keynes suggested that all decisions are based on a combination of rational calculation and a spontaneous urge to action rather than inaction:
“Even apart from the instability due to speculation, there is the instability due to the characteristic of human nature that a large proportion of our positive activities depend on spontaneous optimism rather than mathematical expectations, whether moral or hedonistic or economic” (Keynes 1936, p. 161).
In Akerlof and Shiller’s book Animal Spirits (2010), the authors described five different aspects of animal spirits: confidence, fairness, corruption and bad faith, money illusion and stories. For our study of house prices, confidence and stories are the most relevant aspects of animal spirits. Like Keynes, Akerlof and Shiller considered the concept of rationality. They argued that confidence is closely related to acts of trust, in the sense that behavior goes beyond the rational decision-making process and that trust surges in good times. Although a trusting person may process the available information rationally, he/she may still choose to forget or overlook certain information and act on what he/she trusts to be true. This can lead to individual, uncritical and spontaneous decisions, which are characterized as rational to a lesser extent. Akerlof and Shiller further argued that the confidence of any large group tends to be affected by and revolve around stories, such as “new era stories” accompanying stock market booms around the world; that is, confidence, or a lack thereof, is contagious and spreads like a disease, based on stories and word of mouth. In this regard, news stories about booming markets may increase confidence, which in turn affects the decision-making of the market actors.
Shiller conducted several studies with Case and Thompson (Case et al. 2012) of house buyers’ behavior, using questionnaire surveys undertaken in 1988 and then annually from 2003 through 2014. They found that long-term home price expectations explain much of the house price cycle.
Our hypothesis is that spontaneous optimism, the spontaneous urge to action rather than inaction, and the trust in good times that can lead to uncritical and spontaneous decisions that are less characterized by rational behavior, will lead us to find more aggressive bidding behavior in the booming Oslo market than in the Stavanger bust market. We take advantage of special circumstances in the Norwegian housing market in 2015 and 2016, and conduct a survey involving 1803 respondents in three of Norway’s largest cities. We believe that aggressive bidding behavior contributes to explaining the house price cycle. We define the following bidding behavior as aggressive: starting with a high opening bid, entering the auction with an opening bid as early as possible, making large bid increases during the auction, submitting bids with short acceptance deadlines, and responding quickly to competing bids. Since this is a survey, there exists a possible bias because of the hypothetical nature of the questions; we believe that this bias is evenly distributed between the three cities. The same applies to the possibility that the respondents have misunderstood one or more of the questions in the survey.
The auction theory literature describes four classic auction formats: the open ascending-bid auction (also called the English auction), the open descending-bid auction (also called the Dutch auction), the first-price sealed-bid tender and the second-price sealed-bid tender. In Vickrey’s seminal paper Counterspeculation, Auctions and Competitive Sealed Tenders (1961), the author argued that the optimal solution to an English auction is achieved when the participants slightly increase their bids until a single bidder remains, and the auction arrives at a price marginally above the second highest valuation. The auction literature also discusses possible advantages of using an aggressive bidding strategy, in the form of high opening bids and bid increases. Fishman (1988) argued that placing high opening bids, or so-called preemptive bidding, signals a higher valuation that can discourage competitors from entering the auction. Likewise, Daniel and Hirshleifer (1998) and Avery (1998) suggested that jump bidding, where bids increase by a higher amount than necessary, can be a profitable intimidation strategy. If the strategy is successful, the competitors either choose not to enter the auction or to discontinue bidding before they reach their willingness-to-pay value, and the auctioned object can be bought at a lower price. After finding no evidence of effective signaling behavior in an experimental study, Isaac et al. (2005, 2007) suggested that impatience is an alternative motivation for the use of jump bidding in auctions. However, Grether et al. (2011) found evidence to support both intimidation and impatience as explanations in an empirical study of internet auctions for used cars. There are few empirical studies concerning bidding strategies in real estate auctions. Evidence from the Swedish market shows that jump bidding in the early stages of the competition reduces the number of bidders (Hungria-Gunnelin 2013). However, there is no indication that jump bidding reduces the sales price (Hungria-Gunnelin 2015).
Based on our survey, we find that households in booming housing markets seem to believe that to obtain a dwelling at the lowest possible price, it is advisable to adopt a more aggressive bidding strategy, compared with households in areas with falling house prices. The evidence suggesting that bidders in booming markets are less likely to decide on a maximum price limit before the auction commences substantiates this. Additionally, we find that bidders in booming markets have a weaker reliance upon real estate agents.
The remainder of this paper is structured as follows. Section 2 provides the background for the study, with an introduction to Norwegian real estate auctions and the housing market. A description of the survey, data and methodology is presented in Section 3, and the results are presented in Section 4. Section 5 concludes.
2. Background
2.1. Norwegian Real Estate Auctions
In the Norwegian housing market, 90 percent of residential dwellings are sold after an English auction, where the participants sequentially raise their offers until a single bidder is remaining, paying the amount of the highest bid. The auction and the preceding marketing are organized by a real estate agent, hired by the seller, who takes on the role of both independent third party and auctioneer. To acquire this title, a real estate agent requires a bachelor’s degree and two years’ work experience from a real estate company. The auction process and real estate agents are subject to regulations stipulated in the Marketing Act (2009); the Regulation on Real Estate (2007) and the Industry Norm (2014) to provide the foundations for safe transactions for both sellers and buyers.
Dwelling advertisements are promoted through channels such as classified advertising websites, realtor websites and newspapers. They typically contain pictures, house characteristics, neighborhood information, specific dates for an open house and the asking price. There is no traditional reservation price, but the asking price must reflect the true market value, and the seller must be willing to accept it. Conversely, the seller can choose to cancel the auction and advertise the dwelling at a later date with a higher asking price. At the open house, potential bidders indicate their interest by signing a list, which means that the real estate agent will inform them about bids during the auction. Normally, the auction is conducted via e-mail or text messages, with the agent as the intermediary between the bidders and the seller.
All bids, including potential counter offers from the seller, are binding during the time period specified in each bid’s acceptance deadline, chosen by the bidder. However, neither vendor bidding nor dummy bids are allowed. Agents do not allow unreasonably short acceptance deadlines or bids expiring before 12:00 noon on the day following the last announced showing, but there are no further restrictions on the length of deadlines or the sizes of opening bids and bid increases. This gives bidders the freedom to use both bid size and time as strategic measures throughout the auction.
2.2. The Norwegian Housing Market in 2016
Oslo is the capital of Norway and its largest city. In 2017, metropolitan Oslo had a population of more than one million and the municipality had a population of approximately 670,000 persons.
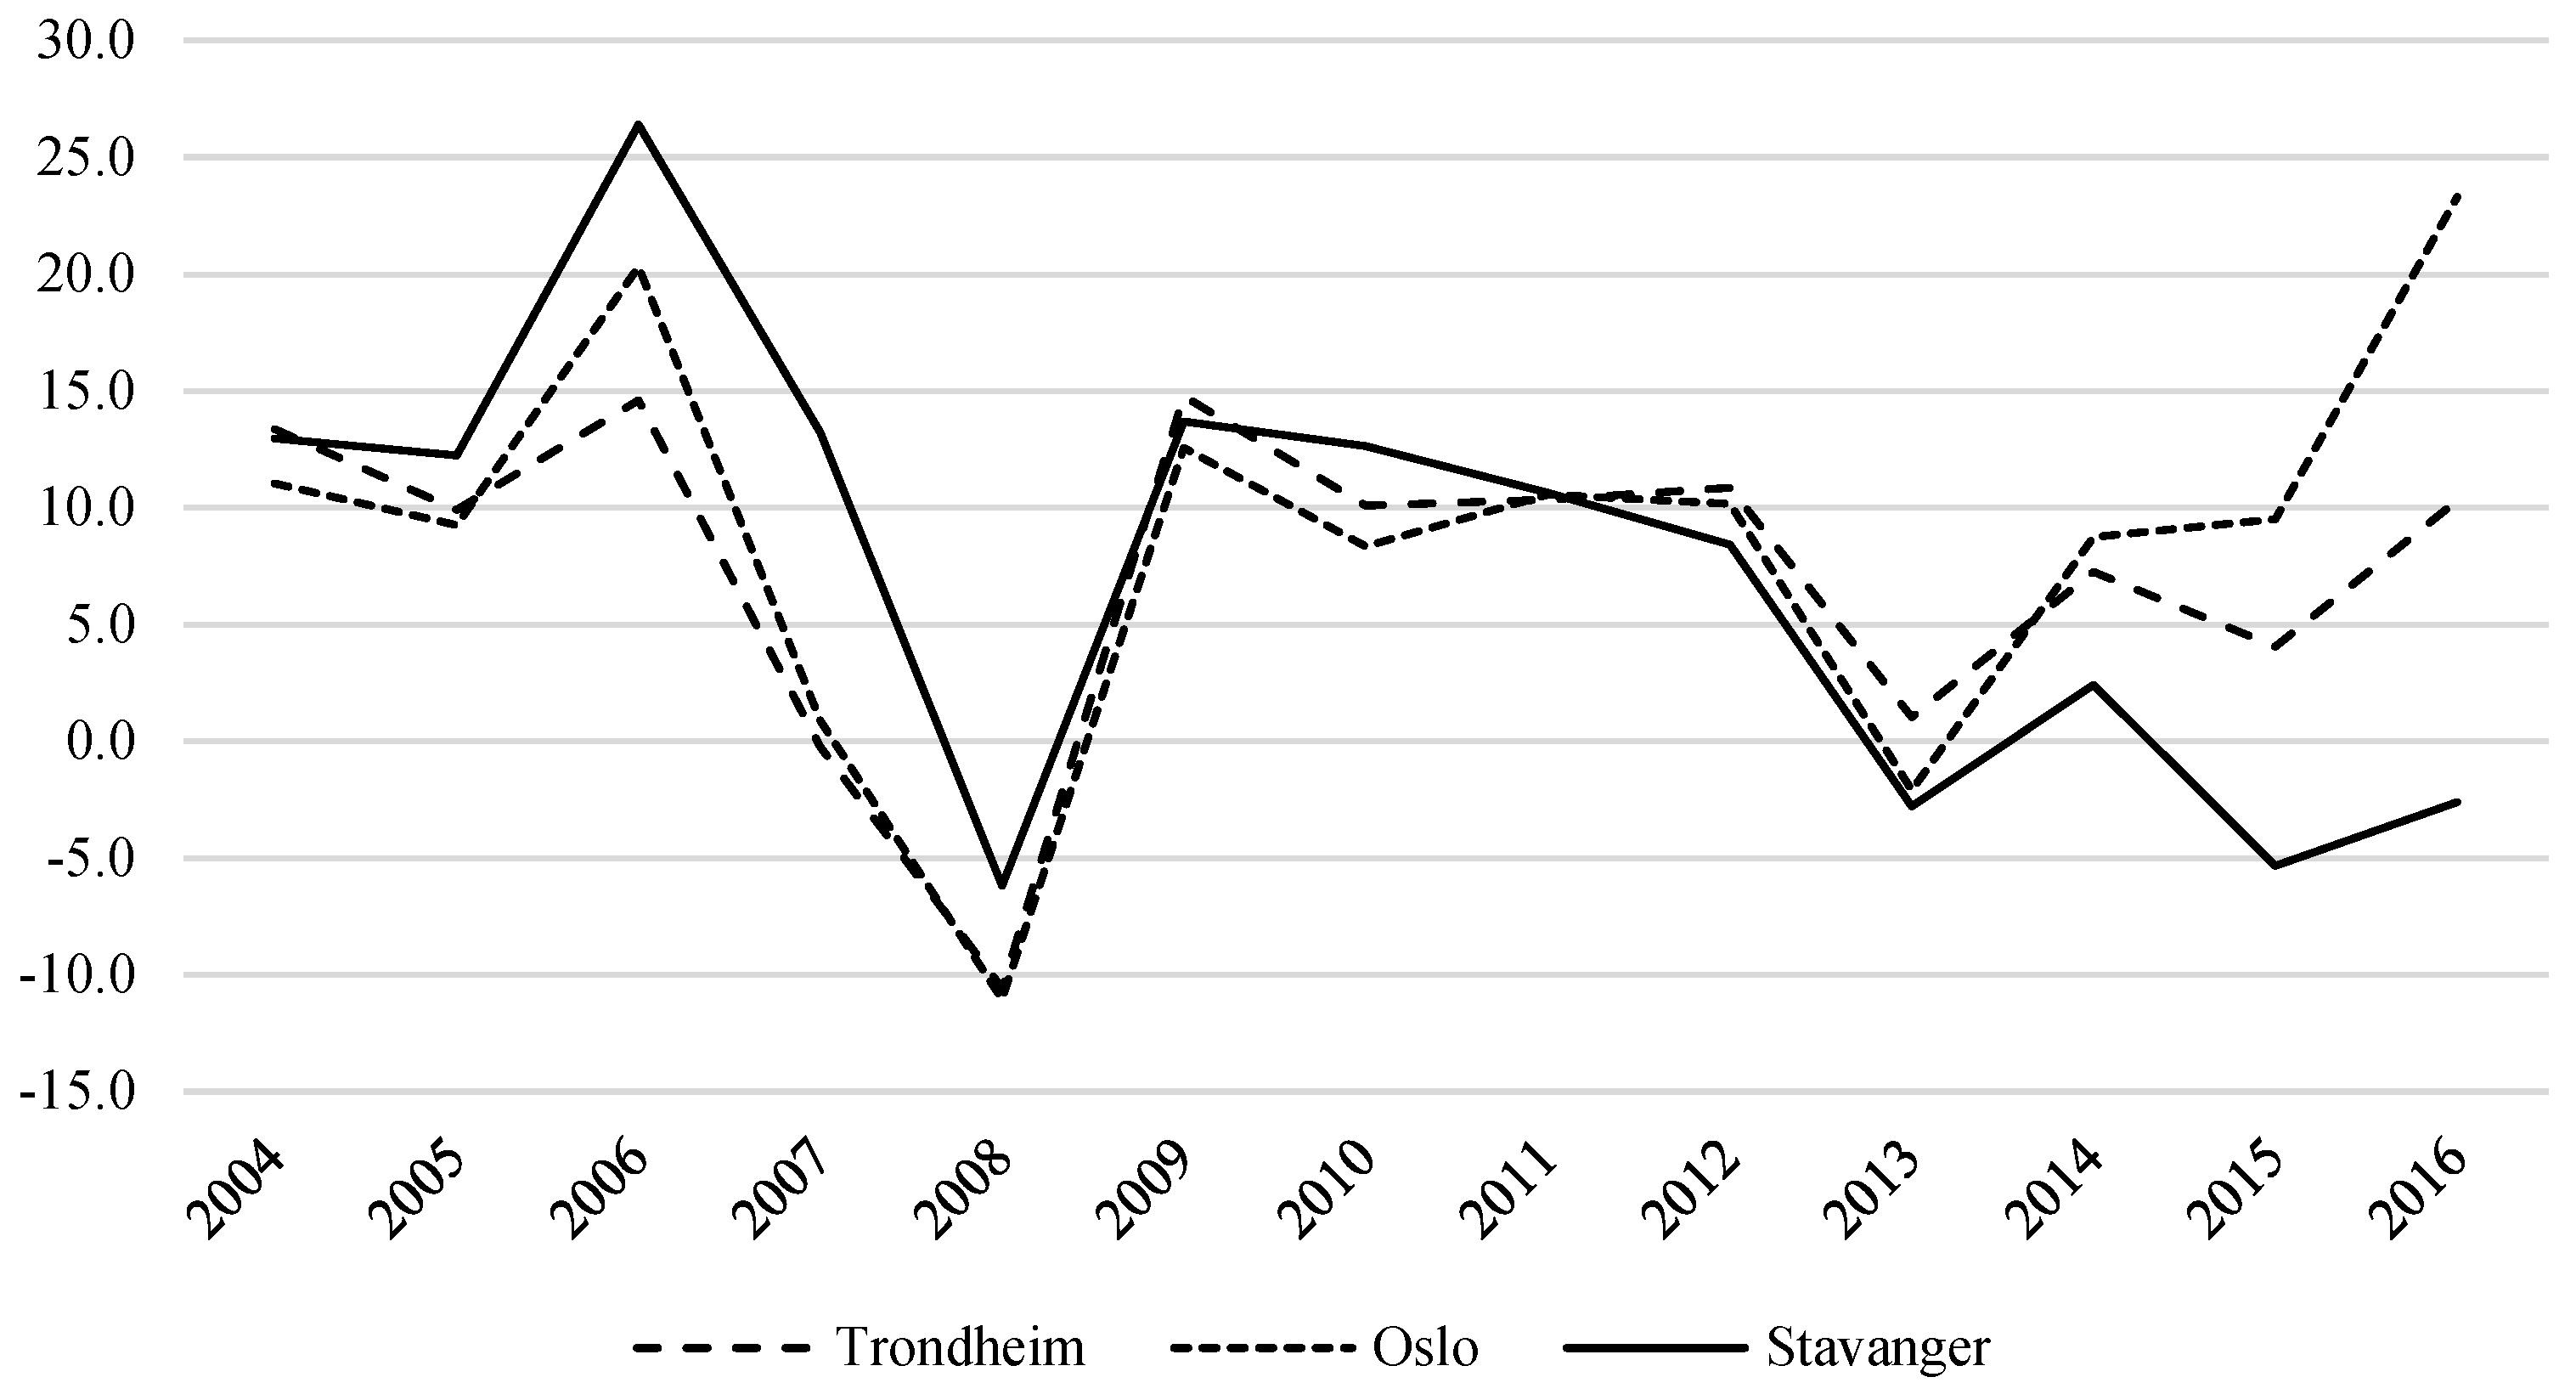
Oslo has experienced a long period of high and stable growth. In 2016, net migration was 2401 people and the unemployment rate was 3.2 percent, down from 3.5 percent the year before. In 2016, the total nominal house price increase in Oslo, measured over the last two years, was 34.8 percent (Figure 1).
In 2017, Trondheim had a population of approximately 194,000, as well as roughly 14,000 students who lived in the city, but were officially counted as inhabitants of other municipalities. As the third largest city in Norway, Trondheim has a large public sector; the university (Norwegian University of Science and Technology) has 34,000 students and 6000 employees. The city has enjoyed a long period of high and stable growth. In 2016, net migration was 1962 people and the unemployment rate was 2.3 percent, down from 2.5 percent the year before. Trondheim had a total house price increase of 14.8 percent in 2015 and 2016.
Stavanger is the fourth largest city in Norway and the home of the Norwegian oil industry. In 2017, metropolitan Stavanger had a population of approximately 243,000 and the municipality had 133,000 inhabitants. In 2016, after a long period of high oil prices, the price of Brent oil dropped, from a high of $114 in the summer of 2014 to $30 in January 2016. This resulted in oil-related companies massively cutting costs and downsizing. In 2016, the unemployment rate increased from 4.5 percent to 5.1 percent and net migration was −766 people. The housing market in Stavanger had been among the most booming in Norway, with experts concerned about a housing bubble, but house prices fell rapidly from 2014 by 7.8 percent.
3. Data and Methodology
3.1. Survey
Our survey was conducted in December 2016 and January 2017 (Sønstebø 2017). In total, there were 1803 participants, with 601 from Stavanger, 600 from Trondheim and 602 from Oslo. As the original questionnaire was in Norwegian, an English translation was prepared for the purpose of this paper. The three cities were chosen because their populations are among the four largest in Norway and because their varying housing price cycles in the years preceding the sample—a boom market in Oslo, a stable market in Trondheim, and a bust market in Stavanger—enabled us to analyze bidder behavior under different market regimes.
After an initial section of the survey comprising socioeconomic questions, the survey involved an experiment regarding a hypothetical auction for a home. As it was possible that the respondents’ knowledge of auction processes would vary, explanatory text prefaced certain aspects of the experiment to ensure more precise answers from the respondents. The text also provided each respondent with one of three different list prices and a corresponding willingness to pay, and asked the respondents to state a preferred opening bid on the dwelling. In addition, the participants had to take into account either a high or a low number of potential bidders when making their decision. The question of sample size was assessed on the basis of the experiment, as the six different scenarios generated by the different list prices and numbers of potential bidders were distributed equally between the cities. With at least 100 respondents from each city assigned to each scenario, the magnitude of the sample made it possible to draw generalized conclusions from between-city effects.
The next section of the survey contained a number of statements regarding opening bids, bid increases, acceptance deadlines and perceptions of real estate agents. Respondents were asked to state their level of agreement with the statements. Responses ranged from strongly agree to strongly disagree, with the added option of I do not know. Thus, the response alternatives followed a standard seven-point Likert scale, suitable for regression analysis. Finally, the respondents with real-life bidding experience were singled out and asked a number of questions regarding their most recent auction involvement. The questions concerned predetermined price limits chosen by the respondents and/or their bank, and whether these limits were exceeded during the auction.
3.2. Socioeconomic Descriptive Data
Table A1 in Appendix A presents the socioeconomic descriptive statistics and their distribution among the three cities. In total, there is a slight male majority because males accounted for 59.1 percent of the population in Stavanger, compared with 49.7 percent and 45.2 percent in Trondheim and Oslo, respectively. Comparing the age distribution, Trondheim has a higher proportion of respondents aged 18–39 years, Oslo has a higher proportion of middle-aged respondents, and Stavanger has a higher proportion aged 60 years and over. The majority of participants had completed education to university or college level, equal to a bachelor’s degree or higher, with Oslo having the highest proportion of such persons, followed by Trondheim and Stavanger. Stavanger had the highest percentage of unemployed and retired respondents, possibly because of the oil industry decline. Trondheim had the most students, consistent with its higher number of young respondents, whereas Oslo had the most employed respondents among the three cities. The majority of respondents had a gross income level of 400,000–599,000 NOK, but Trondheim had the highest proportion of respondents below this range and Stavanger had the highest proportion above it.
3.3. Methodology
To test for differences regarding maximum prices, the respondents were asked whether they themselves or their bank set a maximum price and whether they exceeded these price limits. Based on the questions, we construct three logit models, specified as follows:
where is the probability that respondent answers Yes to the question, i.e., a positive outcome, is a vector of locational dummy variables, comprising Trondheim and Oslo, and is a dummy variable that indicates whether the respondent has recent bidding experience. takes a value of one for respondents who have bid on a dwelling during the last two years, and zero for respondents with earlier bidding experience. is a vector of interaction variables for effects between location and bidding experience, and is a vector of socioeconomic control variables, comprising gender, age, education, employment and income. The vector , , and the vectors and represent the corresponding coefficients, whereas and are the constant and error terms, respectively. Stavanger serves as the locational reference group.
To investigate whether the market regimes have any effect on the aggressiveness of the bidders, we construct the following ordinary least squares (OLS) model, in which the ratio of the opening bid to the list price from the experiment is regressed on the locational variables, and the number of potential bidders and the socioeconomic factors are controlled for:
where is the opening bid to list price ratio stated by respondent , is the vector of locational dummy variables, is a dummy variable indicating a high (low) number of potential bidders, which takes a value of one (zero) and is the vector of socioeconomic control variables. The vector , and the vector represent the corresponding coefficients, whereas and are the constant and the error terms, respectively. Again, Stavanger serves as the locational reference group.
To test further whether the inclination to act aggressively differs between cities, we construct two indexes for aggressive bidding behavior based on results from the statements in the survey. Additionally, we construct one index for the bidders’ reliance upon real estate agents to investigate potential disparities in attitudes toward one of the most important market participants. The response alternatives for each claim are recoded so that a higher number reflects a stronger inclination toward an aggressive strategy, or a stronger inclination to rely on real estate agents. Only the seven-point scale is considered and, as such, the added option of I do not know is treated as a missing value. Then, the responses to the claims are aggregated to make the corresponding indexes. Taking the natural logarithm of these indexes, they are regressed on the locational variables and the socioeconomic factors controlled for by applying the following OLS model:
where is the natural logarithm of the index values in question, answered by respondent , is the vector of locational dummy variables, and is the vector of socioeconomic control variables. The symbols and are the corresponding vectors of coefficients, and and are the constant and error terms, respectively. Again, Stavanger serves as the locational reference group.
4. Results
We are unable to undertake a temporal comparison of the results because of the cross-sectional nature of our dataset. Thus, there is a possibility that between-city differences could be caused by something other than the current market regime, for example, city-specific bidding behavior. However, we argue that because the market regulations, traditions, interest rates and tax rates are uniform across cities, there is an appropriate foundation for the comparison of the market regimes. Moreover, the largest real estate agencies have departments in all three cities and all the agents have the same education; thus, it is reasonable to consider that their practice is somewhat homogeneous over the different locations.
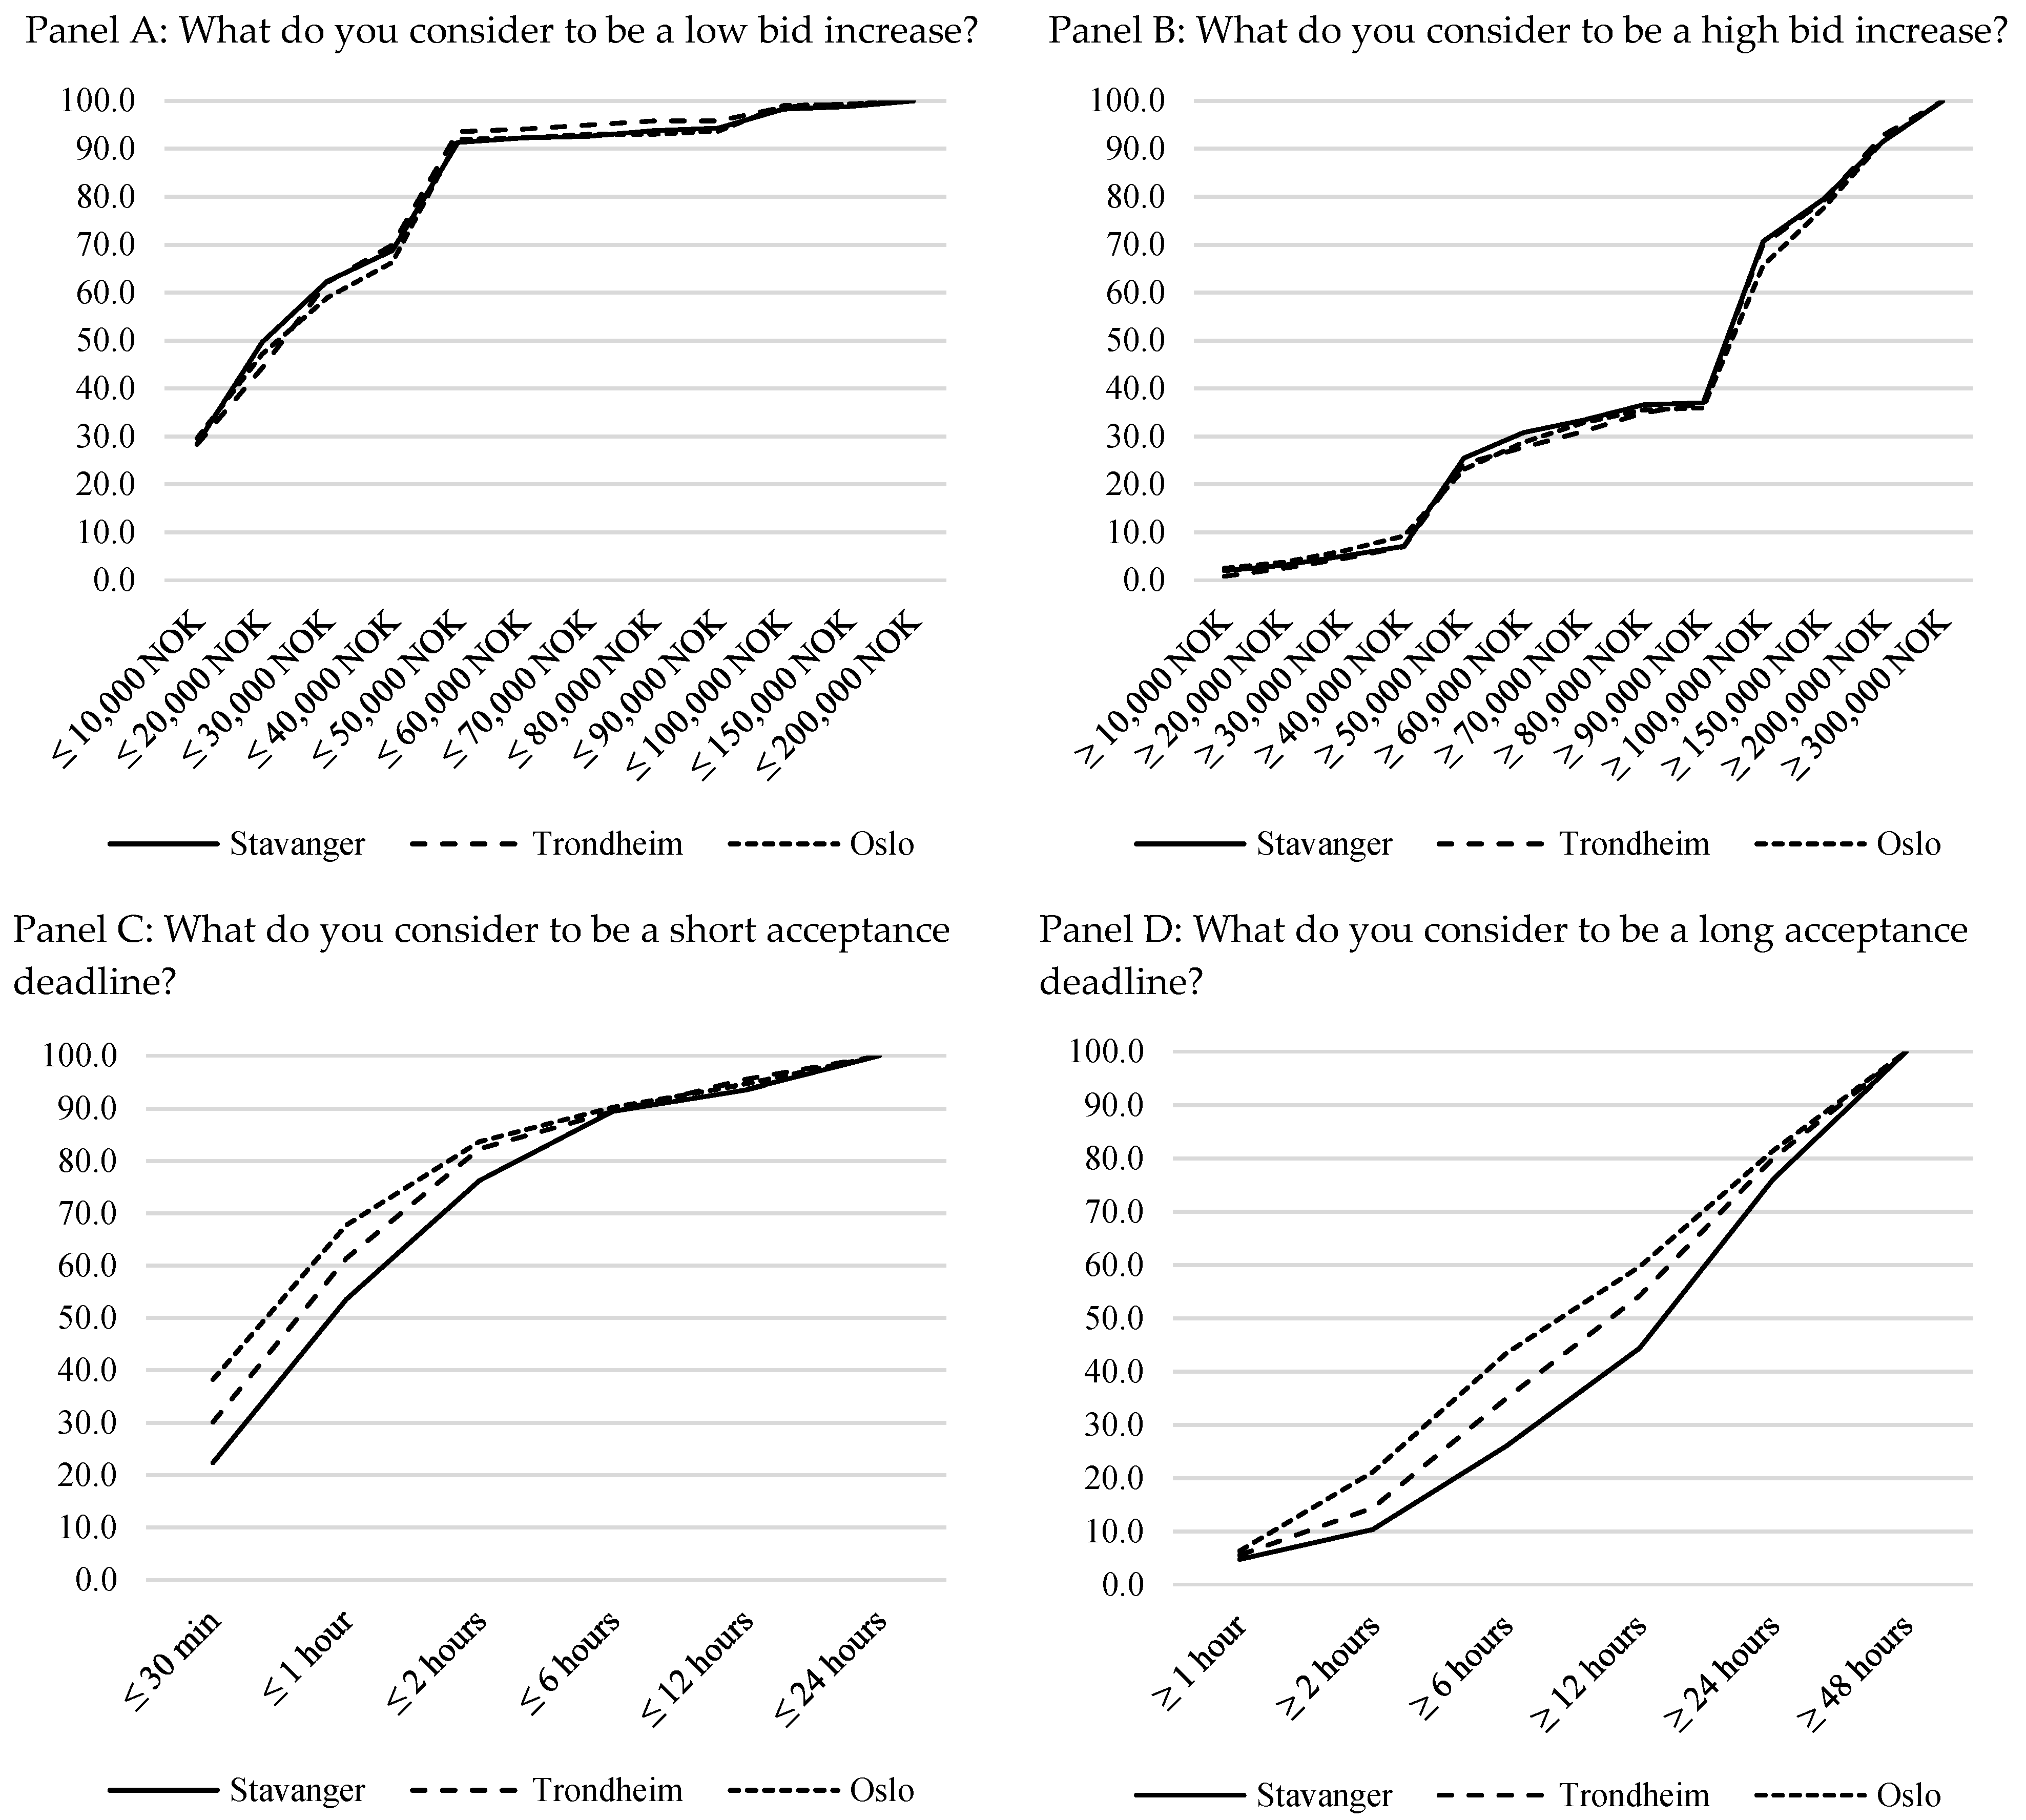
Among the strategic measures that the bidder can utilize, the size of a bid and the corresponding acceptance deadline are the most notable. In four questions, the respondents were asked what they considered to be high and low bid increases, and what they considered to be long and short acceptance deadlines. As shown in Panels A and B in Figure 2, there is strong agreement across cities regarding the perception of bid increases. Although there is greater variation in the answers concerning acceptance deadlines (Panels C and D), the overall trend is similar. It is thus reasonable to believe that potential buyers consider the same strategic means for bidding to win auctions at low prices, regardless of location. Consequently, we argue that any differences in bidding behavior may largely be attributed to the prevailing market regime.
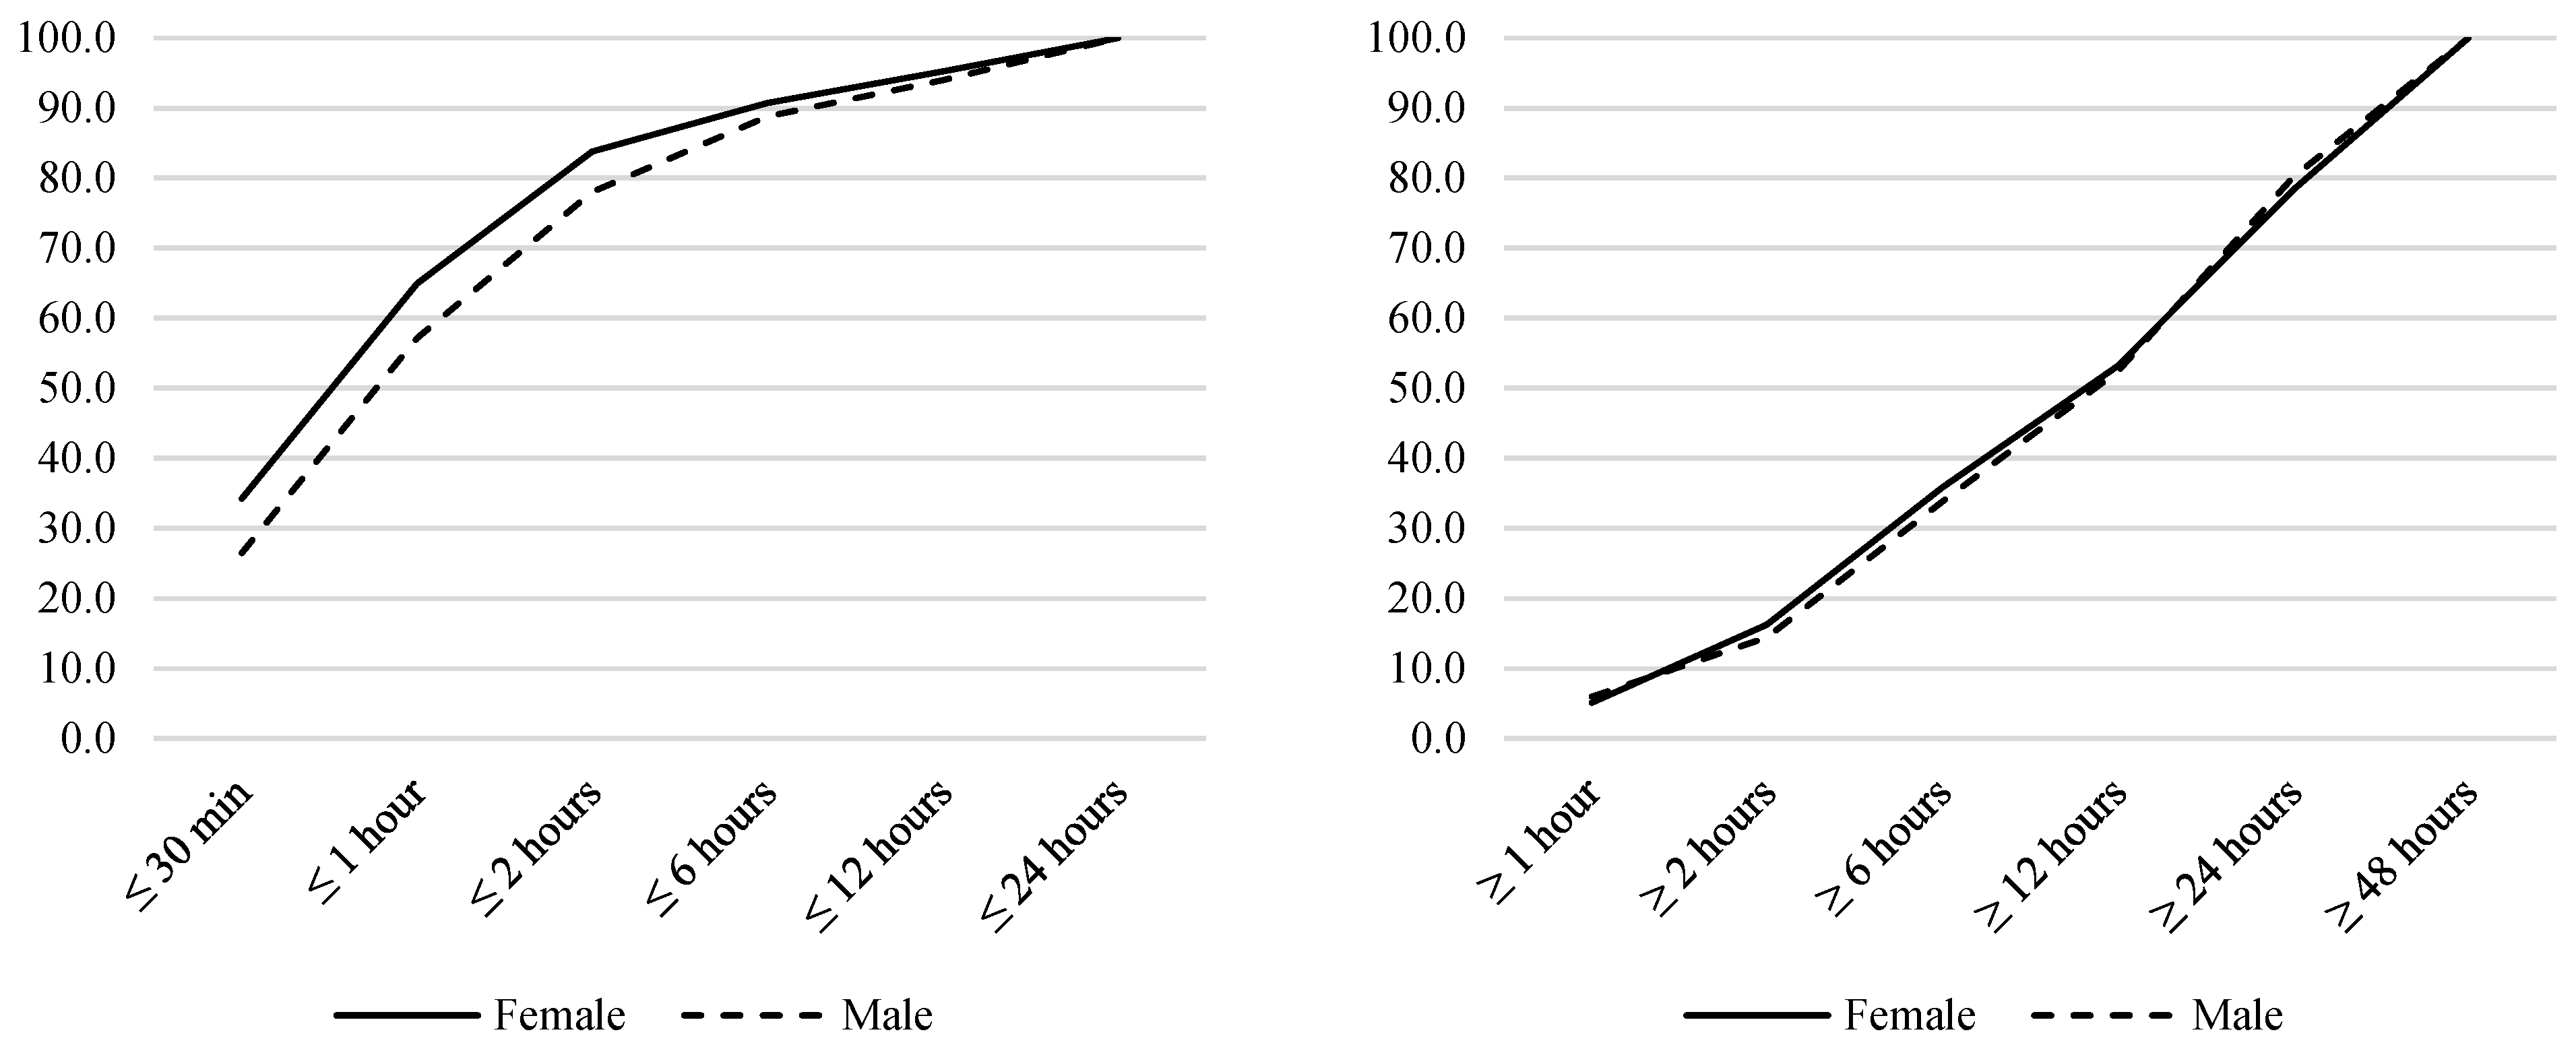
In Figure A1 in Appendix A, we have shown gender differences.
4.1. Maximum Price Limits
In total, 1283 of the 1803 respondents stated that they had previously participated in an auction for buying a home. These respondents were asked to bear their latest bidding experience in mind when answering the questions regarding predetermined maximum price limits imposed by themselves or their bank; these are presented in Table A2 in the Appendix. The four logit estimations of Equation (1) are presented in Table 1. In addition, we singled out recent participants, i.e., bidders with housing auction experience in the two last years, to focus on the behavior of people who were actively involved in the process that determines home prices.
Table 1 column (a) shows the logit estimation for whether the bidders chose a predetermined price limit for the last home on which they bid. When comparing recent and former bidders, it appears that recent bidders were more likely to have decided on a maximum price limit. We also find evidence that recent as well as former bidders from Oslo were significantly less likely to set a price limit compared with bidders from Stavanger and Trondheim. Among the bidders who set a maximum price, Table 1 column (b) shows that there were no significant between-city differences in relation to the likelihood of exceeding this limit.
There appear to be no between-city differences regarding whether the bank imposed a maximum price limit, as shown in Table 1 column (c). However, the results indicate that, overall, the banks have become more restrictive in the last two years. Among the bidders who had a price limit imposed upon them, Table 1 column (d) shows that recent bidders were significantly more likely to exceed this limit than were former bidders. Comparing the cities based on the former bidders, there seems to be a higher likelihood of bidders exceeding the bank-set price limit in Oslo. Interestingly, however, among recent bidders the likelihood of bidders surpassing the limit is significantly lower in Oslo.
4.2. Experiment
Table 2 presents the estimation results of Equation (2). We observe that respondents from both Trondheim and Oslo placed higher opening bids than did respondents from Stavanger, with a 1.7 percent and 2.1 percent increase, respectively. However, there is no significant difference between Trondheim and Oslo. When controlling for the number of potential bidders, the city coefficients remain stable, whereas increasing the competition yields a 1.0 percent higher opening bid. Nevertheless, all opening bids were below the list price, on average. Note that the R2 is low.
4.3. Statements
To test whether the inclination to act aggressively in an auction differed between the three cities, we construct two indexes for aggressive bidding behavior based on the statement results presented in Table A3 and Table A4 in the Appendix A. Outlined by Equation (3), the index Bid aggression is the aggregate of claims 1, 2 and 3, whereas Time aggression is the aggregate of claims 4, 5 and 6. The indexes measure the propensity to use aggressiveness as a strategic action to obtain the dwelling at the lowest possible price. Bid aggression concerns the use of high opening bids and bid increases, whereas Time aggression concerns the use of early entry, short acceptance deadlines and short response times. Based on the results presented in Table A5 in the Appendix A, the index Reliance upon agent is the aggregate of claims 7 and 8, and it measures the respondents’ belief in real estate agents’ bidding advice and their ability to set the correct price. The results are presented in Table 3.
Although we did not find any significant between-city differences regarding time aggression, the results indicate that respondents from Trondheim and Oslo had a stronger inclination toward bid aggression compared to Stavanger, with a 4.9 percent and 6.8 percent increase on the index, significant at the 10 percent and 1 percent levels, respectively. However, there was no significant difference between Trondheim and Oslo. Furthermore, we find that respondents from Oslo have a significantly weaker inclination to rely upon real estate agents compared with Stavanger and Trondheim, with a 9.7 percent decrease on the index.
5. Conclusions
In this paper, we investigate whether different market regimes affect household bidding behavior in auctions for used dwellings. We conducted a survey with 1803 respondents in three of Norway’s largest cities, Oslo, Stavanger and Trondheim. We take advantage of the special circumstances in the Norwegian housing market in 2015 and 2016. During this period, the real estate market in Trondheim was relatively stable, whereas Oslo and Stavanger were subject to distinct boom and bust markets, respectively. The market regulations, traditions, interest rates and tax rates are uniform across Norway, and the practice of real estate agents is believed to be homogeneous across the three cities. Moreover, we find that respondents have similar perceptions regarding strategic bidding measures, such as bid size and time factors, regardless of which market regime is prevailing.
Households in booming housing markets appear to believe that it is advisable to adopt a more aggressive bidding strategy, compared with households in areas with falling house prices, to obtain a dwelling at the lowest possible price. The evidence suggesting that bidders in booming markets are less likely to decide on a maximum price limit before the auction commences substantiates this finding. In addition, we find that bidders in booming markets have a weaker reliance upon real estate agents. This is in line with the idea that animal spirits can affect rational behavior. In booming markets, trust is surging, reinforcing “stories” are told, and confidence is high, which leads to spontaneous action and uncritical decisions that are less characterized by rational behavior.
Author Contributions
O.J.S. is the main author and has done most of the analysis and writing. A.O. have performed the descriptive analysis and written some of the paragraphs. In addition, J.O.O. and A.O. have both contributed to outlining and executing the survey, as well as discussions about the idea and analysis.
Conflicts of Interest
The authors declare no conflicts of interest.
Appendix A

Table A1.
Socioeconomic descriptive statistics.
| Variables | Stavanger | Trondheim | Oslo | Total |
|---|---|---|---|---|
| Gender: | ||||
| Male | 59.1% | 49.7% | 45.2% | 51.3% |
| Female | 40.9% | 50.3% | 54.8% | 48.7% |
| Age: | ||||
| 18–29 | 16.8% | 23.7% | 14.8% | 18.4% |
| 30–39 | 13.5% | 11.8% | 18.6% | 14.6% |
| 40–49 | 16.5% | 16.3% | 22.6% | 18.5% |
| 50–59 | 19.0% | 22.2% | 19.4% | 20.2% |
| 60–69 | 22.5% | 17.0% | 18.1% | 19.2% |
| 70–99 | 11.8% | 9.0% | 6.5% | 9.1% |
| Education: | ||||
| No completed education | 0.2% | 0.0% | 0.0% | 0.1% |
| Primary school | 4.0% | 2.8% | 1.8% | 2.9% |
| High school | 31.6% | 29.8% | 19.6% | 27.0% |
| University/college (up to 4 years) | 37.8% | 37.5% | 43.7% | 39.7% |
| University/college (more than 4 years) | 26.5% | 29.8% | 34.9% | 30.4% |
| Employment: | ||||
| Employed | 58.6% | 58.7% | 69.3% | 62.2% |
| Unemployed | 5.2% | 1.2% | 2.0% | 2.8% |
| Incapacitated | 3.0% | 4.3% | 4.7% | 4.0% |
| Student | 7.5% | 17.8% | 7.0% | 10.8% |
| Retired | 23.3% | 15.5% | 13.3% | 17.4% |
| Other | 2.5% | 2.5% | 3.8% | 2.9% |
| Income (NOK): | ||||
| 0–199,000 | 9.0% | 16.7% | 7.3% | 11.0% |
| 200,000–399,000 | 14.5% | 19.2% | 14.1% | 15.9% |
| 400,000–599,000 | 29.5% | 29.2% | 35.5% | 31.4% |
| 600,000–799,000 | 15.8% | 12.5% | 15.4% | 14.6% |
| 800,000–999,000 | 6.8% | 5.0% | 5.8% | 5.9% |
| 1,000,000 or more | 8.0% | 2.5% | 5.0% | 5.2% |
| I decline to say | 14.0% | 12.8% | 15.0% | 13.9% |
| I do not know | 2.5% | 2.2% | 1.8% | 2.2% |
| Number of observations | 601 | 600 | 602 | 1803 |
Table A2.
Maximum price among all former bidders.
| Questions | Stavanger | Trondheim | Oslo |
|---|---|---|---|
| Did you decide on a maximum price before the bidding started? | |||
| Yes | 83.5% | 81.9% | 78.1% |
| No | 11.2% | 13.7% | 15.5% |
| I do not remember | 5.3% | 4.4% | 6.4% |
| Did you bid more than your own maximum price? | |||
| Yes | 11.2% | 8.8% | 11.2% |
| No | 77.5% | 79.7% | 73.5% |
| I did not have a maximum price | 5.7% | 7.4% | 10.5% |
| I do not remember | 5.5% | 4.2% | 4.8% |
| Did you bid more than the maximum price set by your bank? | |||
| Yes | 4.1% | 1.0% | 3.9% |
| No | 69.0% | 69.9% | 66.7% |
| The bank did not set a maximum price | 22.5% | 26.0% | 25.2% |
| I do not remember | 4.6% | 3.2% | 4.2% |
| Number of observations | 418 | 408 | 457 |
Note: The table shows the answers of households in Stavanger, Trondheim and Oslo that had bid on a dwelling.
Table A3.
Answers to claims regarding bid aggression among all respondents.
| Claims | Strongly Agree | Agree | Somewhat Agree | Neither Agree Nor Disagree | Somewhat Disagree | Disagree | Strongly Disagree | Do Not Know |
|---|---|---|---|---|---|---|---|---|
| Claim 1: To obtain a dwelling at the lowest possible price, it is generally advisable to start with a high opening bid. | ||||||||
| Stavanger | 1.5% | 7.2% | 11.3% | 22.5% | 15.5% | 23.3% | 9.2% | 9.7% |
| Trondheim | 2.5% | 6.5% | 17.2% | 21.5% | 16.8% | 17.7% | 5.0% | 12.8% |
| Oslo | 3.0% | 7.5% | 12.5% | 26.1% | 16.8% | 14.6% | 5.8% | 13.8% |
| Claim 2: To obtain a dwelling at the lowest possible price, it is generally advisable to make low bid increases in the auction. | ||||||||
| Stavanger | 5.0% | 14.8% | 22.6% | 21.1% | 16.0% | 9.5% | 1.5% | 9.5% |
| Trondheim | 3.0% | 14.7% | 22.0% | 23.0% | 16.8% | 8.5% | 1.3% | 10.7% |
| Oslo | 3.3% | 11.8% | 16.8% | 23.3% | 17.6% | 12.0% | 2.7% | 12.6% |
| Claim 3: To obtain a dwelling at the lowest possible price, it is generally advisable to make high bid increases in the auction. | ||||||||
| Stavanger | 1.7% | 7.7% | 16.0% | 24.1% | 17.8% | 17.1% | 5.7% | 10.0% |
| Trondheim | 1.2% | 7.5% | 18.3% | 24.7% | 16.8% | 16.2% | 3.7% | 11.7% |
| Oslo | 1.7% | 6.5% | 20.1% | 22.9% | 15.4% | 14.6% | 4.8% | 14.0% |
Note: The table shows the answers from households in Stavanger, Trondheim and Oslo. The number of observations is 601, 600 and 602 for Stavanger, Trondheim and Oslo, respectively.
Table A4.
Answers to claims regarding time aggression among all respondents.
| Claims | Strongly Agree | Agree | Somewhat Agree | Neither Agree Nor Disagree | Somewhat Disagree | Disagree | Strongly Disagree | Do Not Know |
|---|---|---|---|---|---|---|---|---|
| Claim 4: To obtain a dwelling at the lowest possible price, it is generally advisable to enter the auction with an opening bid as early as possible. | ||||||||
| Stavanger | 2.5% | 11.8% | 14.6% | 25.5% | 12.3% | 18.6% | 5.0% | 9.7% |
| Trondheim | 3.7% | 10.5% | 14.5% | 23.5% | 14.8% | 15.7% | 3.0% | 14.3% |
| Oslo | 3.3% | 11.0% | 12.0% | 24.9% | 12.8% | 14.3% | 5.5% | 16.3% |
| Claim 5: To obtain a dwelling at the lowest possible price, it is generally advisable to submit bids with short acceptance deadlines. | ||||||||
| Stavanger | 10.3% | 30.3% | 31.3% | 14.3% | 4.7% | 1.7% | 0.3% | 7.2% |
| Trondheim | 7.3% | 29.7% | 29.8% | 12.2% | 6.3% | 3.2% | 1.0% | 10.5% |
| Oslo | 9.1% | 24.6% | 26.7% | 15.3% | 6.1% | 4.5% | 0.8% | 12.8% |
| Claim 6: To obtain a dwelling at the lowest possible price, it is generally advisable to respond quickly to others’ bids. | ||||||||
| Stavanger | 8.2% | 26.6% | 23.3% | 13.6% | 9.5% | 7.3% | 2.3% | 9.2% |
| Trondheim | 6.2% | 27.5% | 23.8% | 14.0% | 10.3% | 6.8% | 1.3% | 10.0% |
| Oslo | 8.0% | 23.1% | 19.6% | 20.4% | 11.1% | 6.6% | 0.8% | 10.3% |
Note: The table shows the answers from households in Stavanger, Trondheim and Oslo. The number of observations is 601, 600 and 602 for Stavanger, Trondheim and Oslo, respectively.
Table A5.
Answers to claims regarding reliance upon real estate agents among all respondents.
| Claims | Strongly Agree | Agree | Somewhat Agree | Neither Agree Nor Disagree | Somewhat Disagree | Disagree | Strongly Disagree | Do Not Know |
|---|---|---|---|---|---|---|---|---|
| Claim 7: It is wise to follow real estate agents’ advice concerning bidding. | ||||||||
| Stavanger | 3.7% | 17.1% | 23.8% | 21.8% | 11.5% | 7.3% | 6.5% | 8.3% |
| Trondheim | 4.8% | 16.8% | 28.7% | 18.7% | 9.7% | 7.3% | 5.0% | 9.0% |
| Oslo | 3.7% | 15.6% | 20.9% | 21.6% | 12.1% | 9.1% | 5.8% | 11.1% |
| Claim 8: I have faith that the list price will be set equal to the real estate agents’ expected selling price. | ||||||||
| Stavanger | 1.5% | 16.6% | 21.6% | 18.0% | 18.8% | 13.1% | 4.5% | 5.8% |
| Trondheim | 1.7% | 12.7% | 21.7% | 19.2% | 20.7% | 12.5% | 5.8% | 5.8% |
| Oslo | 2.5% | 8.3% | 12.0% | 17.4% | 22.9% | 18.4% | 11.3% | 7.1% |
Note: The table shows the answers from households in Stavanger, Trondheim and Oslo. The number of observations is 601, 600 and 602 for Stavanger, Trondheim and Oslo, respectively.
Figure A1.
Answers to questions regarding bid increases and acceptance deadlines. Cumulative percentages. Note: For each question, responses to the option ‘other’ are treated as missing values. Number of observations: Panel A: Female 868 and male 914; Panel B: Female 866 and male 911; Panel C: Female 821 and male 899; and Panel D: Female 824 and male 890.


References
- Akerlof, George A., and Robert J. Shiller. 2010. Animal Spirits: How Human Psychology Drives the Economy, and Why It Matters for Global Capitalism. Princeton: Princeton University Press. [Google Scholar]
- Avery, Christopher. 1998. Strategic jump bidding in English auctions. The Review of Economic Studies 65: 185–210. [Google Scholar] [CrossRef]
- Case, Karl E., Robert J. Shiller, and Anne Thompson. 2012. What Have They Been Thinking? Home Buyer Behavior in Hot and Cold Markets. Cambridge: National Bureau of Economic Research. [Google Scholar]
- Daniel, Kent D., and David A. Hirshleifer. 1998. A Theory of Costly Sequential Bidding. University of Michigan Business School Working Paper. Ann Arbor: University of Michigan Business School. [Google Scholar]
- Fishman, Michael J. 1988. A theory of preemptive takeover bidding. The Rand Journal of Economics 19: 88–101. [Google Scholar] [CrossRef]
- Grether, David, David Porter, and Matthew Shum. 2011. Intimidation or Impatience? Jump Bidding in On-line Ascending Automobile Auctions. ESI Working paper. Available online: https://digitalcommons.chapman.edu/cgi/viewcontent.cgi?article=1100&context=esi_working_papers (accessed on 16 May 2018).
- Hungria-Gunnelin, Rosane. 2013. Impact of number of bidders on sale price of auctioned condominium apartments in Stockholm. International Real Estate Review 16: 274–95. [Google Scholar]
- Hungria-Gunnelin, Rosane. 2015. Auction Strategies: Do They Really Work? An Empirical Study of Real Estate Auctions. Working paper. Stockholm: Royal Institute of Technology. [Google Scholar]
- Industry Norm. 2014. Bransjenorm for Markedsføring av Bolig. Available online: https://forbrukerombudet.no/content/2014/08/bransjenorm-for-markedsf%C3%B8ring-av-bolig.pdf (accessed on 13 November 2017).
- Isaac, R. Mark, Timothy C. Salmon, and Arthur Zillante. 2005. An experimental test of alternative models of bidding in ascending auctions. International Journal of Game Theory 33: 287–313. [Google Scholar] [CrossRef]
- Isaac, R. Mark, Timothy C. Salmon, and Arthur Zillante. 2007. A theory of jump bidding in ascending auctions. Journal of Economic Behavior and Organization 62: 144–64. [Google Scholar] [CrossRef]
- Keynes, John Maynard. 1936. The general theory of money, interest and employment. In The Collected Writings of John Maynard Keynes. Cambridge: Cambridge University Press, vol. 7. [Google Scholar]
- Marketing Act 2009. Lov om Kontroll med Markedsføring og Avtalevilkår mv. (markedsføringsloven). Available online: www.lovdata.no (accessed on 16 May 2018).
- Regulation on Real Estate 2007. Forskrift Om Eiendomsmegling. Available online: www.lovdata.no (accessed on 16 May 2018).
- Sønstebø, Ole Jakob. 2017. Bidding Round Survey Report. Working Paper. Trondheim: NTNU. [Google Scholar]
- Vickrey, William. 1961. Counterspeculation, auctions, and competitive sealed tenders. The Journal of Finance 16: 8–37. [Google Scholar] [CrossRef]
Figure 1.
House price growth in Oslo, Stavanger and Trondheim 2004–2016. Note: The figure shows the house price growth in Stavanger, Trondheim and Oslo for 2004–2016 in yearly percentages. Data source: Eiendomnorge.no.
Figure 1.
House price growth in Oslo, Stavanger and Trondheim 2004–2016. Note: The figure shows the house price growth in Stavanger, Trondheim and Oslo for 2004–2016 in yearly percentages. Data source: Eiendomnorge.no.

Figure 2.
Answers to questions regarding bid increases and acceptance deadlines. Cumulative percentages. Note: For each question, responses to the option ‘other’ are treated as missing values. Number of observations: Panel A: Stavanger 596, Trondheim 589 and Oslo 597; Panel B: Stavanger 597, Trondheim 593 and Oslo 587; Panel C: Stavanger 577, Trondheim 578 and Oslo 565; and Panel D: Stavanger 569, Trondheim 577 and Oslo 568.

Table 1.
Logit estimations regarding maximum price limits.
| Variables | Bidder Set Max Price (a) | Bid over Max Price (b) | Bank Set Max Price (c) | Bid over Bank’s Max Price (d) |
|---|---|---|---|---|
| Trondheim | −0.5499 | −0.2518 | −0.3090 | −1.1171 |
| (0.3408) | (0.3056) | (0.2120) | (1.1044) | |
| Oslo | −1.0130 *** | 0.0252 | −0.2617 | 1.1495 * |
| (0.3194) | (0.2911) | (0.2093) | (0.6190) | |
| Reference | Stavanger | Stavanger | Stavanger | Stavanger |
| Recent | 1.6482 * | 0.3310 | 0.9545 ** | 2.3466 *** |
| (0.9874) | (0.4219) | (0.4483) | (0.6294) | |
| Recent * Trondheim | −0.2920 | 0.1318 | −0.7937 | −0.7757 |
| (1.2177) | (0.5680) | (0.5406) | (1.3911) | |
| Recent * Oslo | −0.5250 | −0.3111 | −0.7006 | −2.1632 *** |
| (1.1166) | (0.5657) | (0.5468) | (0.8360) | |
| Constant | 3.1594 *** | −1.7032 ** | 1.4626 ** | −4.2538 *** |
| (1.1040) | (0.6904) | (0.7240) | (1.3145) | |
| Gender | Yes | Yes | Yes | Yes |
| Age | Yes | Yes | Yes | Yes |
| Education | Yes | Yes | Yes | Yes |
| Employment | Yes | Yes | Yes | Yes |
| Income | Yes | Yes | Yes | Yes |
| Pseudo R2 | 0.104 | 0.015 | 0.093 | 0.149 |
| Observations | 1051 | 963 | 1057 | 757 |
Note: Answers from respondents who opted not to state their income, or answered I do not remember to any of the questions, were treated as missing values. Robust standard errors are provided in parentheses. * p < 0.10, ** p < 0.05, *** p < 0.01.
Table 2.
Opening bid estimates from the experiment. Dependent variable: opening bid/list price.
| Variables | (a) | (b) |
|---|---|---|
| Trondheim | 0.0172 *** | 0.0175 *** |
| (0.0061) | (0.0061) | |
| Oslo | 0.0205 *** | 0.0206 *** |
| (0.0069) | (0.0069) | |
| Reference | Stavanger | Stavanger |
| Number of potential bidders | - | 0.0104 ** |
| (0.0052) | ||
| Constant | 0.9529 *** | 0.9485 *** |
| (0.0207) | (0.0212) | |
| Gender | Yes | Yes |
| Age | Yes | Yes |
| Education | Yes | Yes |
| Employment | Yes | Yes |
| Income | Yes | Yes |
| R2 | 0.043 | 0.048 |
| Observations | 849 | 849 |
Note: Answers from respondents who opted not to state their income were treated as missing values. Robust standard errors are provided in parentheses. * p < 0.10, ** p < 0.05, *** p < 0.01.
Table 3.
Index estimations. Dependent variable: natural logarithm of indexes.
| Bid Aggression | Time Aggression | Reliance Upon Agent | |
|---|---|---|---|
| Trondheim | 0.0494 * | 0.0058 | –0.0058 |
| (0.0256) | (0.0150) | (0.0242) | |
| Oslo | 0.0681 *** | –0.0112 | –0.0974 *** |
| (0.0256) | (0.0162) | (0.0258) | |
| Reference | Stavanger | Stavanger | Stavanger |
| Constant | 2.3989 *** | 2.5604 *** | 1.8946 *** |
| (0.0719) | (0.0600) | (0.0872) | |
| Gender | Yes | Yes | Yes |
| Age | Yes | Yes | Yes |
| Education | Yes | Yes | Yes |
| Employment | Yes | Yes | Yes |
| Income | Yes | Yes | Yes |
| R2 | 0.027 | 0.051 | 0.101 |
| Observations | 1268 | 1257 | 1343 |
Note: Answers from respondents who opted not to state their income, or answered I do not know to any of the claims, were treated as missing values. Robust standard errors are provided in parentheses. * p < 0.10, ** p < 0.05, *** p < 0.01.
© 2018 by the authors. Licensee MDPI, Basel, Switzerland. This article is an open access article distributed under the terms and conditions of the Creative Commons Attribution (CC BY) license (http://creativecommons.org/licenses/by/4.0/).
Share and Cite
MDPI and ACS Style
Olaussen, J.O.; Oust, A.; Sønstebø, O.J. Bidding Behavior in the Housing Market under Different Market Regimes. J. Risk Financial Manag. 2018, 11, 41. https://doi.org/10.3390/jrfm11030041
AMA Style
Olaussen JO, Oust A, Sønstebø OJ. Bidding Behavior in the Housing Market under Different Market Regimes. Journal of Risk and Financial Management. 2018; 11(3):41. https://doi.org/10.3390/jrfm11030041
Chicago/Turabian StyleOlaussen, Jon Olaf, Are Oust, and Ole Jakob Sønstebø. 2018. "Bidding Behavior in the Housing Market under Different Market Regimes" Journal of Risk and Financial Management 11, no. 3: 41. https://doi.org/10.3390/jrfm11030041