2.1. Simulation of oil recovery: temperature effect
In this section, the effect of temperature on oil recovery is modeled using the Eclipse 100 simulator software, where except for the injected water temperature, the input model characteristics such as PVT, relative and absolute permeability data are kept constant for simulation runs. The thermal option is activated following the recommendations in reference [
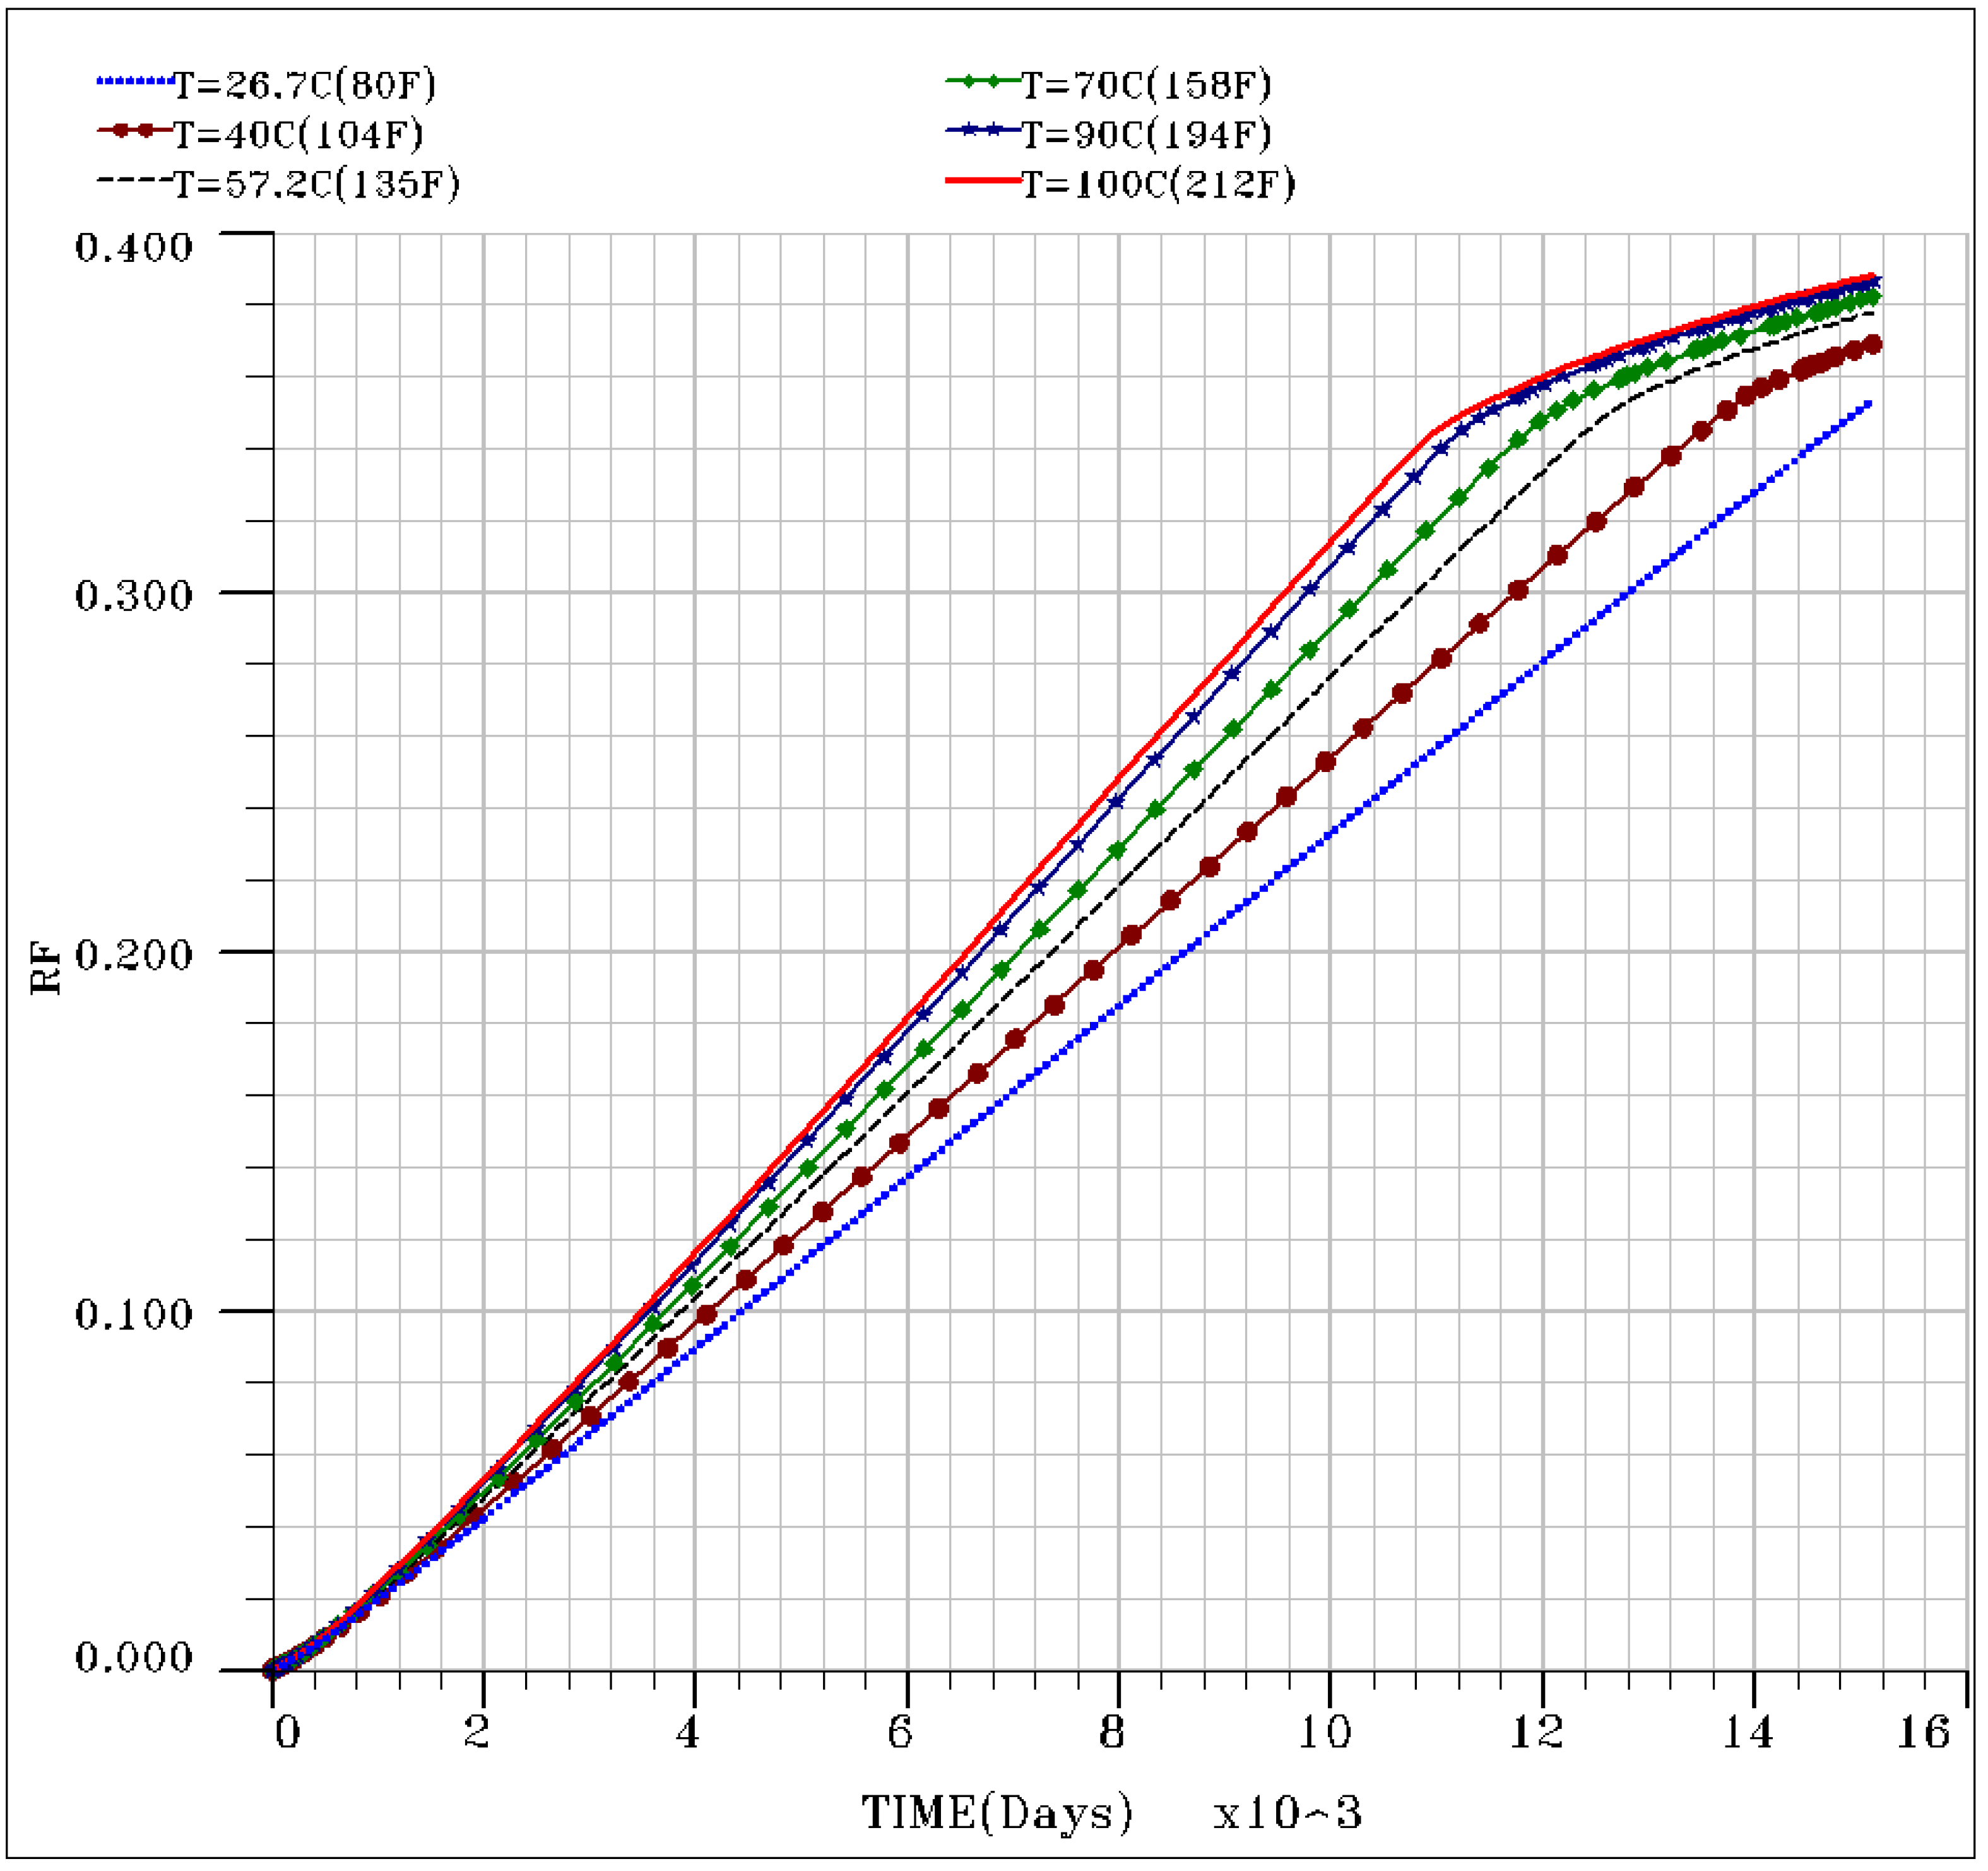
17]. Water at 6 different temperatures: 26.7°C (80°F), 40°C (104°F), 57.2°C (135°F), 70°C (158°F), 90°C (194°F) and 100°C (212°F) are injected into the reservoir with an initial temperature of 57.2°C (135°F).
Experimental oil/water relative permeabilities at room temperature (23°C) are used in order to isolate the effect of the temperature alone on oil recovery. As shown in
Figure 1, the ultimate oil recovery factor (RF) increases to about 12.5% from ~0.35 to ~0.4, as injecting water temperature increased from 26.7°C (80°F) to 100°C (212°F). The increase of the oil recovery may be due to the increase of the oil mobility and fluid expansion. Oil recovery by spontaneous imbibition shows an increasing trend with temperature (Tang and Morrow [
5,
6], Schembre
et al. [
8], Hamouda and Rezaei Gomari [
9], and Karoussi and Hamouda [
14]). Wettability alteration is not a direct option in Eclipse simulator; Delshad
et al. [
18] adapted a chemical flooding simulator to include wettability alteration process. Relative permeability data for 4 temperatures are used here as indirect indication of wettability alteration in the later runs.
Figure 1.
Simulated oil recovery factor (RF) of injecting water at different temperature from 26.7°C (80°F) to 100°C (212°F). Room temperature relative permeability data are used in this case. Reservoir Temperature is taken to be 57.2°C (135°F). The higher the temperature of the injected water, the higher recovery factor is.
2.2. Oil recovery sensitivity to different temperature relative permeability data
In previous work [
16] Hamouda
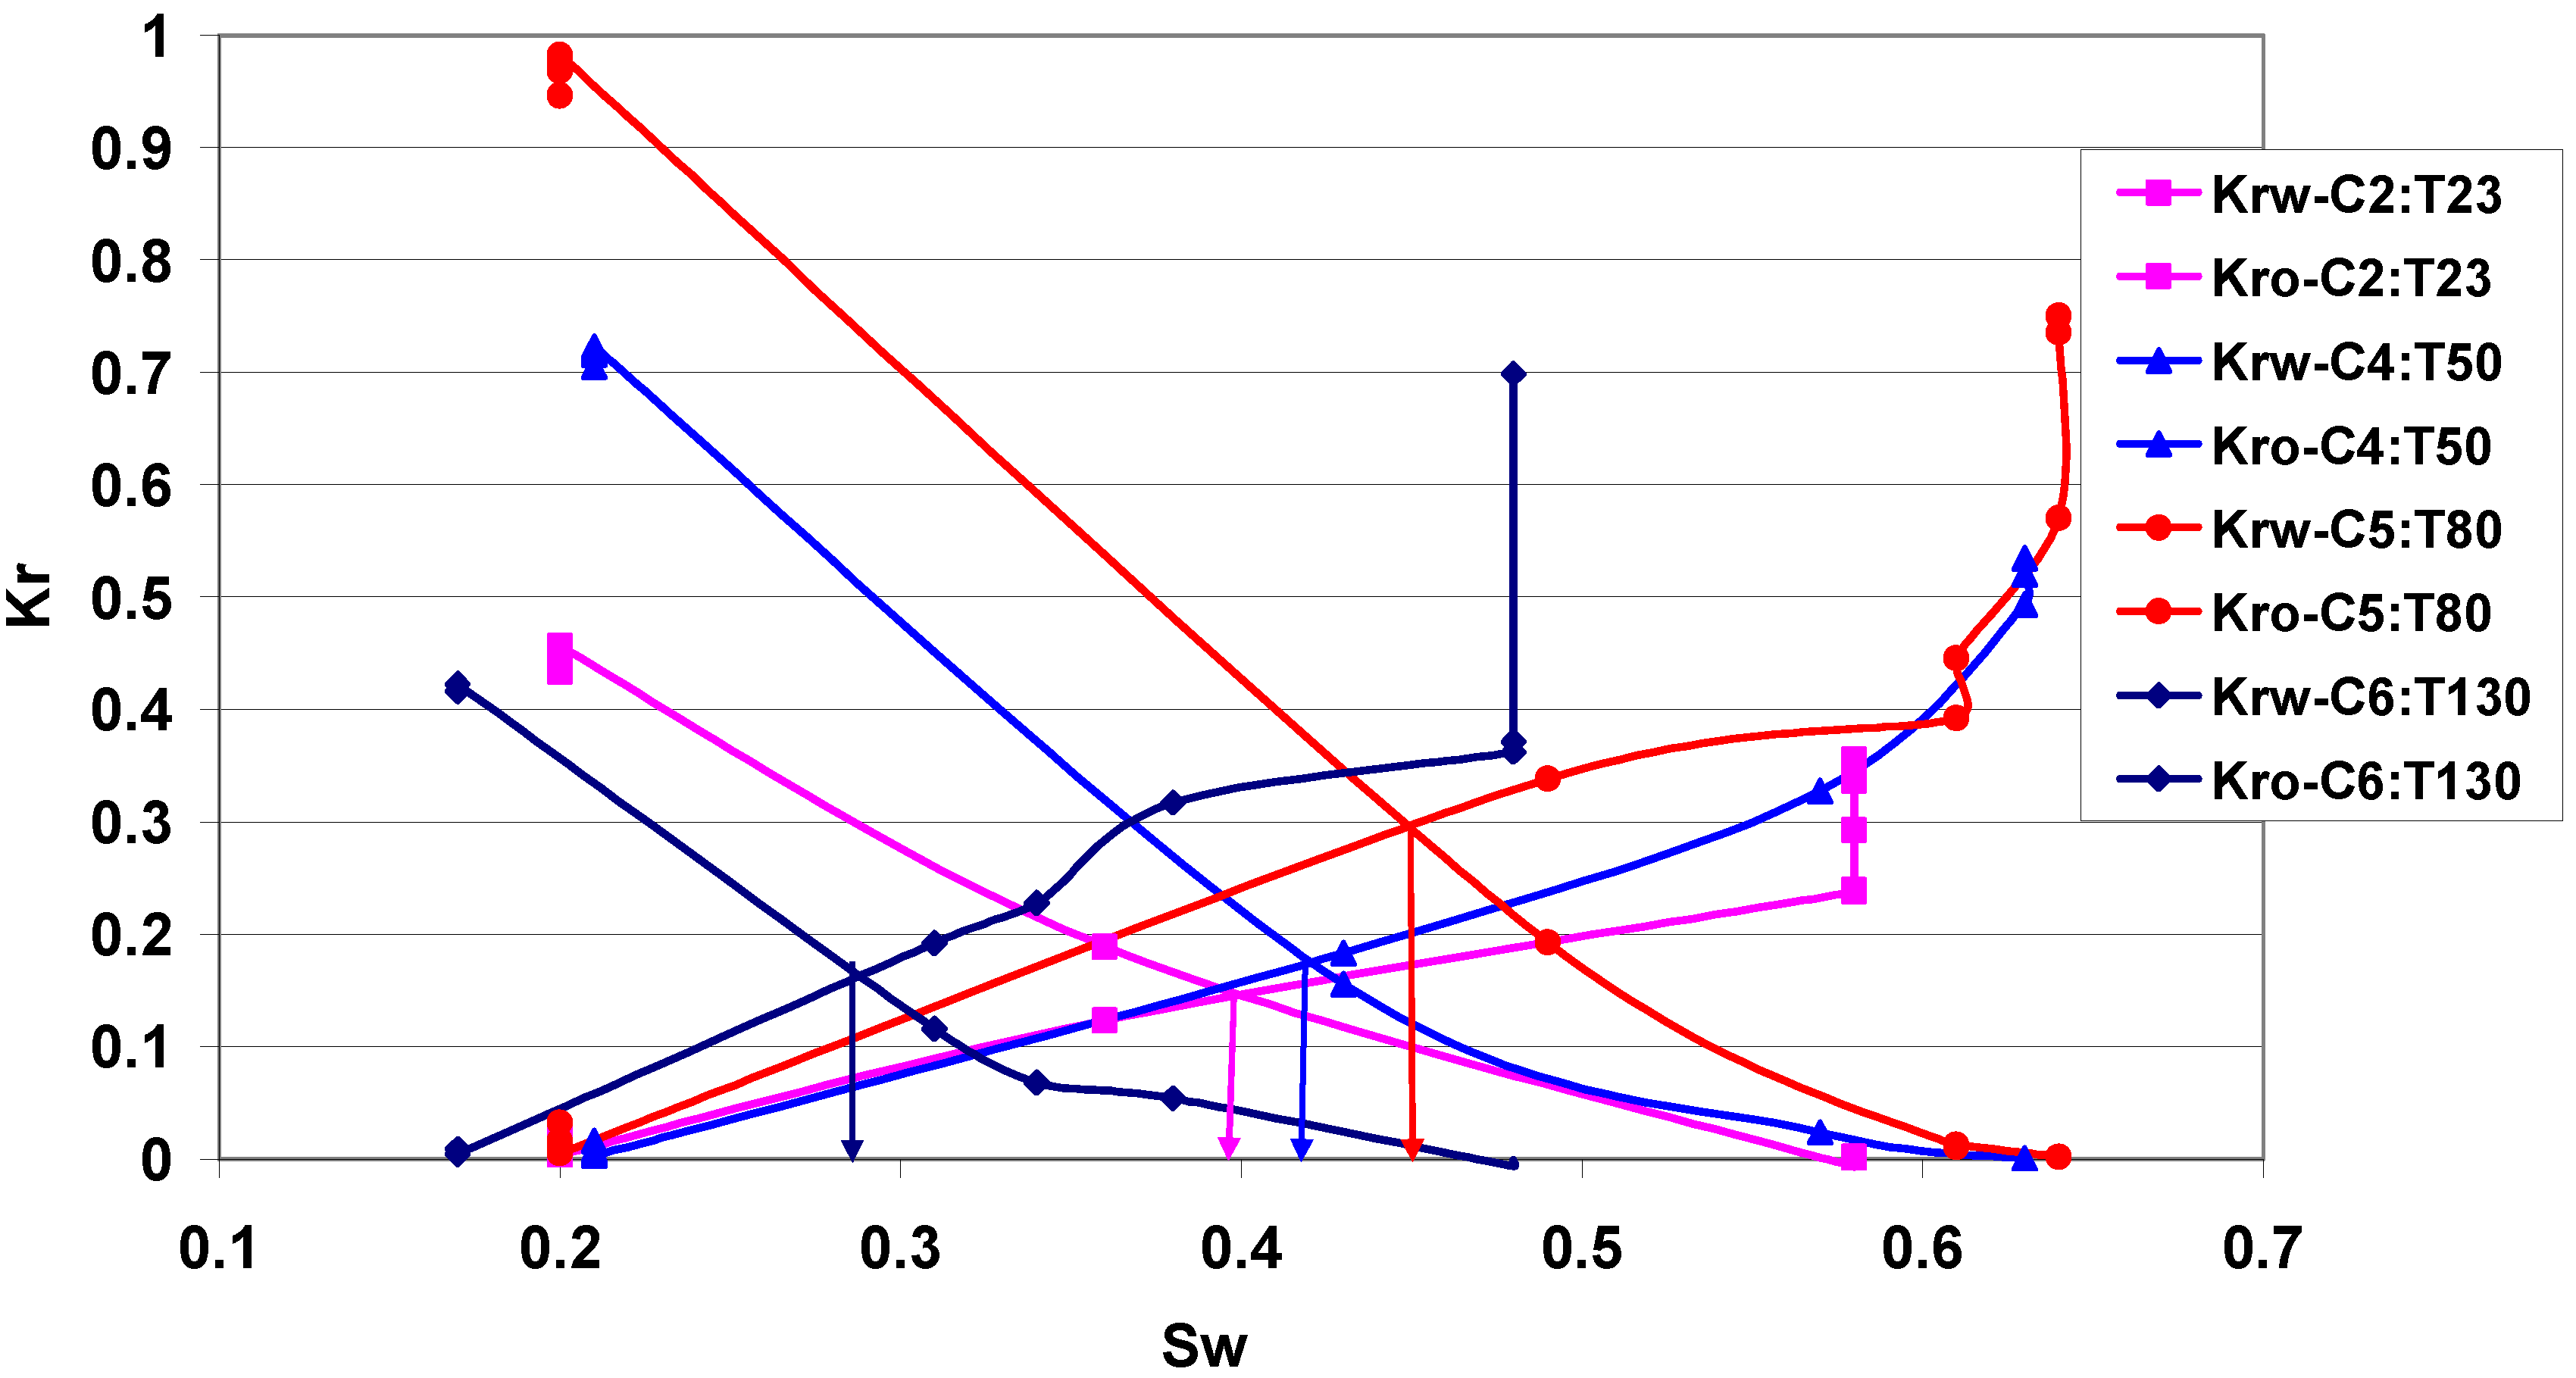
et al. showed that the intersection of oil/water relative permeability of modified chalk is shifted toward the right side, indicating more water-wet behavior as the temperature increases up to 80°C. The relative permeability data are presented in
Figure 2. Experimental data at high temperature of 130°C shows a shift of oil and water relative permeabilities intersect toward left (indicating more oil-wet behavior).
In order to investigate the effect of relative permeabilities at elevated temperatures on oil recovery, relative permeability data for four different temperatures (23, 50, 80 and 130°C as shown in
Figure 2) are input into the reservoir simulator while oil/water PVT properties, water injection rate under constant bottom hole pressure, reservoir model geometry, production time are kept constant.
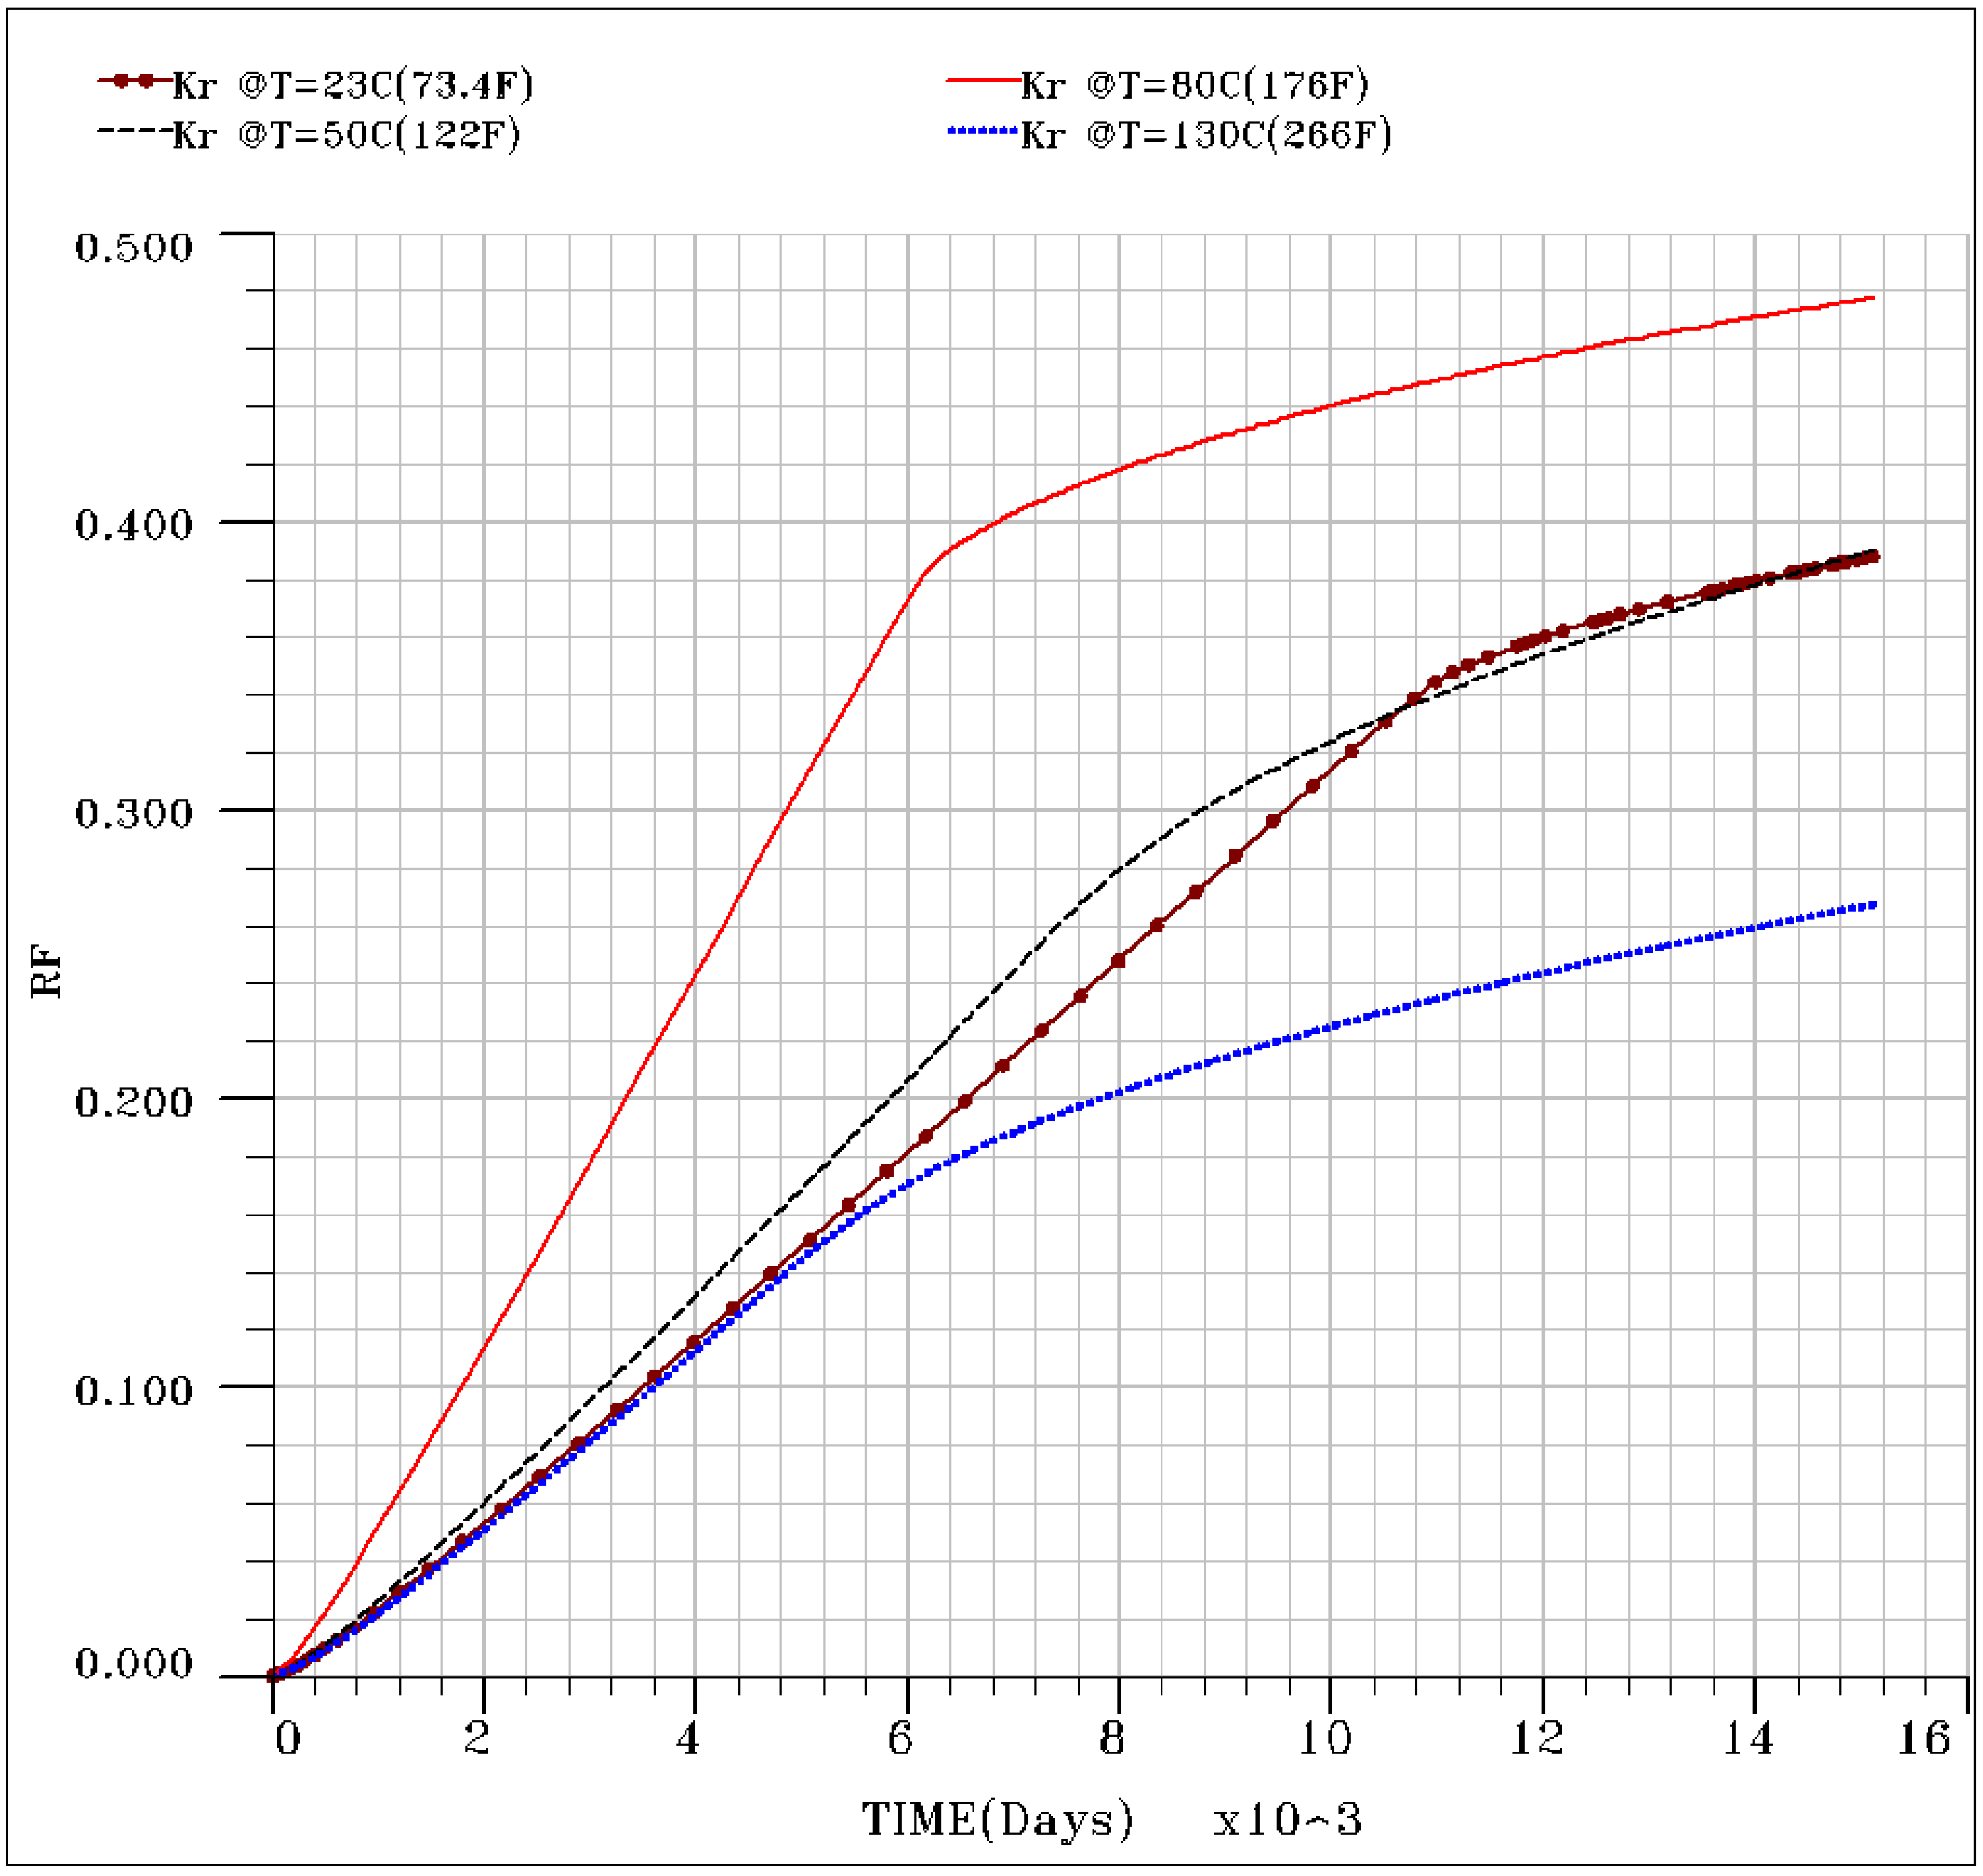
Figure 3 shows a higher oil recovery of about 48% and the lowest one of about 26%, corresponding to relative permeability data at the temperatures of 80 and 130°C, respectively.
Figure 2.
Effect of temperature on relative permeability for oil-wet chalk cores with 0.005MSA dissolved in decane. (From Hamouda
et al. [
16]).
Figure 2.
Effect of temperature on relative permeability for oil-wet chalk cores with 0.005MSA dissolved in decane. (From Hamouda
et al. [
16]).
Three main observations may be deduced from
Figure 3. A maximum recovery of 48% is obtained, when 80°C relative permeability data is used, while the lowest recovery is obtained, when relative permeability data is used at 130°C. So, the recovery increased when the temperature reached 80°C and then declined at 130°C. There are no surprises from the simulated data, since the results reflect the obtained experimental relative permeability data. In quantitative sense of oil recovery, an increase of S
w (at the intersect between k
ro and k
rw) by 7% (from 23 to 50°C) and by 16% (from 50 to 80°C) corresponds to an increase of ultimate oil recovery and about 25%, respectively. A reduction of recovery of about 22% is obtained when the temperature was raised from 80 to 130°C. This corresponds to a reduction of S
w to 20%. The small difference in the recovery rates and ultimate RF level obtained for relative permeability data of 23 and 50°C may be due to that the simulated reservoir temperature is at about 57.2°C (135
oF), hence the oil mobilities for 23 and 50
oC cases become close as the injection proceeds.
The second observation is that at higher temperature (80°C), in this work, faster and higher oil recovery is obtained, which may reflect both oil mobility and wettability alteration by temperature, as indicated by intersection between k
ro and k
rw, that increased from about 7 to 16%, when temperatures increased from 23 to 50°C and from 50 to 80°C, respectively as shown in
Figure 2.
The third observation is that, the point of time at which the recovery rate is reduced is reached faster at higher temperatures than that at lower temperatures. It is interesting to observe (
Figure 3) that both 80 and 130°C have reached that point at almost the same time, in spite of the lower rate and recovery in case of 130°C.
In general from this work and the work done by Nakornthap and Evans [
19], it may be concluded that use of room temperature relative permeability underestimates the oil recovery rate and ultimate recovery. It may, also, be concluded that not only the injected fluid temperature that affect the recovery rate and ultimate recovered oil but also temperature difference between the injected fluid and the reservoir temperature. The above simulation and discussion does not address the wettability change to more oil-wet, hence reduced oil recovery at 130°C.
Figure 3.
Simulated oil recovery factor as a function of relative permeability at 23, 50, 80 and 130oC.
Figure 3.
Simulated oil recovery factor as a function of relative permeability at 23, 50, 80 and 130oC.
In order to approximate the relative permeability as a function of temperature, Nakornthap and Evans’ equations [
19] (i.e. equations 3 and 4) are used. It must be stated here that it is assumed that fluids are incompressible; the changes in porosity and rock bulk volume are independent on temperature.
where, λ is pore size distribution index. The corresponding irreducible water saturation (S
wir) and λ values at each temperature are given in
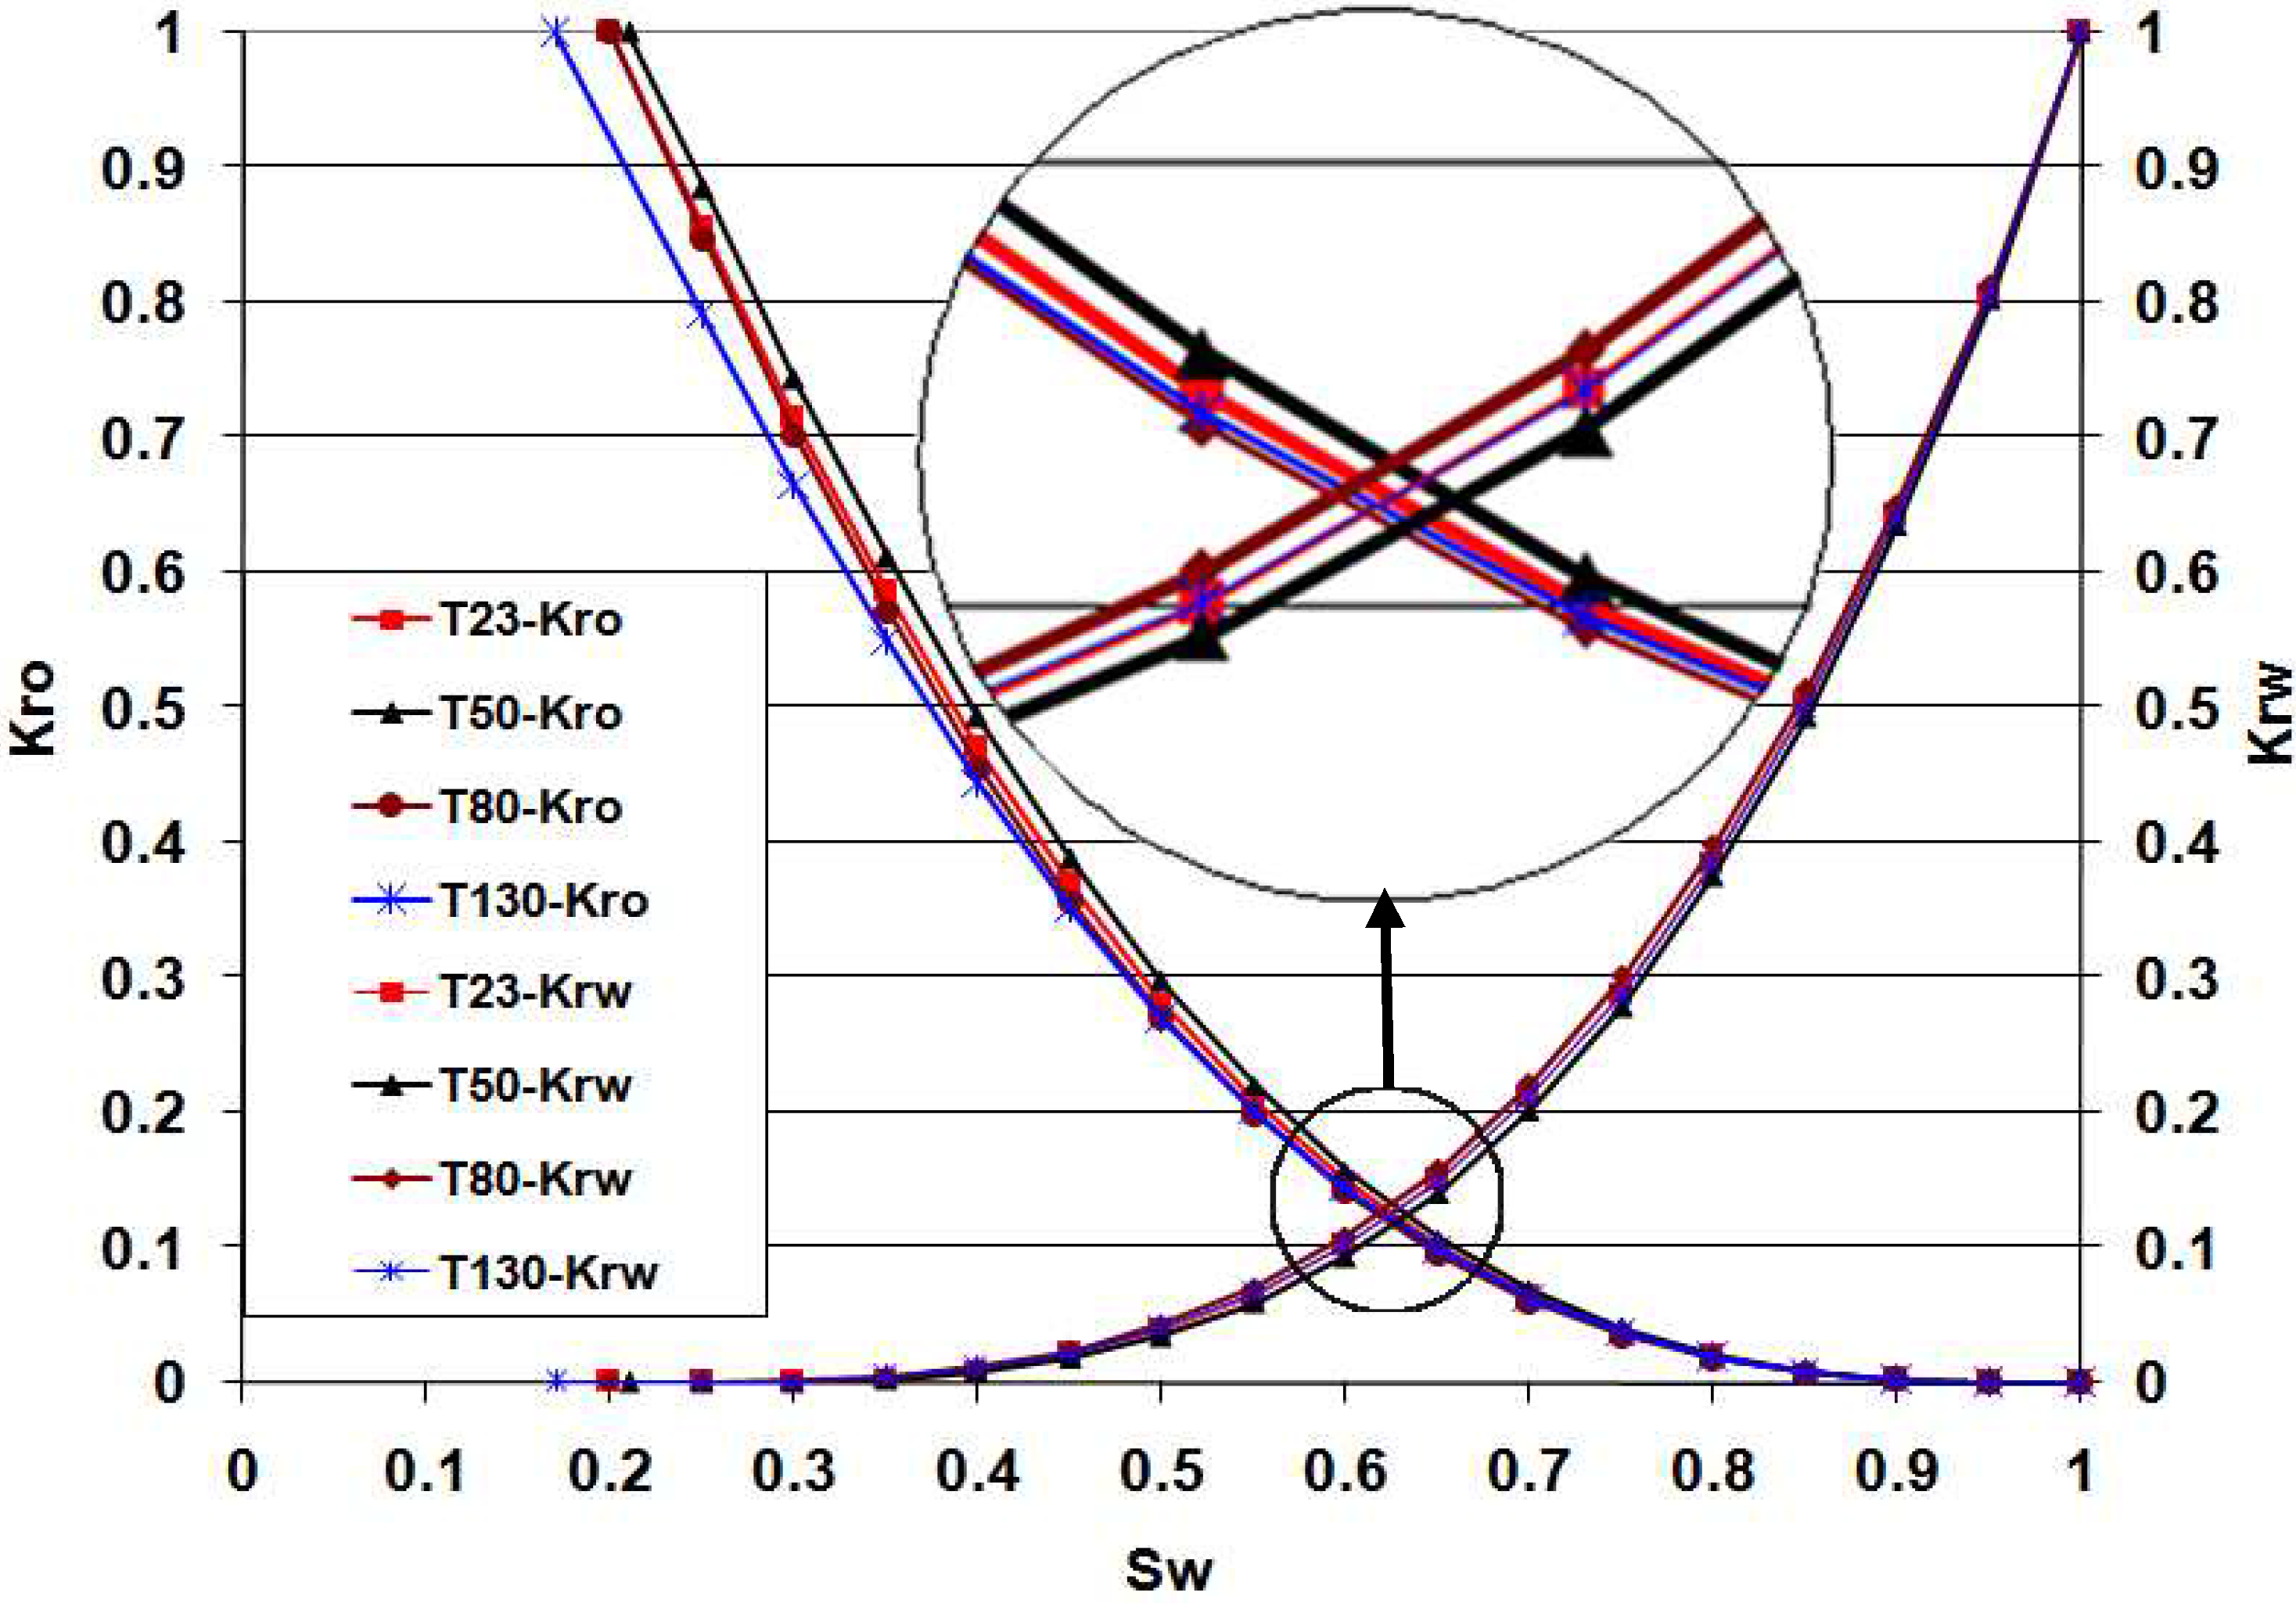
Table 1. The generated oil/water relative permeabilities are shown in
Figure 4.
Table 1.
Swir and λ for experimental relative permeability data.
Table 1.
Swir and λ for experimental relative permeability data.
| Temperature (°C) | Swir(1) (%) | λ(1) |
|---|
| 23 | 20 | 6.62 |
| 50 | 21 | 5.67 |
| 80 | 20 | 9.835 |
| 130 | 17 | 4.241 |
At first glance the trends of the approximated relative permeabilities as a function of temperature shown in
Figure 4, may seem to contradict equations 1 and 2, especially for the case where the temperatures increased from 80 to 130
oC.
In equations 1 and 2, if one assumes that in general S
wir, increases with temperature, a positive value of dS
wir/dT leads to a decrease and increase of the water and oil relative permeabilities as a function of temperature (dk
rw/dT and dk
ro/dT), respectively. This agrees with the obtained results, where the temperature increase from 23 to 50
oC is associated with the increase of S
wir from 0.2 to 0.21, respectively. The agreement with the predicted trend is also due to the close values of λ in both cases. At the two other temperatures, 80 and 130°C, S
wir from the experiments are 0.2 and 0.17, which are equal to and less than that obtained at 23
oC, respectively. However, due to the large difference in the obtained λ, the predicted trend with temperature deviated. In other words, the dependence of k
ro and k
rw trend with temperature is governed not only by S
wir, but also λ, as shown by the equations. Nakornthap and Evans [
19] used a fixed value of 2 for λ in their analysis.
Figure 4.
Calculated relative permeability data using equation 3 and 4. Swir and λ are taken from experimental relative permeability data.
Figure 4.
Calculated relative permeability data using equation 3 and 4. Swir and λ are taken from experimental relative permeability data.
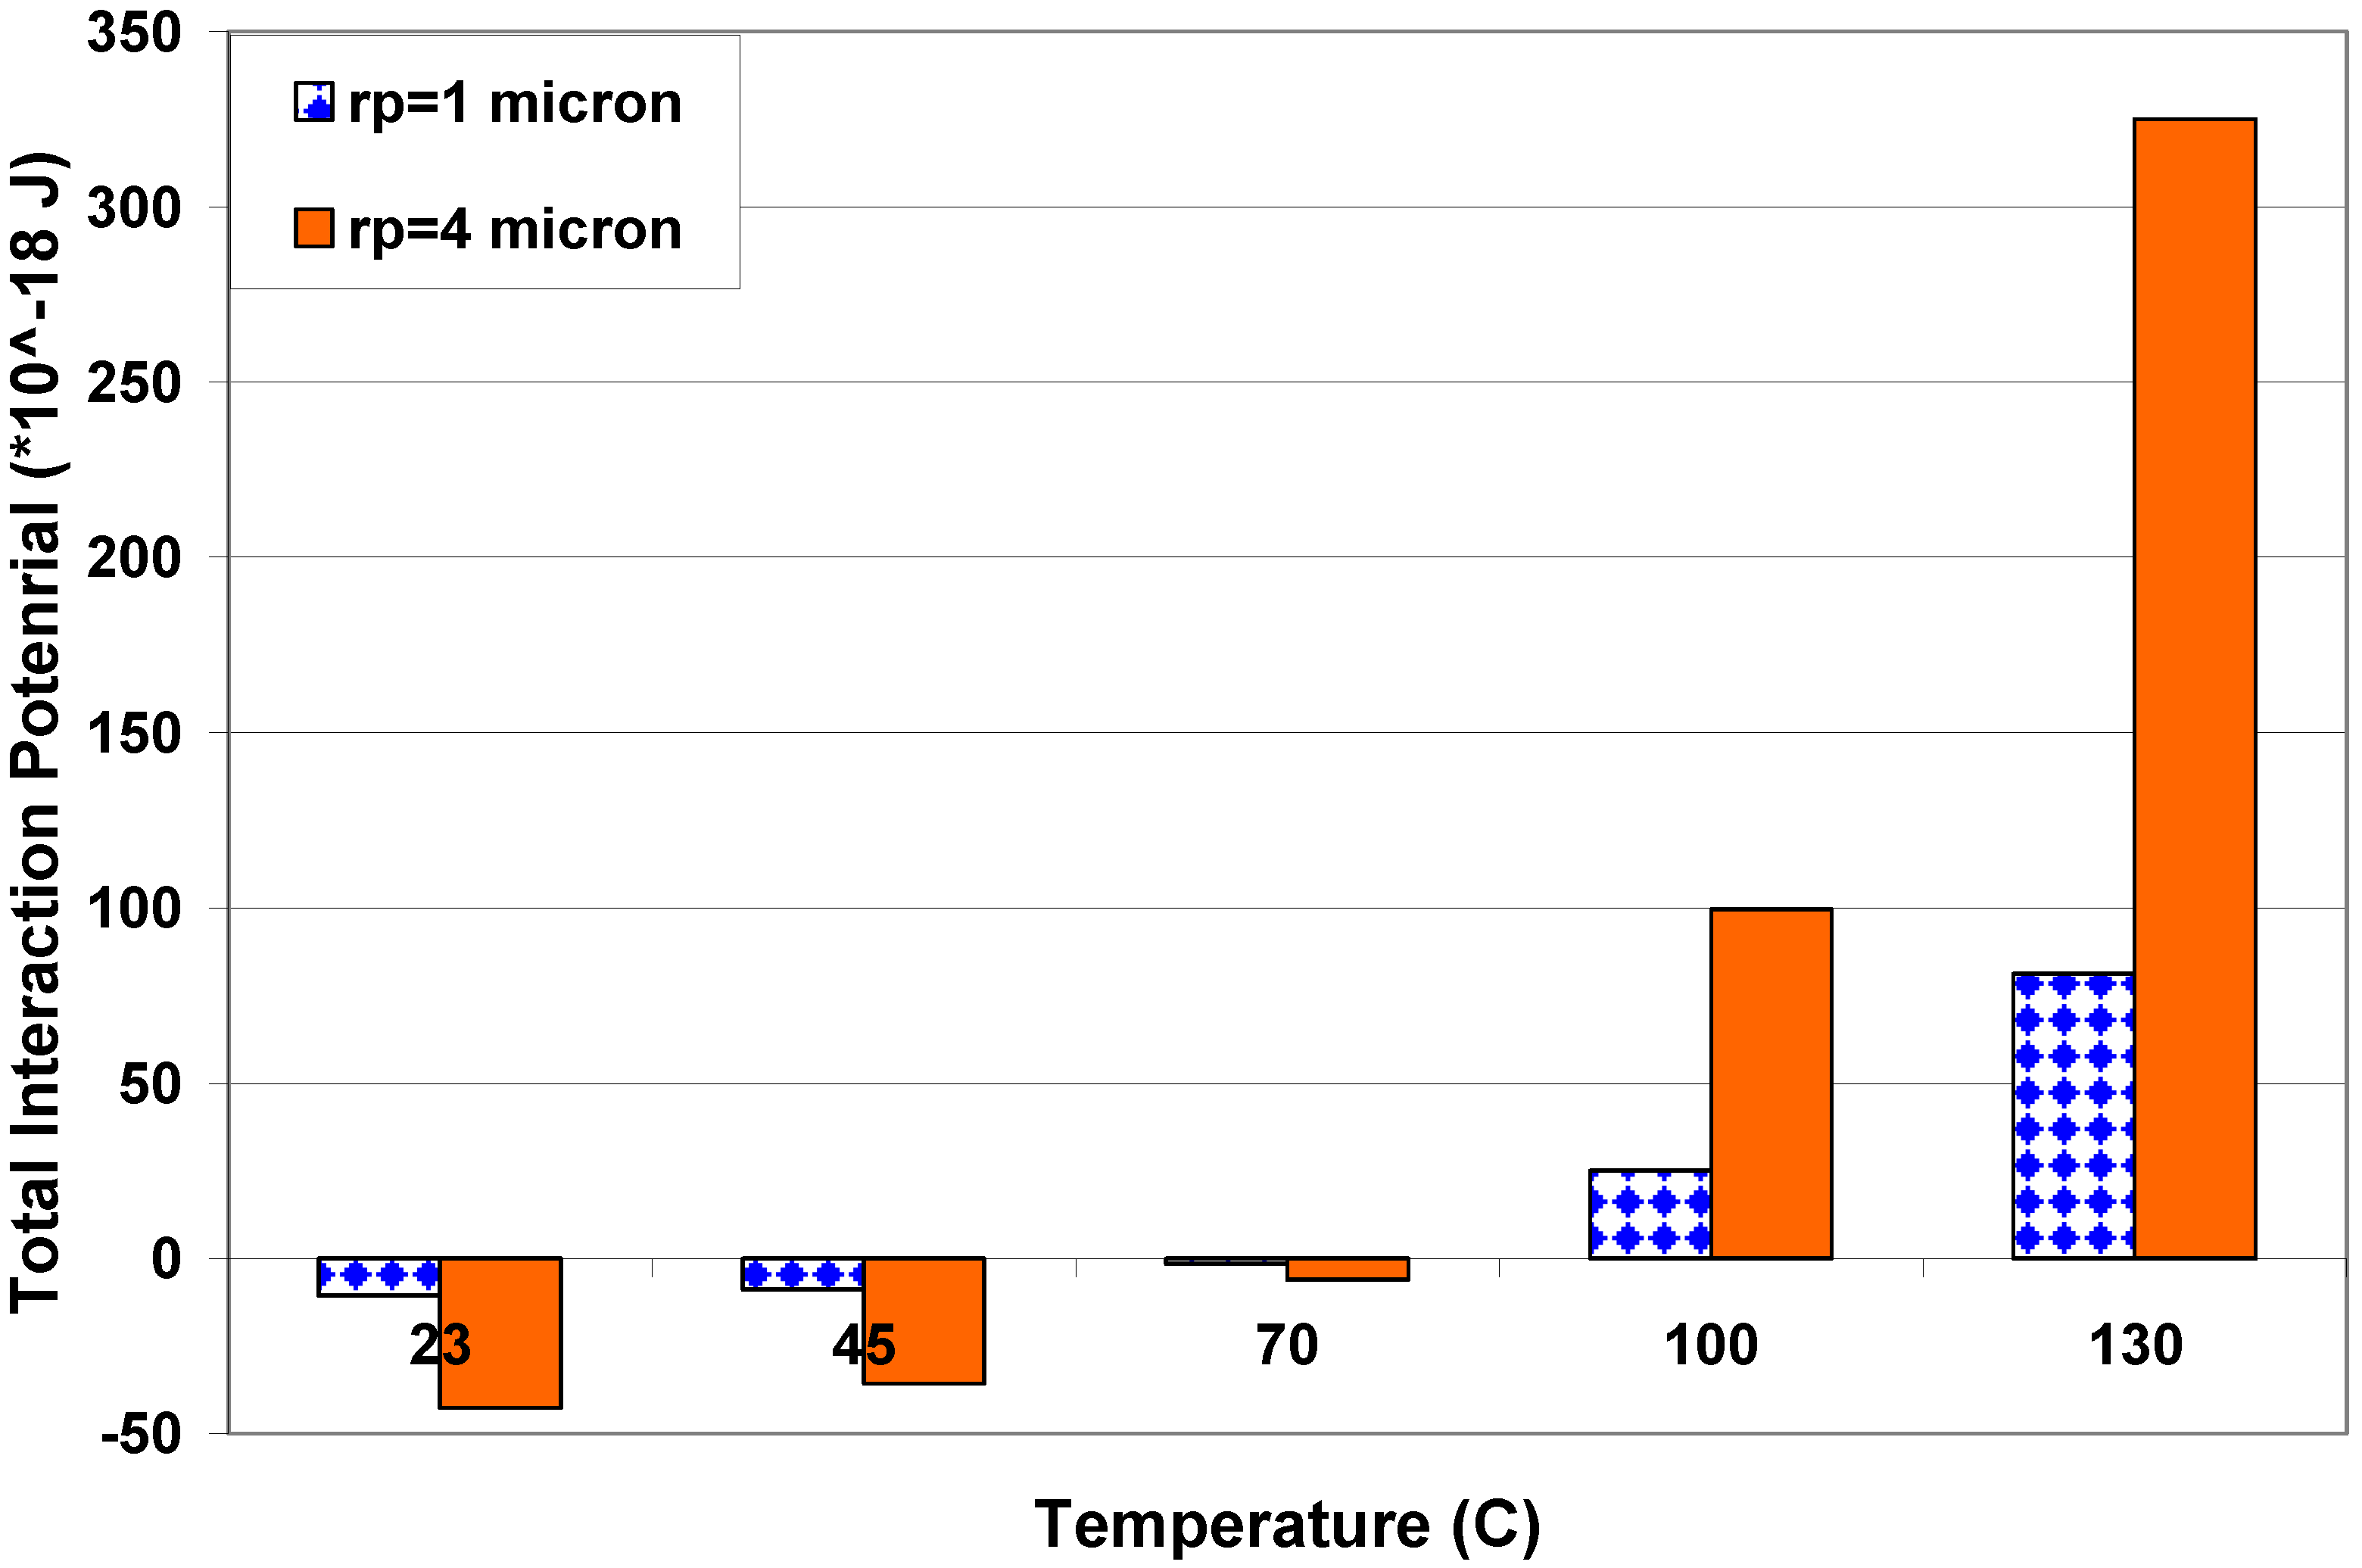
Again, no explanation is made so far to the observed increase of oil-wet status of the chalk with temperature. In our experimental work, particle production was observed from the chalk during relative permeability flooding experiments with distilled water and at 130°C. Total interaction potential for a water/oil/chalk (calcite) system was addressed earlier by Karoussi and Hamouda [
14]. The findings are that the total interaction potential (consisting of van der Waals attractive, short-range Born repulsive and double layer electrostatic forces) becomes more repulsive in nature between oil-wet calcite particles and calcite wall surface in distilled water medium. The computed total interaction potentials were done previously up to 100°C; in this study the computation is extended to include 130°C. The calculated total interaction potentials for two different sizes of calcite particles (1 and 4 µm) are shown in
Figure 5. Schramm
et al. [
20] and Pierre
et al. [
21] reported a value of <5 and 2µm for calcite particle size, respectively.
The positive values of ~75x10-18 and ~325x10-18 J, indicate possible detachment at temperature of 130°C for 1 and 4 µm particle size, respectively. The detachment of particle and fines migration may cause change in pore geometry of rock, consequently permeability reduction.
The investigation of the increase of the oil wetness of the chalk continued from two different angles, namely IFT and contact angle measurements, which are addressed in the next two sections.
Figure 5.
Estimated interaction potential for modified calcite surfaces (0.005M SA in n-decane) for water/oil/chalk (calcite) for two different particle sizes 1 and 4 µm.
Figure 5.
Estimated interaction potential for modified calcite surfaces (0.005M SA in n-decane) for water/oil/chalk (calcite) for two different particle sizes 1 and 4 µm.
2.3. Interfacial Tension (IFT)
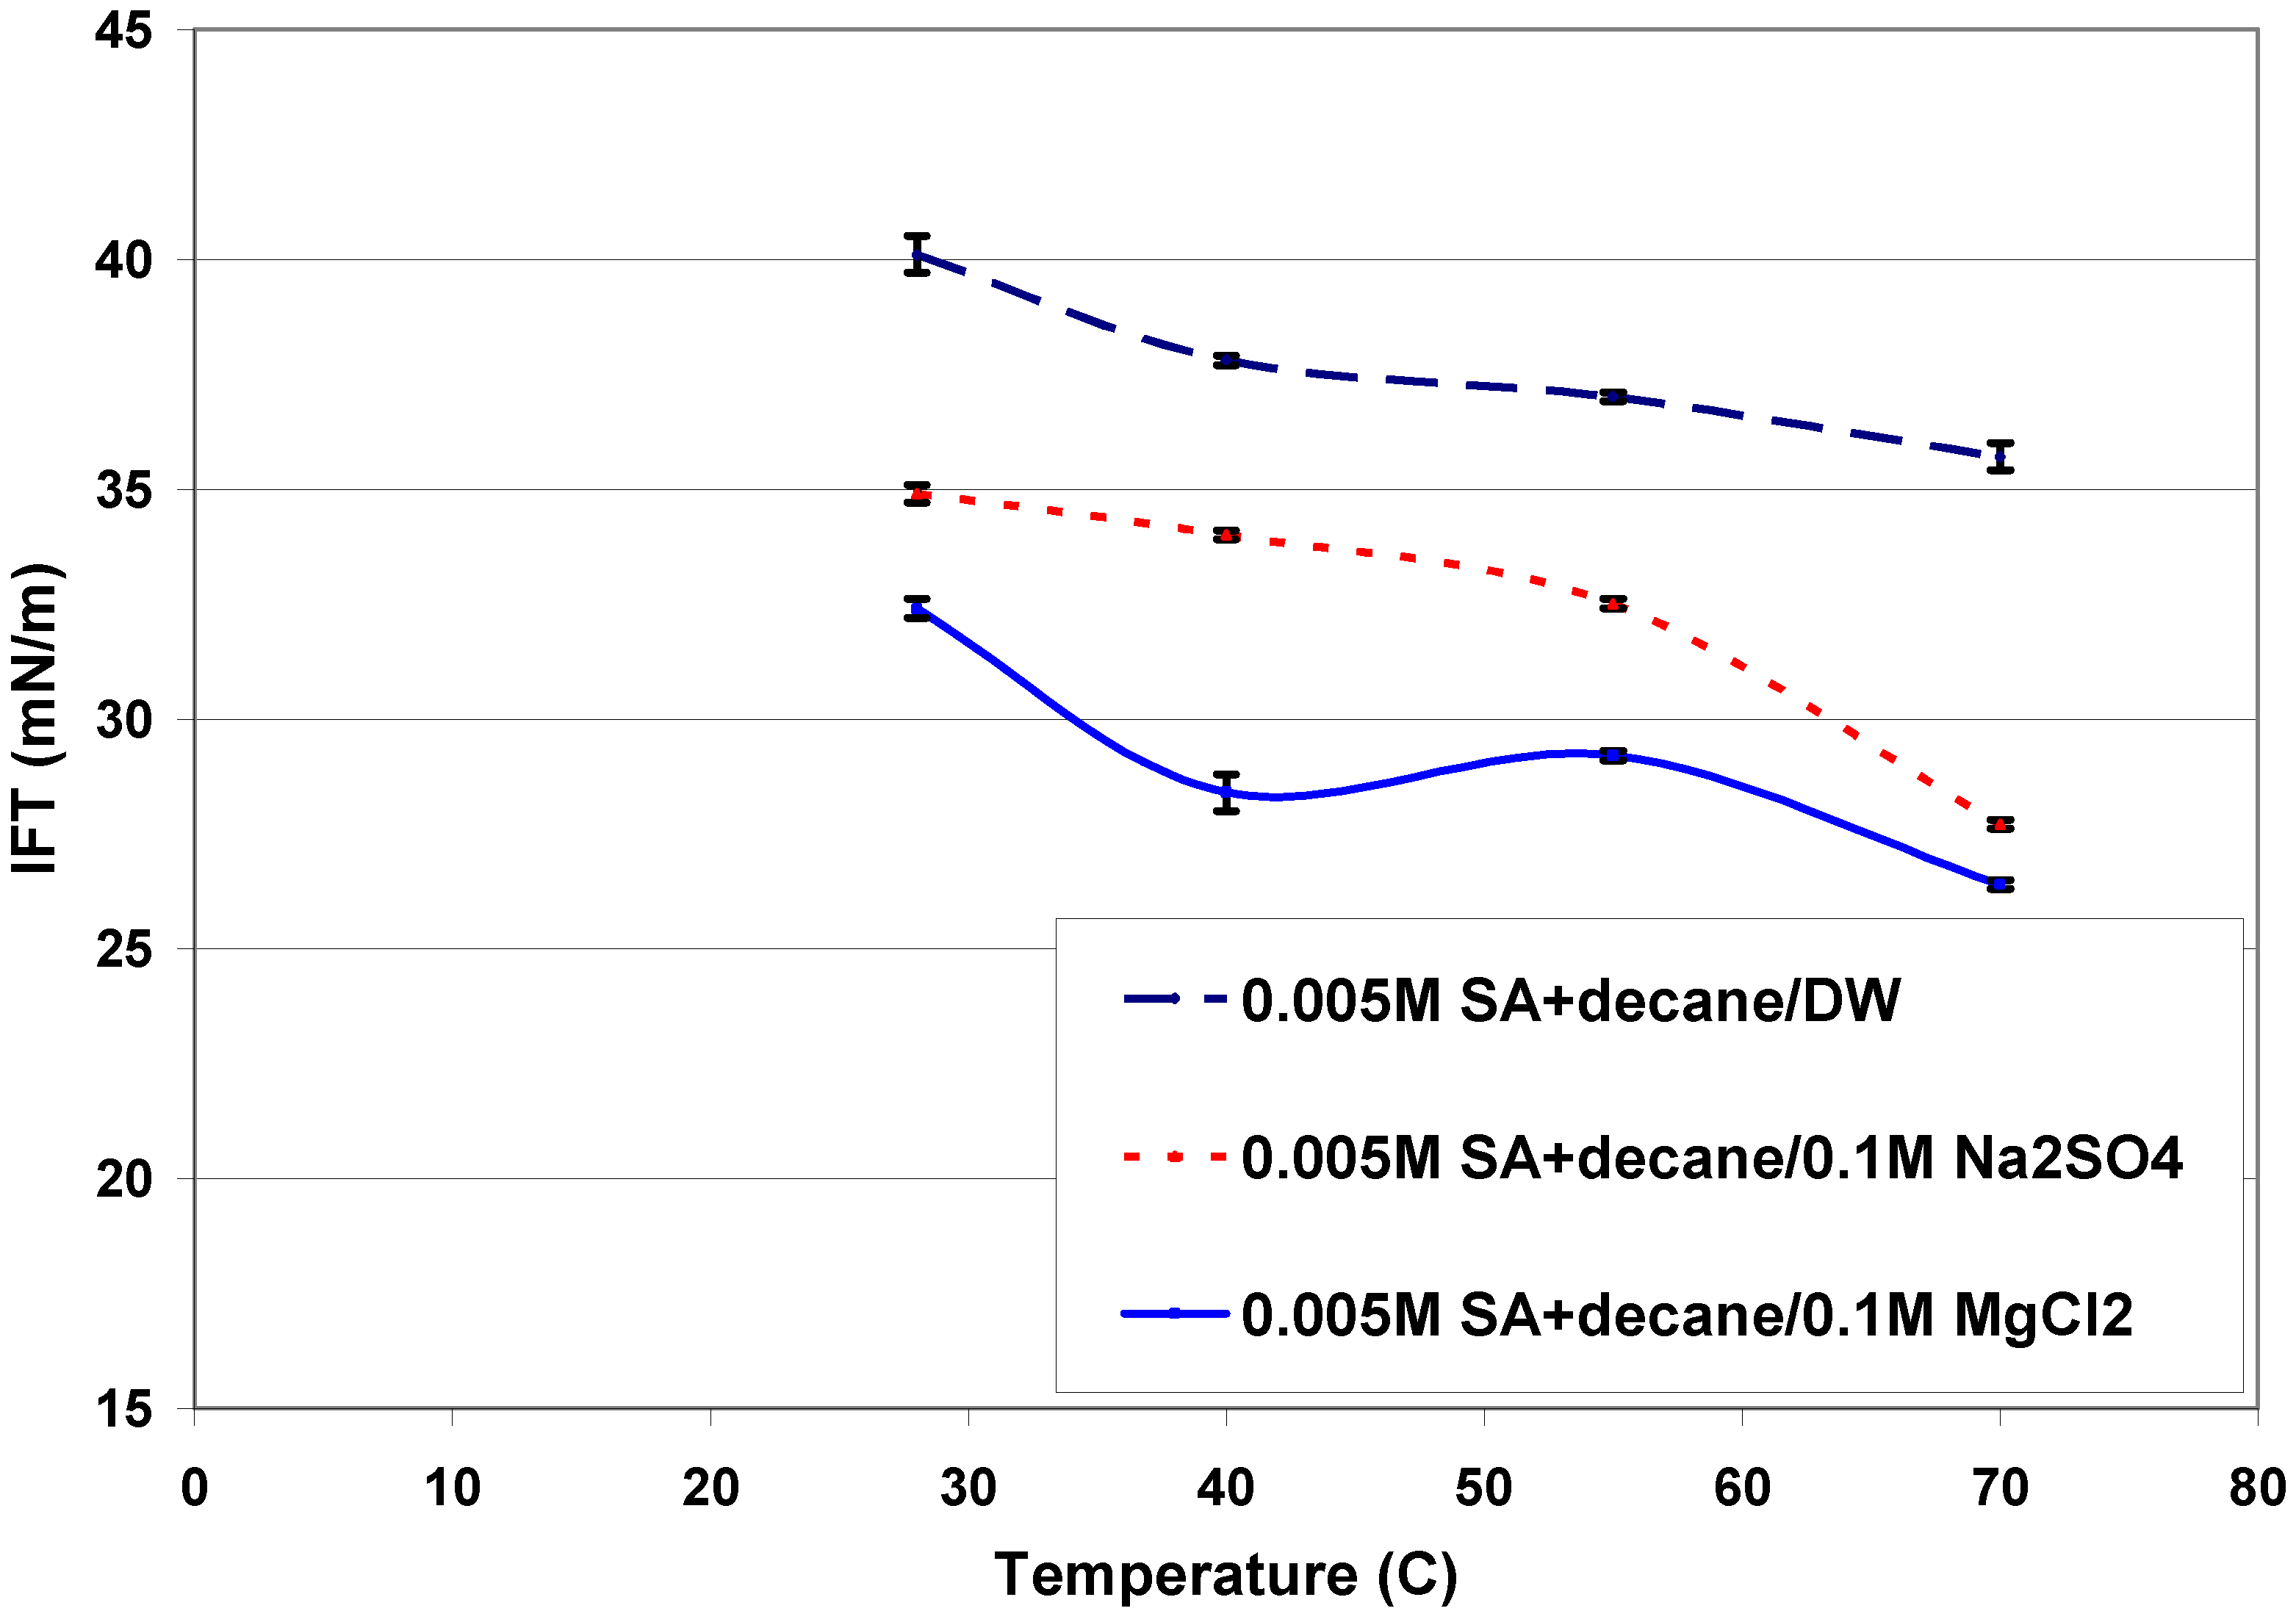
Interfacial tension measurements are done to confirm the effect of the temperature on the interfacial activity. Indeed interfacial tension experiments show the expected decreasing trend (form 40.1 at 28°C to 35.7 mN/m at 70°C) for 0.005M SA in
n-decane/water system as shown in
Figure 6. Hamouda and Rezaei Gomari [
9] also reported a similar trend for 0.01M SA in
n-decane/water system. The IFT measurements are performed here with 0.005M SA in n-decane/water containing 0.1M concentration of sodium sulfate or magnesium chloride, to examine the trend and the effect of these ions in salt waters. IFT in presence of magnesium ions is shown to be lower than that in presence of sulfate ions or distilled water, where 32, 34.9 and 40.1 mN/m at 28°C are measured for 0.1M MgCl
2, 0.1M Na
2SO
4 and distilled water, respectively. Magnesium ions also showed the lowest measured IFT for all tested temperatures. The highest interfacial activity in presence of magnesium chloride, once more demonstrate the influential role of magnesium ions in oil/water/chalk interactions that have been previously investigated with several macroscopic and microscopic approaches done by Hamouda and colleagues [
10,
11,
12,
13,
14,
15,
16].
Amaefule and Handy [
22] and Kumar
et al. [
23] studied the effect of IFT and IFT/temperature on oil-water relative permeability, respectively. In their investigation, they used capillary number (N
c) to relate relative permeability behavior and IFT. The equations used are general and modified definition of N
c:
and,
where, µ is viscosity; v is velocity; σ is IFT; T and T
b are temperature and room temperature, respectively. The subscripts w and o denotes for water and oil, respectively. Amaefule and Handy [
22] stated that the higher N
c is required to initiate mobilization of oil. The corresponding calculated capillary numbers to the studied relative permeabilities, as shown in
Figure 1, are given in
Table 2 using equations 5 and 6. The calculation done by Equation 5, shows a decreasing trend for N
c, (from N
c=3.8x10
-7 at 23°C to 1.75x10
-7 at 80°C). This is in contrast to the experimental results of the relative permeabilities up to 80°C and the obtained decreasing trend of IFT with temperature.
Figure 6.
Comparison between the average measured IFTs of 0.005M SA dissolved in n-decane and distilled water (DW), 0.1M Na2SO4 and 0.1M MgCl2 as a function of temperature. The error bars represents, the standard deviation of the experimental data varies between ±0.1to 0.4 mN/m.
Figure 6.
Comparison between the average measured IFTs of 0.005M SA dissolved in n-decane and distilled water (DW), 0.1M Na2SO4 and 0.1M MgCl2 as a function of temperature. The error bars represents, the standard deviation of the experimental data varies between ±0.1to 0.4 mN/m.
The modified capillary number equation (Equation 6), on the other hand, shows an increasing trend of N
c as temperature increases, N
c=3.93x10
-7at 23°C to 5.41x10
-7at 80°C, which agrees with the results presented by Kumar
et al. [
23]. The increasing trend of N
c may explain the improvement of relative permeability up to 80°C, where a reduction in S
or is observed experimentally. As can be seen, in spite of reduction in IFT and viscosity at 130°C, a decrease in N
c is obtained; (reduction from 5.41x 10
-7at 80°C to 4.31x10
-7at 130°C), which may provide a qualitative explanation to the more oil-wet behavior from the relative permeability experimental data at 130°C.
Table 2.
Capillary number determination as a function of temperature, IFT and viscosity.
Table 2.
Capillary number determination as a function of temperature, IFT and viscosity.
| T° C | Swir | Sor | µw N.s/m2 | µo N.s/m2 | σow mN/m | | |
|---|
| 23 | 0.2 | 0.42 | 0.00100 | 0.00092 | 40.1 | 3.8x10⁻⁷ | 3.93 x10⁻⁷ |
| 50 | 0.21 | 0.37 | 0.00055 | 0.00061 | 37 | 2.28 x10⁻⁷ | 4.74 x10⁻⁷ |
| 80 | 0.2 | 0.36 | 0.00036 | 0.00047 | 34.537 | 1.75 x10⁻⁷ | 5.41 x10⁻⁷ |
| 130 | 0.17 | 0.52 | 0.00018 | 0.00029 | 29.637 | 9.19 x10⁻⁸ | 4.31 x10⁻⁷ |
2.5. An Approach for estimation/verification of contact angle
Bahramian and Danesh [
24] reported an approach to predict solid-water-hydrocarbon contact angle as well as surface/interfacial tension on the basis of mutual solubility of two components/phases. The following equations and given data in
Table 3, are applied in this study for SA/
n-decane/water system to compare the predicted contact angle with the measured values. It was assumed that stearic acid completely adsorbs on the calcite surface; hence, SA is considered as the solid phase rather than calcite.
where, σ
12 is the interfacial tension between component 1 and 2; R is the ideal gas constant; T is temperature in (K); a
12 is the average partial molar surface area; a
i is the partial molar surface area of component i; V is molar volume and N is Avogadro’s number.
is the mole fraction of component “i” in rich phase of component “j”.
Table 3.
Applied mutual solubility data in water/SA/decane system for IFT calculations.
Table 3.
Applied mutual solubility data in water/SA/decane system for IFT calculations.
| Mutual Solubility data |
|---|
| Solubility of water in n-C10 @ 25°C | 0.072 g water/1000 g C10 |
| Solubility of n-C10 in water @ 25°C | 1.98E-6 g C10/100 g water |
| SA concentration in decane (Table 4a) | 0.005 M |
| SA concentration in decane (Table 4b) | 0.01 M |
| Decane fraction in SA | ~0 |
| Water fraction in SA | ~0 |
| SA solubility in water | 0.034 g SA/100 g water |
For SA/
n-decane/water system, the mutual interfacial tension between each phase is determined using Equation 7. The calculated interfacial tension values and the corresponding contact angle are compared as shown in
Table 4a and
Table 4b for 0.005 and 0.01M concentrations of SA, respectively.
Table 4a.
Calculated IFT and Contact angle for water/0.005M SA/decane system.
Table 4a.
Calculated IFT and Contact angle for water/0.005M SA/decane system.
| σwater/C10 | σwater/SA | σ0.005MSA /C10 | Θ | Θ | Θ |
|---|
| (mN/m) | (mN/m) | (mN/m) | Young eq. | If σwater/SA=18.05a (mN/m) | Measured |
|---|
| 49 | 58.8 | 25.7 | 47.5 | 99.1 | 90b |
Table 4b.
Calculated IFT and Contact angle for water/0.01M SA/decane system
Table 4b.
Calculated IFT and Contact angle for water/0.01M SA/decane system
| σwater/C10 | σwater/SA | σ0.01MSA /C10 | Θ | Θ | Θ |
|---|
| (mN/m) | (mN/m) | (mN/m) | Young eq. | If σwater/SA=18.05a (mN/m) | Measured |
|---|
| 49 | 58.8 | 23.2 | 43.4 | 96.1 | 96c |
Table 4a and
Table 4b show the calculated contact angles using young equation, which largely differ from the measured contact angles (i.e. 47.5° compared to the measured 90° and 43.4° compared to the measured 96°, respectively).
However, when the spreading tension of water/calcite/decane system (i.e.18.05 mN/m) reported by Rezaei Gomari
et al. [
13] is used, the calculated contact angle is shown to be closer to the measured values for the two different concentrations of stearic acid (
Table 4a and
Table 4b). It is worth mentioning that, the measured IFT for water/decane system in this study are 47 and 46.3 mN/m at 28°C, which are in agreement with the calculated value of 49 mN/m based on equation 5. Rezaei Gomari
et al. [
11] and Bahramian and Danesh [
24] reported values of 45.5 and 48 mN/m for the IFT between water and
n-decane, respectively. Bahramian and Danesh [
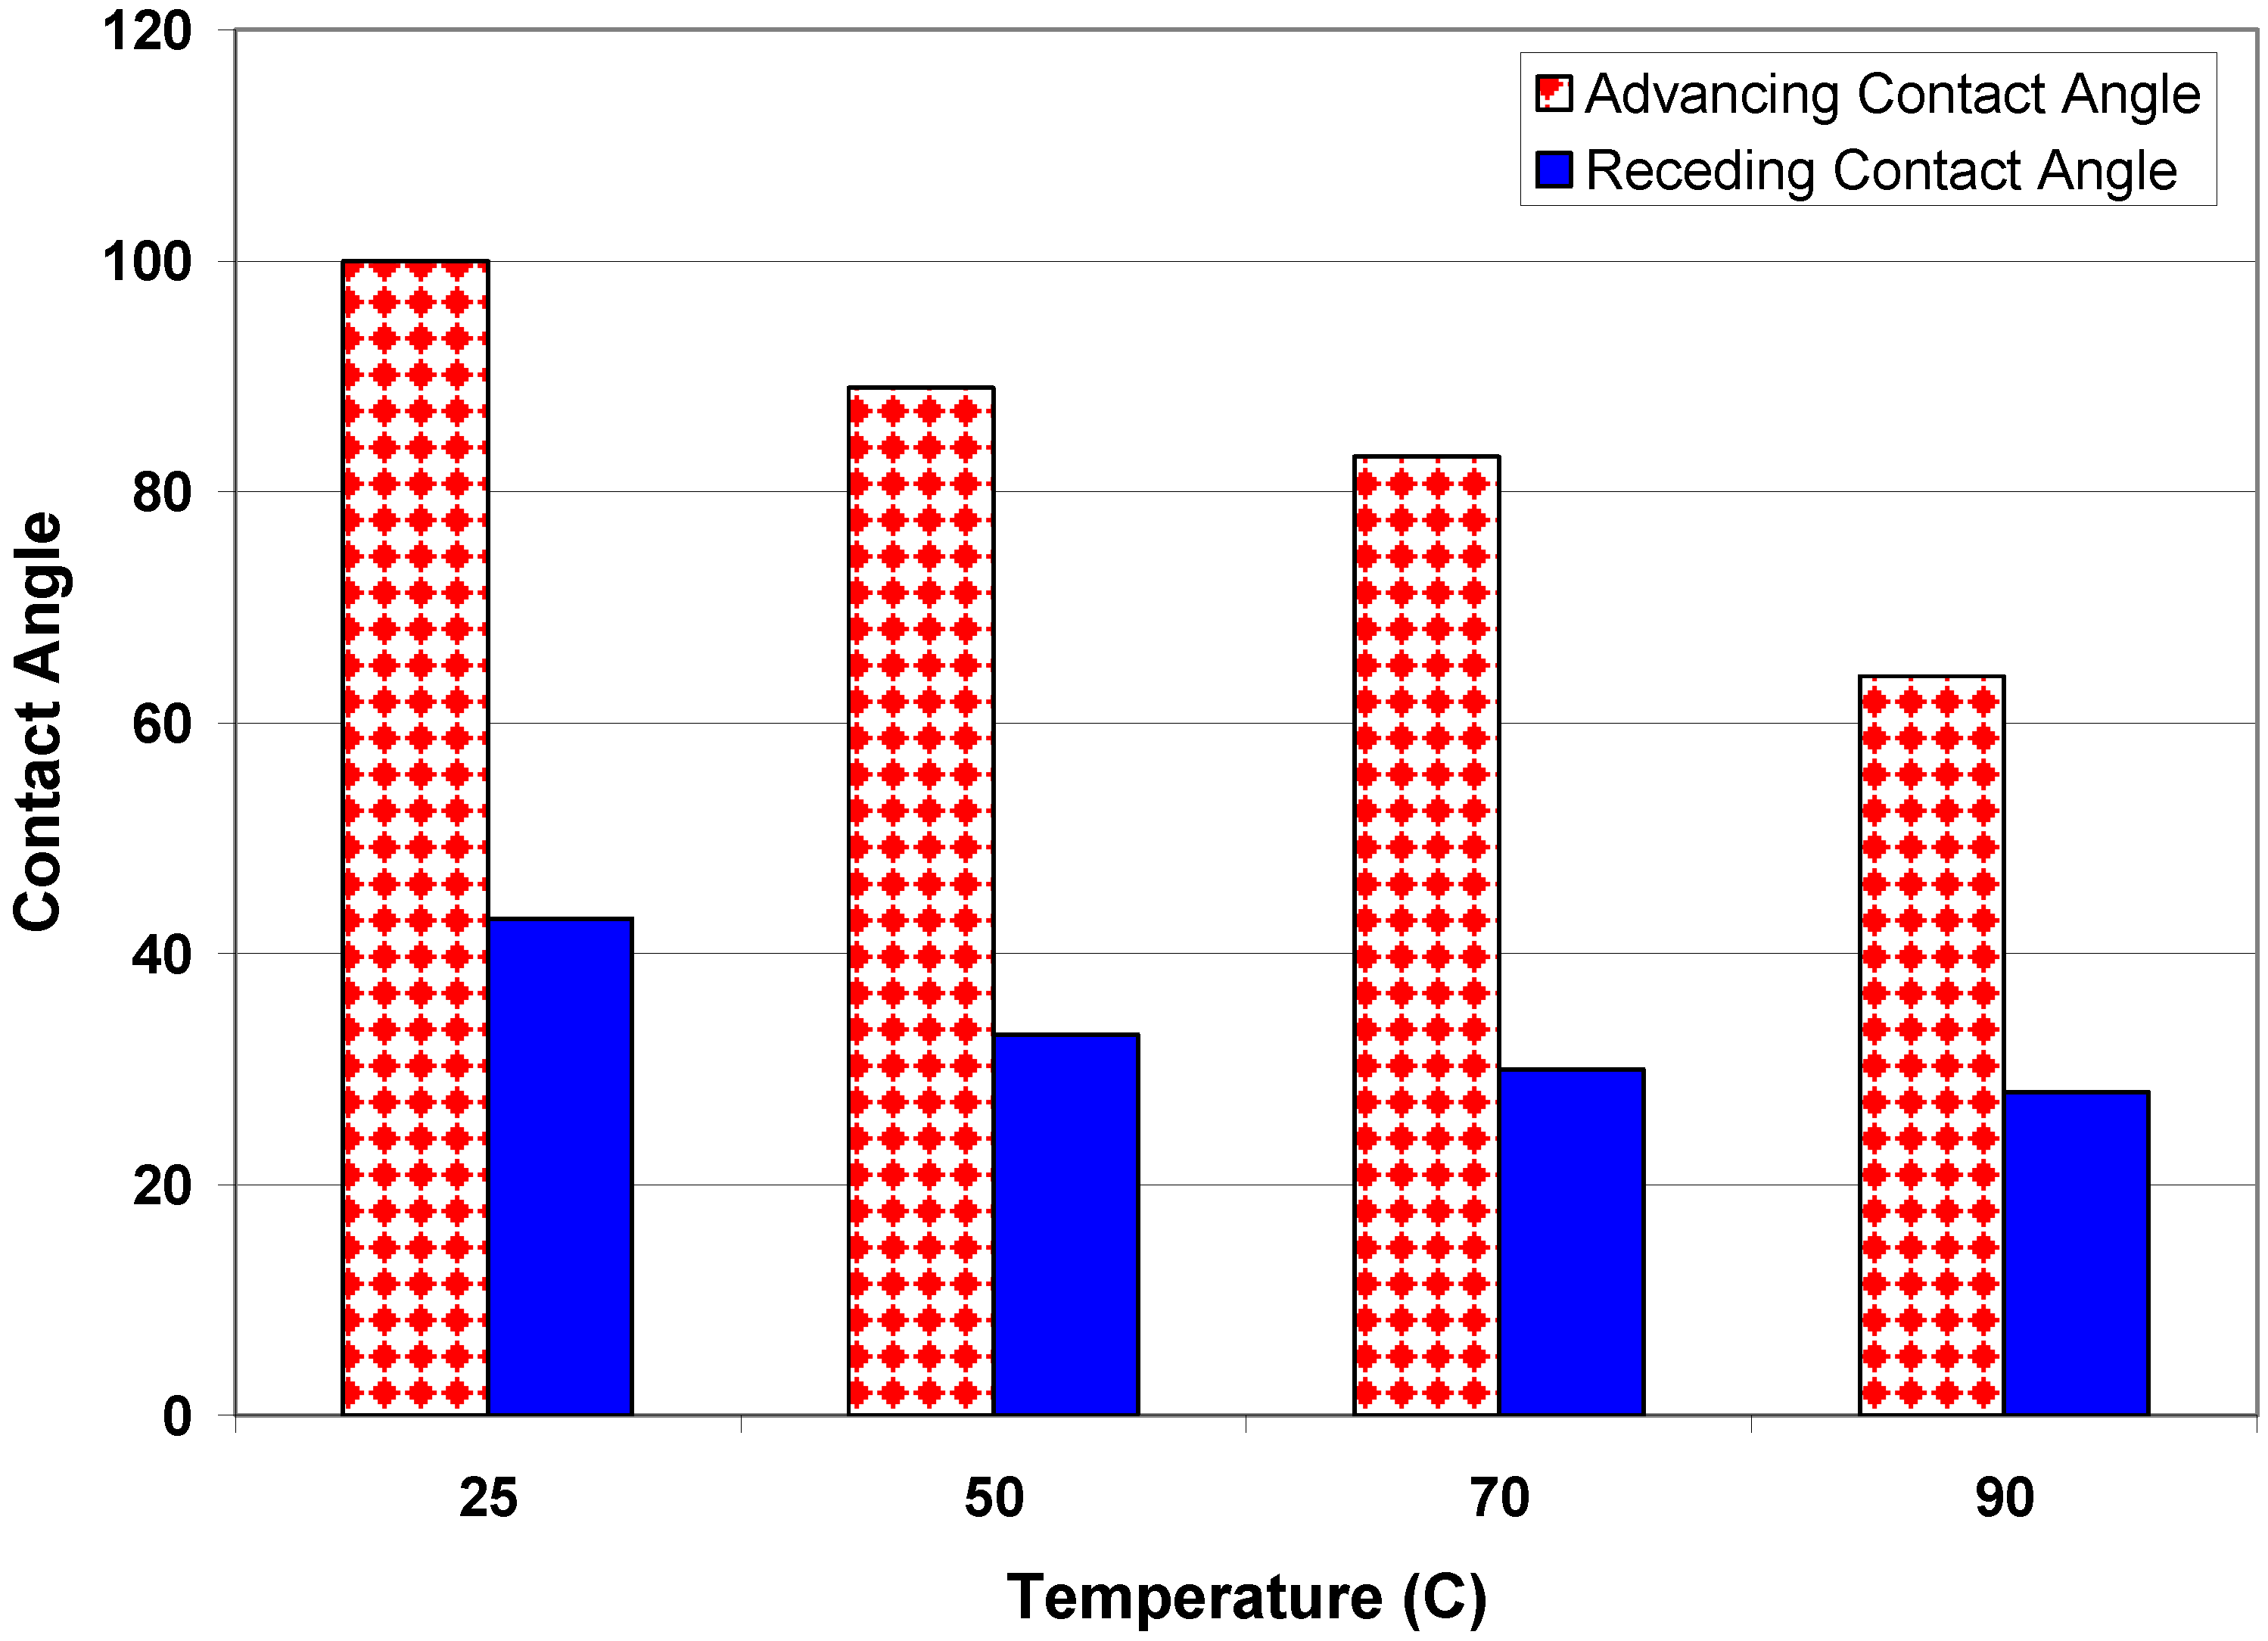
24] correlated the calculated contact angle to the average value of advancing and receding contact angles, where in our system as shown in
Figure 6, would be around 72°, which is significantly different from the calculated value of 47.5°. It should be stated that due to the lack of data and more contact angle measurement results, no generalization can be made for prediction of contact angle at this point.
Although the maximum measured IFT and contact angle was done at temperatures less than that employed during relative permeability experiments of 130oC due to the measurements limitation, the decreasing trend is in favor of increasing oil recovery, hence it may be concluded that the shift in the relative permeability at 130oC towards less Sw is mainly due to change in pore geometry of rock caused by fine detachment/migration and possible oil trapping.
An experiment is done here to further verify the above hypothesis of fine detachment/migration and possible oil trapping. Absolute permeability measurement was carried out at 23 and 130°C. Two cores were flooded by distilled water (DW) and the third one with
n-decane. The absolute permeability was reduced by almost 50% in all cases as shown in
Table 5, where the temperature increased to 130°C. This is in agreement with the statement by Nakornthap and Evans [
19], that Cassé and Ramey [
25], Weinbrandt
et al. [
26], and Gray
et al. [
27] found that absolute permeability decreases with temperature. Sedaee Sola
et al. [
28] reported that limestone showed a more oil-wet (as indicated by a shift of the relative permeability curves) behavior when temperature increased to 200
oF (≈93
oC).
Table 5.
Core data and the estimated absolute permeability at 23 and 130°C.
Table 5.
Core data and the estimated absolute permeability at 23 and 130°C.
| Core# | L(cm) | D(cm) | Flooding fluid | K@ 23°C (md) | K@ 130°C (md) |
|---|
| A | 6.15 | 3.75 | DW | 3.6 | 1.92 |
| B | 4.42 | 3.8 | DW | 3.57 | 1.88 |
| C | 4.9 | 3.75 | n-decane | 3.05 | 1.55* |


