Article

Isoperibolic Titration Calorimetry as a Tool for the Prediction of Thermodynamic Properties of Cyclodextrins

by
Juan Carlos Moreno-Piraján
1,* and
Liliana Giraldo
2
1
Universidad de los Andes, Bogotá, Colombia, Grupo de Investigación en Sólidos Porosos y Calorimetría, Departamento de Química, Facultad de Ciencias / Carrera 1 No.18 A10, Bogotá, Colombia
2
Universidad Nacional de Colombia, Facultad de Ciencias, Departamento de Química / Ciudad Universitaria, Bogotá Colombia
*
Author to whom correspondence should be addressed.
Energies 2008, 1(3), 93-104; https://doi.org/10.3390/en1030093
Submission received: 4 July 2008 / Revised: 11 October 2008 / Accepted: 14 October 2008 / Published: 16 October 2008

Abstract

:
The interaction of guest molecules ranging from pentan-1-ol to octan-1-ol with α-cyclodextrin (α-CD) in water of has been studied calorimetrically at 283.15, 288.15, 293.15, 298.15 and 308.15 K with an isoperibolic titration calorimeter designed in our laboratory. The calorimetric method employed allows the determination of the thermodynamic parameters characterizing the binding process, ΔG°m, ΔH°m, ΔS°m and ΔCp°, namely free energy, enthalpy, and calorific capacity. These results show that in the temperature range investigated, the entropy change increased with chain length. This is in line with what is expected for a hydrophobic dehydration process. However, that effect is not expected to lead to the more pronounced negative CH2-increment observed for nc > 5 or 6. As for many other ligand binding processes, we can observe a significant enthalpy - entropy compensation for this system, both with respect to temperature and structure.

Graphical Abstract

1. Introduction

Solution calorimetry is used primarily to determine the enthalpy changes due to the formation of a solution [1]. The enthalpy of solution, ΔsolH, depends on the morphology of the solute, the structure of the liquid and the molecular interactions between the dissolved solid and the liquid. A common industrial application of solution calorimetry is the detection and characterization of the potential polymorphs of a new drug [2, 3]. In such experiments, the enthalpies of solution for potential new polymorphic forms, prepared from different crystallization media, are measured in a common solvent. However, an interesting but as yet unexplored application of solution calorimetry is to reverse this pattern, whereby the enthalpy of solution for a stable form of a drug is measured in a number of different solvents. These solvents can be biological fluids, model biological fluids or complex dispersions, and by measuring ΔsolH in both the whole solvent system and its individual components valuable information may be obtained. It is also possible to convert the temperature offset data from a semi-adiabatic solution calorimeter into a power–time plot [4, 5].
A calorimeter is a thermodynamic instrument but can also be employed as an analytical tool, for example as a 'process monitor'. About 100 calorimetric investigations involving macrocyclic compounds have been reported, most of them on cyclodextrins, see for example [6,7,8,9,10,11,12,13,14,15,16,17,18,19,20]. For recent work on crown ethers, see [6, 7]. Few calorimetric investigations have so far been conducted on cryptands [1,2,3,4,5,6,7] and calixarenes [10].
In the present paper, the term 'isothermal microcalorimeter' is used for particularly sensitive calorimeters, which are used in experiments where the temperature stays essentially constant. The sensitivity for such instruments is typically less than 1 μW or better, and the amount of material employed in a chemical experiment usually is less than 1 μmol.
Modern microcalorimetry has extended the use of calorimetry in studies of ligand binding, dissolution, heat capacity (small samples, dilute solutions) and in experiments with living cells. With respect to dissolution measurements and in work with living materials it is often essential that the calorimeters not only have a high sensitivity but also that the instruments allow very long measurement periods (days). Fortunately, several modern microcalorimeters have an excellent baseline stability making them well suited for such work.
This paper will concentrate on calorimetric technique isoperibolic of titration adapted by us and applied in thermodynamic experiments. However, even for cases where calorimeters mainly are employed as analytical instruments, it is important to express results in terms of well defined thermodynamic properties. Below we briefly review some thermodynamic properties which can be determined calorimetrically and are of particular importance for the area treated here.
When a 'heat of reaction' is measured under conditions of constant pressure (in practice usually the atmospheric pressure) it is the enthalpy change, ΔH, that is determined. The heat production rate, often called the 'thermal power', P, or heat flow, ø, is a thermodynamic as well as a kinetic property which typically is determined in experiments where the calorimeter is used as a process monitor:
P = d(ΔH)/dt
Enthalpy measurements conducted for a process at different temperatures will lead to the change in heat capacity for the system at constant pressure, ΔCp:
ΔCp = d(AH)/dT
This property has proved to be of major importance in, for example, studies of binding processes conducted in aqueous solutions. However, surprisingly few such measurements have been reported in the area of macrocyclic chemistry.
Dissolution calorimetry is of particular importance in studies of intermolecular forces in pure compounds and of solute - solvent interactions. Such measurements are therefore also important for investigations of binding reactions in solution as the thermodynamics of such processes to a large extent is governed by the solvation of the reaction components. From a comparison of enthalpy values for dissolution of a compound into two different solvents (ΔsolH1 and ΔsolH2) the enthalpy of transfer (ΔtransH) of the compound between the two solvents can be derived [21,22,23,24,25,26,27,28,29,30]:
ΔtransH = ΔsolH1 - ΔsolH2
It should be noted that the properties ΔtransH and ΔtransCp reflect changes in the interactions between the solute and the solvent, without any contribution from the intermolecular forces present in the pure compounds used in the determination of the ΔsolH-values.
A special case of ΔtransH is the enthalpy of transfer of a compound from the gas phase to solution, usually called the enthalpy of solvation, ΔsolH. For solids and liquids this property is obtained as the difference between values for enthalpy of dissolution and enthalpy of vaporization (sublimation), ΔvapH:
ΔsolvH= ΔsolH – ΔvapH
Except for very dilute solutions, there can be significant interactions between solute molecules in a solution. It is therefore often desirable to determine values for enthalpies of dilution which may allow calculation of ΔsolH values for infinitely dilute solutions, ΔsolH (ΔtransH, ΔsolCp). When microcalorimetric techniques are used, it is frequently possible to work in concentration ranges which are low enough to be considered as infinitely dilute. The partial molar heat capacity for a solute (A) at infinite dilution, Cp (A), is not influenced by any intermolecular forces except by those between solute and solvent. This property can be derived from the heat capacity value determined for the pure solute (*) and the dissolution heat capacity value:
Cp (A) = ΔsolCp,m (A) + Cp,m *(A)
where the index m indicates 'molar'.
Alternatively, Cp (A) may be determined by direct heat capacity measurements of very dilute solutions. From a practical point of view, the most important thermodynamic property for a binding process is the concentration equilibrium constant, Kc, where index c indicates that the K-value is based on equilibrium concentrations rather than activities (which in most cases not are available). For many binding processes it is possible to determine K, values and corresponding enthalpy values simultaneously by use of titration calorimeters or flow mixing calorimeters, cf below. The relationship among equilibrium constant, standard Gibbs energy change (ΔG°) and corresponding entropy change (ΔS°) are given by:
ΔG°= -RTlnKc
ΔG°= ΔH° - TΔS°
where R is the gas constant and T the absolute temperature.
The objective of this study is to investigate these interactions through a through an understanding of the formation of simple 1:1 complexes between small organic molecules and either α- or β-cyclodextrin (hexa- and heptaamylose, respectively) as a common receptor.
Because we introduce only the smallest possible chemical perturbation, that of a single functional group, and because of the relative simplicity of the reacting system, the hydrogen bond or hydrophobic interaction introduced into the complex is reasonably well defined. By comparing the values of the thermodynamic quantities in the presence and in the absence of this additional interaction, many of the common contributions to the thermodynamics in the individual binding reactions (e.g., effects of solvation/desolvation, changes in mole number, loss of translational and rotational entropy) may be largely eliminated. The remaining difference then provides an estimate of the contribution of the hydrogen bond and hydrophobic interaction per se to the thermodynamics of binding in these complexes. The requested values of the thermodynamic quantities at different temperatures have been obtained by isothermal titration calorimetry. This technique yields the binding constant, K, and the enthalpy change, ΔH°, from which the free energy change, ΔG°, the entropy change, ΔS°, and the change in heat capacity upon binding, ΔCp°, are obtained [6,7,8,9,10,11,12,13,14,15,16,17,18,19,20].

2. Experimental Section

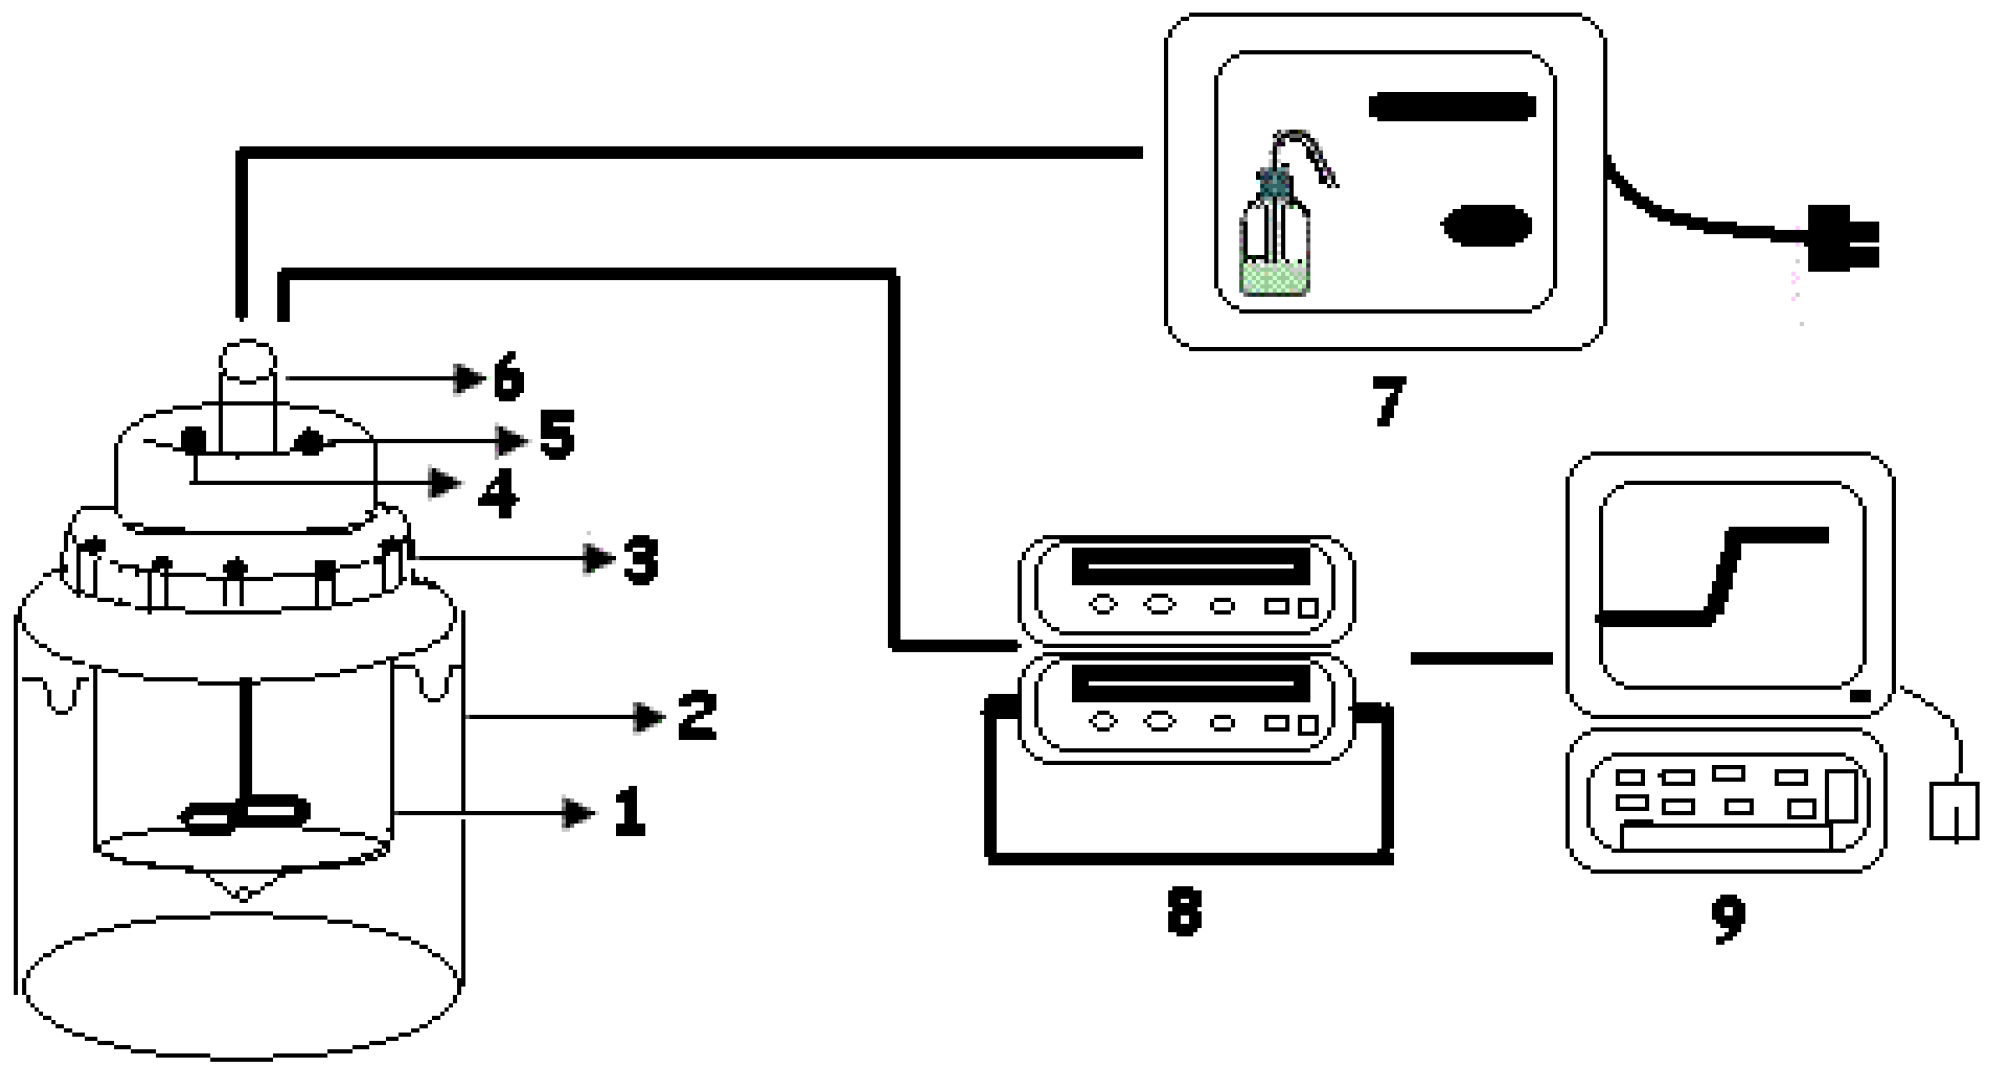
Thermal titrations were carried out in the calorimeter reaction cell of an isoperibolic titration calorimeter of local construction, with an electronic circuit coupled to improve its performance by reducing short-term noises (Figure 1). The calorimeter has a 25 mL capacity Dewar (1) contained in vessel made of carbon fiber (2) to allow water circulation, that keeps the temperature constant, and provides physical resistance to the appliance which is assembled. This appliance is assembled to a cover (3), by means of which is fixed to the calorimeter, and that carries the sensors and calibration elements (4,5) as well as the stirring (6) and injection (7) systems.
The sensor system consists in a series of thermistors hold in a Wheatstone bridge, where two of the branches are replaced by NTC-type thermistors to obtain great thermometric sensitivity. The equipment has a calibration resistance (5) of 20 ohms and was specially constructed in our laboratory to carry out the calibration measurements.
The stirring system (6) was completely built of Teflon to avoid undesired reactions and thermal escapes. It was connected to a high precision automatic titrator that allowed the injections performed in this work (7).
The calorimeter has an automatic capture system, connected to a PC through an IEEE card (8), that allows a continuous measurement monitoring. Once in the PC (9), the thermal changes are estimated by means of a software package developed by our group.
The instrument was electrically calibrated for each temperature. In an experiment, portions of 30 mM ligand (7-50 μL) were injected into a 10.0 mL thermostatted cell containing 6.5 mM of cyclodextrin and stirred at 600 rpm. Injections were for 40 s at 5-min intervals. The necessary heat to dilute the ligand into the buffer was obtained in an identical run and subtracted from the ligand + cyclodextrin titration. The cyclodextrins were obtained from Sigma Aldrich, and the other chemicals were from J.T. Baker. These materials were of the highest purity available and were used without further purification. All solutions were in a 0.05 M Na phosphate buffer at pH = 7.1, where it is known from the pKs that the acids and amines are singly charged species. Using the same stock solution of ligand, a single titration was carried out at each temperature.
Figure 1. Isoperibolic titration calorimeter. (1) Cell; (2) Jacket; (3) Lid; (4-5) Holes for sensors; (6) Stirrer; (7) Injection system; (8) Capture system; (9) Computer.
Energies 01 00093 g001

3. Results and Discussion

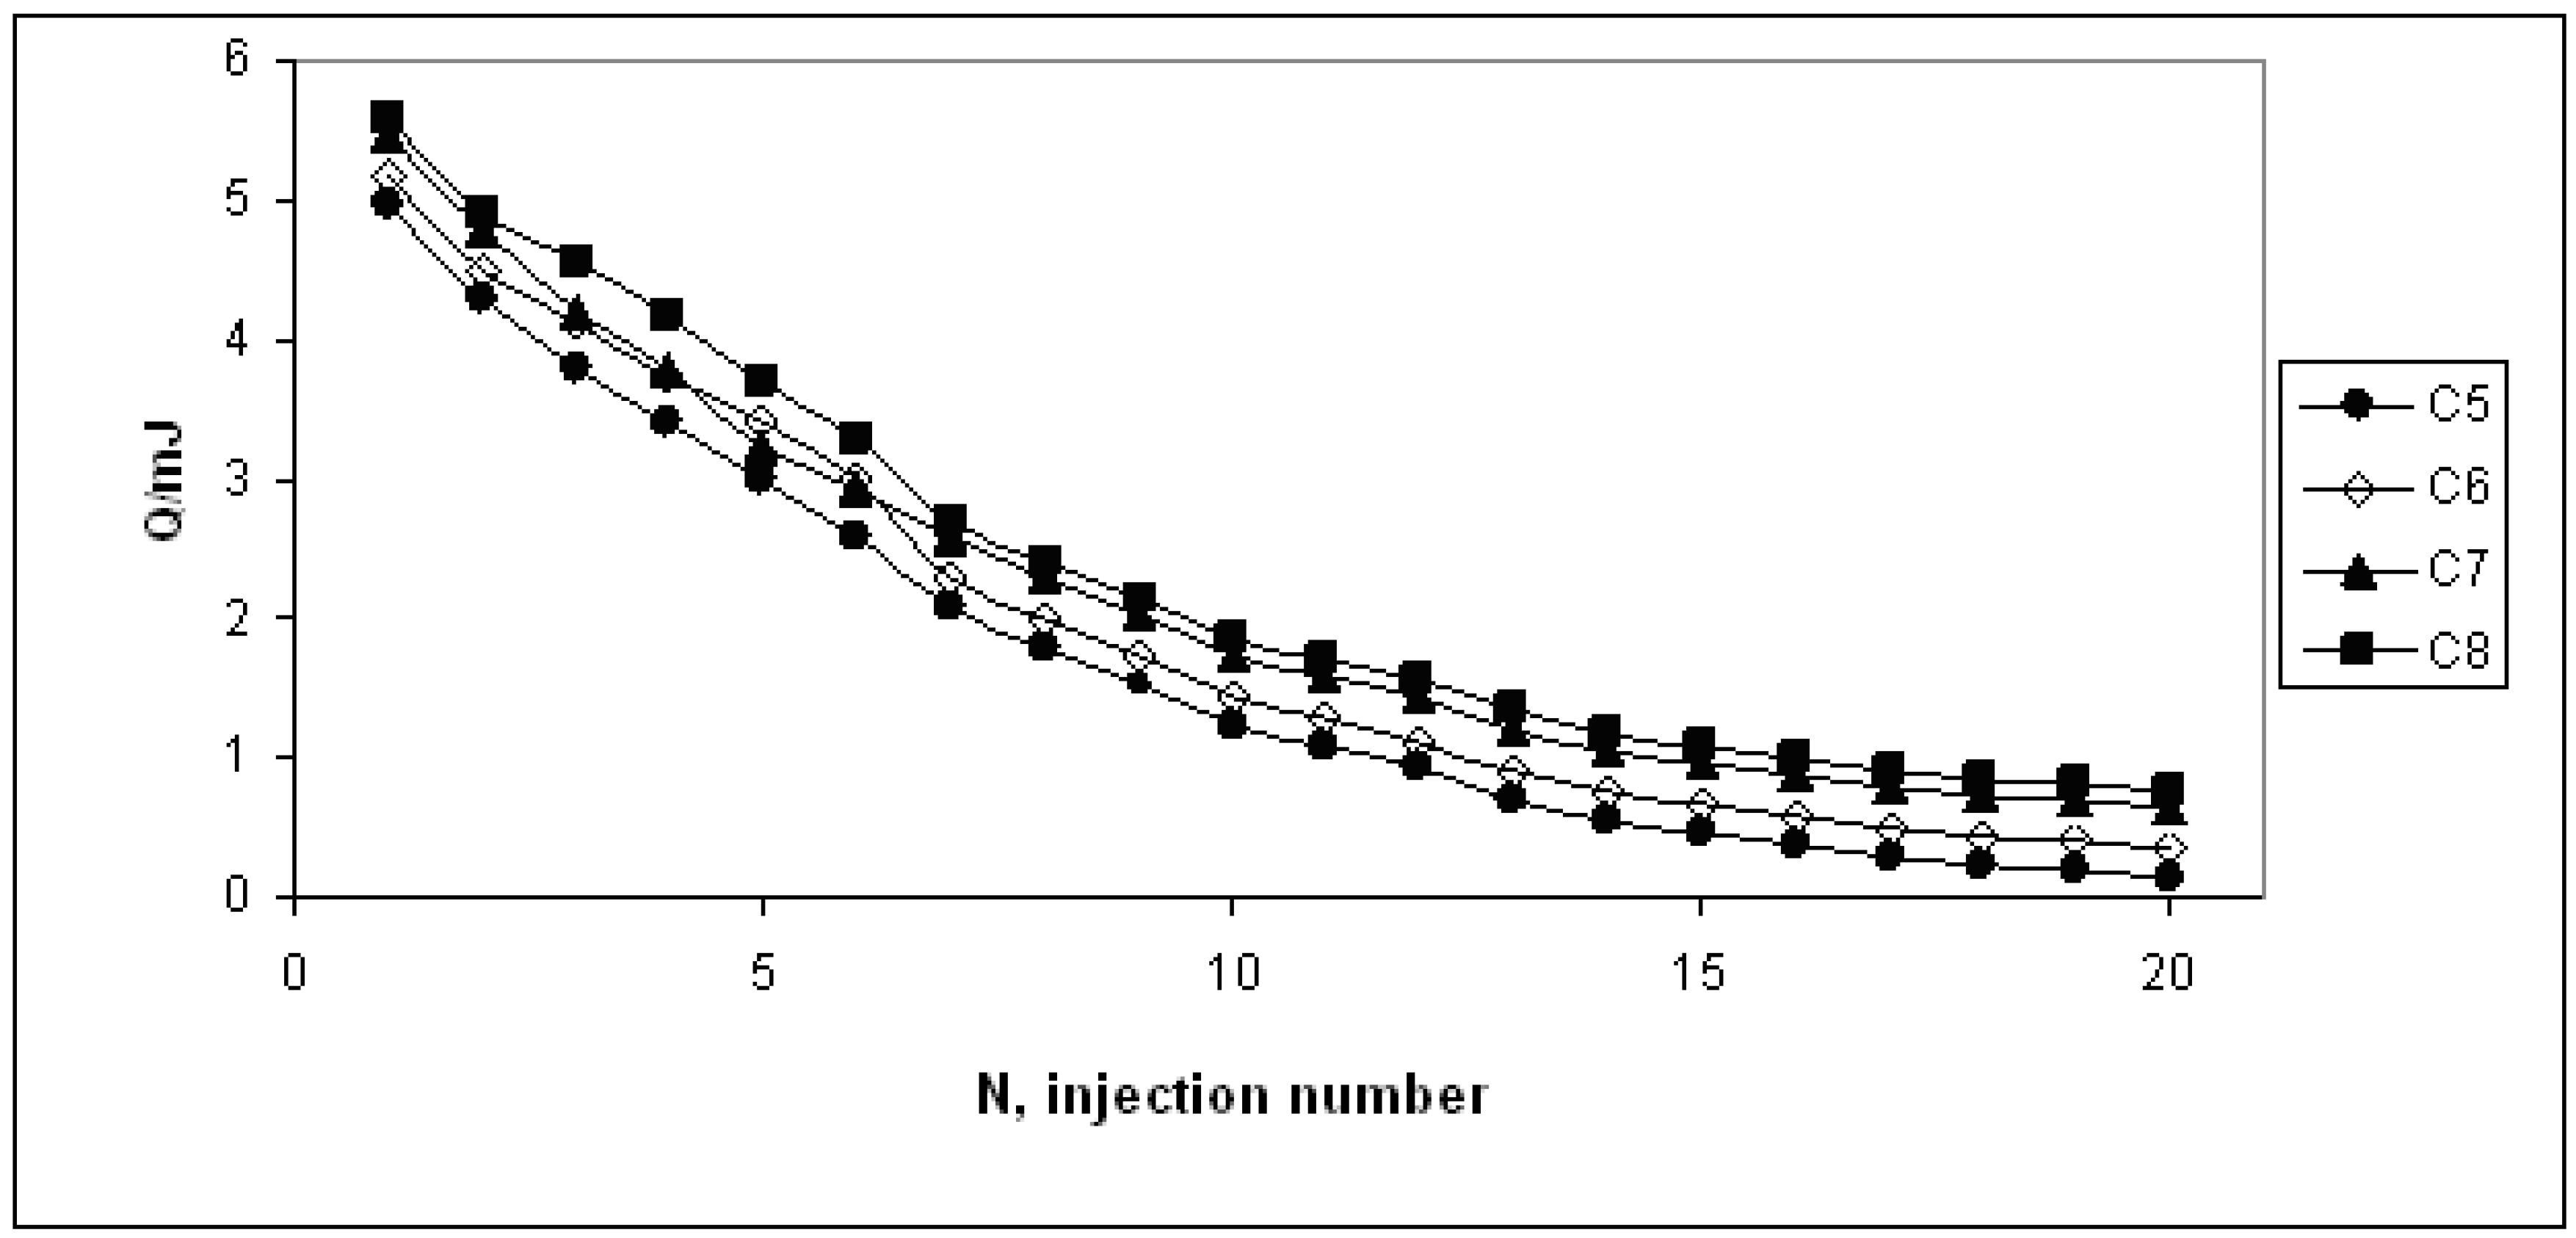
We have used an isoperibolic titration calorimeter to study the binding of a series of simple guest molecules (straight-chain alkane-1-ols, ROH) to α-cyclodextrin (α-CD). Figure 2 summarizes the results from a stepwise calorimetric titration experiment where aqueous solutions of pentan-1-ol to octan-1-ol were injected stepwise into an aqueous solution of α-CD at 298.15 K. The points show the heat quantities determined experimentally, Q, plotted against the injection number, N. A curve calculated by the use of values derived for K, and ΔH°, assuming a 1:1 binding model, eqn (8), is also shown
ROH + α-CD = α-CD.ROH
Figure 2. Heat evolution per injection, Q, plotted against injection number, N. The fitted lines are: ●pentan-1-ol, ◊ hexan-1-ol, ▲ heptan-1-ol, ■ octan-1-ol. ————, fitted lines.
Energies 01 00093 g002
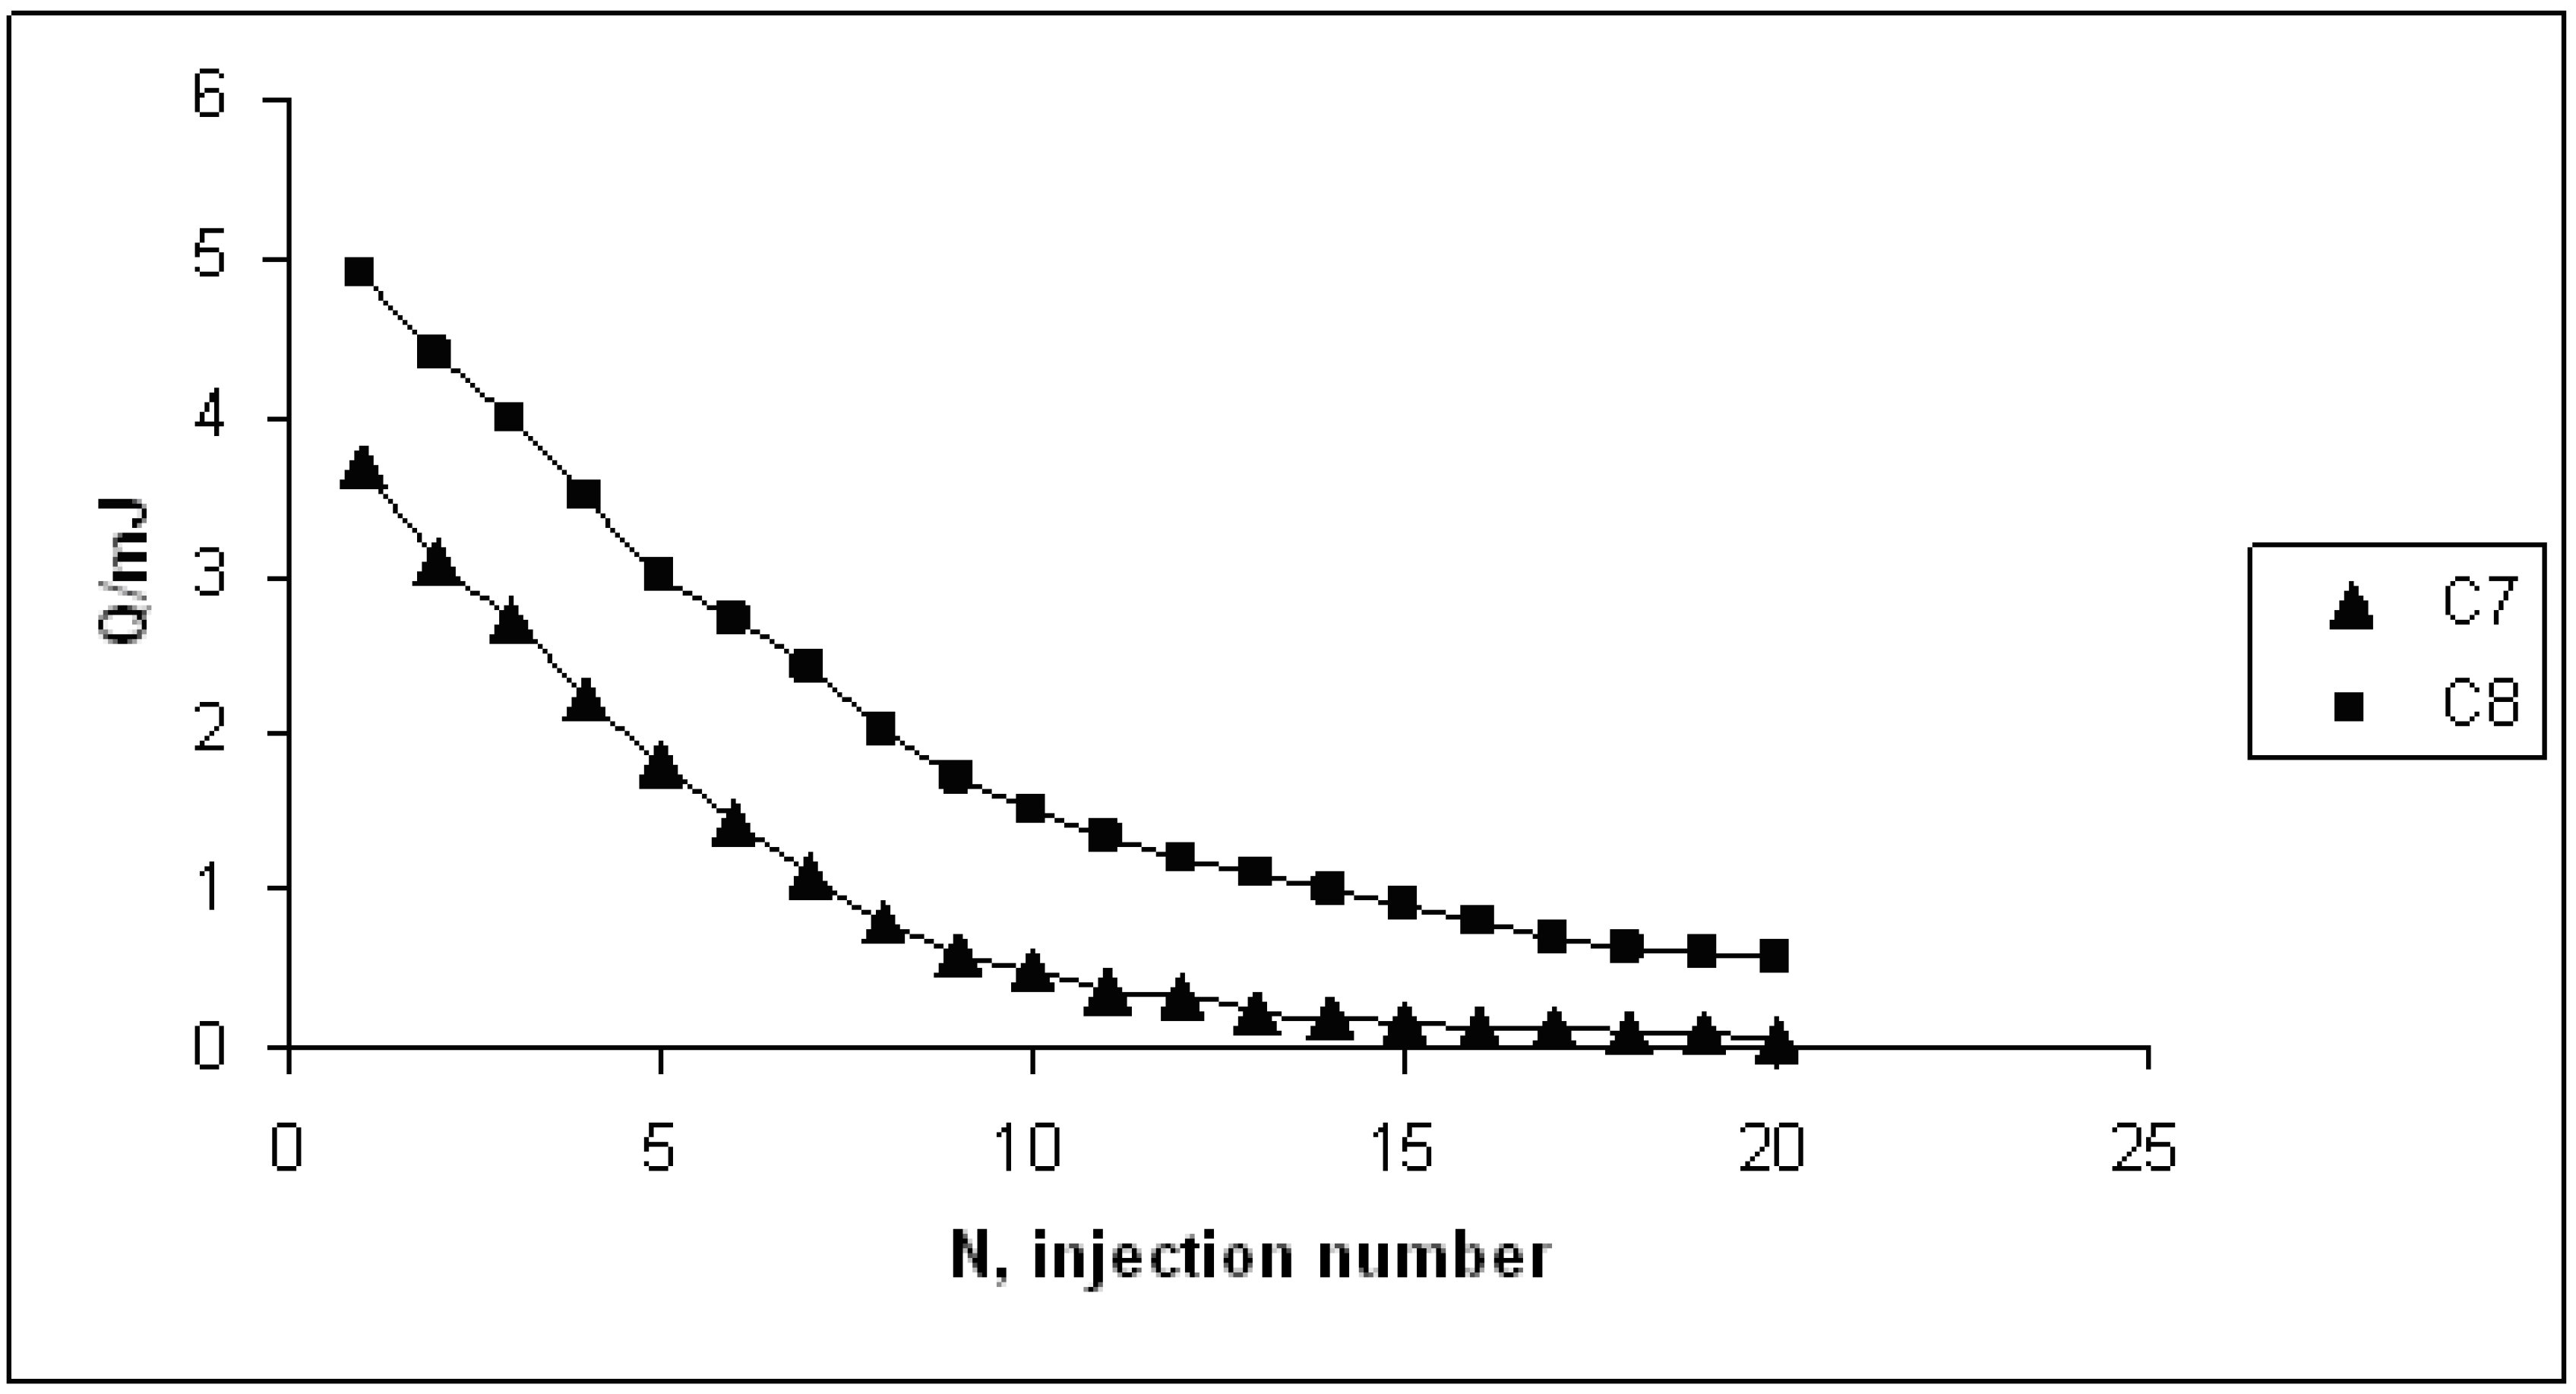
Good agreement is found between the experimental points and the curves, supporting the assumed binding model for the C5 - C8 alcohols, but this agreement does not prove that the assumed model is correct. For heptan-1-ol and octan-1-ol as guest molecules, the picture looks quite different (Figure 3). A clear systematic deviation is seen between the experimental points and the curve, which was again based on the assumption of the simple 1:1 binding model, eqn (8). However, the agreement between the experimental points and the curves would become satisfactory if the calculations were based on a model where 1:1 complexes are formed (Figure 4), but not for formation of 1:2 complexes, as other authors report in the literature [39, 40]. Due to the low solubility of heptan-1-ol and octan-1-ol in water, it was not possible to vary the ROH:α-CD ratio as desirable and the values obtained for the second complex were uncertain.
Figure 3. Heat evolution per injection, Q, plotted against injection number, N. The fitted lines for: ▲ heptan-1-ol, ■ octan-1-ol. ————, fitted lines.
Energies 01 00093 g003
Figure 4. Heat evolution per injection, Q, plotted against injection number, N. The fitted lines for: ▲ heptan-1-ol, ■ octan-1-ol. ————, fitted lines.
Energies 01 00093 g004
The profiles of Figure 2, Figure 3 and Figure 4 decay; i.e. the value of energy generated with the increasing number of injections of the corresponding alcohol is diminishing, which correlates with the interaction capacity between the alcohols and the cyclodextrins. Additionally, it is observed that the heat developed also correlates with to the chain length of the alcohol – shorter alcohol chains generate less heat.
Consequently, the complex composition (ROH.[α-CD]2, or [ROH]2.α-CD) could not be identified from a statistical point of view. However, from results of other studies with different types of long-chain guest molecules, it was concluded that complexes with two α-CD molecules and one guest molecule can be formed, in addition to the 1:1 complexes.
Experiments were conducted at different temperatures, 280.15 K, 288.15 K, 293.15 K, 298.15 K and 308.15 K. In Figure 5, Figure 6 and Figure 7, the derived thermodynamic results, ΔG°m, ΔH°m , ΔS°m and ΔCp° are plotted versus the number of carbon atoms in the alkan-1-ol molecules, nc. For a discussion of the obtained thermodynamic values, the majority of the simple symbols used in eqn (8) can be deceptive. A somewhat more realistic picture can be formulated, eqn (9), if we consider the binding process as the transfer of a fully solvated (hydrated) guest molecule to the binding site (presumably the cavity of the α-CD molecule):
(ROH)aq + (α-CD.n H2O)aq = (α-CD . (n-x)H2O.ROH)aq + x(H2O)aq
The binding (or the transfer) process then hypothetically can be thought as a multi-step reaction: (i) partial dehydration of ROH; (ii) solvation of the hydrocarbon chain by the (partially hydrophobic) medium in the α-CD cavity and release of some (x) water molecules; (iii) possibly some conformational change of the α-CD molecule; (iv) transformation of water molecules released from the cavity to form bulk water.
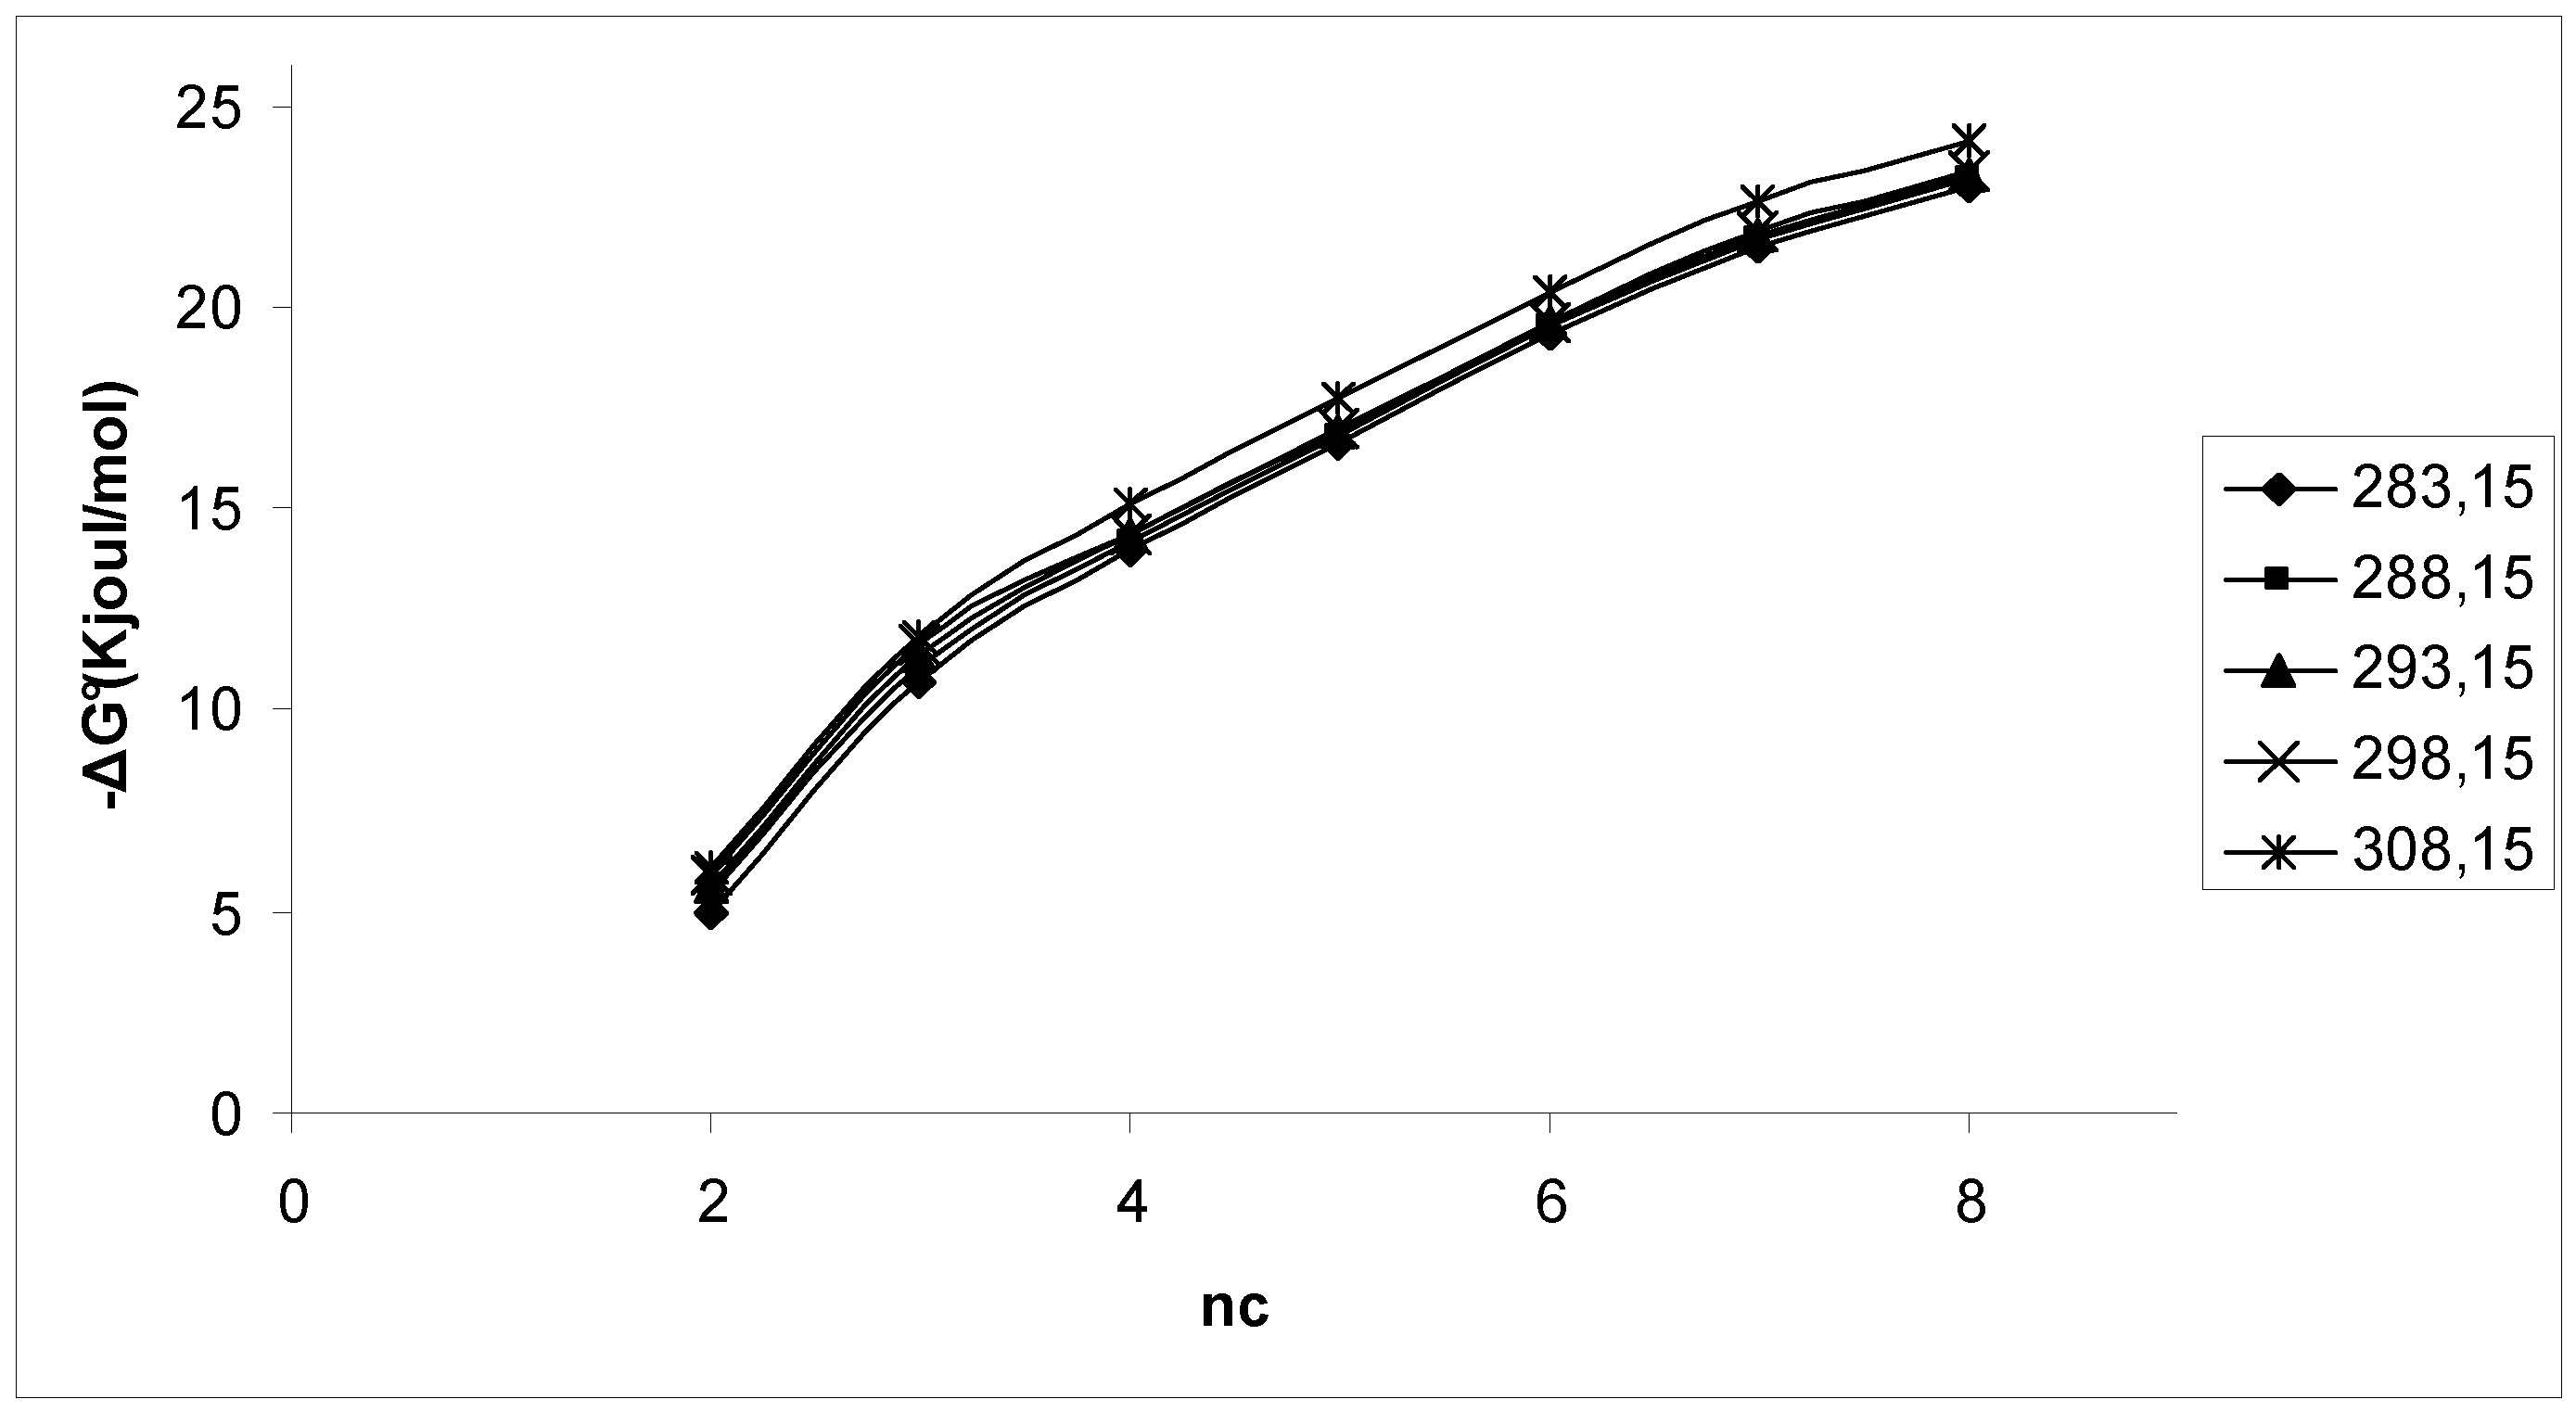
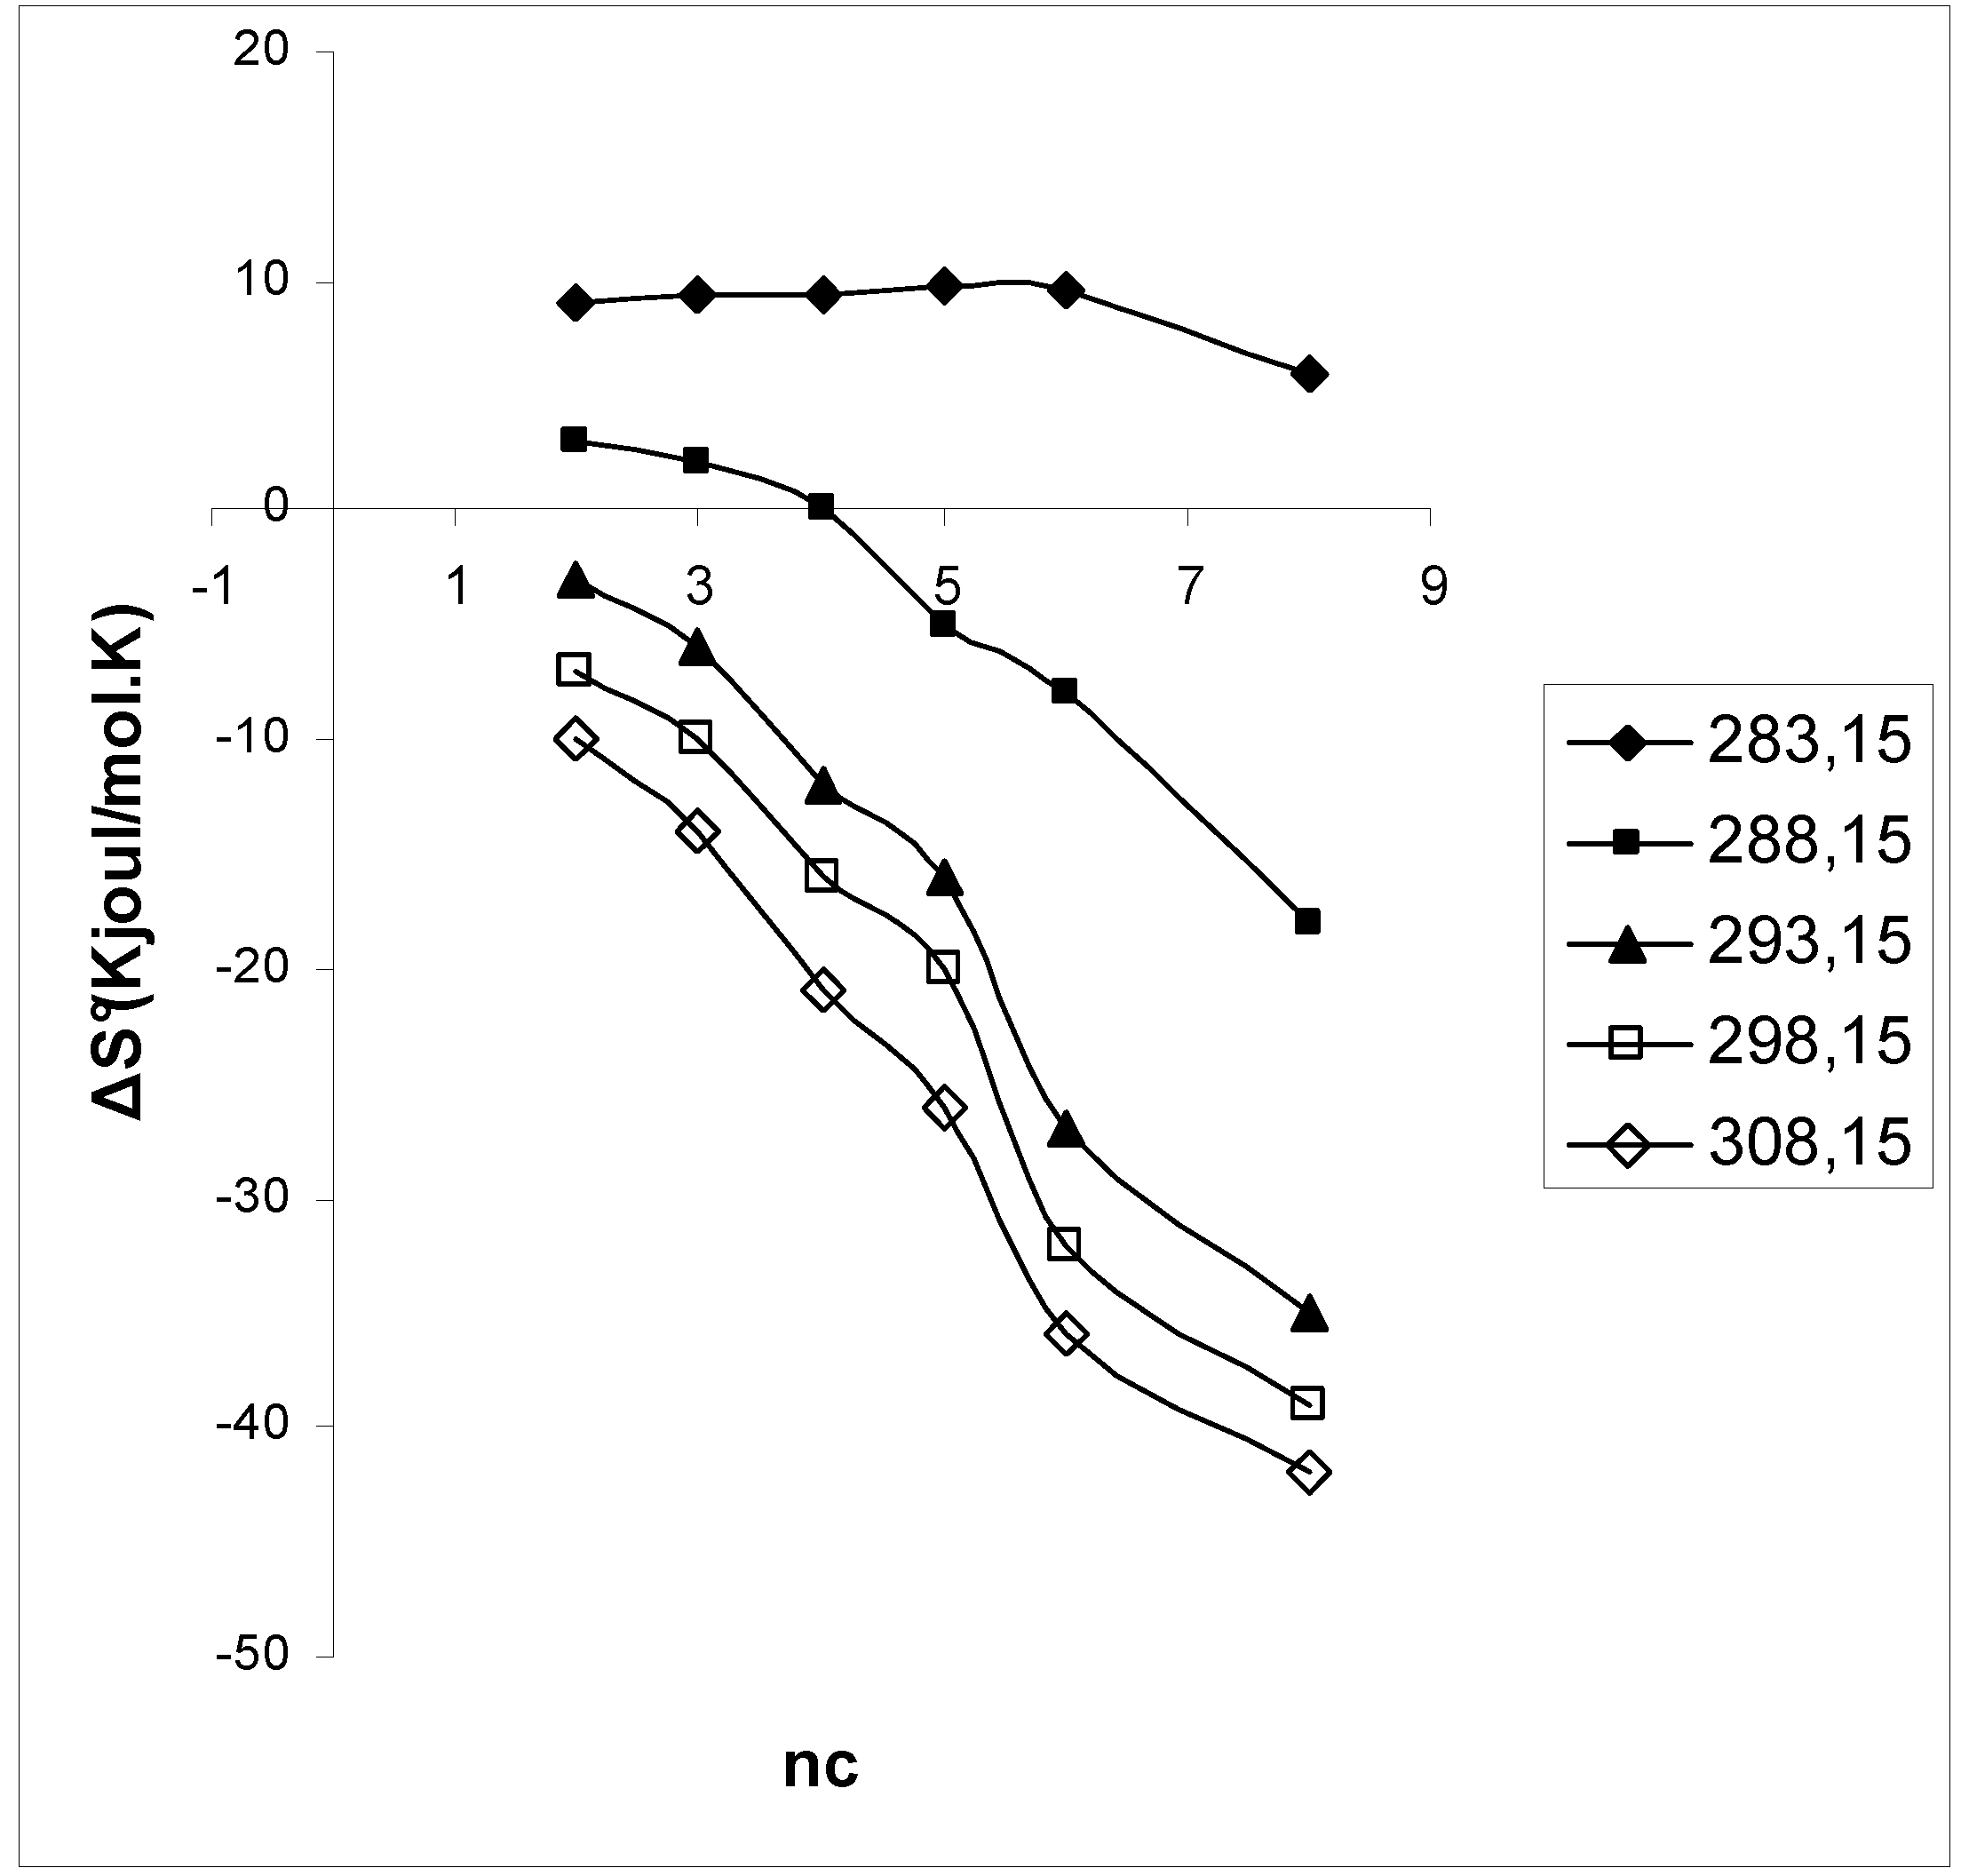
One can thus possibly expect that at least for heptan-1-ol or octan-1-ol, one methylene group will remain solvated by the bulk water and not take part in the process. Taken together, contributions (i) and (ii), usually called 'hydrophobic interaction', are often assumed to be the main driving force for the transfer of an alkyl group into a non-aqueous environment. Inspection of Figure 5, Figure 6 and Figure 7 shows that the ΔG°-values are essentially temperature independent within the temperature range investigated but that ΔH°- and ΔS°- values have large temperature dependence. Such results demonstrate the importance of conducting these kinds of experiments at several temperatures, otherwise the thermodynamic picture might appear to be far too simple. A wide experimental temperature range is also important from the point of view that such measurements will lead to ΔC°p-values eqn (2), which have proved to be particularly important for the transfer of hydrophobic groups between an aqueous solution and a non-aqueous phase, cf below.
From Figure 5 it is seen that the initially linear plot of -ΔG° against nc, change slope at nc= 5, which agrees with the depth of the cavity through the α-CD molecule. The CH-increment of the linear part is about 3 kJ.mol-1, which is a typical value for the transfer of a CH2-group from water to a liquid organic phase [40].
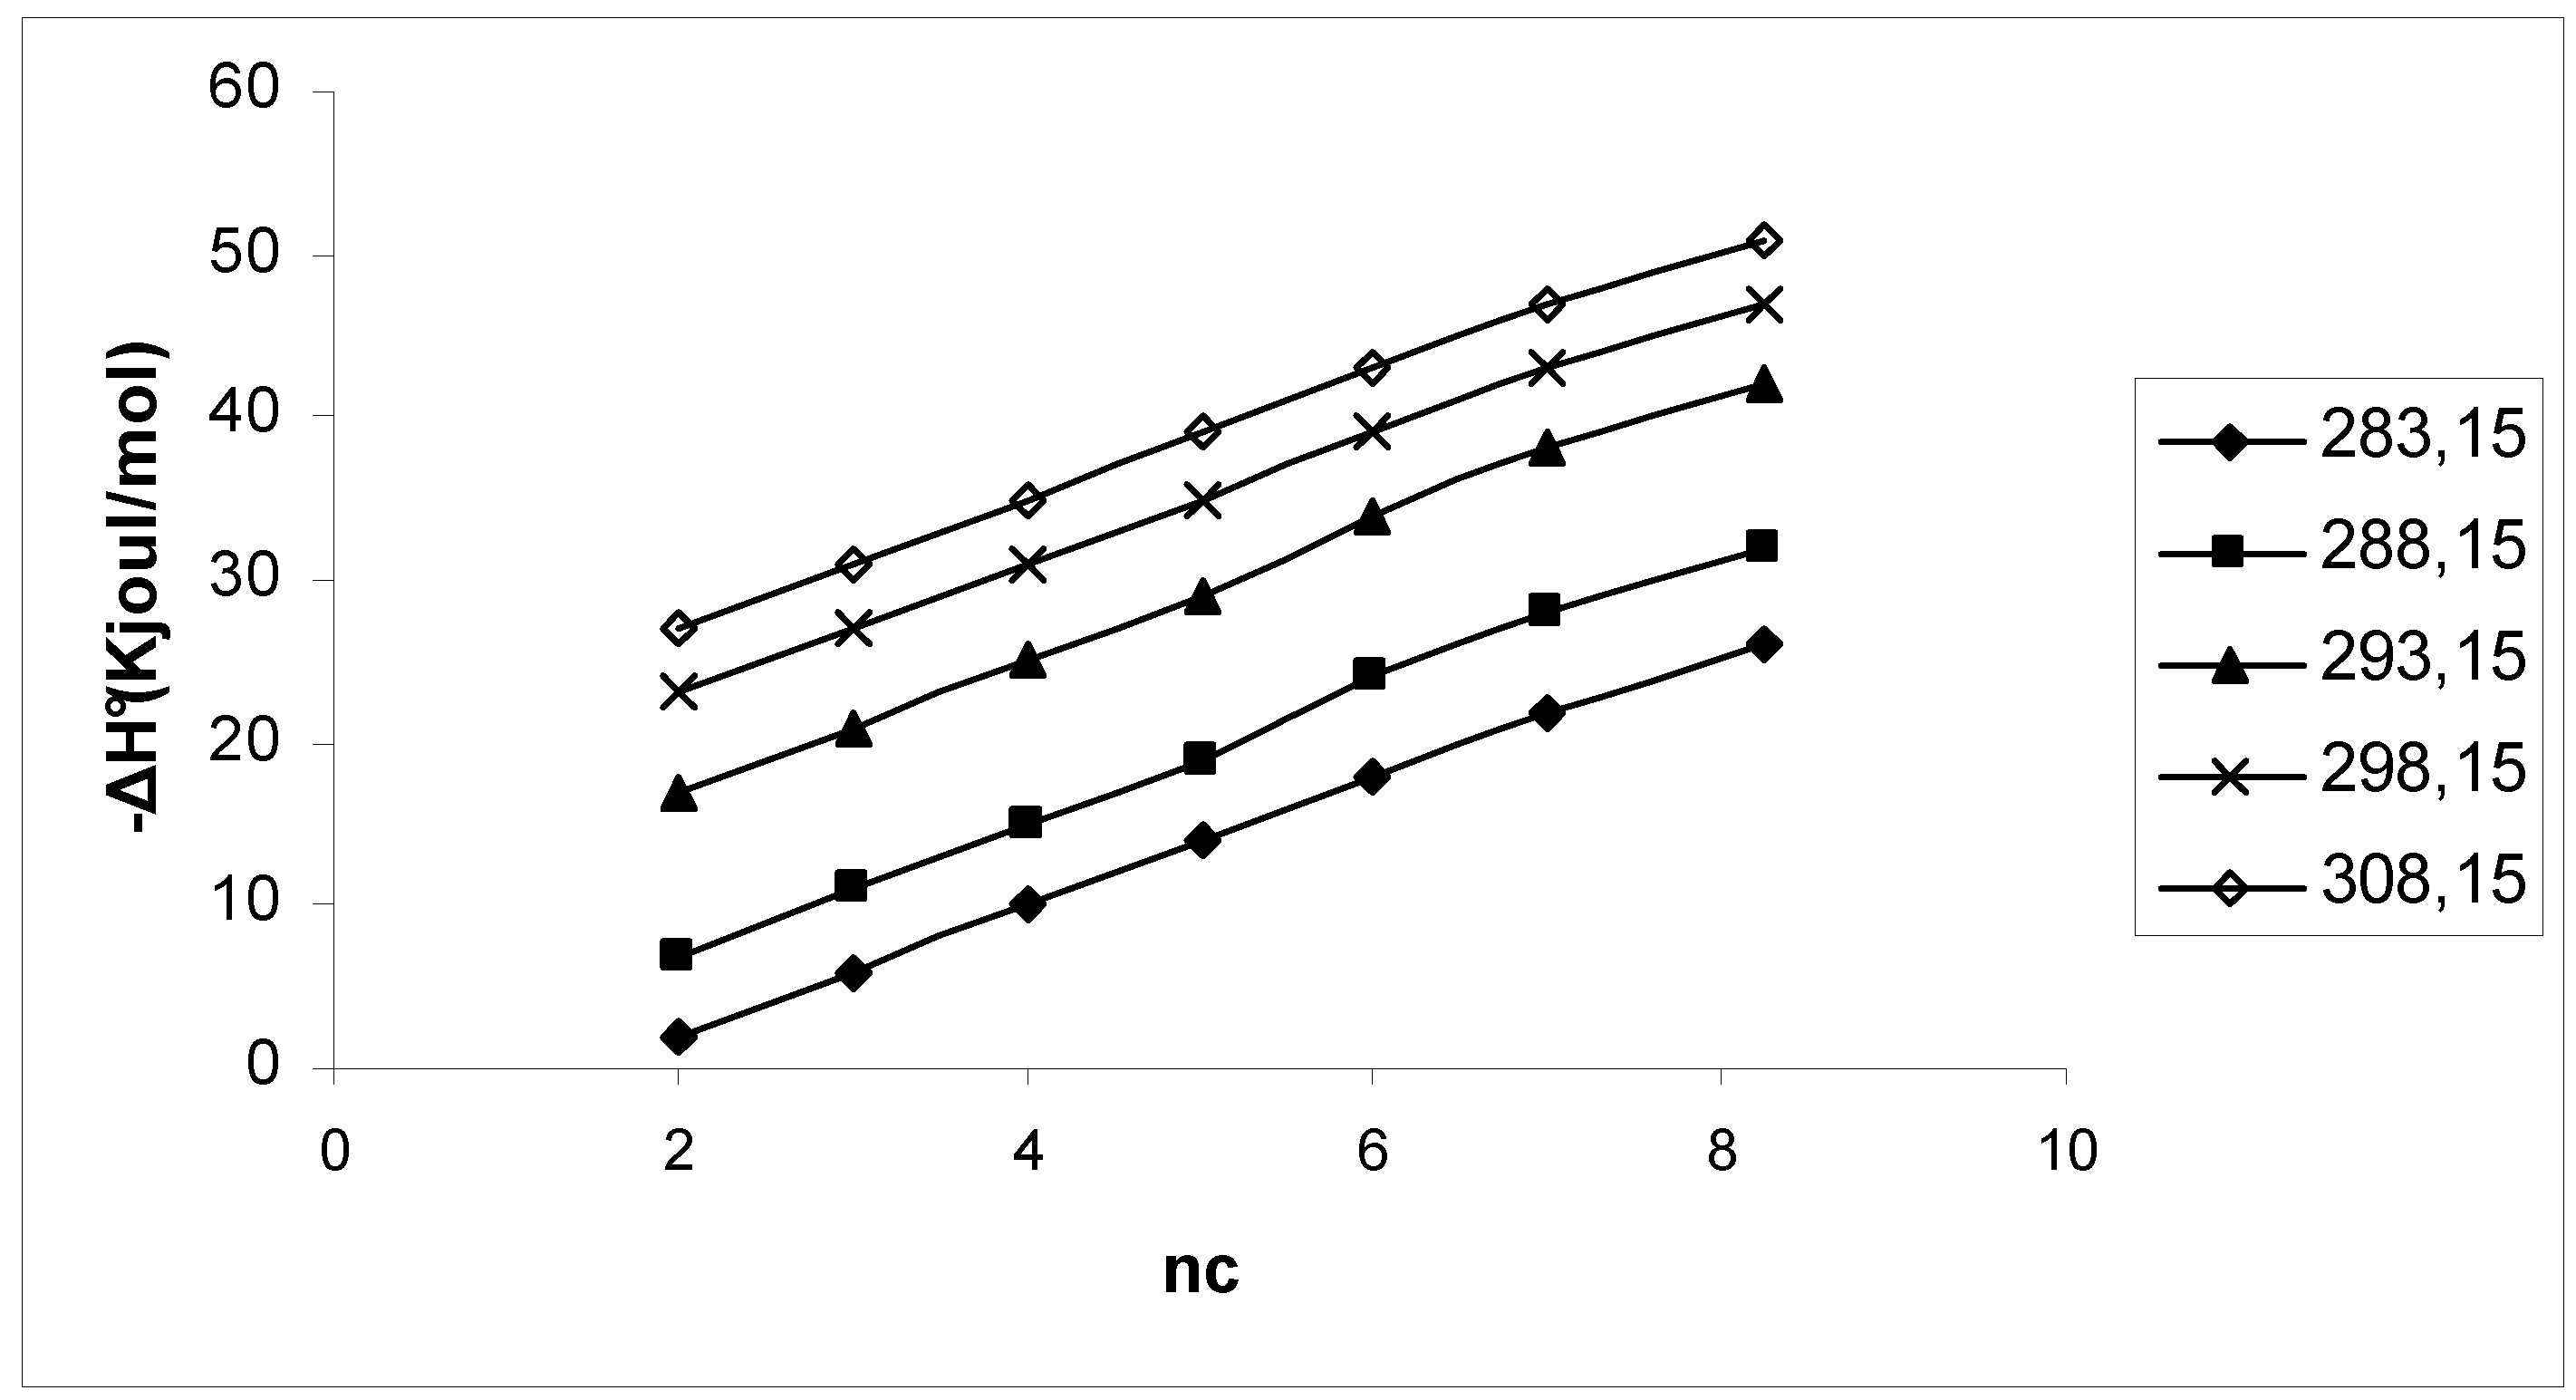
The enthalpy changes (Figure 6) also increase linearly but no stability effect is observed. The CH2 -increment is about 4 kJ.mol-1, which is high compared to CH2-increment values derived from calorimetric dissolution experiments on many series of organic liquids, typically ≤ 1.5 kJ.mol-1 [36,37,38,39,40,41].
For the whole temperature range investigated, the entropy change will increase with increasing chain length (Figure 7). This is in line with what is expected for a hydrophobic dehydration process. However, that effect is not expected to lead to the more pronounced negative CH2-increment observed for nc > 5 or 6.
As for many other ligand binding processes, we can observe a significant enthalpy - entropy compensation for this system, both with respect to temperature and structure (Figure 2, Figure 3, Figure 4, Figure 5 and Figure 6). The partial molar heat capacity for a hydrophobic compound (or corresponding contribution from a hydrophobic group) is much larger for aqueous solutions than for solutes in organic solvents (for example, a pure liquid organic compound). Thus we expect that the transfer of an alkane chain from aqueous solution to the medium provided by the cavity in α-CD will be accompanied by a large decrease in heat capacity for the system. This is in qualitative agreement with the experimental results, Figure 8. However, these results show a CH2-increment of about -100 J.K-1mol-1 whereas the value expected for the assumed transfer process is significantly less negative, about -50 to -60 J.K-1mol-1 [40].
Figure 5. ΔG° for the binding of alcohols to α-cyclodextrin against the number of carbon atoms, nc.
Energies 01 00093 g005
Figure 6. ΔH° for the binding of alcohols to α-cyclodextrin against the number of carbon atoms, nc.
Energies 01 00093 g006
Figure 7. ΔS° for the binding of alcohols to α-cyclodextrin against the number of carbon atoms, nc.
Energies 01 00093 g007
Figure 8. ΔCp° for the binding of alcohols to α-cyclodextrin against the number of carbon atoms, nc.
Energies 01 00093 g008

4. Conclusions

An isoperibolic titration calorimetric technique was used to conduct studies with α-CD and simple alkanols, determining that there is a decrease in the heat capacity of the system. This research shows that it is possible to study the interactions between macrocyclic compounds and alcohols by calorimetry. Such measurements frequently will lead not only to a value for the overall enthalpy change for the process but also to information about the binding stoichiometry and to values for the equilibrium constant(s) and corresponding molar changes of Gibbs energy, enthalpy and entropy. However, the influence of temperature and structural parameters is often poorly reflected in a series of ΔG°-values compared to corresponding values for ΔH° and ΔS°, for example. Solvation of the reaction components will often give very large contributions to the values for ΔH°, ΔS° and ΔC°p; of a ligand binding process.

Acknowledgements

The authors thank the Departments of Chemistry of Universidad Nacional de Colombia and Universidad de Los Andes (Colombia) by the Master Agreement established between these institutions. Special gratitude is extended to the Fondo Especial de Investigaciones de la Facultad de Ciencias de la Universidad de Los Andes (Colombia) for its partial financing. Additionally Prof. Moreno wants to especially thank the Universidad de los Andes for the assignation of a STAI (Semestre de Trabajo Académico Individual), which was partially used to do this research.

References

  1. Cramer, F.; Saenger, W.; Spatz, H.C. Inclusion Compounds. XIX.1a The Formation of Inclusion Compounds of α-Cyclodextrin in Aqueous Solutions. Thermodynamics and Kinetics. J. Am. Chem. Soc. 1967, 89, 14–20. [Google Scholar] [CrossRef]
  2. van Etten, R.L.; Sebastion, J.F.; Clowes, G.A.; Bender, M.L. Acceleration of phenyl ester cleavage by cycloamyloses. A model for enzymic specificity. J. Am. Chem. Soc. 1967, 89, 3242–3253. [Google Scholar]
  3. Straub, T.S.; Bender, M.L. Cycloamyloses as enzyme models. Decarboxylation of benzoylacetic acids. J. Am. Chem. Soc. 1972, 94, 8881–8892. [Google Scholar] [CrossRef]
  4. Griffths, D.W.; Bender, M.L. Substrate binding to cyclodextrins in aqueous solution. Adv. Catalysis 1973, 23, 209–214. [Google Scholar]
  5. Bergeron, R.J.; Channing, M.A.; Gibeily, G.J.; Pillor, D.M. Disposition requirements for binding in aqueous solution of polar substrates in the cyclohexaamylose cavity. J. Am. Chem. Soc. 1977, 99, 5146–5151. [Google Scholar] [CrossRef]
  6. Komiyama, M.; Bender, M.L. Importance of apolar binding in complex formation of cyclodextrins with adamantanecarboxylate. J. Am. Chem. Soc. 1978, 100, 2259–2267. [Google Scholar] [CrossRef]
  7. Tabushi, I.; Kiyosuka, Y.; Sugimoto, T.; Yamamura, K. Approach to the aspects of driving force of inclusion by .alpha.-cyclodextrin. J. Am. Chem. Soc. 1978, 100, 916–919. [Google Scholar] [CrossRef]
  8. Mcmillan, R.K.; Saenger, W.; Fayos, J.; Mootz, D. Topography of cyclodextrin inclusion complexes: Part I. Classification of crystallographic data of α-cyclodextrin inclusion complexes. Carbohydr. Res. 1973, 31, 37–46. [Google Scholar] [CrossRef]
  9. Hingerty, B.; Saenger., W. Disorder in a hydrophobic cage illustrated by X-ray structure of α-cyclodextrin ·methanol pentahydrate adduct. Nature 1975, 255, 395–397. [Google Scholar] [CrossRef]
  10. Manor, P.C.; Saenger, W. Topography of cyclodextrin inclusion complexes. III. Crystal and molecular structure of cyclohexaamylose hexahydrate, the water dimer inclusion complex. J. Am. Chem. Soc. 1974, 96, 3630–3639. [Google Scholar] [CrossRef]
  11. Saenger, W.; Steiner, T. Cyclodextrin Inclusion Complexes: Host-guest Interactions and Hydrogen-Bonding Networks. Acta Crystallogr. 1998, A54, 798–805. [Google Scholar] [CrossRef]
  12. Hingerty, B.; Saenger, W. Dimeric -cyclodextrin complexes may mimic membrane diffusion transport. Nature (London) 1975, 255, 396–407. [Google Scholar] [CrossRef]
  13. Hingerty, B.; Saenger, W. Topography of cyclodextrin inclusion complexes. 8. Crystal and molecular structure of the .alpha.-cyclodextrin-methanol-pentahydrate complex. Disorder in a hydrophobic cage. J. Am. Chem. Soc. 1976, 98, 3357–3365. [Google Scholar] [CrossRef]
  14. Lindner, K.; Saenger, W. Crystal structure of the γ-cyclodextrin n-propanol inclusion complex; Correlation of α-, β-, γ-cyclodextrin geometries Biochem. Biophys. Res. Commun. 1980, 92, 933–942. [Google Scholar] [CrossRef]
  15. Stezowsky, J.J.; Jogun, K.H.; Ekkle, E.; Bartels, I.S. Dimeric -cyclodextrin complexes may mimic membrane diffusion transport. Nature (London) 1978, 274, 617–625. [Google Scholar] [CrossRef]
  16. MacLennan, J.M.; Stezowski, J.J. The crystal structure of uncomplexed-hydrated cyclooctaamylose. Biochem. Biophys. Res. Commun. 1980, 92, 926–937. [Google Scholar] [CrossRef]
  17. Barone, G.; Castronuovo, G.; Elia, V.; Muscetta, M. Interaction of α-cyclodextrin with non electrolytes in water at 298.15 K. Thermochim. Acta 1985, 85, 447–450. [Google Scholar] [CrossRef]
  18. Barone, G.; Castronuovo, G.; Elia, V.; Muscetta, M. Interaction of urea and urea derivatives with cyclohexamylose in aqueous solutions at 25°C. J. Solut. Chem. 1986, 15, 129–140. [Google Scholar] [CrossRef]
  19. Lewis, E.A.; Hansen, L.D. Thermodynamics of binding of guest molecules to α- and β-cyclodextrins. J. Chem. Soc., Perkin Trans. 2 1973, 2081–2085. [Google Scholar]
  20. Maeda, M.; Tokagi, S. Calorimetric studies on molecular inclusion. Gibbs energies and entropies of inclusion of 1-propanol and 1-pentanol into cyclohexaamylose and cycloheptaamylose in aqueous solutions at 298.15K. Netsusokutei 1983, 10, 103–118. [Google Scholar]
  21. McMillan Jr., W.G.; Mayer, J.E. The Statistical Thermodynamics of Multicomponent Systems. J. Chem. Phys. 1945, 13, 276–287. [Google Scholar] [CrossRef]
  22. Kozak, J.J.; Knight, W.S.; Kauanann, W. Solute-Solute Interactions in Aqueous Solutions. J. Chem. Phys. 1945, 48, 675–690. [Google Scholar] [CrossRef]
  23. Friedman, H.L.; Krishnan, C.V. Studies of hydrophobic bonding in aqueous alcohols: Enthalpy measurements and model calculations. J. Solut. Chem. 1973, 2, 119–140. [Google Scholar] [CrossRef]
  24. Lilley, T.H.; Scott, R.P. Aqueous solutions containing amino-acids and peptides. Part 2.—Gibbs function and enthalpy behaviour of the systems urea + glycine, urea +-alanine, urea +-aminobutyric acid and urea + glycylglycine at 298.15 K. J. Chem. Soc., Faraday Trans. 1 1976, 72, 184–193. [Google Scholar] [CrossRef]
  25. Franks, F.; Pedley, M.D.; Reid, D.S. Solute interactions in dilute aqueous solutions. Part 1.—Microcalorimetric study of the hydrophobic interaction. J. Chem. Soc., Faraday Trans. 1 1976, 72, 359–362. [Google Scholar] [CrossRef]
  26. Desnoyers, J.E.; Perron, G.; Avedikian, L.; Morel, J-P. Enthalpies of the urea-tert-butanol-water system at 25°C. J. Solut. Chem. 1976, 5, 631–644. [Google Scholar] [CrossRef]
  27. Savage, J.J.; Wood, R.H. Enthalpy of dilution of aqueous mixtures of amides, sugars, urea, ethylene glycol, and pentaerythritol at 25°C: Enthalpy of interaction of the hydrocarbon, amide, and hydroxyl functional groups in dilute aqueous solutions. J. Solut. Chem. 1976, 5, 733–750. [Google Scholar] [CrossRef]
  28. Barone, G.; Cacace, P.; Castronuovo, G.; Elia, V. Interactions in aqueous solutions of urea-like compounds. Heats of mixing of urea, monomethylurea and thiourea at 298.15 K. J. Chem. Soc., Faraday Trans. I 1988, 77, 1569–1574. [Google Scholar] [CrossRef]
  29. King, E.J. Acid Base Equilibria, 1rd Ed. ed; Pergamon Press: Oxford, England, 1965; pp. 184–217. [Google Scholar]
  30. Sigurskjold, B.W.; Berland, C.R.; Svensson, B. Thermodynamics of Inhibitor Binding to the Catalytic Site of Glucoamylase from Aspergillus niger Determined by Displacement Titration Calorimetry. Biochemistry 1994, 33, 101–110. [Google Scholar] [CrossRef]
  31. Danil de Namor, A.F.; Traboulssi, R.; Lewis, D.F.V. Host properties of cyclodextrins towards anion constituents of antigenic determinants. A thermodynamic study in water and in N,N-dimethylformamide. J. Am. Chem. Soc. 1990, 112, 8442–8447. [Google Scholar] [CrossRef]
  32. Hallen, D.; Wadso, I. Solution microcalorimetry. Pure Appl. Chem. 1989, 61, 123–132. [Google Scholar] [CrossRef]
  33. Hallen, D.; Nilsson, S.O.; Wadso, I. A new flow-microcalorimetric vessel for dissolution of small quantities of easily or slightly soluble liquids. J. Chem. Thermodyn. 1989, 21, 529–534. [Google Scholar] [CrossRef]
  34. Dec, S.F.; Gill, S.J. Steady-state gas dissolution flow microcalorimeter for determination of heats of solution of slightly soluble gases in water. Rev. Sci. Instrum. 1984, 55, 765–772. [Google Scholar] [CrossRef]
  35. Hallen, D.; Wadso, I. A new microcalorimetric vessel for dissolution of slightly soluble gases enthalpies of solution in water of carbon tetrafluoride and sulphur hexafluoride at 288.15, 298.15, and 308.15 K. J. Chem. Thermodyn. 1989, 21, 519–528. [Google Scholar] [CrossRef]
  36. Nilsson, S.O.; Wadso, I. A flow-microcalorimetric vessel for solution of slightly soluble solids. J. Chem. Thermodyn. 1986, 18, 1125–1133. [Google Scholar] [CrossRef]
  37. Murphy, K.P.; Gill, S.J. Calorimetric measurement of the enthalpy of dissolution of diketopiperazine in water as a function of temperature. Thermochim. Acta 1989, 139, 279–285. [Google Scholar] [CrossRef]
  38. Wadso, I. Isothermal microcalorimetry for the characterization of interactions between drugs and biological materials. Thermochim. Acta 1995, 267, 45–49. [Google Scholar] [CrossRef]
  39. Suurkuusk, J.; Wadso, I. Multichannel Microcalorimetry. Chem. Scripta 1982, 20, 155–161. [Google Scholar]
  40. Hallen, D.; Schbn, A.; Shehatta, I.; Wadso, I. Microcalorimetric titration of -cyclodextrin with some straight-chain alkan-1-ols at 288.15, 298.15 and 308.15 K. J. Chem. Soc. Faraday Trans. 1992, 88, 2859–2866. [Google Scholar] [CrossRef]
  41. Bastos, M.; Briggner, L.-E.; Shehatta, I.; Wadso, I. The binding of alkane-α,ω-diols to α-cyclodextrin. A microcalorimetric study. J. Chem. Thermodyn. 1990, 22, 1181–1190. [Google Scholar] [CrossRef]