Article

Nanostructure and Oxidation Reactivity of Nascent Soot Particles in Ethylene/Pentanol Flames

1
MIIT Key Laboratory of Thermal Control of Electronic Equipment, School of Energy and Power Engineering, Nanjing University of Science and Technology, Nanjing 210094, China
2
Advanced Combustion Laboratory, School of Energy and Power Engineering, Nanjing University of Science and Technology, Nanjing 210094, China
*
Author to whom correspondence should be addressed.
These authors contributed equally to this work.
Energies 2017, 10(1), 122; https://doi.org/10.3390/en10010122
Submission received: 23 September 2016 / Revised: 10 January 2017 / Accepted: 12 January 2017 / Published: 19 January 2017

Abstract

:
As byproducts of the combustion process of hydrocarbon fuels, soot particles are difficult to remove, and they can greatly harm human health and pollute the environment. Therefore, the formation and growth processes of the soot particles has become a study focus of researchers. In this paper, the nanostructure and oxidation reactivity of carbonaceous particles collected from ethylene inverse diffusion flames with or without the additions of three pentanol isomers (1-pentanol, 3-methyl-1-butanol, and 2-methyl-1-butanol) were investigated in detail. The nanostructure and oxidation characteristics of nascent soot particles were characterized using high resolution transmission electron microscopy (HRTEM), X-ray diffractometry (XRD) and thermogravimetric analysis (TGA). It was found that the nascent soot cluster of pure ethylene flame had a loose structure, while the additions of pentanol isomers made the soot agglomerates more compact and delayed the growth of graphitic structures. The pentanol isomer additions also contributed to a higher disorder of the crystallite arrangement in the soot nanostructure. According to the TGA experiments, the results showed that the addition of pentanol isomers enhanced the oxidation reactivity of soot particles, which could help to reduce soot particle emissions.

1. Introduction

Soot particles formed in a combustion process are important for their contribution to increase heat transfer and hence combustion efficiency, their industrial applications as pigments and tire additives, and their capacity to clog flow passages, etc. [1]. However, as one of the combustion emissions of hydrocarbon fuels and the main source of suspended submicron particles [2,3], soot particles cause great harm to human health and the environment, and consequently a thorough solution to this air pollution source is urgently needed.
By using elemental analysis, it can be known that the complete combustion products of hydrocarbon fuels are water and carbon dioxide. However, in view of the complexity of the actual process of combustion, complete combustion cannot be achieved in most cases. Thus, in addition to water and carbon dioxide, the combustion products also contain carbon monoxide, unburnt fuel and soot particles, which are the byproducts of complex physical and chemical processes [1,4,5,6]. Highly accurate measurements of concentration and temperature fields are helpful to the study of soot formation characteristics. Huang et al. [7] carried out an intensive study on the reconstruction model of the concentration and temperature field of soot in an asymmetric diffusion flame. Liu et al. [8,9] used a charge-coupled device (CCD) camera and a reconstruction model to reconstruct the three dimensional fields of temperature and concentration based on a regional reconstruction method.
In the past few decades, there have been a large number of experimental and theoretical studies showing that polyacetylene, ionic substances and polycyclic aromatic hydrocarbons (PAHs) may be the gaseous molecular precursors of soot. As the research further developed, PAHs have been accepted as the main precursors of soot particles [1,4,5,6,10].
An early study focusing on the gaseous precursors of particles was performed by Dobbins et al. [11]. They studied the chemical evolution of the combustion in the center of the normal diffusion flame of ethylene by means of laser microprobe mass spectrometry, and found the molecular forms of PAHs in the precursors of the soot particles. Wang et al. [12] studied the growth mechanism and synergistic effect of PAHs in counterflow flames of hydrocarbon fuels and improved the formation mechanism of PAHs. The results showed that a synergistic effect was more obvious in larger PAH molecules, which was proved by experimental observations.
The physicochemical properties of soot particles depend largely on the combustion conditions. A recent study found that the blended fuel based on the different fuel physical and chemical characteristics had good emission characteristics and high economic performance [13]. Compared with the pure hydrocarbon fuel combustion, the premixed combustion of the premixed oxygenated biomass fuel showed a beneficial effect on the primary particle emissions [14,15]. Furthermore, the influence of various additives in diffusion flames on soot formation has been extensively studied [16,17,18]. Zelepouga et al. [19] investigated the effect of acetylene and PAHs addition on soot formation in non-premixed, axisymmetric, co-flowing methane flames with oxygen and oxygen-enriched air, and found that all additives promoted soot formation and the PAHs addition was more significant. Oxygenate-containing biofuels, such as bio-alcohols, can be produced from cellulosic biomass through biochemical conversion processes [20]. These bio-alcohols are shown to have an effect on reducing particulate emissions [21,22]. The effects of ethanol as a fuel additive on the particulate emissions of diesel engines have been widely studied [23,24,25]. Venkateswarlu et al. [26] used 2-methyl-1-propanol as an additive for biodiesel and diesel-blended fuel, and found that 2-methyl-1-propanol addition significantly decreased the combustion emissions of CO and soot. Moreover, higher carbon chain bio-alcohols, such as butanols and pentanols, have received much interest. Pentanol has similar physical properties as diesel fuel and higher energy density and cetane number than ethanol and butanol [27]. As a result, pentanol seems to be a more promising fuel additive to reduce soot formation in practical applications. Wei et al. [28] compared the combustion and exhaust characteristics of different mixed proportion (10%~30%) of diesel/pentanol mixed fuels in a four cylinder diesel engine. The results showed that adding pentanol could decrease the mass concentration and number concentration of soot particles. Li et al. [29] revealed that soot emissions decreased obviously with the addition of pentanol to diesel and biodiesel fuels in a single-cylinder direct-injection diesel engine. Rajesh Kumer and Saravanan [30] investigated the effects of blending n-pentanol with diesel on the performance and emission characteristics of a diesel engine with exhaust gas recirculation (EGR), and they found that a simultaneous decrease in smoke emissions and NOx could be attained by the combination of pentanol/diesel blends and a medium EGR rate. Zhu et al. [31] conducted a study on a diesel engine fueled with biodiesel-pentanol blends to obtain the combustion, gaseous and particulate emissions under different engine loads. The results revealed that the particle mass and number concentrations were reduced when pentanol was added to biodiesel.
The above review shows that the pentanol additive had an effect on soot reduction and investigations on the application of pentanol have mainly concentrated on diesel engines, especially on its influence on particulate emissions. However, there are very few detailed studies concerning soot nanostructure and oxidation characteristics of nascent soot particles in the combustion of pentanol-doped blended fuels from the basic scientific view and fundamental flame experimental devices. Therefore, the main goal of this study was to investigate the effect of pentanol addition on soot nanostructure and oxidation reactivity based on the fundamental inverse diffusion flame platform and a basic scientific view. Structural and reactive analyses were performed on the generated nascent soot particles. Furthermore, the relationship between soot nanostructure and reactivity with respect to the soot from pentanol-doped flames were studied. Combustion experiments on nanostructure and oxidation reactivity of nascent soot in ethylene inverse diffusion flames with the additions of three pentanol isomers (1-pentanol, 3-methyl-1-butanol, and 2-methyl-1-butanol) were carried out in this paper. The structure and reactivity characteristics were studied by using high resolution transmission electron microscopy (HRTEM), X-ray diffraction (XRD) and thermogravimetric analysis (TGA).

2. Experimental

2.1. Experimental System

The combustion sampling system used was mainly composed of an inverse diffusion flame (IDF) burner, a fuel supply subsystem, a fuel evaporation subsystem and a soot particle sampling subsystem, as shown in Figure 1. In the IDF burner, the oxidizer was ejected from the central tube surrounding by fuel in the coaxial interlayer region, and nitrogen was ejected from the outer tube as protective gas to maintain the stability of the combustion flame. The fuel supply system consisted of fuel gas (ethylene with 99.95% purity as the main fuel with or without pentanol as the mixing fuel), oxidizer (air with 99.999% purity), carrier gas (N2 with 99.999% purity) and protective gas (N2 with 99.999% purity). The physical properties [32] and information about the three isomers of pentanol are listed in Table 1. The gases were controlled by mass flow controllers (CS200A, Sevenstar, Beijing, China) and the liquid fuels were delivered by a precise pump (Minipuls Evolution, Gilson S.A.S., Paris, France). The liquid pentanol isomers were heated and evaporated before entering the fuel supply system to be mixed with ethylene.
An evaporator was connected to the initial section of the fuel pipeline where the pentanol fuel was heated and evaporated, and then the pentanol vapor was mixed with the ethylene gas. Connected with the temperature control box, the heating belt was used for heating the fuel gas in the pipeline. Thermocouples were laid on the wall of the pipes for measuring the temperature, and the heating temperature was set at 170 °C. The preheating was also adopted for pure ethylene inverse diffusion flame to maintain the same boundary conditions in all the flames.

2.2. Experimental Details

The experimental conditions were summarized in Table 2. All flames were tested at a fuel mixing ratio of 15 vol% and the three pentanol isomers were individually added into the ethylene. The mixed fuel flow rate at the burner exit was controlled by the gas flowing into the pipeline.
The soot particles were collected using a high temperature quartz plate. The quartz plate was 5 mm thick with a diameter of 50 mm. The sampling height was set at 30 mm above the burner mouth and the plate was horizontally inserted like a pendulum. The collecting time lasted for 30 min. As a result, about 15 mg of soot particles were sampled onto the quartz surface which was kept cool by water circulating. It was noted that the interference caused by quartz plate to the shape of flame was very trifling. To investigate whether the collection time by the quartz plate would influence the soot morphology, samples were also collected for 60 s at the same position by the same collection method. The images of soot morphology and nanostructure were presented in Figures S1 and S2 in the Supplementary Materials, and no obvious differences in the soot structure between the samples collected in 60 s to that of the 30 min in the quartz plate were found, which illustrated that the collection time did not greatly influence the soot structural characteristics.
To better understand the soot morphology and nanostructure and the changes resulting from addition of the three pentanol isomers to ethylene, TEM analyses were carried out directly using soot collected by the quartz plate method just before the TGA experiments in order to establish closer and better relationships between the general soot nanostructure and oxidation reactivity. The TEM/HRTEM images of the soot particles were obtained using a Tecnai G2 F30 S-TWIN (Field Emission Inc., Hillsboro, ND, USA) field emission scanning transmission electron microscope (TEM) operated at 200 kV with 0.24 nm point resolution. The samples were prepared by ultrasonicating the particles in ethanol for 60 min, and then one or two drops of the suspension were dropped to the carbon film coated lacey grids (200 mesh).
The crystallite parameters of soot particles were determined using a D8 Advance X-ray diffractometer (Bruker, Karlsruhe, Germany) with Cu Kα radiation (1.5418 Å, 45 kV, 25 mA). The scan range of 10°–110° was used with scan step size of 0.02° and scan speed of 0.2 s/step.
To study the oxidation reactivity of the soot particles, an STA 449 F3 thermogravimetric analyzer (Netzsch, Selb, Germany) with recording software was used. The soot samples were initially heated up in a flow of Ar (100 mL/min) from 50 to 300 °C and kept for 60 min. Then the samples were heated up to 500 °C. Subsequently, the Ar flow was replaced with a mixture flow (22% O2 and 78% Ar) at a constant rate of 100 mL/min.

3. Results and Discussion

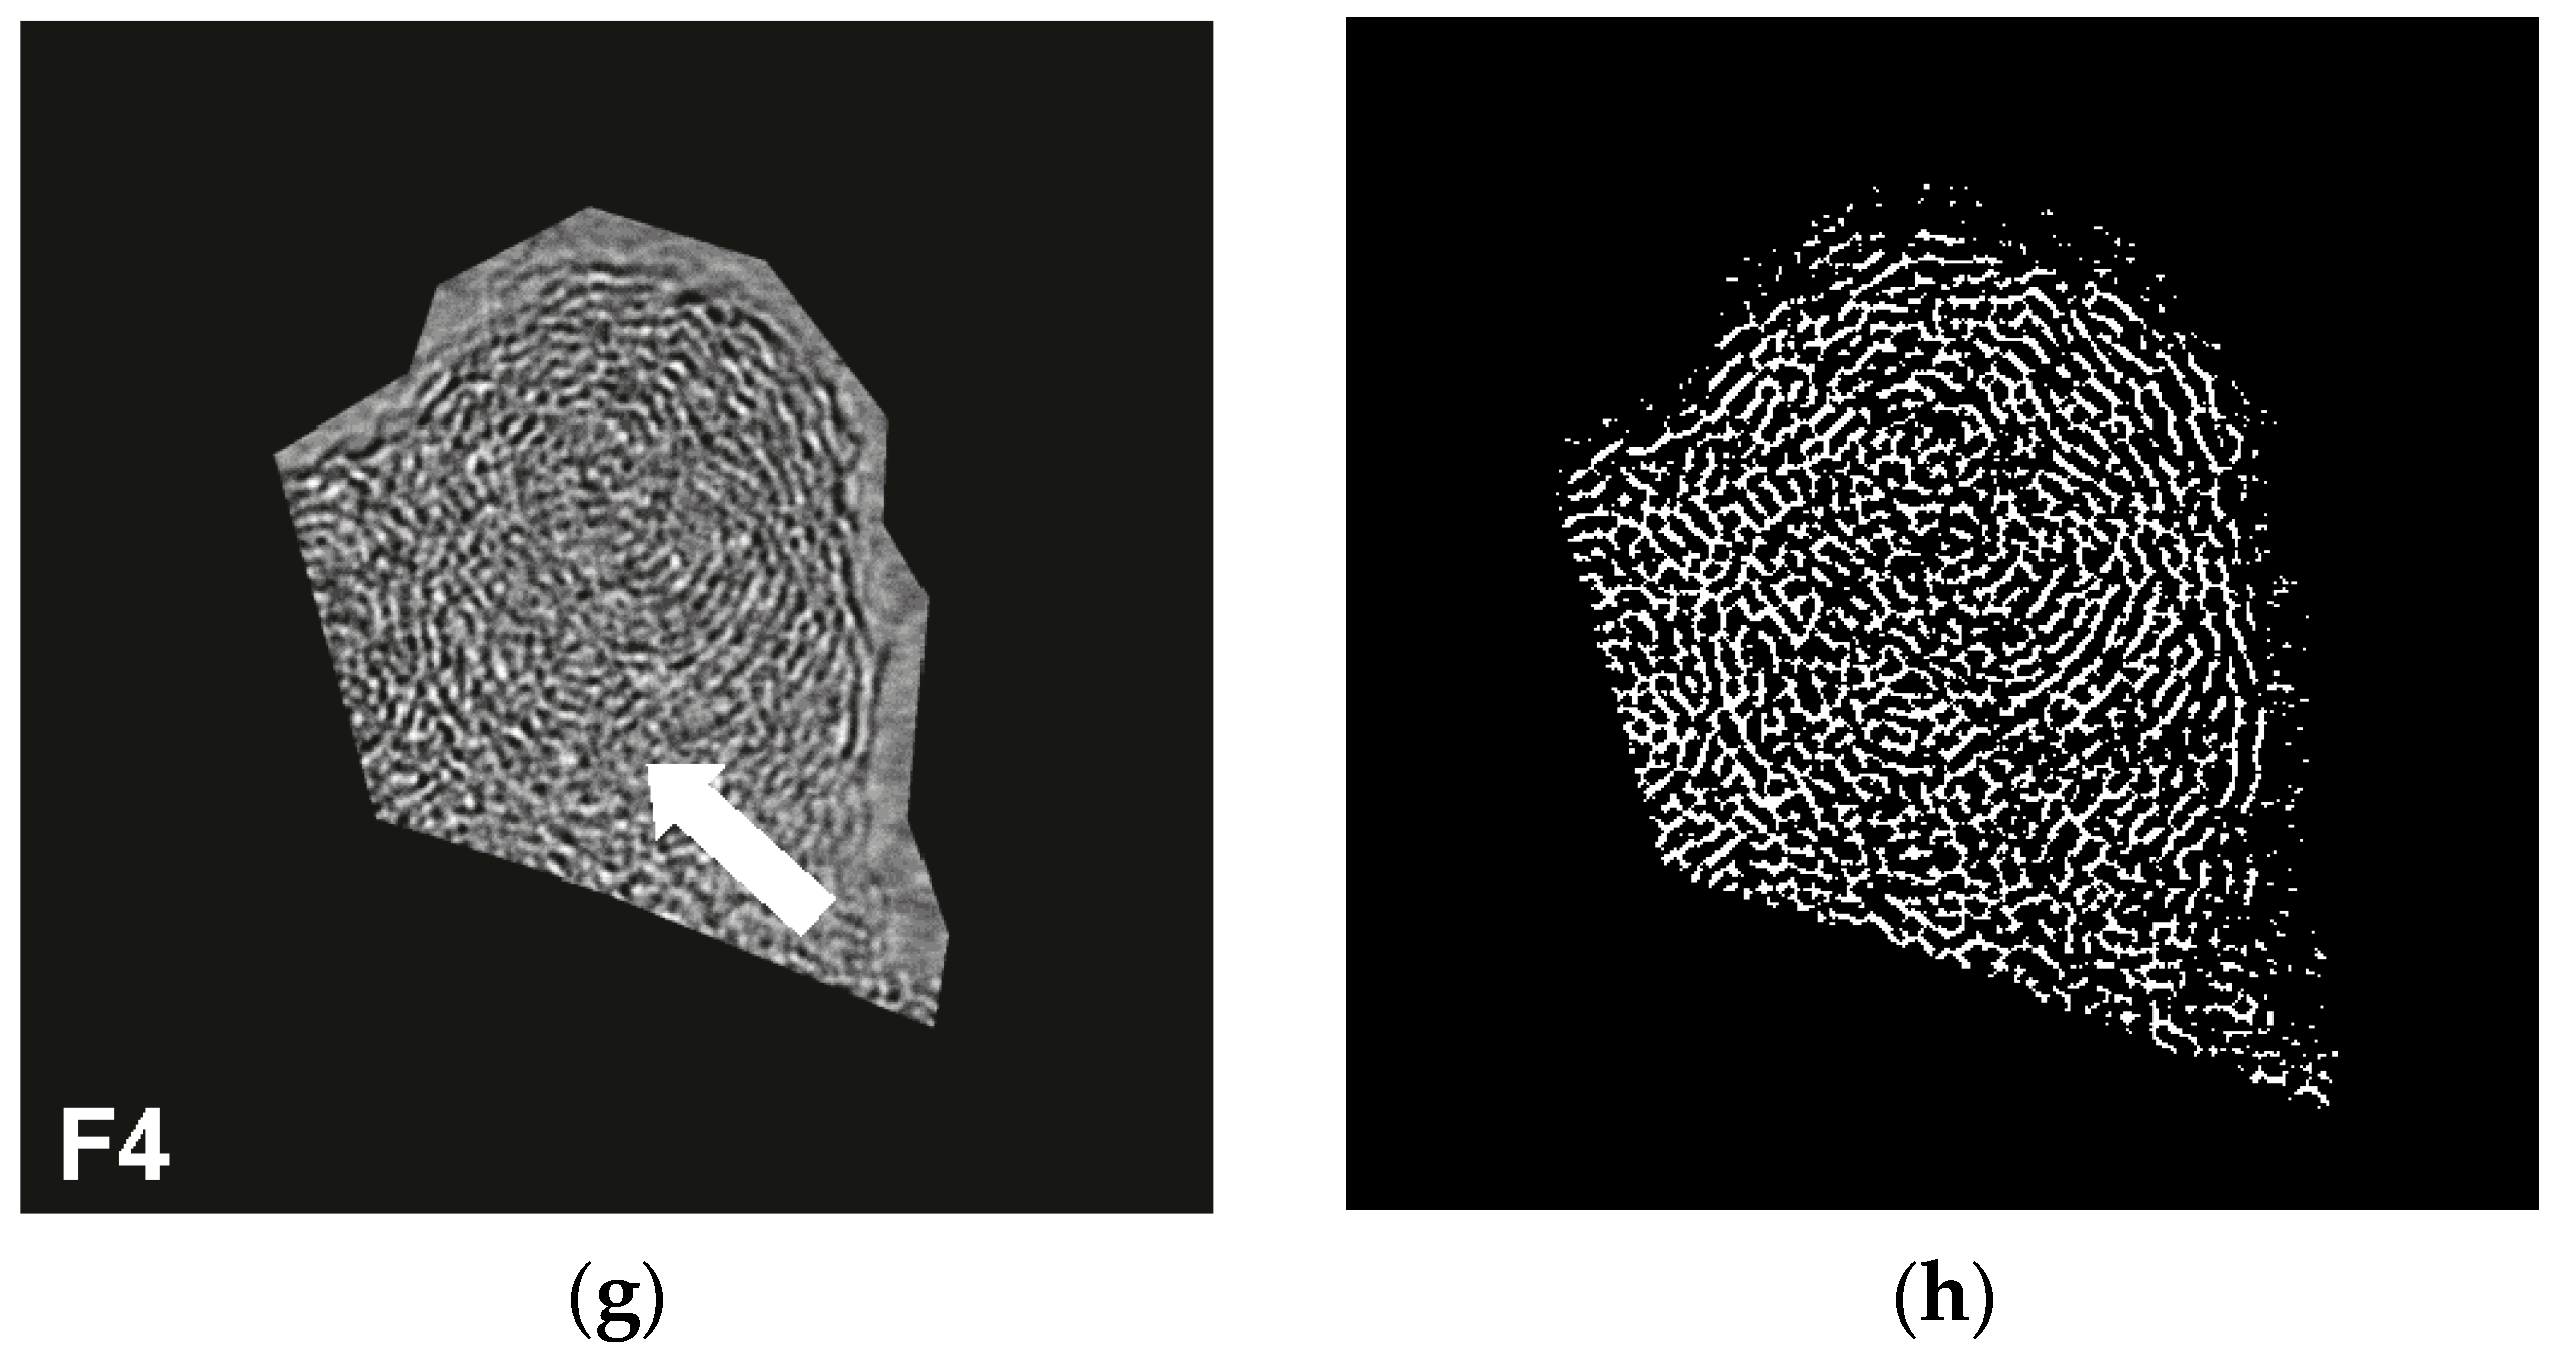
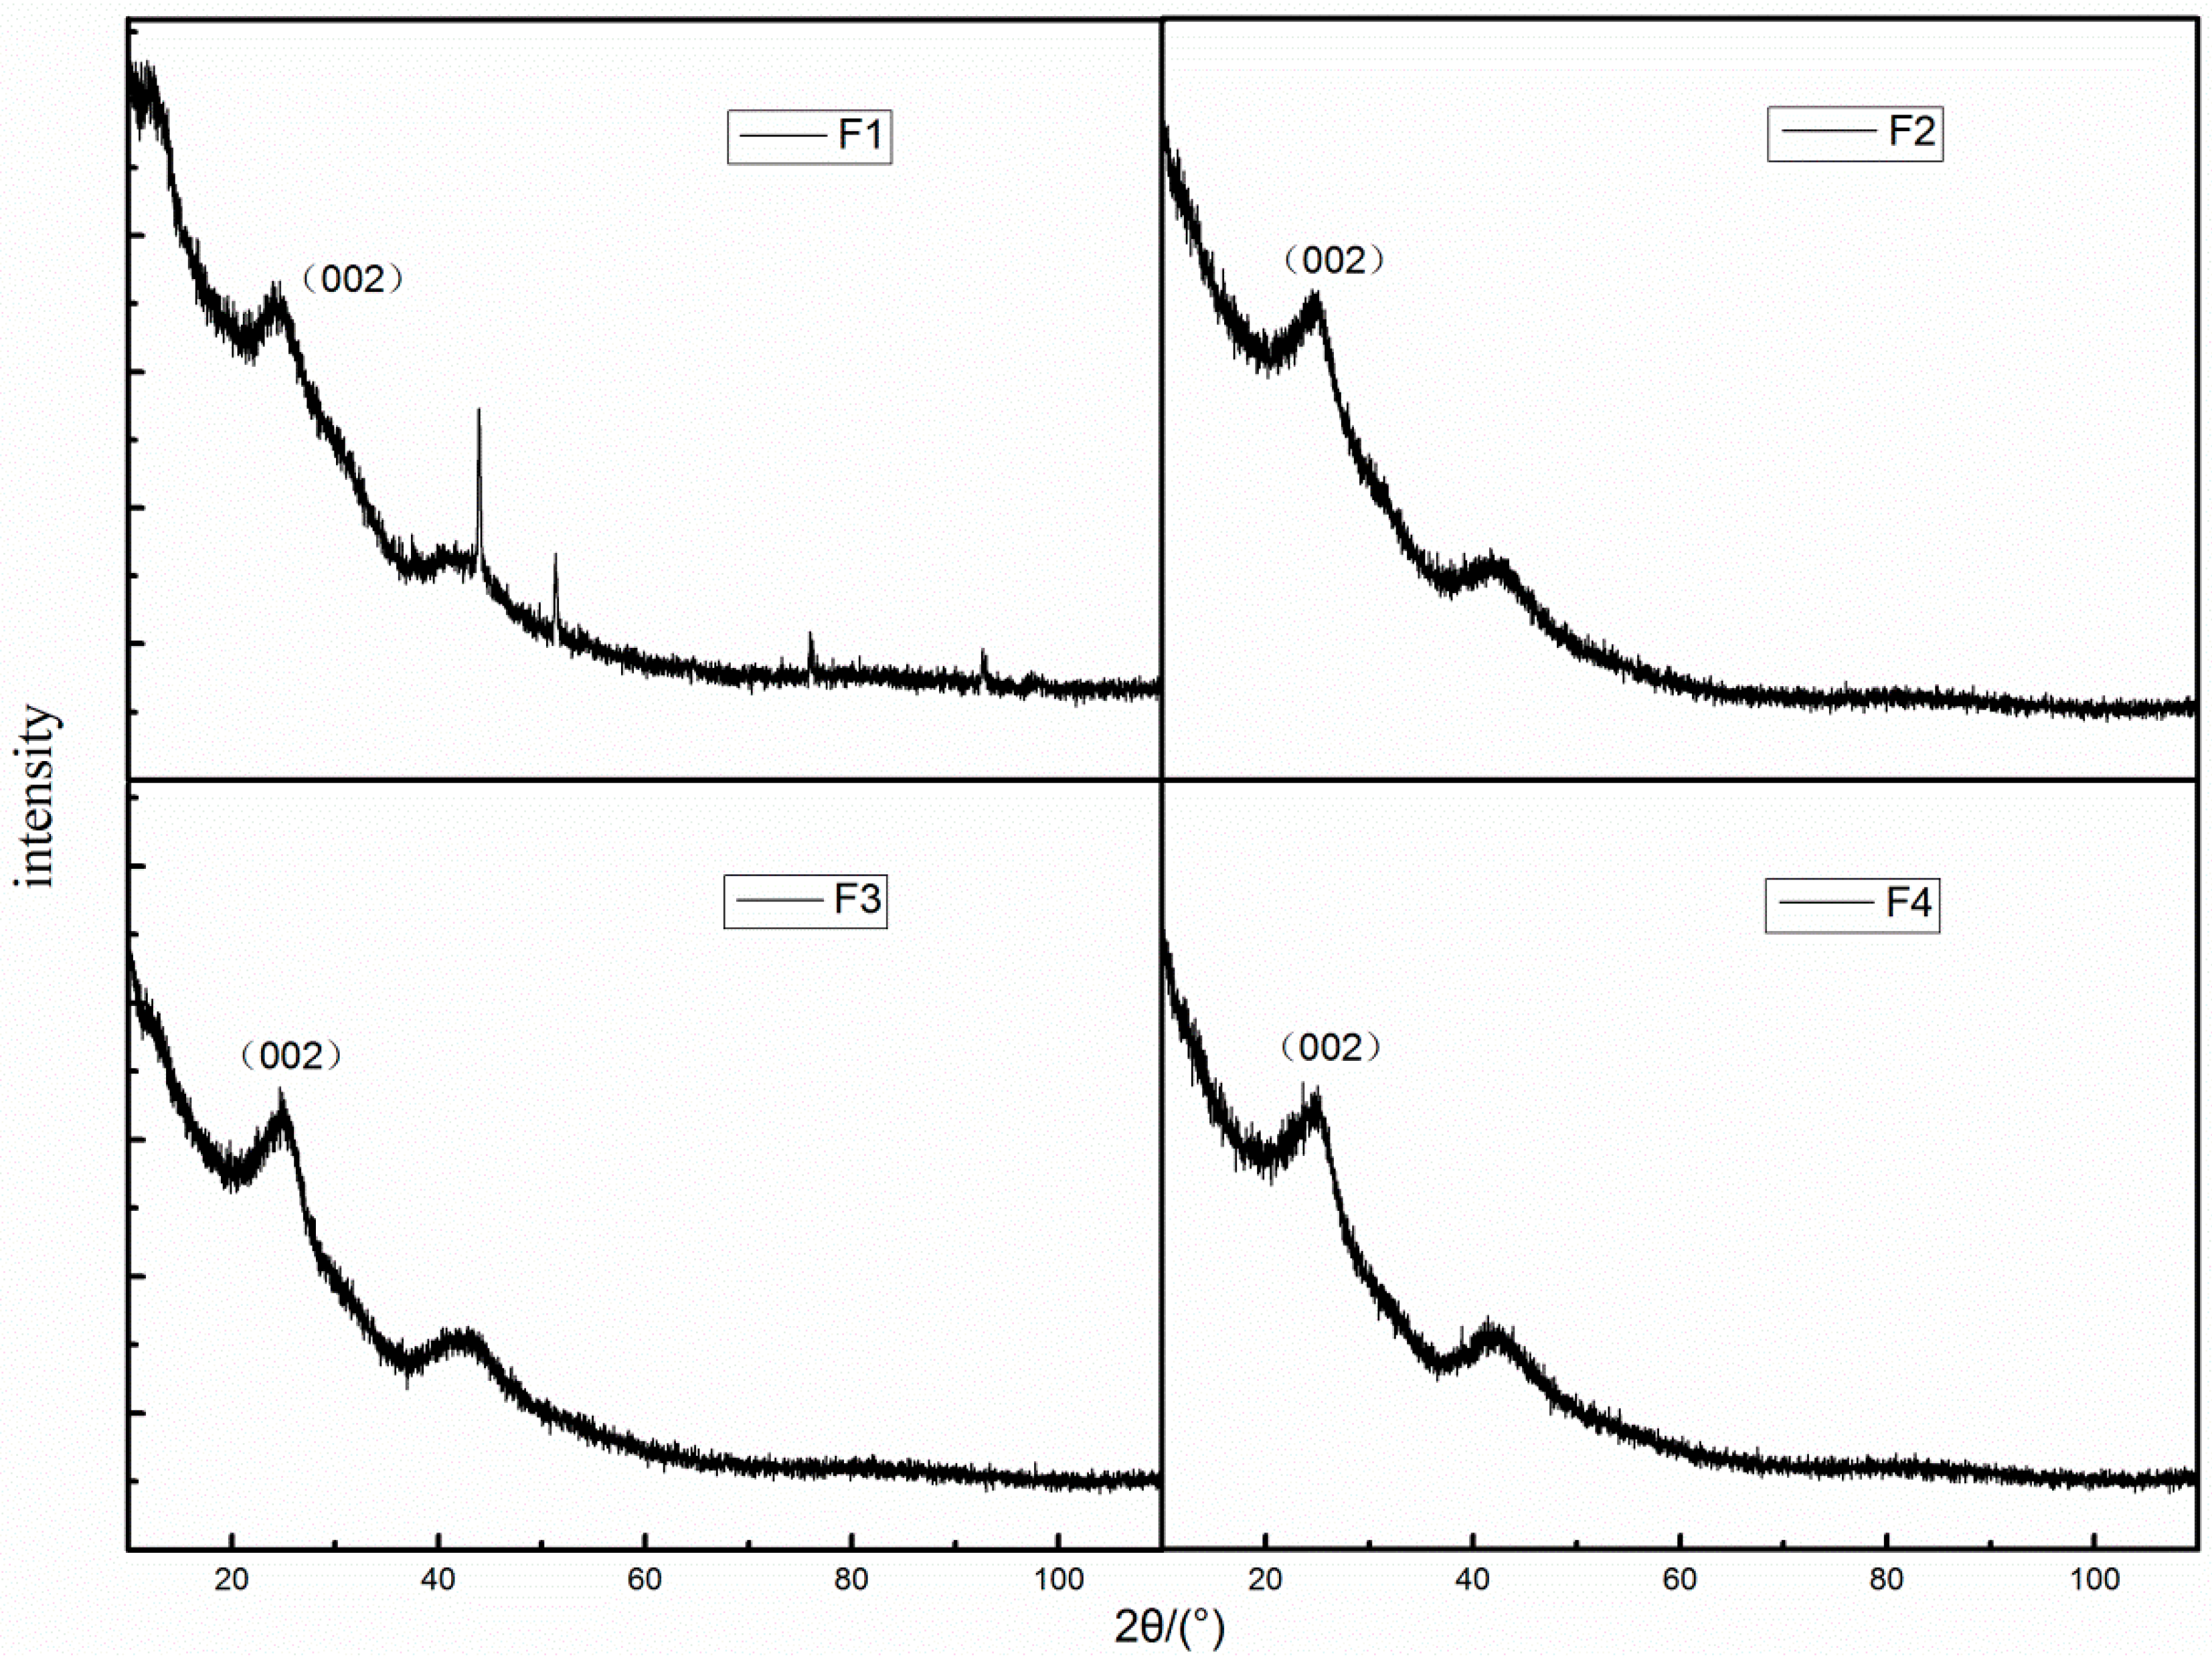
3.1. Effects of Pentanol on the Nanostructure of Nascent Soot

Soot particles are usually composed of dozens or hundreds of nearly spherical primary particles clustered in chain, branched, globose or tufted forms [28,33,34,35,36]. Figure 2 shows 47,000× magnification TEM images of the soot particles from pure ethylene (F1), 1-pentanol/ethylene (F2), 3-methyl-1-butanol/ethylene (F3), and 2-methyl-1-butanol/ethylene (F4) flames, respectively. The typical soot particles of F1 contained hundreds of suborbicular primary carbon particles with diameters of about 20 nm, and most of the primary carbon particles had a loosely clustered chain and dendrite morphology. Compared with F1, the soot particles in F2–F4 exhibited quite different morphology with liquid-like material and coatings with irregular shapes. The particles in pentanol-doped flames were larger than the F1 particles because of the surface condensation of membranous PAH. Some of the primary species were bound tighter, as if agglomeration was just beginning. In numerous previous experimental studies, the primary particles covered by a film-like deposition with irregular shape were classified as nascent soot particles [37,38,39,40]. As a result, the particles observed in F2–F4 were considered as nascent soot particles which appeared to contain precursor-like material and were just beginning to carbonize.
The HRTEM images of nascent soot particles are shown on the left in Figure 3. The images revealed that the nascent soot particles from pure ethylene flame seen in Figure 3a had a core-shell structure, which exhibited amorphous cores and long, orderly arranged fringes with lengths of about 10 nm as shells, while the nascent soot particles from 1-pentanol-doped flame in Figure 3c had amorphous structures. The fringes were disorderly arranged and the fringe length was much shorter, mostly less than 2 nm. In 3-methyl-1-butanol-doped flame, the fringe length of nascent soot particles presented in Figure 3e was also less than 2 nm. The nascent soot particles from 2-methyl-1-butanol/ethylene shown in Figure 3g, seemed to have a higher graphitic degree and slightly longer carbon layer than that obtained from 1-pentanol and 3-methyl-1-butanol-added ethylene blended fuels, and the nanostructure was similar to that of pure ethylene soot to some extent.
Observations on the crystallite length showed that the addition of pentanol isomers could slow down the growth of graphitization of the nascent soot particles from ethylene inverse diffusion flames. Moreover, the pentanol additions maintained the fringe length at shorter levels, and increased the degree of disorder of the microcrystal array. 1-Pentanol and 3-methyl-1-butanol additions significantly reduced the degree of graphitization of soot particles. Most of the soot particles from 1-pentanol and 3-methyl-1-butanol-doped flames presented fringe lengths in the 1–2 nm range, while the effects of 2-methyl-1-butanol on reducing the degree of graphitization of primary soot particles were not obvious. The crystallite length of pure ethylene and 2-methyl-1-butanol/ethylene soot particles were similar at about 10 nm.
Partial enlarged HRTEM images of nascent soot particles are shown on the right of Figure 3, where the enlarged boxes all have the same 10 nm width. In addition, the statistic results of separation distance distribution of nascent particles are shown in Figure 4. In selected statistical fringe layers, the separation distance of the pure ethylene flame soot particle was concentrated around 0.336 nm, and the fringe layers of the separation distance between 0.334–0.337 nm accounted for 68.18% of the particles. In 1-pentanol/ethylene and 3-methyl-1-butanol/ethylene soot particles, the distribution peaks of the separation distance both shifted to the right side, and the fringe layers of the separation distance between 0.334–0.337 nm accounted for 21.21% and 23.27%, respectively, which showed an increasing trend in the separation distance. However this trend was not obvious in 2-methyl-1-butanol/ethylene soot. As shown in Figure 4, the distribution peak of the 2-methyl-1-butanol/ethylene soot separation distance was similar to that in pure ethylene particle, and the fringe layers of the separation distance between 0.334–0.337 nm accounted for 63.64%. The similarities in the distributions of fringe separation distance between F1 and F4, F2 and F3 also verified that the fringe lengths of F1 and F4, F2 and F3 shown in Figure 3 were similar.
Tortuosity is the ratio of the actual fringe length to the straight-line distance, which reflects the tortuosity degree of fringes [41]. Image processing software was used to process the HRTEM photos of the nascent particles and the processed results are shown in Figure 5. The image processing was performed using MATLAB analysis algorithms. The method was similar to the one developed by Yehliu et al. [42,43]. The processing involved several operations such as negative transformation, region of interest selection, contrast enhancement, Wiener filter and thresholding to obtain a binary image. The fringes in F1 and F4 had relatively long length and similar tortuosity. The arrow-pointed typical structure was calculated, the tortuosity values in F1 and F4 were 1.237 and 1.195 respectively, which was quite similar and the relative deviation was only 3.3%. In sharp contrast, the fringe lengths of F2 and F3 were generally short, the tortuosity were greater. The parallel fringe structure was rarely found and the distribution of the fringe was very messy.
It was found that in nascent soot particles the short fringe, large tortuosity and disorderly arranged structure were specific to F2 and F3 through a large quantity of observations, while the long fringe, small tortuosity and parallel fringe were the typical structure in F1 and F4. It also suggested that the nascent soot had higher graphitization degree in F1 and F4 than in F2 and F3.
XRD spectra of nascent particles under the four different conditions are presented in Figure 6. Diffraction peaks broadening which appeared at about 24.5 degree was observed in the XRD spectra, corresponding to the (002) peak. Moreover, the diffraction peaks were slightly offset to a small angle.
According to X-ray diffraction theory, when the grain size is reduced to submicron, the number of grains is increased, and diffraction peak broadening is obvious [44]. The smaller the grains were, the broader the peak was. It was worth noting that the additions of pentanol isomers resulted in very slight decrease in the peak width. This might suggest that the volume of molecular precursors of soot particles increased after the addition of pentanol isomers.
The d002 values of the carbon crystallites was obtained by the Debye-Scherrer formula [45]:
d 002 = λ 2 sin θ 002
where λ was the emission wavelength of the Cu Kα target. θ002 was the diffraction angle matched for C(002), d002 was the separation distance of C(002). The degree of graphitization could be calculated by the Merlin formula [45]:
g = 0.3340 d 002 0.3340 0.3354 × 100 %
where g represents the primary soot particles graphitization degree, 0.3440 (nm) indicates the layer separation distance of fully non-graphite crystals, 0.3354 (nm) indicates the layer separation distance of the ideal graphite crystals. The graphitization degrees for the four soot samples are listed in Table 3.
The calculated lattice spacing was larger than the actual value due to the deviation of the diffraction angle to the left, which was greater than 0.3440 nm. Thus, the degree of graphite in Table 3 was negative. Here, the absolute values of g could not reflect the real situation without correction, but the relative value of several conditions still had a comparative significance.
As shown in Table 3, the separation distance increased in 1-pentanol/ethylene flame (F2) and 3-methyl-1-butanol/ethylene flame (F3). The XRD results directly verified the above analysis on the nanostructure of nascent soot particles and showed good agreement with the HRTEM results.

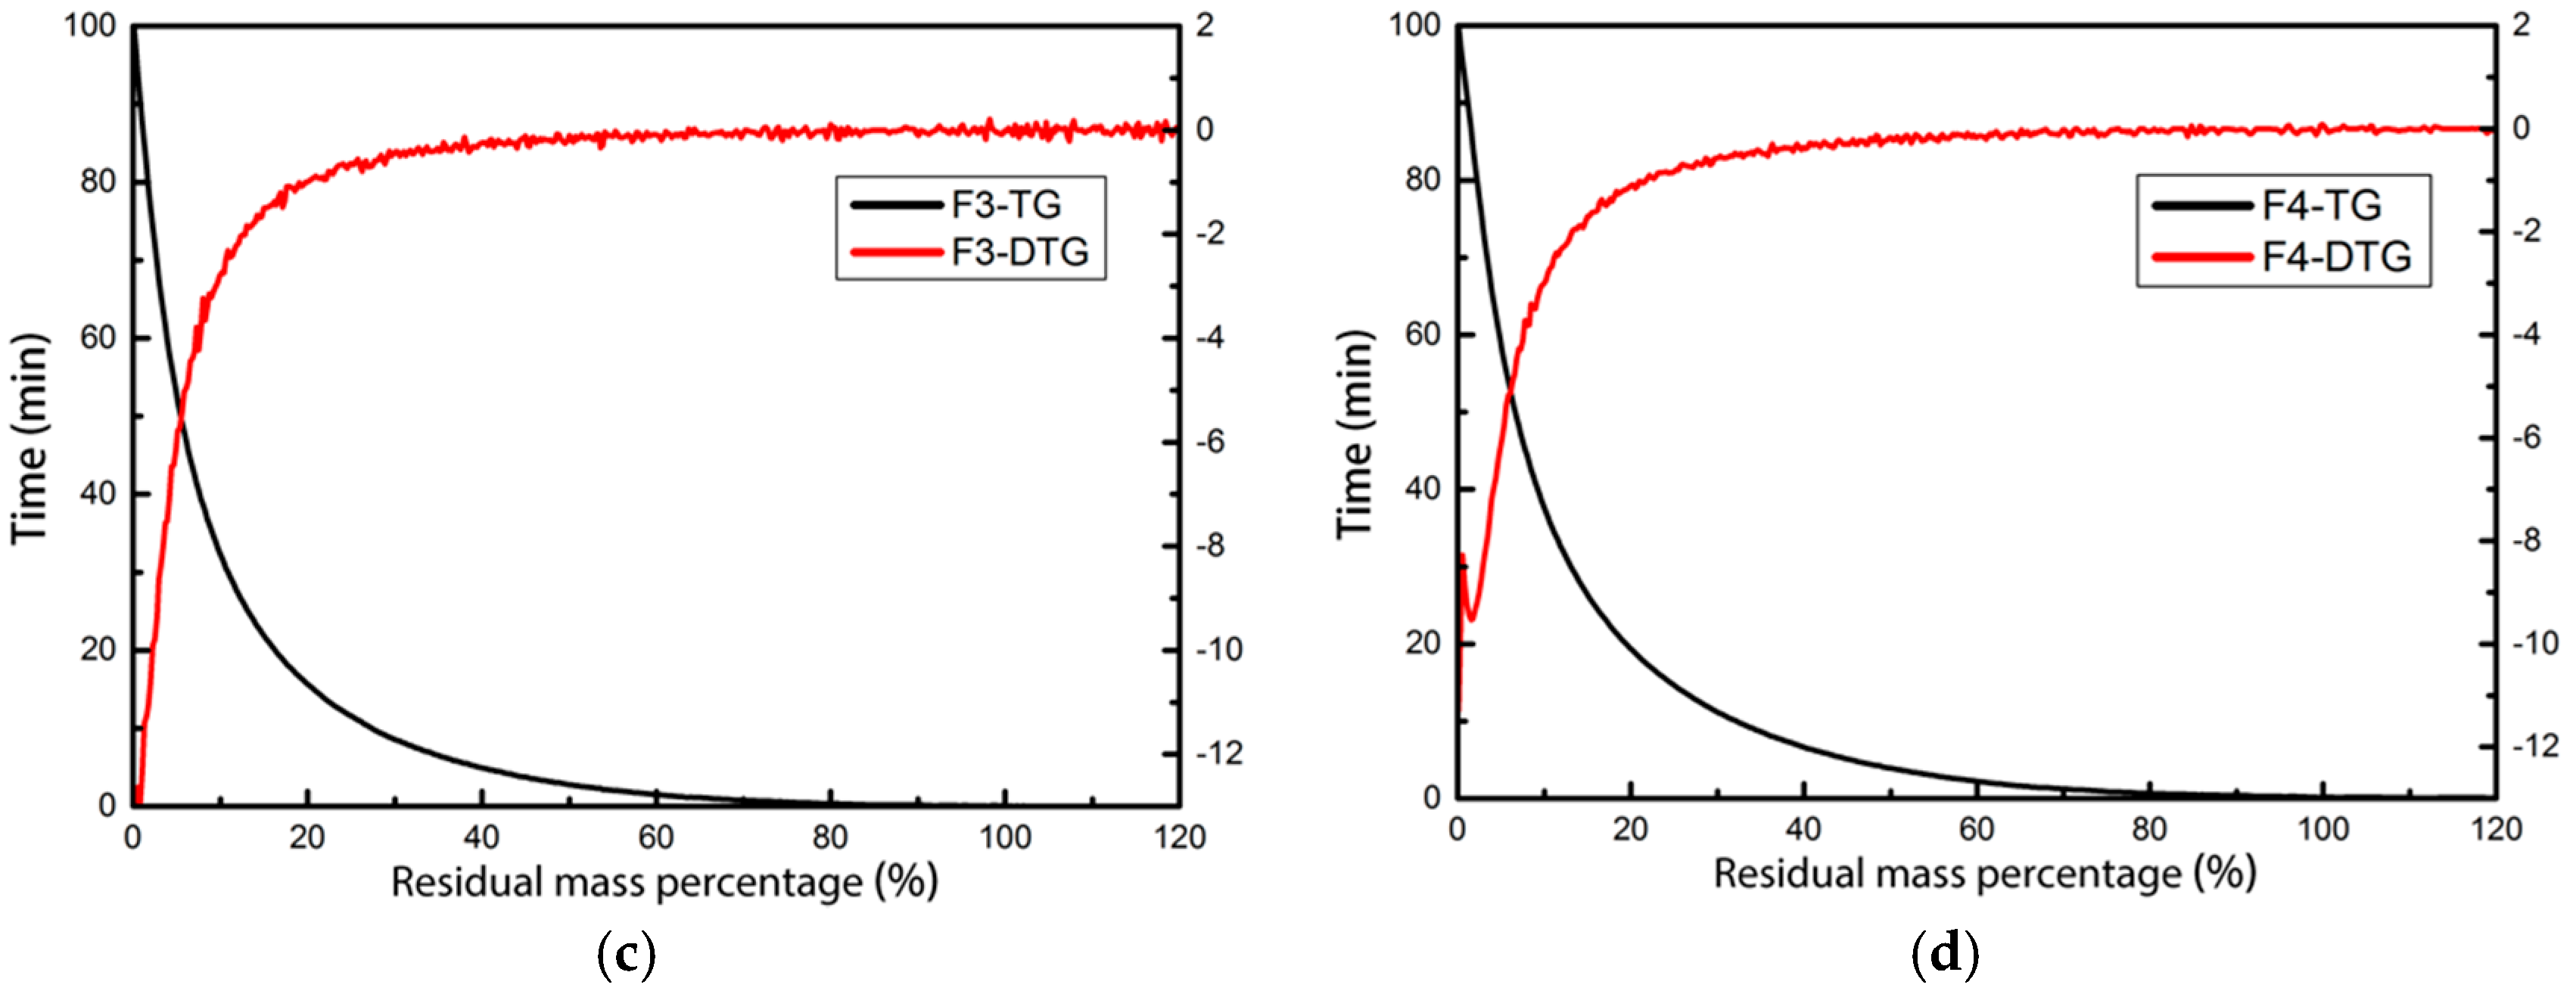
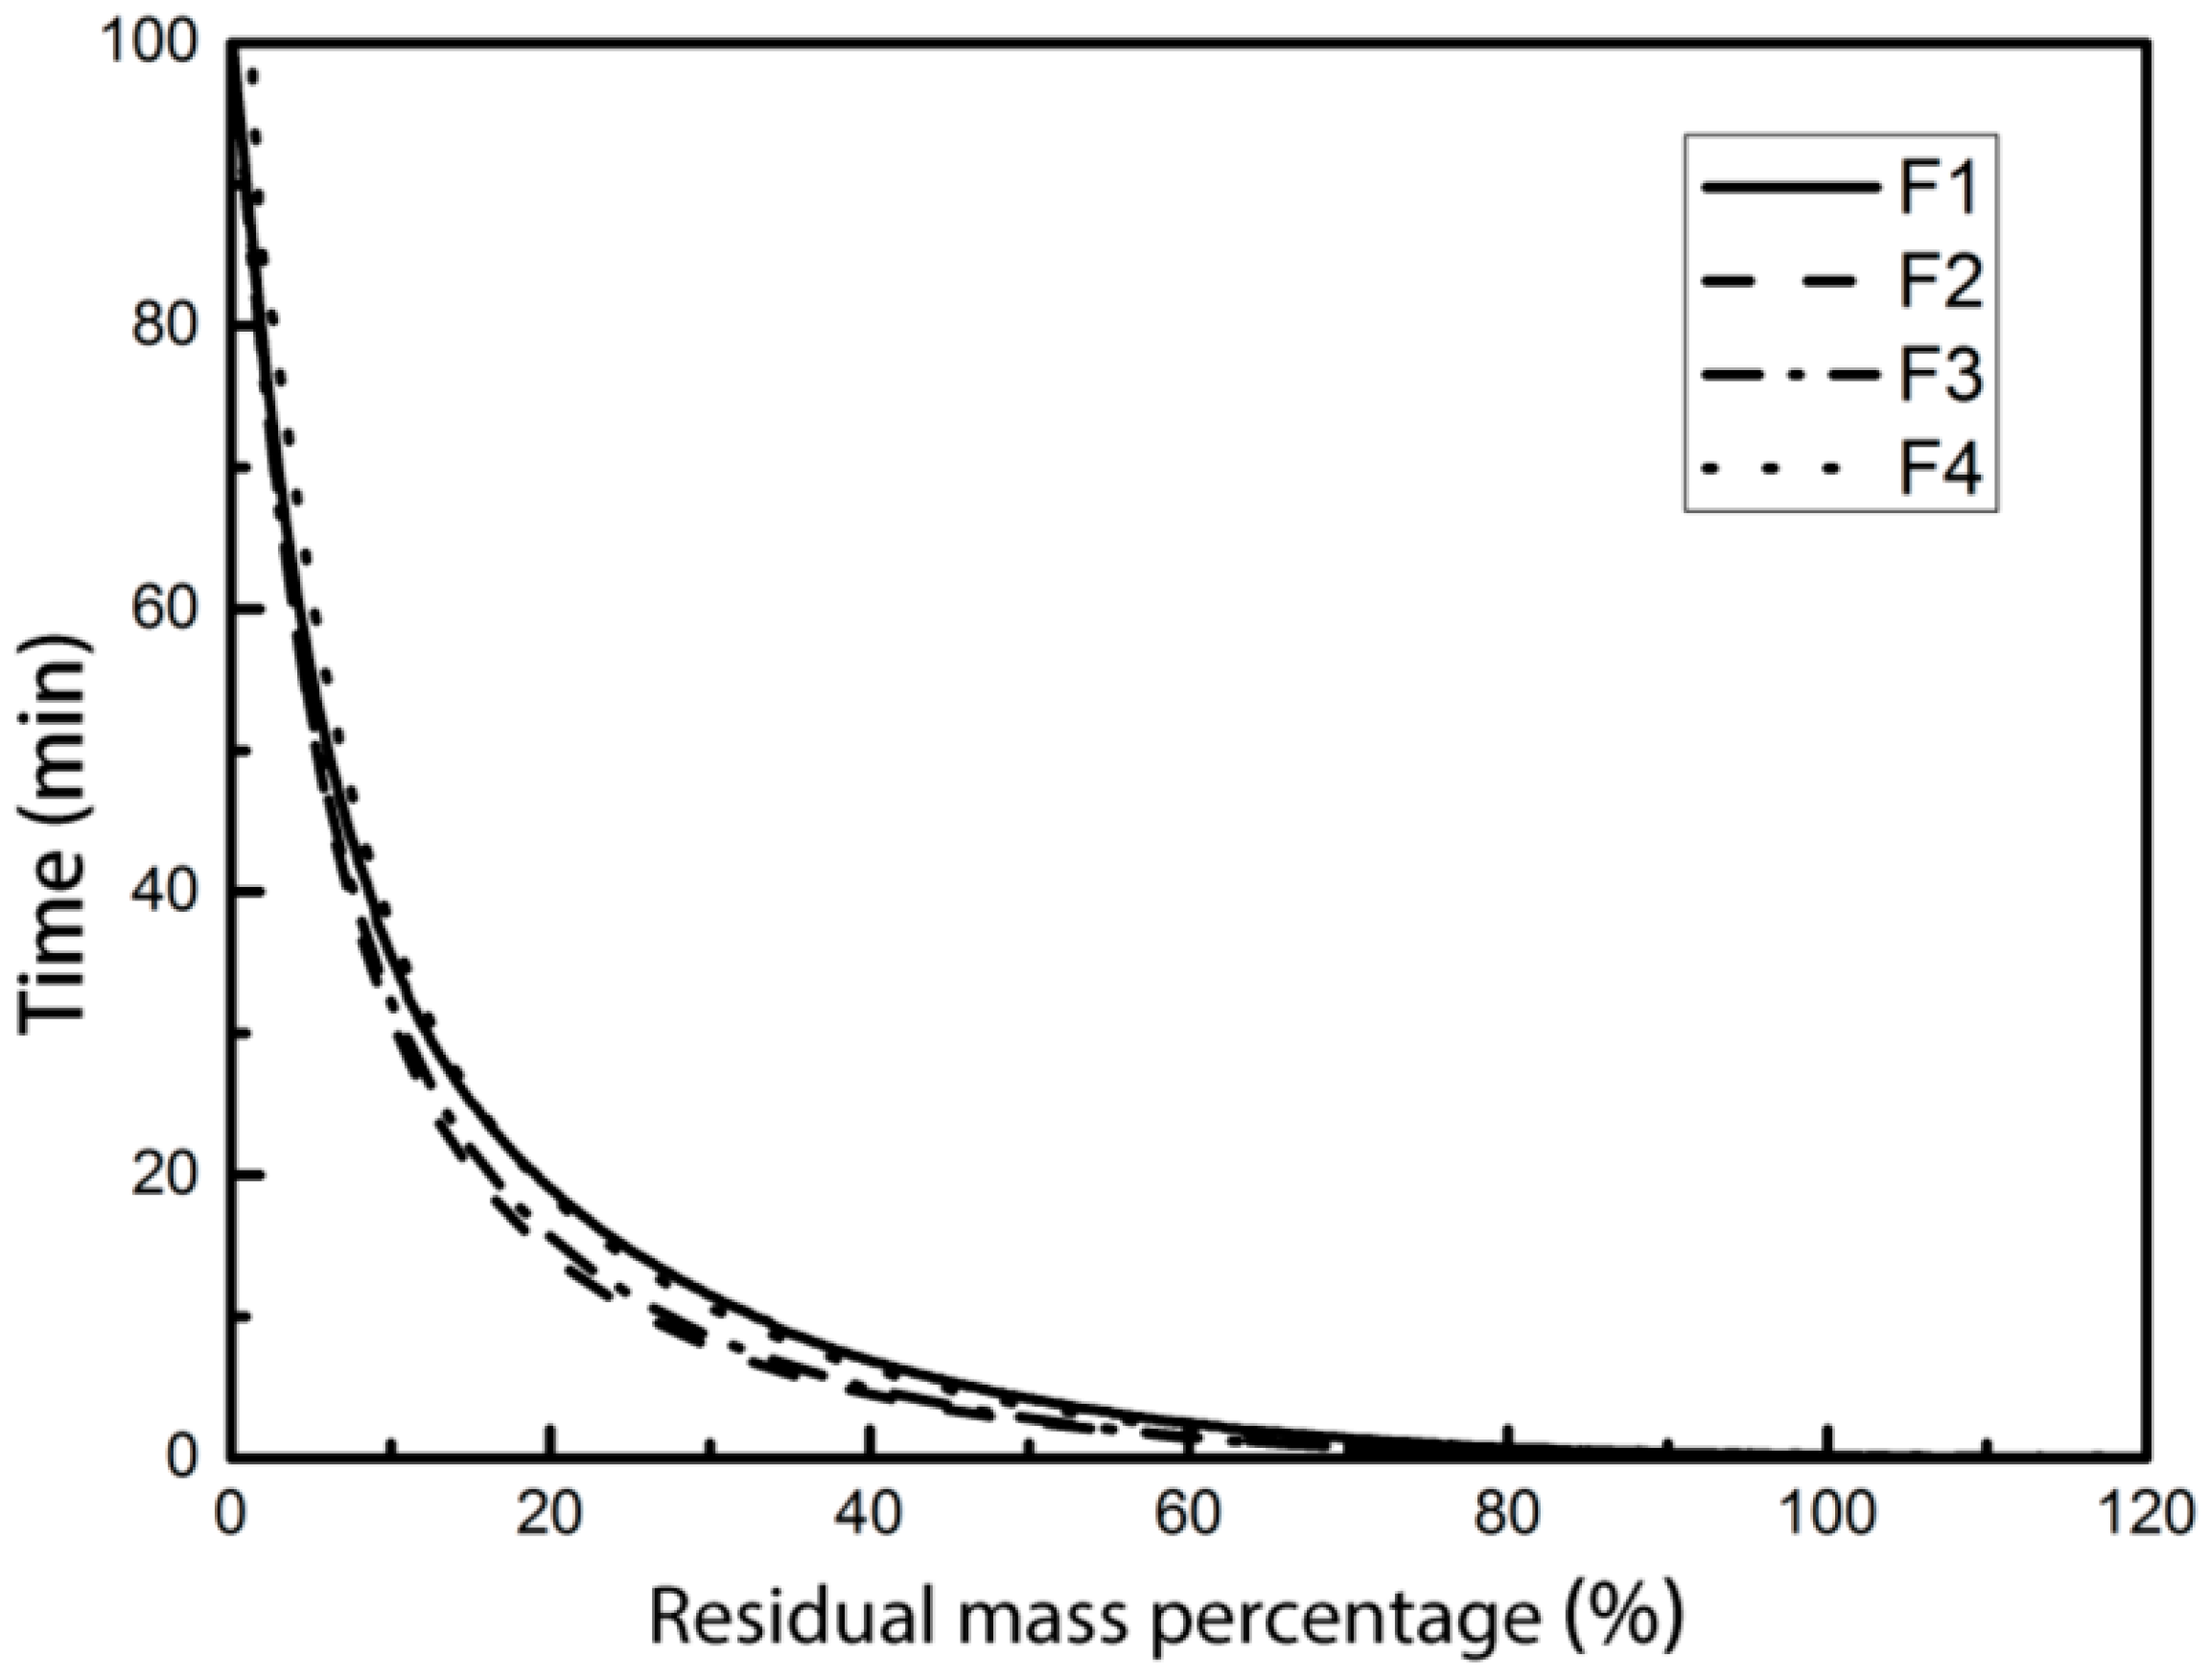
3.2. Effects of Pentanol on the Oxidation Reactivity of Nascent Soot

The oxidation reactivity of nascent soot particles is one of the most important properties in the reaction. Oxidation characteristics, with regard to a large extent affected by the nanostructure and agglomeration of nascent particles, reflect the reactivity in the oxidation reaction under high temperature. This paper selected the following four points on the thermogravimetric curve to quantitatively describe the oxidation characteristics of nascent soot particles:
(1)
Initial oxidation time ti: The time required for each group of samples to be consumed from the start point of the oxidation to the oxidation of the 10% mass (a point corresponding to a residual mass percentage of 90% on the curve).
(2)
The half time of oxidation th: The time required for the oxidation of each sample to consume half of the mass.
(3)
Maximum oxidation rate time tmax: The time corresponding to the minimum value of the DTG curves of each group of samples.
(4)
Oxidation finishing time tf: The time required for each group of samples to be from the start point to the end of the oxidation (a point corresponding to a residual mass percentage of 0 on the curve).
The oxidation process could be reflected in the TG curves. In order to compare the oxidation reactivity of different samples with different initial mass, the thermogravimetric curve of each sample was normalized, and two separate experiments were carried out to verify the reproducibility of the TGA results. A representative repeatability test of pure ethylene flame soot is shown in Figure 7.
In Figure 7, the horizontal coordinate represents the reaction time from the start of the oxidation, and the longitudinal coordinates represented the percentage of the remaining mass α, which was defined as follows:
α = m i m m i m f
where mi represents the initial mass of the soot sample in the beginning of oxidation; mf represents the ultimate mass of the soot sample when oxidation was completed (at the end of oxidation), and m represents the sample mass at a certain time during the oxidation process.
The results showed that the thermogravimetric curves obtained from the two independent experiments were nearly the same, and the maximum relative error was less than 5%, which proved the good repeatability of the thermogravimetric analysis experiments.
Figure 8 presents the TG and DTG curves of the nascent soot particles under different conditions. As shown in Figure 8, a sharp drop could be seen in the TG curves of all the samples during the early stage of oxidation, and the rate of mass reduction was found to slow down with the oxidation process. The DTG curves were the first derivative of the time of the TG curves, which reflected the oxidation rate. It showed that the trough values of the DTG curves of the different soot samples appeared in the initial stage of oxidation and the maximum oxidation rates of the samples under the four conditions corresponded to very slight changes. The maximum oxidation rates of F1 and F2 were found in 1.08 min and 2.04 min, respectively, while the maximum oxidation rates of F3 and F4 occurred at the beginning of the oxidation reaction.
Figure 9 shows the comparison of the four soot TG curves. It is clear in Figure 9 that after the beginning of the oxidation, the mass loss of soot sample in F2 condition was the fastest, and the mass loss in F3 was slightly slower than that of F2. The residual mass percentage curves of F1 and F4 were almost overlapped. In the early stage of oxidation, the oxidation rate of F1 was higher than that of F4. However, after twenty-third minutes the two curves intersected and the oxidation rate of F4 was higher than that of F1.
In addition, the oxidation rates of F2 and F3 were overall higher than those of F1 and F4, which showed that 1-pentanol and 3-methyl-1-butanol could improve the oxidation reactivity of nascent soot particles as additives mixed with ethylene under the same mixing ratio and combustion condition. While the nascent soot particles in F2 of the 3-methyl-1-butanol/ethylene fuel maintained a relatively high average reaction rate.
Table 4 lists the oxidation characteristics of nascent soot particles under different conditions. From the table, we could see that the initial oxidation time, maximum oxidation rate time, the half time of oxidation and the oxidation finishing time varied from 0.8–1.16 min, 0–2.04 min, 5.32–6.6 min and 26–32.8 min for F1, F2, F3 and F4, respectively.
The maximum oxidation rates of soot particles in F3 and F4 appeared at the beginning of the oxidation, and the maximum oxidation rates in F1 and F2 showed after the beginning of the oxidation in 1.08 and 2.04 min, respectively. The half time of oxidation was shortest in F3, but the oxidation finishing time was shortest in F2. This finding indicated that at the early stages 3-methyl-1-butanol could more significantly promote the oxidation reactivity of soot particles, while in the whole process, the 1-pentanol promoted the oxidation reactivity most significantly. The 1-pentanol addition most significantly enhanced the oxidation reactivity of nascent particles and reduced the oxidation time to 26 min, which was about 20% shorter than that in pure ethylene flame. The addition of 3-methyl-1-butanol reduced the oxidation time by 16.5% compared to pure ethylene flame soot. The effect of 2-methyl-1-butanol on oxidation reactivity of nascent particles was not obvious.
The results of thermogravimetric analysis were in line with the nanostructure observations. From the point of view of nanostructure, 1-pentanol and 3-methyl-1-butanol could enhance the oxidation reactivity of nascent soot particles, which was confirmed in the thermogravimetric analysis of the sample particles.

4. Conclusions

The present study focused on investigating the nanostructure and oxidation reactivity of nascent soot particles in pentanol-doped inverse diffusion flames. Comparisons of structure and reactivity among the soot from ethylene inverse diffusion flames with or without addition of three pentanol isomers were performed. The results showed that the nascent soot cluster of pure ethylene flame was composed by hundreds of suborbicular primary carbon particles with a loose chain and dendrite morphology structure, while with the additions of pentanol isomers, the soot particles in F2–F4 exhibited liquid-like material and coatings with irregular shapes. The particles in pentanol-doped flames were larger than pure ethylene particles because of the surface condensation of membranous PAH. In addition, the particles observed in F2–F4 were considered as nascent soot particles which appeared to contain precursor-like material and were just beginning to carbonize. The additives 1-pentanol, 3-methyl-1-butanol and 2-methyl-1-butanol could slow down the graphitization of nascent soot particles and delay the solidification of carbon core. Furthermore, the 1-pentanol and 3-methyl-1-butanol increased the layer separation distance of nascent soot particles and decreased the number of particles with separation distance between 0.334–0.337 nm by 47% and 44%, respectively. The pentanol isomer additions also contributed to higher disorder in the arrangement of crystallites in soot. According to the TGA experiments, the pentanol isomer additions enhanced the oxidation reactivity of the nascent soot particles. The oxidation time of 1-pentanol/ethylene soot was about 20% shorter than the pure ethylene soot, and the oxidation time decreased about 16.5% with the addition of 3-methyl-1-butanol, while with the addition of 2-methyl-1-butanol, the oxidation time was not obviously shortened. Compared with 2-methyl-1-butanol, 1-pentanol and 3-methyl-1-butanol had more significant effects on reducing the graphitization degree of nascent particles and increasing the oxidation activity of soot particles, which could help to reduce the emission of soot particles.

Supplementary Materials

The following are available online at www.mdpi.com/1996-1073/10/1/122/s1, Figure S1: Aggregation morphology of nascent soot particles under four different conditions with collection time of 60 s: (a) pure ethylene; (b) 1-pentanol/ethylene; (c) 3-methyl-1-butanol/ethylene; (d) 2-methyl-1-butanol/ethylene. Figure S2: HRTEM images at higher magnification of nascent soot particles under four different flame conditions: (a) pure ethylene; (b) 1-pentanol/ethylene; (c) 3-methyl-1-butanol/ethylene; (d) 2-methyl-1-butanol/ethylene.

Acknowledgments

This work was supported by the Jiangsu Provincial Natural Science Foundation of China (BK20140034), the National Natural Science Foundation of China (51576100, 51306091), the Jiangsu Provincial Innovative Project of Graduate Education (KYZZ16_0184), and the Jiangsu Provincial Project of “Six Talent Summit” (2014-XNY-002).

Author Contributions

Yaoyao Ying designed and performed the experiments, analyzed the data and revised the paper; Chenxuan Xu performed the experiments, analyzed the data and wrote the paper; Dong Liu supervised the work, designed the experiments, analyzed the data and revised the paper; Bo Jiang revised the paper; Pengfei Wang and Wei Wang helped the experiments.

Conflicts of Interest

The authors declare no conflict of interest.

References

  1. Mcenally, C.S.; Pfefferle, L.D.; Atakan, B.; Kohse-Höinghaus, K. Studies of aromatic hydrocarbon formation mechanisms in flames: Progress towards closing the fuel gap. Prog. Energ. Combust. 2006, 32, 247–294. [Google Scholar] [CrossRef]
  2. D’Anna, A. Combustion-formed nanoparticles. Proc. Combust. Inst. 2009, 32, 593–613. [Google Scholar] [CrossRef]
  3. Sgro, L.A.; D’Anna, A.; Minutolo, P. On the characterization of nanoparticles emitted from combustion sources related to understanding their effects on health and climate. J. Hazard. Mater. 2012, 211, 420–426. [Google Scholar] [CrossRef] [PubMed]
  4. Frenklach, M. Reaction mechanism of soot formation in flames. Phys. Chem. Chem. Phys. 2002, 4, 2028–2037. [Google Scholar] [CrossRef]
  5. Wang, H. Formation of nascent soot and other condensed-phase materials in flames. Proc. Combust. Inst. 2011, 33, 41–67. [Google Scholar] [CrossRef]
  6. Richter, H.; Howard, J.B. Formation of polycyclic aromatic hydrocarbons and their growth to soot-a review of chemical reaction pathways. Prog. Energ. Combust. 2000, 26, 565–608. [Google Scholar] [CrossRef]
  7. Huang, Q.X.; Liu, D.; Wang, F.; Yan, J.H.; Chi, Y. Soot volume fraction and temperature reconstruction model research for asymmetric diffusive C-H flame. Acta Phys. Sin. 2008, 57, 7928–7936. [Google Scholar]
  8. Liu, D.; Yan, J.H.; Wang, F.; Huang, Q.X.; Chi, Y.; Ceng, K.F. Simultaneous experimental reconstruction of three-dimensional flame soot temperature and volume fraction distributions. Acta Phys. Sin. 2011, 60, 060701. [Google Scholar]
  9. Liu, D.; Huang, Q.X.; Wang, F.; Chi, Y.; Cen, K.F.; Yan, J.H. Simultaneous measurement of three-dimensional soot temperature and volume fraction fields in axisymmetric or asymmetric small unconfined flames with CCD cameras. J. Heat Transf. 2010, 132. [Google Scholar] [CrossRef]
  10. Lindstedt, R.P.; Bockhorn, H. Soot Formation in Combustion: Mechanisms and Models, 1st ed.; Springer: Heidelberg, Germany, 1994; p. 290. [Google Scholar]
  11. Dobbins, R.A.; Fletcher, R.A.; Lu, W. Laser microprobe analysis of soot precursor particles and carbonaceous soot. Combust. Flame 1995, 100, 301–309. [Google Scholar] [CrossRef]
  12. Wang, Y.; Raj, A.; Chung, A.S.H. A PAH growth mechanism and synergistic effect on PAH formation in counterflow diffusion flames. Combust. Flame 2013, 160, 1667–1676. [Google Scholar] [CrossRef]
  13. China Automotive Energy Research Center of Tsinghua University. China Automotive Energy Outlook 2012 Outlook, 1st ed.; Science Press: Beijing, China, 2011. [Google Scholar]
  14. Sharon, H.; Ram, P.J.S.; Fernando, K.J.; Murali, S.; Muthusamy, R. Fueling a stationary direct injection diesel engine with diesel-used palm oil-butanol blends-an experimental study. Energy Convers. Manag. 2013, 73, 95–105. [Google Scholar] [CrossRef]
  15. Zhang, Z.; Balasubramanian, R. Influence of butanol addition to diesel-biodiesel blend on engine performance and particulate emissions of a stationary diesel engine. Appl. Energy 2014, 119, 530–536. [Google Scholar] [CrossRef]
  16. McEnally, C.S.; Pfefferle, L.D. Soot formation in methane/air nonpremixed flames doped with small quantities of C3 hydrocarbons. Combust. Flame 1998, 112, 545–558. [Google Scholar] [CrossRef]
  17. McEnally, C.S.; Pfefferle, L.D. Species and soot concentration measurements in a methane/air nonpremixed flame doped with C4 hydrocarbons. Combust. Flame 1998, 115, 81–92. [Google Scholar] [CrossRef]
  18. Olten, N.; Senkan, S. Effect of oxygen addition on polycyclic aromatic hydrocarbon formation in 1,3 butadiene counter-flow diffusion flames. Combust. Flame 2001, 125, 1032–1039. [Google Scholar] [CrossRef]
  19. Zelepouga, S.A.; Saveliev, A.V.; Kennedy, L.A.; Fridman, A.A. Relative effect of acetylene and PAHs addition on soot formation in laminar diffusion flames of methane with oxygen and oxygen-enriched air. Combust. Flame 2000, 122, 76–89. [Google Scholar] [CrossRef]
  20. Demirbas, A. Progress and recent trends in biofuels. Prog. Energy Combust. 2007, 33, 1–18. [Google Scholar] [CrossRef]
  21. Westbrook, C.K.; Pitz, W.J.; Curran, H.J. Chemical kinetic modeling study of the effects of oxygenated hydrocarbons on soot emissions from diesel engines. J. Phys. Chem. A 2006, 110, 6912–6922. [Google Scholar] [CrossRef] [PubMed]
  22. Tree, D.R.; Svensson, K.I. Soot processes in compression ignition engines. Prog. Energy. Combust. Sci. 2007, 33, 272–309. [Google Scholar] [CrossRef]
  23. He, B.Q.; Wang, H.X.; Hao, J.M.; Yan, X.G.; Xiao, H.H. A study on emission characteristics of an EFI engine with ethanol blended gasoline fuels. Atmos. Environ. 2003, 37, 949–957. [Google Scholar] [CrossRef]
  24. Najafi, G.; Ghobadian, B.; Tavakoli, T.; Buttsworth, D.R.; Yusaf, T.F.; Faizollahnejad, M. Performance and exhaust emissions of a gasoline engine with ethanol blended gasoline fuels using artificial neural network. Appl. Energy 2009, 86, 630–639. [Google Scholar] [CrossRef]
  25. Rakopoulos, C.D.; Antonopoulos, K.A.; Rakopoulos, D.C. Experimental heat release analysis and emissions of a HSDI diesel engine fueled with ethanol-diesel fuel blends. Energy 2007, 32, 1791–1808. [Google Scholar] [CrossRef]
  26. Venkateswarlu, K.; Murthy, B.S.R.; Subbarao, V.V. An Experimental Investigation on Performance, Combustion and Emission Characteristics of Diesel-Biodiesel Blends with Isobutanol as an Additive; 2012-28-0011; Society of Automotive Engineers (SAE): Detroit, MI, USA, 2012. [Google Scholar]
  27. Campos-Fernández, J.; Arnal, J.M.; Gómez, J.; Dorado, M.P. A comparison of performance of higher alcohols/diesel fuel blends in a diesel engine. Appl. Energy 2012, 95, 267–275. [Google Scholar] [CrossRef]
  28. Wei, L.; Cheung, C.S.; Huang, Z. Effect of n-pentanol addition on the combustion, performance and emission characteristics of a direct-injection diesel engine. Energy 2014, 70, 172–180. [Google Scholar] [CrossRef]
  29. Li, L.; Wang, J.; Wang, Z.; Xiao, J. Combustion and emission characteristics of diesel engine fueled with diesel/biodiesel/pentanol fuel blends. Fuel 2015, 156, 211–218. [Google Scholar] [CrossRef]
  30. Rajesh kumar, B.; Saravanan, S. Effect of exhaust gas recirculation (EGR) on performance and emissions of a constant speed DI diesel engine fueled with pentanol/diesel blends. Fuel 2015, 160, 217–226. [Google Scholar] [CrossRef]
  31. Zhu, L.; Xiao, Y.; Cheung, C.S.; Guan, C.; Huang, Z. Combustion, gaseous and particulate emission of a diesel engine fueled with n-pentanol (C5 alcohol) blended with waste cooking oil biodiesel. Appl. Therm. Eng. 2016, 102, 73–79. [Google Scholar] [CrossRef]
  32. Chemical Book. Available online: http://www.chemicalbook.com (accessed on 1 June 2016).
  33. Simmons, B.A.; Dec, J.E.; Yang, Y.; Dronniou, N. Characteristics of Isopentanol as a Fuel for HCCI Engines. SAE Int. J. Fuels Lubr. 2010, 3, 725–741. [Google Scholar]
  34. Tsujimura, T.; Pitz, W.J.; Yang, Y.; Dec, J.E. Detailed Kinetic Modeling of HCCI Combustion with Isopentanol. SAE Int. J. Fuels Lubr. 2011, 4, 257–270. [Google Scholar] [CrossRef]
  35. Heufer, K.A.; Sarathy, S.M.; Curran, H.J.; Davis, A.C.; Westbrook, C.K.; Pitz, W.J. Detailed kinetic modeling study of n-pentanol oxidation. Energy Fuel 2012, 26, 6678–6685. [Google Scholar] [CrossRef]
  36. Vander Wal, R.L.; Tomasek, A.J. Soot nanostructure: Dependence upon synthesis conditions. Combust. Flame 2004, 136, 129–140. [Google Scholar] [CrossRef]
  37. Blevins, L.G.; Fletcher, R.A.; Benner, B.A., Jr.; Steel, E.B.; Mulholland, G.W. The existence of young soot in the exhaust of inverse diffusion flames. Proc. Combust. Inst. 2002, 29, 2325–2333. [Google Scholar] [CrossRef]
  38. Alfè, M.; Apicella, B.; Barbella, R.; Rouzaud, J.-N.; Tregrossi, A.; Ciajolo, A. Structure-property relationship in nanostructures of young and mature soot in premixed flames. Proc. Combust. Inst. 2009, 32, 697–704. [Google Scholar] [CrossRef]
  39. Santamaría, A.; Yang, N.; Eddings, E.; Mondragón, F. Chemical and morphological characterization of soot and soot precursors generated in an inverse diffusion flame with aromatic and aliphatic fuels. Combust. Flame 2010, 157, 33–42. [Google Scholar] [CrossRef]
  40. Velásquez, M.; Mondragón, F.; Santamaría, A. Chemical characterization of soot precursors and soot particles produced in hexane and diesel surrogated using an inverse diffusion flame burner. Fuel 2013, 104, 684–690. [Google Scholar] [CrossRef]
  41. Vander Wal, R.L.; Tomasek, A.J.; Pamphlet, M.I.; Taylor, C.D.; Thompson, W.K. Analysis of HRTEM images for carbon nanostructure quantification. J. Nanopart. Res. 2004, 6, 555–568. [Google Scholar] [CrossRef]
  42. Yehliu, K.; Vander Wal, R.L.; Boehman, A.L. Development of an HRTEM image analysis method to quantify carbon nanostructure. Combust. Flame 2011, 158, 1837–1851. [Google Scholar] [CrossRef]
  43. Yehliu, K.; Vander Wal, R.L.; Boehman, A.L. A comparison of soot nanostructure obtained using two high resolution transmission electron microscopy image analysis algorithms. Carbon 2011, 49, 4256–4268. [Google Scholar] [CrossRef]
  44. Dobiasova, L.; Stary, V.; Glogar, P.; Valvoda, V. Analysis of carbon fibers and carbon composites by asymmetric X-ray diffraction technique. Carbon 1999, 37, 421–425. [Google Scholar] [CrossRef]
  45. Ai, Y.L.; Yang, Y.Q.; Wang, X.X. Measurement of graphitization degree of carbon-carbon composites by X-ray diffraction. Coal Convers. 2009, 32, 72–74. [Google Scholar]
Figure 1. Schematic diagram of experimental system.
Energies 10 00122 g001
Figure 2. Aggregation morphology of nascent soot particles under different conditions: (a) pure ethylene; (b) 1-pentanol/ethylene; (c) 3-methyl-1-butanol/ethylene; (d) 2-methyl-1-butanol/ethylene.
Energies 10 00122 g002
Figure 3. Initial HRTEM images at high magnification of nascent soot particles and partial enlarged images of soot particles under different conditions: (a) initial HRTEM image of pure ethylene; (b) partial enlarged image of F1; (c) initial HRTEM image of 1-pentanol/ethylene; (d) partial enlarged image of F2; (e) initial HRTEM image of 3-methyl-1-butanol/ethylene; (f) partial enlarged image of F3; (g) initial HRTEM image of 2-methyl-1-butanol/ethylene; (h) partial enlarged image of F4.
Energies 10 00122 g003
Figure 4. Distribution map of separation distances of nascent soot particles under different conditions: (a) pure ethylene; (b) 1-pentanol/ethylene; (c) 3-methyl-1-butanol/ethylene; (d) 2-methyl-1-butanol/ethylene.
Energies 10 00122 g004
Figure 5. Image processing results of nascent soot particles under different conditions: (a,b) pure ethylene; (c,d) 1-pentanol/ethylene; (e,f) 3-methyl-1-butanol/ethylene; (g,h) 2-methyl-1-butanol/ethylene.
Energies 10 00122 g005aEnergies 10 00122 g005b
Figure 6. XRD spectra of nascent soot particles under different conditions: (F1) pure ethylene; (F2) 1-pentanol/ethylene; (F3) 3-methyl-1-butanol/ethylene; and (F4) 2-methyl-1-butanol/ethylene.
Energies 10 00122 g006
Figure 7. Repeatability test of pure ethylene flame soot nascent particles.
Energies 10 00122 g007
Figure 8. TG & DTG curves of nascent soot particles under different conditions: (a) pure ethylene; (b) 1-pentanol/ethylene; (c) 3-methyl-1-butanol/ethylene; (d) 2-methyl-1-butanol/ethylene.
Energies 10 00122 g008aEnergies 10 00122 g008b
Figure 9. Comparison of TG curves of nascent soot particles under different conditions
Energies 10 00122 g009
Table 1. Physical properties [32] and related information of the pentanol isomers.
FuelBoiling Point 1/°CDensity 1/g·cm−3Reagent PurityReagent Brand
1-Pentanol137.30.8110>99.5%MACKLIN Inc., Shanghai, China
3-Methyl-1-butanol131.10.810499.5%
2-Methyl-1-butanol127.50.815299%
1 The data were obtained in the condition of 273.15 K, 101.3 kPa.
Table 2. Experimental conditions of the different blended fuels.
Flame ConditionDilution Ratio αMixing FuelFlow Rate L/min
Mixing FuelCarrier GasEthyleneProtective GasOxidizer
F10.5--0.700.70130.7
F20.51-pentanol0.100.700.59130.7
F30.53-methyl-1-butanol0.100.700.59130.7
F40.52-methyl-1-butanol0.100.700.59130.7
Table 3. The graphitization degree the under different conditions.
Flame Conditionθ002d002/nmg/%
F124.61030.3614−202.82
F224.48760.3632−223.55
F324.38530.3647−241.00
F424.71270.3600−185.67
Table 4. Oxidation characteristics of nascent soot particles under different conditions.
Flame ConditionFuelInitial Oxidation TimeMaximum Oxidation Rate TimeThe Half Time of OxidationOxidation Finishing Time
ti/mintmax/minth/mintf/min
F1Ethylene1.041.086.0832.8
F21-Pentanol/ethylene1.012.045.3626
F33-Methyl-1-butanol/ethylene0.805.3227.38
F42-Methyl-1-butanol/ethylene1.1606.632.24

