Article

An Experimental Facility to Validate Ground Source Heat Pump Optimisation Models for the Australian Climate

Queensland Geothermal Energy Centre of Excellence, School of Mechanical and Mining Engineering, The University of Queensland, Brisbane 4072, Queensland, Australia
*
Authors to whom correspondence should be addressed.
Energies 2017, 10(1), 138; https://doi.org/10.3390/en10010138
Submission received: 22 December 2016 / Revised: 12 January 2017 / Accepted: 14 January 2017 / Published: 22 January 2017

Abstract

:
Ground source heat pumps (GSHPs) are one of the most widespread forms of geothermal energy technology. They utilise the near-constant temperature of the ground below the frost line to achieve energy-efficiencies two or three times that of conventional air-conditioners, consequently allowing a significant offset in electricity demand for space heating and cooling. Relatively mature GSHP markets are established in Europe and North America. GSHP implementation in Australia, however, is limited, due to high capital price, uncertainties regarding optimum designs for the Australian climate, and limited consumer confidence in the technology. Existing GSHP design standards developed in the Northern Hemisphere are likely to lead to suboptimal performance in Australia where demand might be much more cooling-dominated. There is an urgent need to develop Australia’s own GSHP system optimisation principles on top of the industry standards to provide confidence to bring the GSHP market out of its infancy. To assist in this, the Queensland Geothermal Energy Centre of Excellence (QGECE) has commissioned a fully instrumented GSHP experimental facility in Gatton, Australia, as a publically-accessible demonstration of the technology and a platform for systematic studies of GSHPs, including optimisation of design and operations. This paper presents a brief review on current GSHP use in Australia, the technical details of the Gatton GSHP facility, and an analysis on the observed cooling performance of this facility to date.

1. Introduction

A ground source heat pump (GSHP), also referred to as a geothermal heat pump (GHP), ground-coupled heat pump (GCHP), GeoExchanger, etc., is a heat pump system that utilizes the ground as a thermal energy reservoir. In heating mode, a GSHP uses the ground as a heat source, and in cooling mode as a heat sink. Due to the nearly-constant temperatures of the ground at depths below a certain number of metres, a GSHP operates over smaller temperature differences than heat pumps using the atmosphere as a thermal energy reservoir (i.e., conventional air conditioners). GSHPs consequently achieve energy efficiencies or coefficients of performance (COPs) substantially better than air source air conditioning systems [1,2]. They are therefore regarded as to be green energy technology. GSHP can be widely used in space heating and cooling, domestic appliances (such as water heaters, dryers, fridges etc.) as well as a variety of industrial and agricultural applications where massive heating/cooling is needed [3].
A typical GSHP system for domestic air conditioning consists of three major parts: a ground heat exchanger system, a heat pump, and a heat distribution system or air handling unit (AHU) [4]. GSHPs are generally categorised by the ground heat exchanger types into open-loop systems and closed-loop systems. The latter can be further classified by the well/pipe layouts into horizontal-, vertical-, and “slinky”-types [5]. The vertical type—borehole heat exchangers—are believed to be more efficient in terms of both cost and thermal exchange than horizontal systems, and thus are the most attractive type in the market.
The concept of ground source heat pumps is first evident in open literature in a Swiss patent from the 1910s, followed by a surge of development in GSHP systems between the late 1940s and early 1950s [6]. A current boom in GSHP technologies began in the 1970s, mainly in Europe and North America. Over the past three decades, the GSHP industry has rapidly expanded world-wide, with annual market growth rates ranging from 10% to 30% in recent years. The global installed capacity of GSHP was approximately 50 GWth in 2015, with approximately 80% installed in Europe and North America [3]. It is estimated that by 2020, the world will surpass 120 GWth of GSHP capacity, including a tripling of capacity in the Asia–Pacific region [3].
While GSHPs are becoming common in North America and Europe, they have had limited uptake in Australia [7]. With a carbon-constrained future, Australia has a substantial opportunity to improve energy efficiency through increased GSHP use. However, there is a need for greater clarity around optimal technical and commercial design for the Australian climate and consequent space heating and cooling demands. The Queensland Geothermal Energy Centre of Excellence (QGECE) has assisted in this area through discussion with industry, preliminary studies on ground heat exchangers and heat pump efficiency [8,9,10,11], and the commissioning of an experimental GSHP facility. The latter—The University of Queensland´s (UQ) Gatton Ground Source Heat Pump Facility—consists of two fully-functioning commercially-designed ground source heat pumps, and a continuous load from the UQ Gatton Campus’ Library. The system is fully instrumented, including all system temperatures and flows, and an array of thermocouples in the ground offset from the ground heat exchangers. It is to our knowledge the most comprehensively measured GSHP system, consequently providing a world-class research capability to validate GSHP thermal models and their use in optimising GSHP design and operation. This paper reviews current GSHP use in Australia, provides a detailed description of the Gatton GSHP Facility, and presents preliminary observations of the ground thermal response and heat pump cooling performance.

2. Ground Source Heat Pump (GSHP) in Australia

The GSHP industry in Australia is subject to the same challenges as GSHPs elsewhere in the world, as well as particular local challenges and opportunities, most notably climate and climate variability, large demand for space cooling, low population density, expensive electricity, established mining and geotechnical industry, and local geological features.

2.1. Opportunities

Australia includes a wide range of climates from south to north and from coastal to interior, including temperate, grassland, desert, subtropical, tropical, and equatorial climate zones [12]. It is consequently not possible to generalise GSHP designs for all, or even most Australian sites. Nonetheless, the majority of the country’s population inhabit areas with a warm climate, with relatively mild winters and hot, dry summers. The southern parts of the country can experience substantial seasonal lows with temperatures sometimes well below zero. Table 1 shows temperature variability of six major Australian cities, illustrating the implicit variation in demand for space heating and cooling.
Additionally, due to substantially higher solar irradiance than experienced in the most populous parts of the Northern Hemisphere, Australian indoor daytime temperatures are usually higher than the meteorological measurements. This further increases the already substantial climate-induced demands for space cooling.
Despite Australia’s small national population, the existing capacity of the Australian air-conditioning market is substantial. It was estimated that, by 2011, there were more than 11.5 million stationary air conditioning units for domestic and business space cooling/heating [14], or approximately 0.5 units per capita. The overwhelming majority of them are traditional air source heat pumps. These units collectively consume 36,845 GWh of electricity annually [14]—approximately 14.7% of total electricity generation—and are the cause of approximately 6.6% of annual Australian greenhouse gas emissions [15].
Having adopted a target of reducing carbon emissions to 26%–28% of 2005 levels by 2030 [16], Australia is under increasing pressure to use more green and renewable energy. Considering GSHPs have been commercially viable from improved efficiency alone in the Northern Hemisphere, this technology could play a critical role in reaching Australia’s greenhouse gas reduction targets. By replacing traditional low-energy-efficiency air sourced heat pumps with GSHPs achieving a two- to three-fold increase in efficiency, Australia has an opportunity to reduce national carbon emissions on the order of 3.3%. This indicates the substantial potential environmental benefit for Australia of increased GSHP uptake.
In addition to the above consideration, Australia provides at least these excellent conditions for the profound development of the GSHP industry:
1 Low population density
The population density in Australia, approximately 2.9 persons per km2 is much lower than in Europe (120 persons per km2 in the European Union) and the USA (35 persons per km2). This provides an advantage for applications of ground source heat pumps, as more available land area increases flexibility of GSHP design and construction, consequently reducing capital investment.
2 Expensive electricity
Australian electricity prices are high (the effective nationwide residential electricity price is $0.29 AUD/kWh [17]) compared to the US ($0.10 USD/kWh [18]), and higher than many European countries (domestic consumer prices including taxes and levies averages around €0.14 EUR/kWh for the 28 EU countries as of 2015 [19]). Higher electricity prices improve the commercial competitiveness of GSHP compared to conventional air-conditioning systems due to their reduced power demand.
3 Established mining and geotechnical technological capabilities
The Australian economy has historically had a large mining sector, contributing 8% of Australia’s GDP [20]. This has been associated with mature, world-class mining technology and services companies, including drilling, geotechnical and geological surveying, and underground resource management capabilities. Many of these technologies and services are transferrable to GSHP applications. This provides the potential for rapid future growth of a GSHP industry despite limited current activity. Furthermore, there may be opportunities to innovate on global best-practice GSHP construction and drilling techniques by utilising advances in the mining sector, ultimately further reducing GSHP costs and improving competitiveness.

2.2. Current State and Challenges

An estimation based on limited public information shows current total capacity of the GSHP in Australian market is around 2.50 MWt [3]. While development of GSHP technology is expected to be industry-led, there are very few companies in Australia that currently offer commercial or residential GSHP design and construction services. A small number of projects have been commissioned, including the Geoscience Australia (GA) office building in Canberra, the Integrated Energy Management Centre, Antarctic Centre, and Aquatic Centre in Hobart. The GA building project remains the country’s largest GSHP installation as of December 2014 [21]. Several new big projects have been announced, including a GSHP network for an 800-block housing estate at Fairwater near Blacktown in Sydney’s west [21]. Current Australian GSHP research activities are limited, with the main research having been conducted by Melbourne University on ground heat exchangers, and Monash University on geothermal energy piles [7,22].
Consequently, the Australian GSHP industry faces substantial challenges in establishing GSHPs as a widely-accepted technology. The most critical current challenges are high installation prices and a lack of specific optimisation principles, both related to business activity and GSHP design and performance. Both challenges, although particularly the former, are due to the small volume of the national market.
The initial cost for a GSHP system in Australia and New Zealand is currently in the range from $25,000 to > $30,000 AUD for a typical house with thermal capacity usually lower than 10 kW [23]. The cost is six to eight times higher than a conventional air-conditioning system. GSHP installation prices in Australia are higher to those in the USA which average $1900 USD for per kW. Whereas in the USA these prices are well-accepted by the market, in Australia there has not been a large uptake, despite higher electricity prices, which should favour GSHP use. This discrepancy is generally attributed to a lack of familiarity of Australians with GSHP technology, implying that sufficiently widespread GSHP implementation may in itself initiate substantial growth of the GSHP industry. Additionally, economies of scale of a mature GSHP market may reduce the GSHP installation costs in Australia, as has happened in other parts of the world [23].
Lack of GSHP system optimisation principles is another serious issue for the Australian GSHP industry. Currently, the country relies on the existing industry standards developed mainly in Europe and North America. In Europe, most GSHP applications are sized for base heating load targeting at equivalent full-load heating hours up to 6000 h [3]. GSHP units in U.S., on the other hand, are usually sized for peak cooling load and average over 2000 equivalent full-load heating hours per year [3]. Australian GSHP applications are more similar to those in U.S., and thus are it may be better to adopt US standards. However, the standards are not optimised for the climate and heating/cooling load differences between Australian and North American deployments. The particular design requirements for Australian GSHPs are firstly, a much larger absolute cooling requirement; and secondly, a much larger relative requirement of cooling in proportion to heating. This causes the ground resource more biased towards heat sinks. In contrast, North American applications tend to be more balanced between cooling and heating. The final consequence is that there will be different long-term ground temperature variations involved in typical GSHP operation, and potentially very different dynamics of the system over the course of the year in Australia. This means that guidelines from North America and Europe may result in considerably suboptimal designs. Furthermore, Northern Hemisphere guidelines are mainly driven by the heating, ventilation and air conditioning (HVAC) industry instead of the geotechnical industry, and therefore GSHP designs may not sufficiently account for the thermal characteristics of the ground at Australian sites [7]. Consequently, the designers of existing GSHP projects in Australia have usually tended to be either conservative or over-optimistic, resulting in either over- or under-designed systems that are even less competitive. Therefore, there is an urgent need to develop a set of design and optimization principles of GSHPs for Australian conditions and requirements, as supplementary guidelines on the basis of existing industry standards.

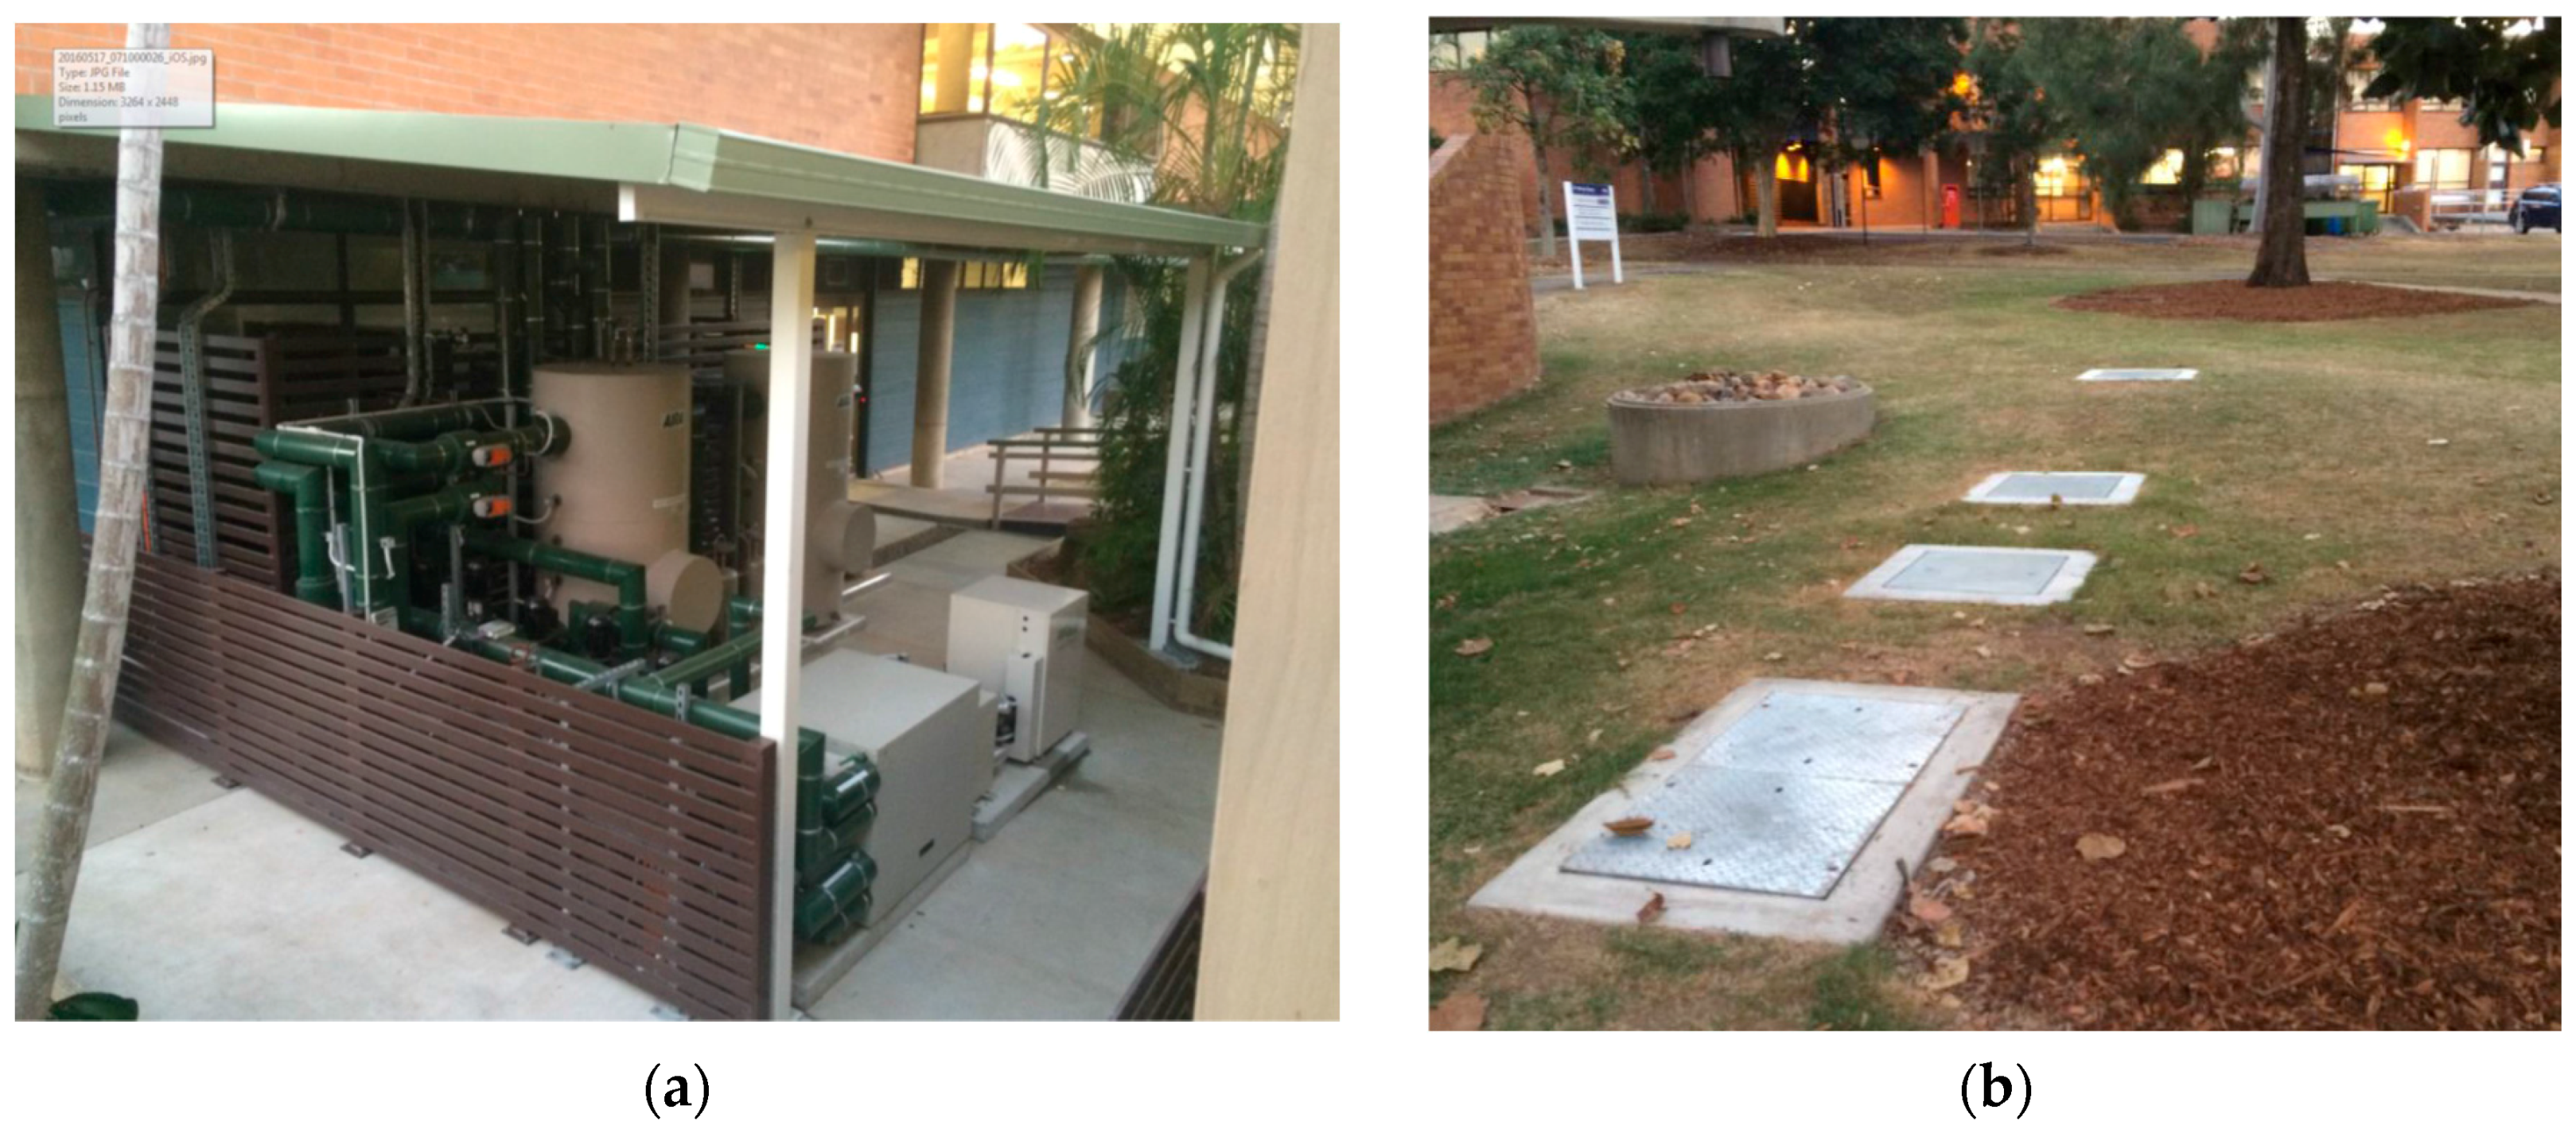
3. Gatton Ground Source Heat Pump (GSHP) Facility

With the goal of providing a basis for data collection, models validation, and new technology verification to assist in the development of design and optimisation principles for GSHPs for Australian climates, an experimental and demonstrative GSHP facility has been constructed at The University of Queensland’s Gatton campus. The Gatton campus is located in South East Queensland, approximately 80 km east to Brisbane and 5 km outside of the town of Gatton. The campus has a sub-tropical climate, with highest and lowest daily temperatures of 44.5 °C and 11.8 °C, respectively. The campus overlies sandstone beds featuring coarse- to medium-grained sandstone with clay matrix.

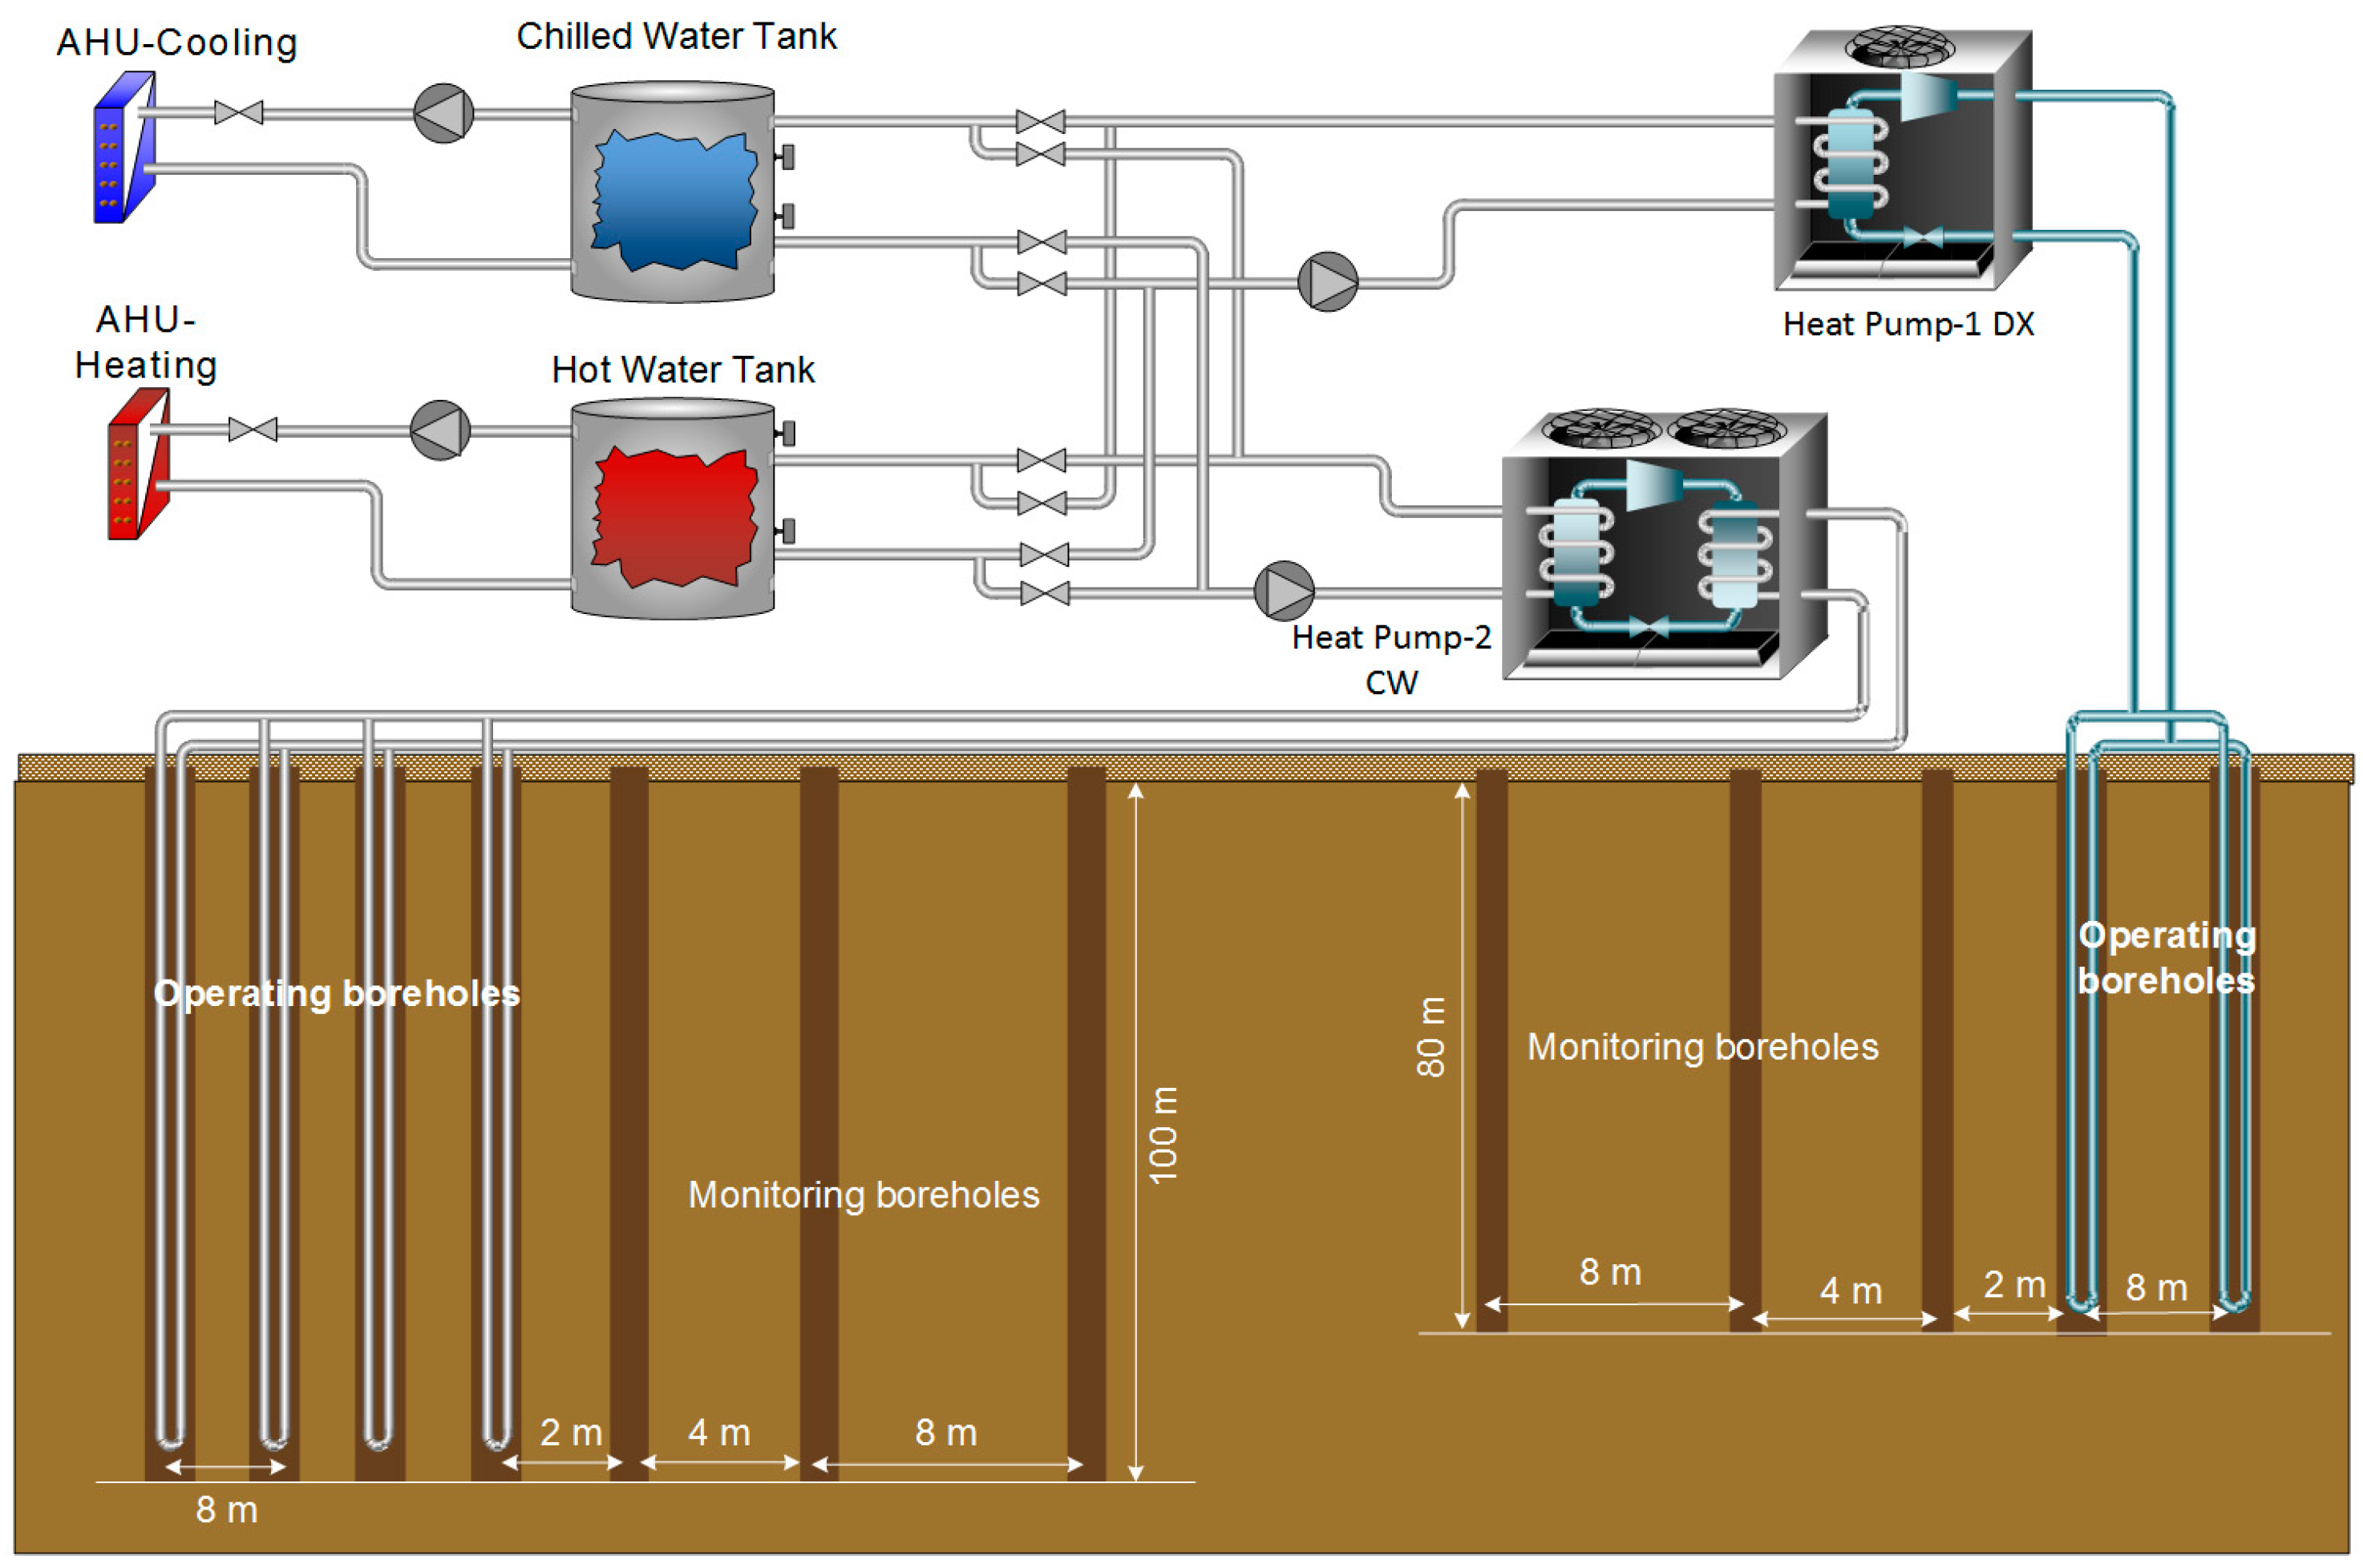
3.1. System Description

The Gatton ground source heat pump plant (Figure 1) is a vertical borehole type system. It serves as both a functional installation for the J.K. Murray Library of Gatton campus and an experimental facility for QGECE. The installation was fully commissioned in early 2016.
The Gatton GSHP plant consists of two independent ground heat exchanger-heat pump loop systems: a refrigerant direct expansion (DX) loop and an indirect condenser water (CW) loop, with a design cooling/heating capacity of 20 kW in each loop system. The use of two heat pump loops allows direct comparisons between the two most popular current GSHP system options.
In the DX loop, the refrigerant used in the heat pump is directly circulated through the copper ground U-tubes installed in two 80-m-deep heat rejection boreholes. In contrast, the CW system uses an additional heat exchanger at the ground surface to transfer heat between the refrigerant and condenser water. The water is then circulated through the ground loop consisting of four 100-m-deep operating boreholes in a square diamond pattern. The six operating boreholes, regardless of the depth, are all 8 meters apart. Apart from the operating boreholes, each loop system has three monitoring wells at the same depth of its operating boreholes ambient ground temperatures with depth, as shown in Figure 1b. In addition, there is a 100-m-deep background monitoring borehole approximately 50 m away from its nearest operating borehole. This well provides reference measurements on the ground conditions of this area during the long-term operation of GSHP system.
On the ground, the two heat dumps supply hot or chilled water to a number of air handling units (AHU) within the library via a complex plumbing system. One hot water tank and one chilled water tank, both with capacities of 500 L, are connected into the water piping network for heating mode and cooling mode, respectively. The two tanks act as buffers to counter any temporary imbalance between the instantaneous capacity of the heat pumps and heating or cooling demand. The plant is designed for fully automatic control and also permits manual control of operational mode for each heat pump.
Figure 2 shows a schematic of the entire Gatton GSHP plant. The detailed specifications of the two ground heat exchanger-heat pump loop systems are listed in Table 2.
As an experimental facility, the GSHP plant is comprehensively instrumented. PT100 series resistance thermometers are installed at 5 m depth, and every 20 m along the borehole depth for the background monitoring borehole, for the three monitoring boreholes for each GSHP system, and for one heat exchange borehole for each GSHP system (the heat exchange borehole located adjacent to the monitoring wells).
In addition to earth temperature, the underground water pressure is also monitored at the bottom of the background monitoring borehole using a pressure sensor. On the ground, the two heat pump units and the plumbing system including all the major valves and supply pumps are all monitored through temperature, pressure, flow sensors and energy meters. Real-time monitoring data from the instrumentation is logged onto a building management system (BMS) and can be accessible via a cloud based online system.

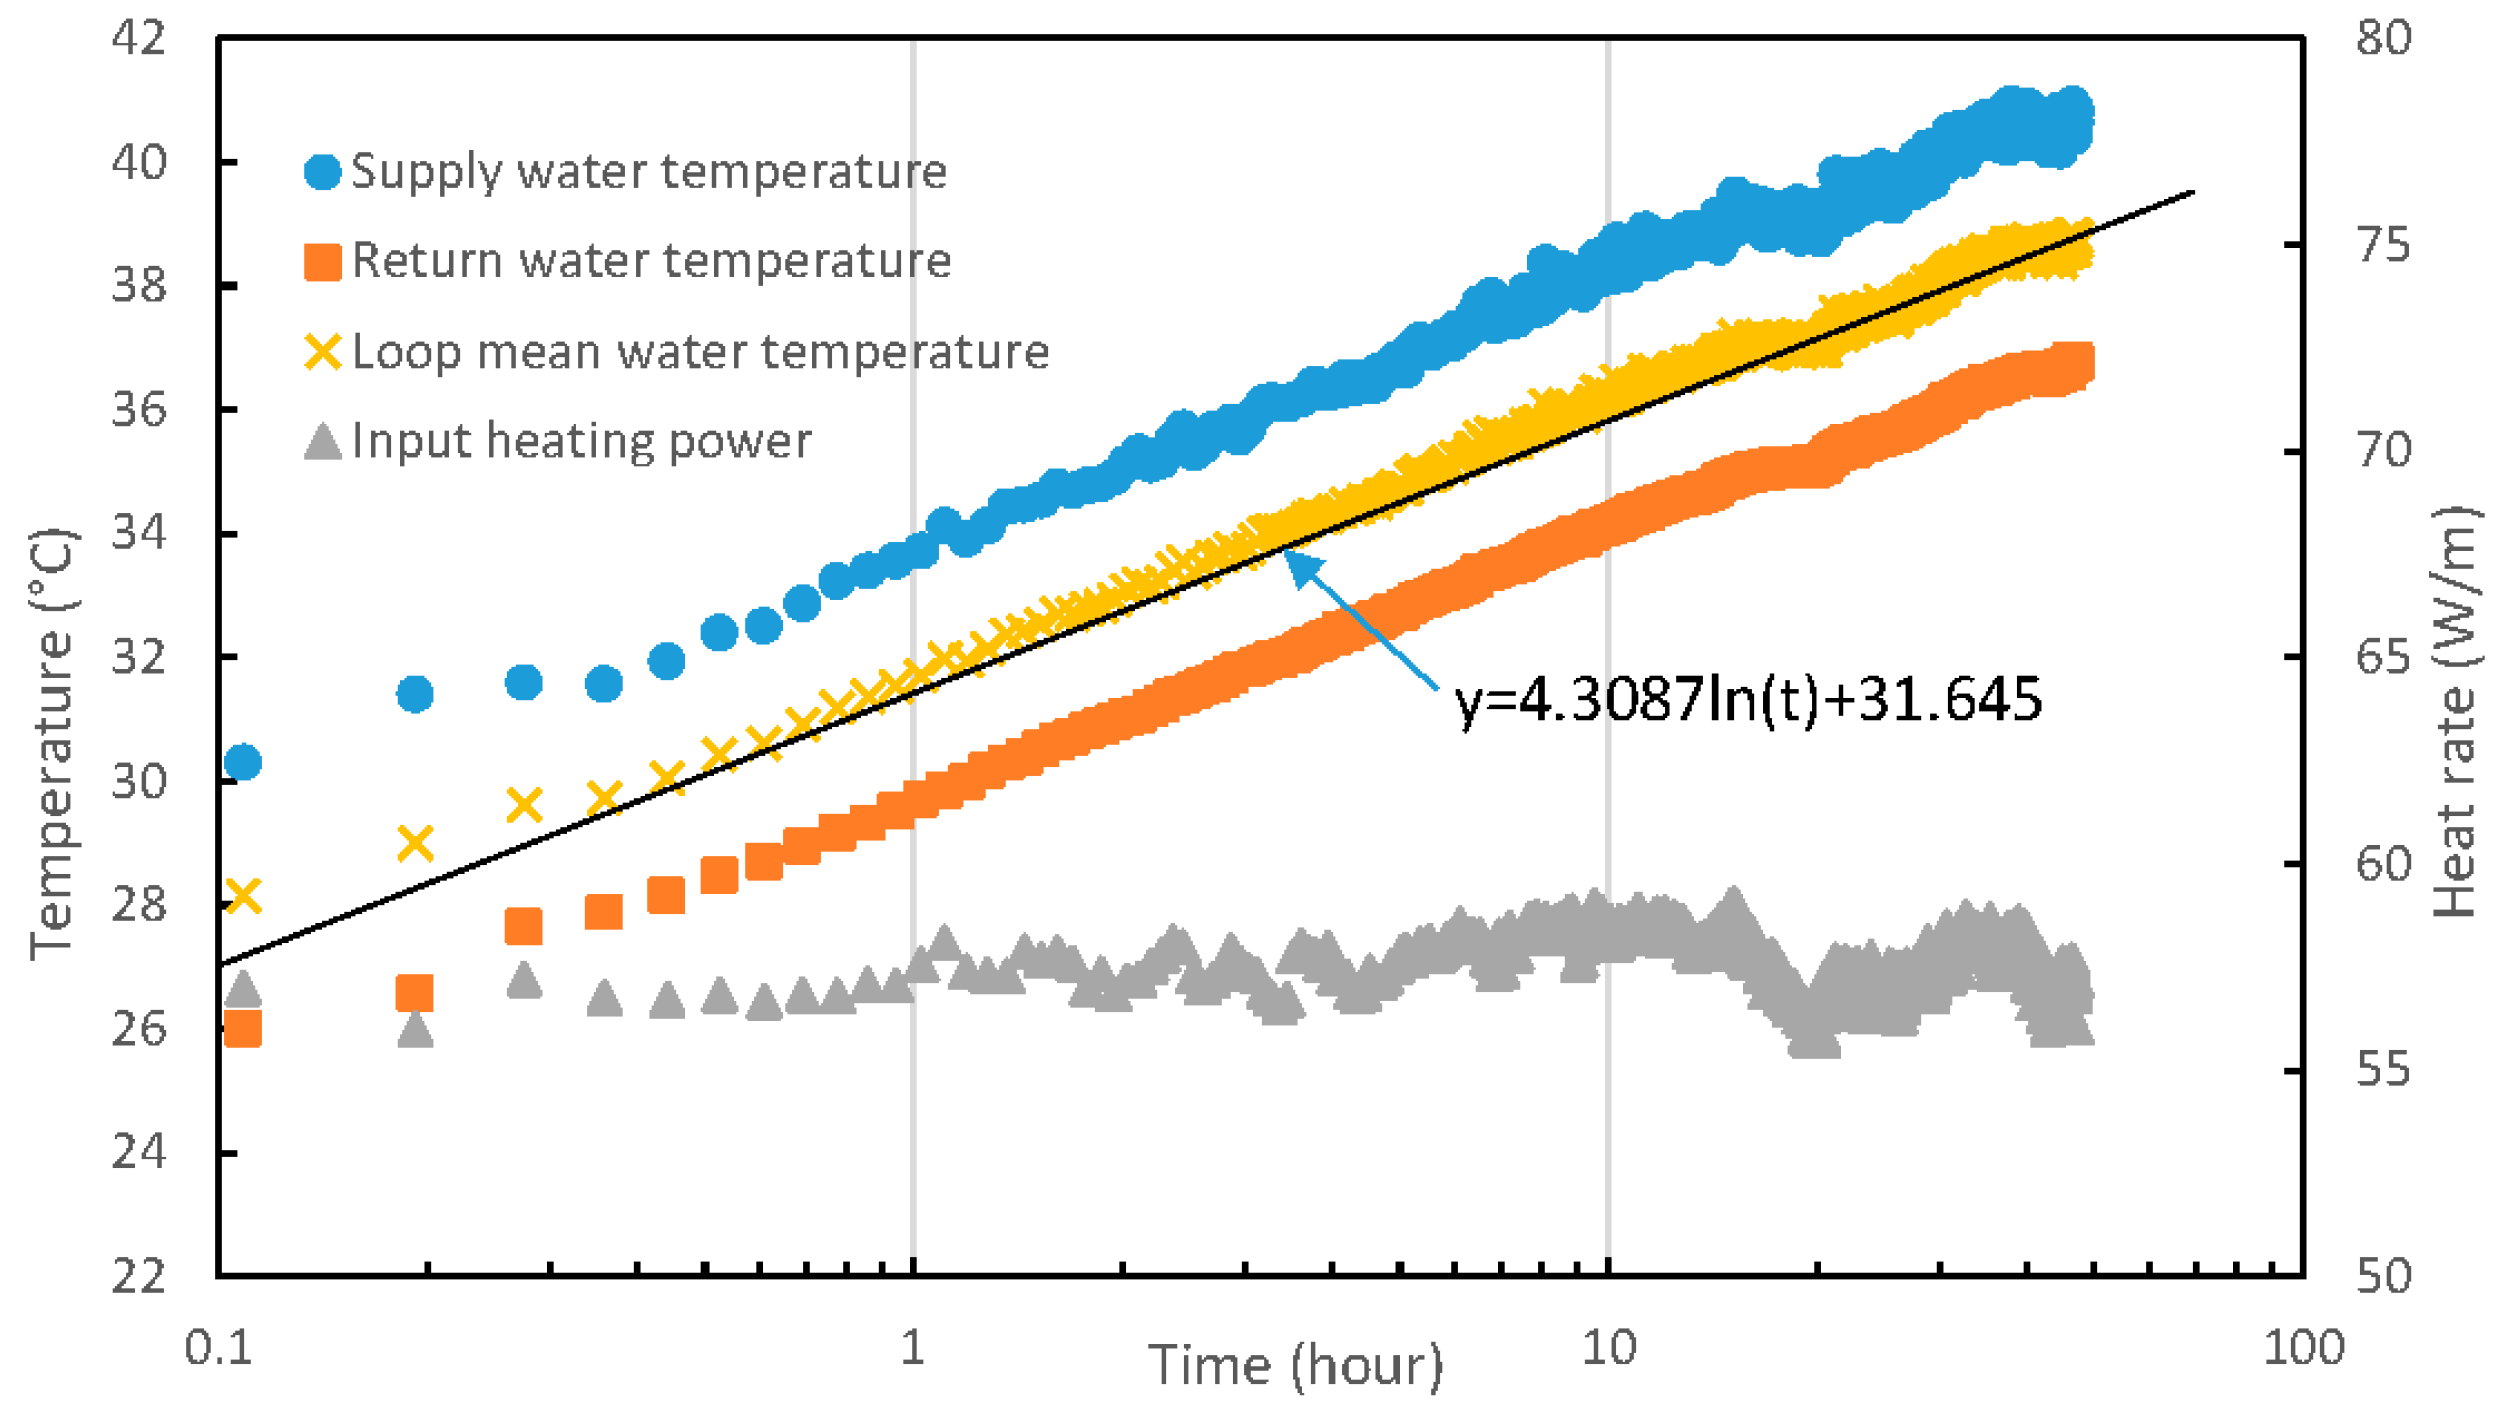
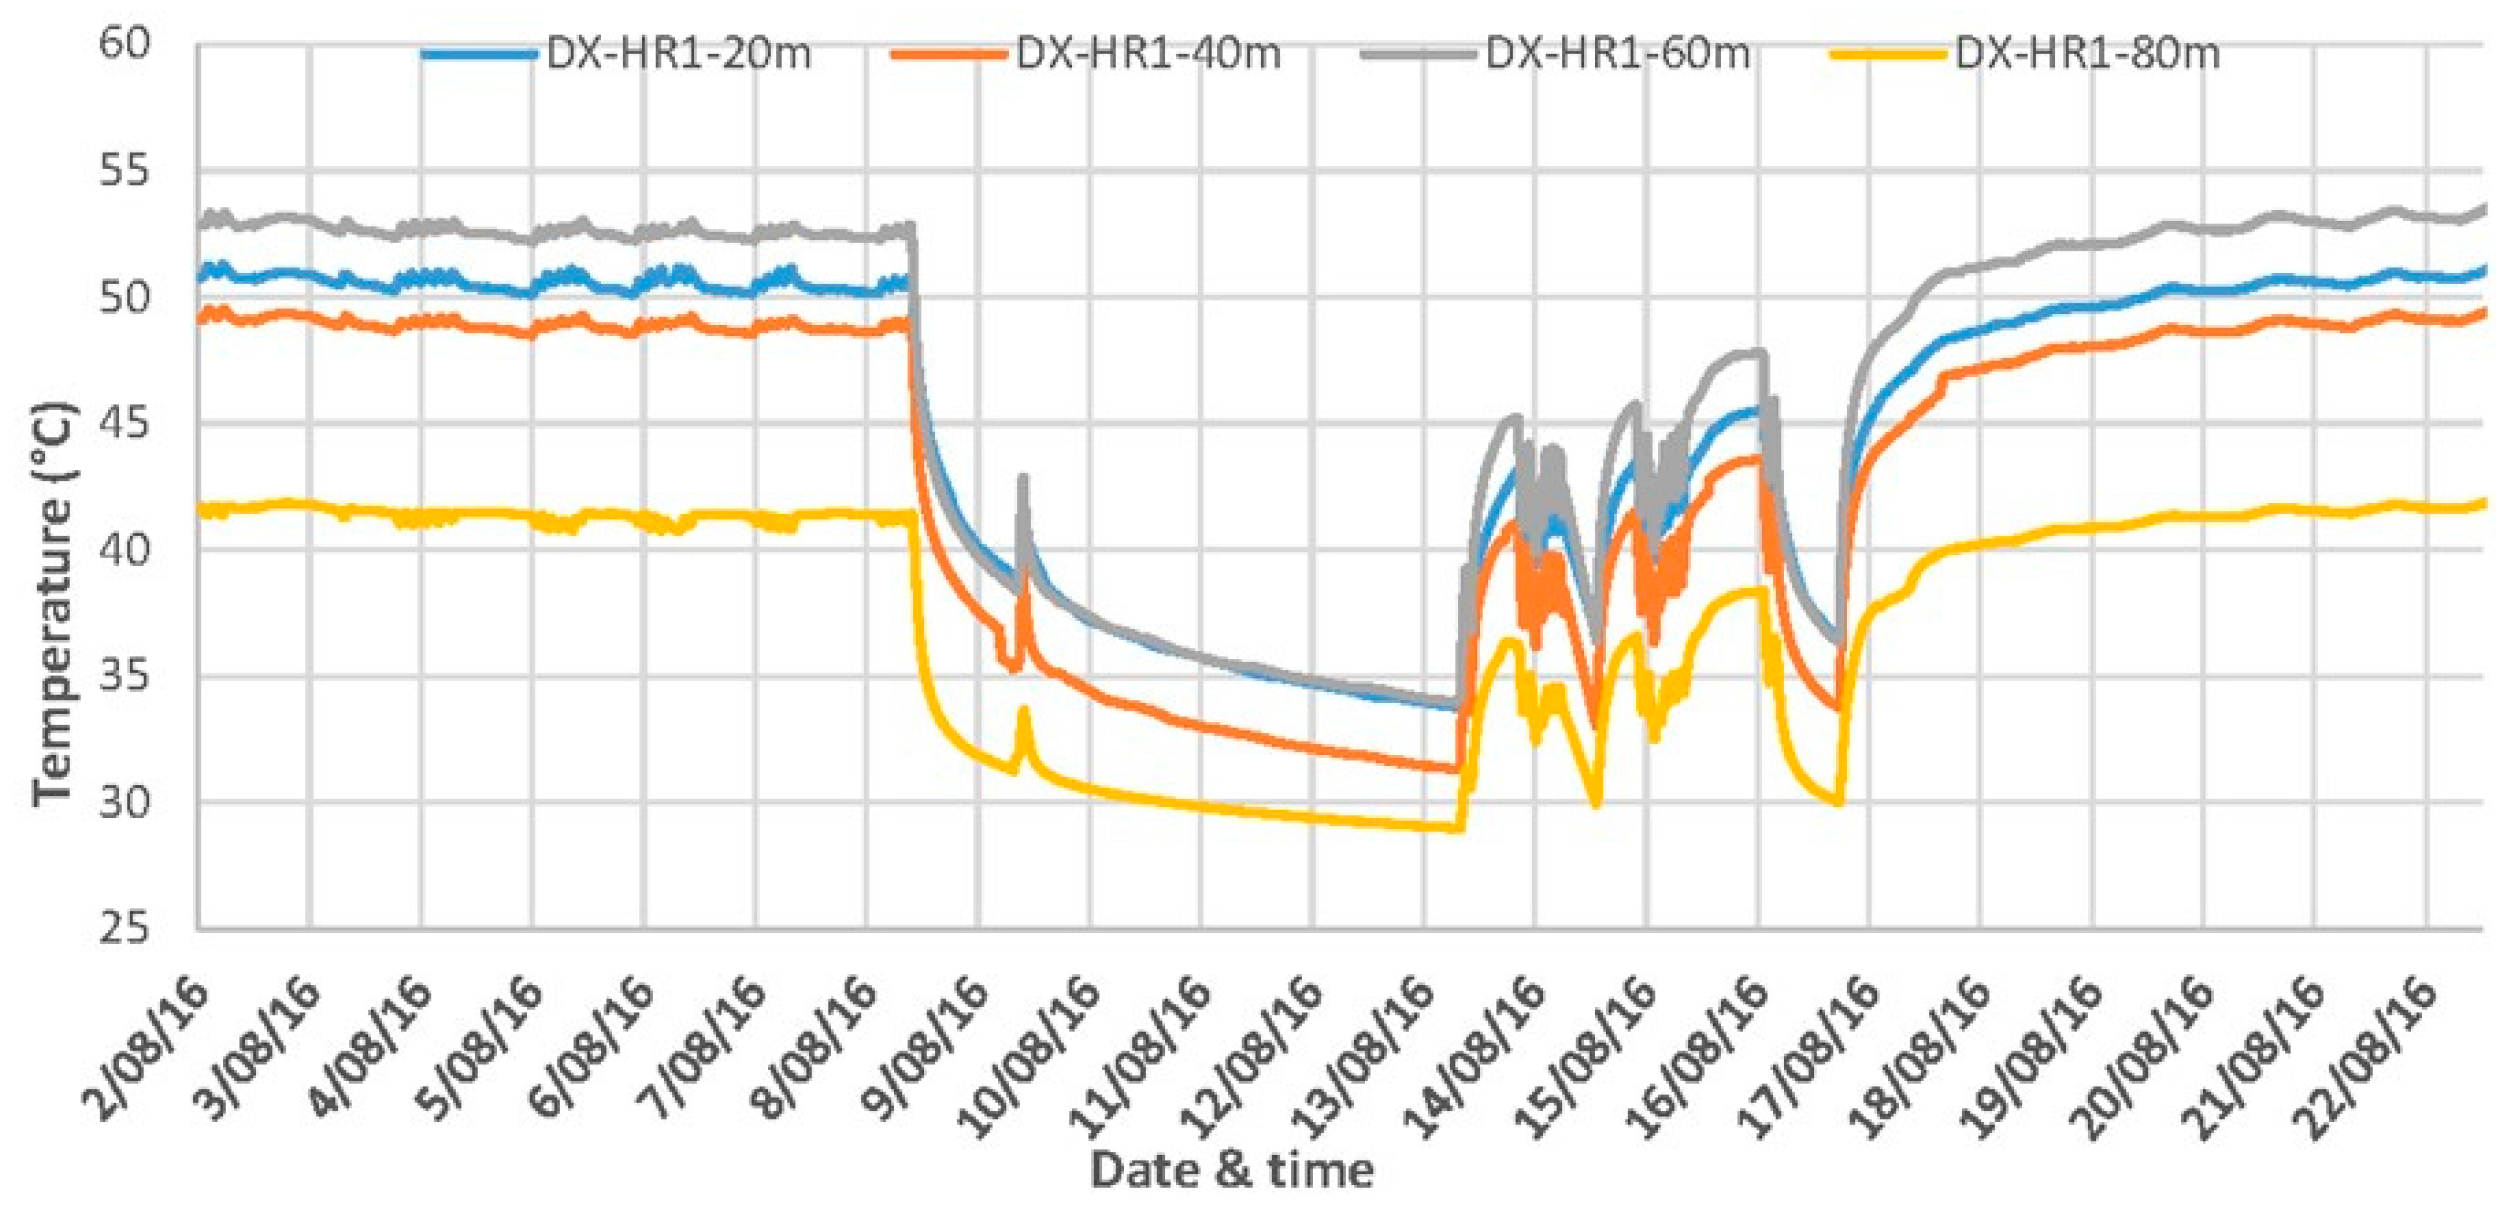
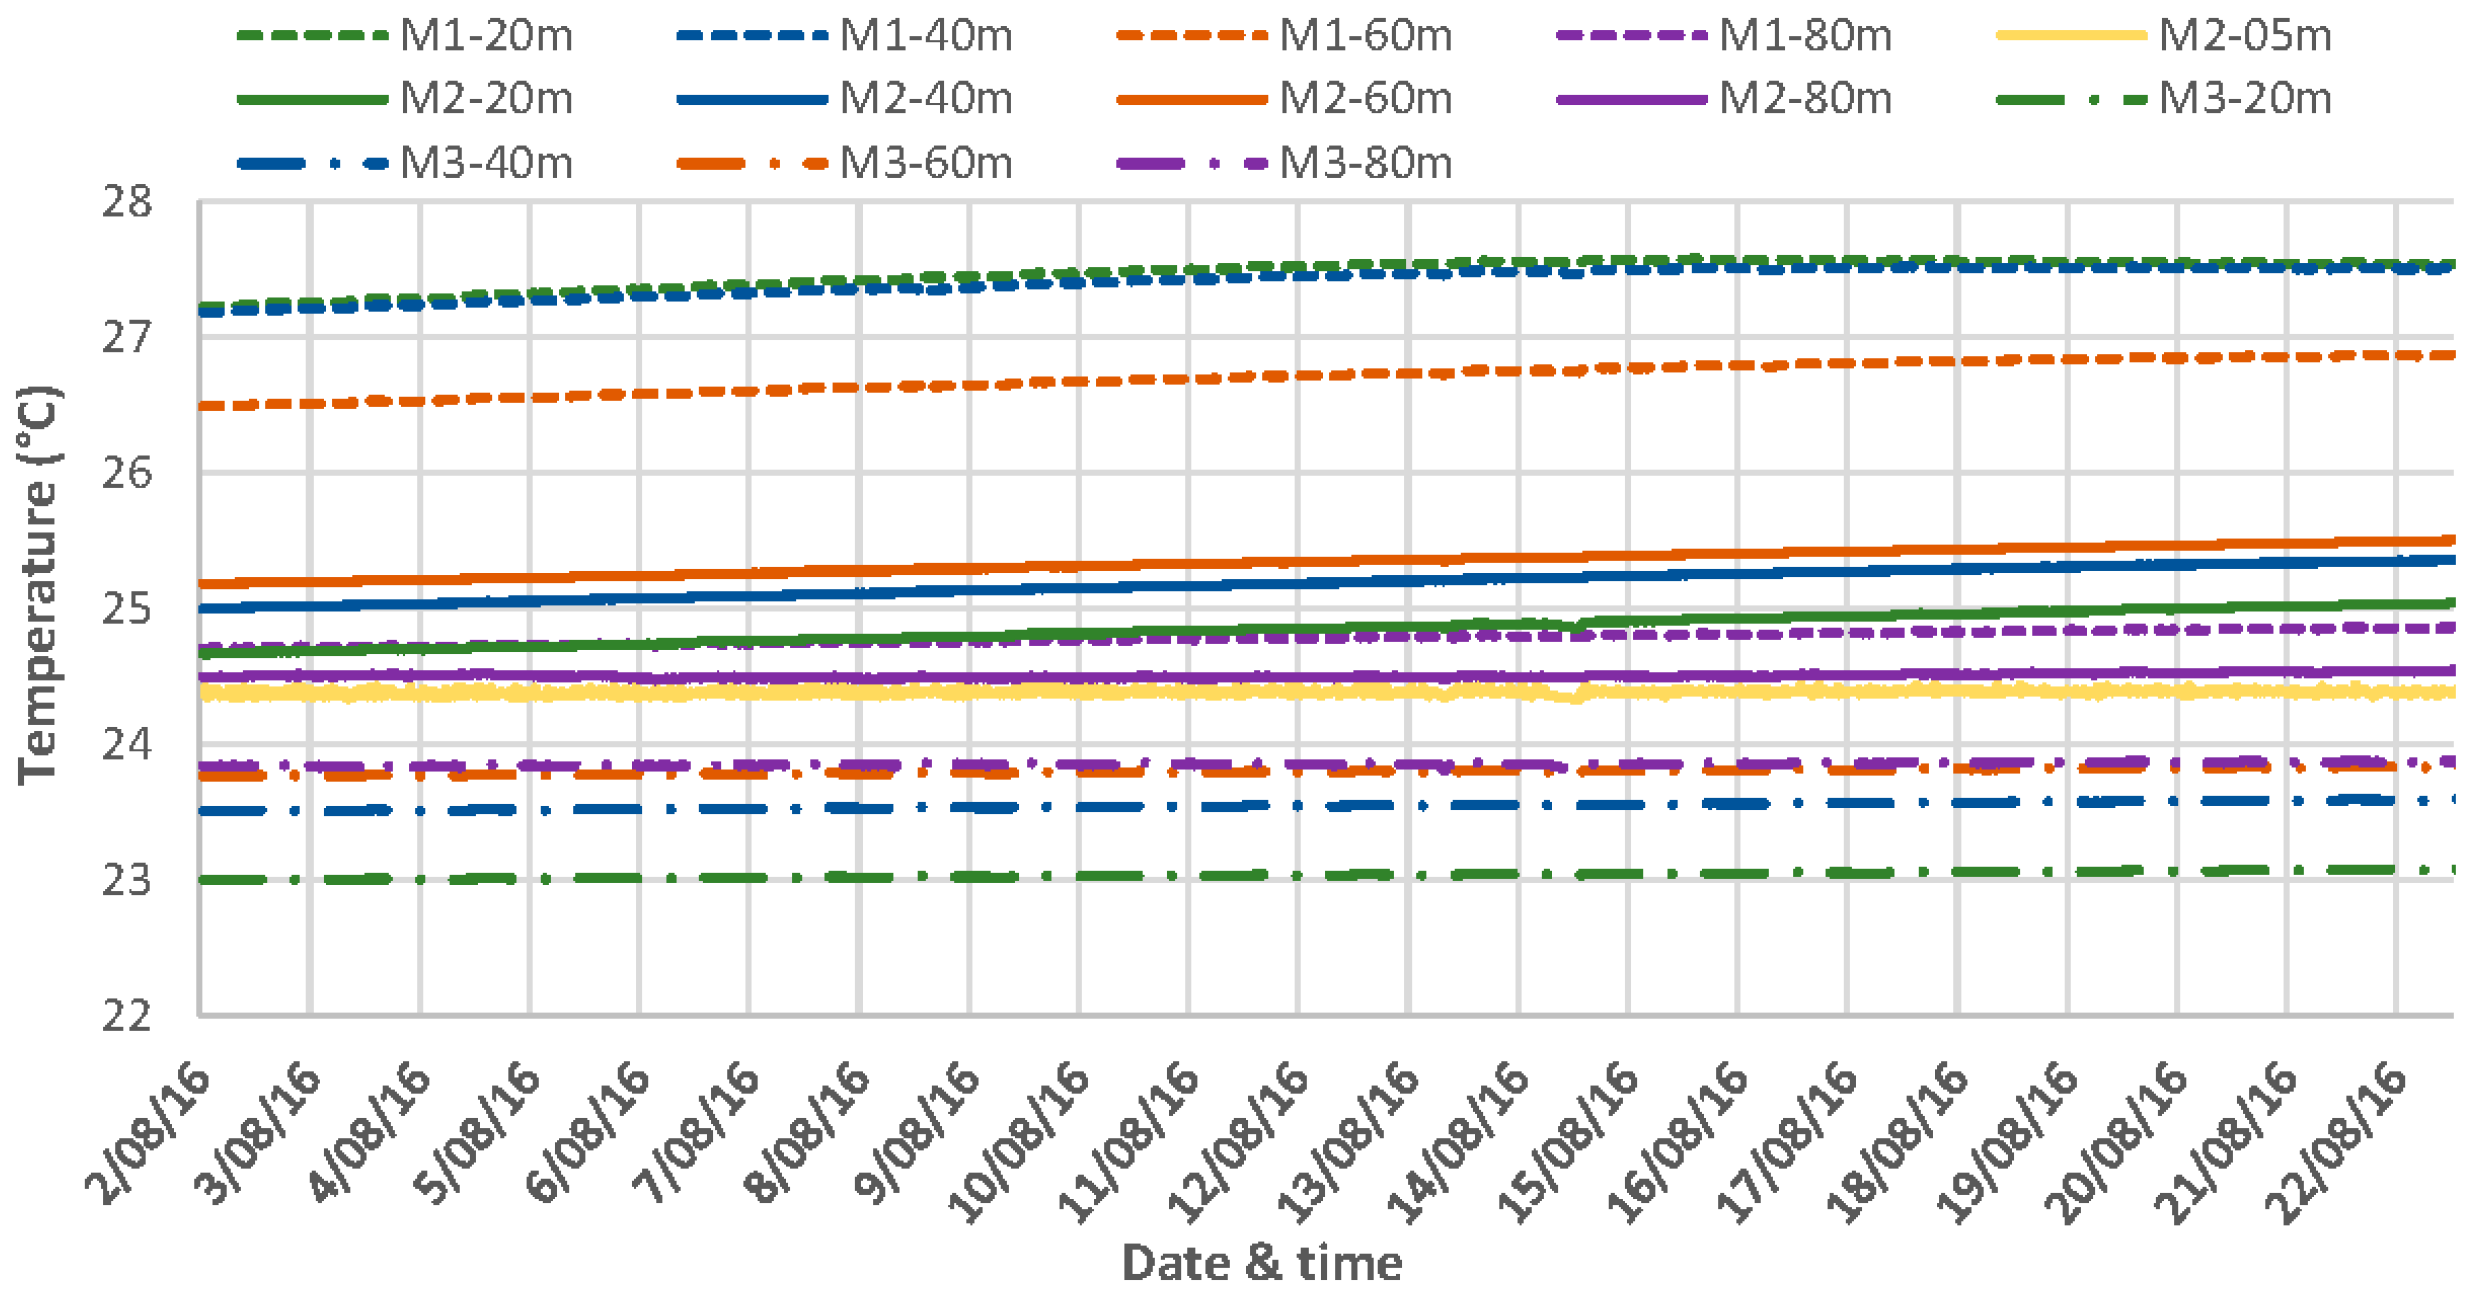
3.2. Ground Thermal Condition

The thermal conductivity and diffusivity of the rock formation into which the ground heat exchanger is inserted determine not only the ground heat exchanger size but also the long-term performance of the GSHP system. Higher thermal conductivity allows the rock is able to conduct heat away at a faster rate (i.e., achieving better performance during operation), and to return to initial temperatures within a shorter time period (i.e., allowing better performance improvements from system downtime). Additionally, the temperature of the ground after a few years’ operation is predictable if the ground thermal properties are known. Hence, the conductivity and diffusivity of the location where the GSHP system is installed are of great importance.
A formation thermal conductivity test was conducted on the Gatton GSHP plant three months after the completion of the loop installation, following the American Society of Heating, Refrigeration, and Air-Conditioning Engineers and the International Ground Source Heat Pump Association procedures. During the test, one U-tube of the CW loop was filled with water and connected to a mobile geothermal test unit which heated the water at an approximately constant rate. The heated water was circulated in the U-tube, and the following measurements were recorded at 5-min intervals for a period of 48 h: water loop temperature at the inlet (supply) and outlet (return) of the borehole, the arithmetic mean of both, and the heating power.
The circulating water used in the test had already been stored in the U-tube for several hours before the test start-up. The return water temperatures measured in the first few minutes of the test before heating was commenced were assumed to represent undisturbed ground temperatures, among which the lowest one approximately indicates the temperature at the base of the borehole. Table 3 presents summary statistics of the formation thermal conductivity test.
The data from the thermal conductivity test was analysed using the Kelvin’s line source theory, which approximates the borehole heat exchanger as an infinitely thin line source of heat and assumes constant ground thermal properties (i.e., that the grout and local perturbations in the surrounding earth have negligible effect). According to the theory, the ground temperature T, as a function of radial distance r from the line source at time t, is given by:
T ( r , t ) T 0 = q 4 π k L r 2 4 α t e u u d u 2.303 q 4 π k L ln ( 4 α t γ r 2 )
where k is the ground thermal conductivity in W/(m·°C); L is borehole depth in m, q is heat input rate in W; r is radial distance from the line source in m; t is time in h; T0 is the initial (undisturbed) earth temperature in °C; α is the soil thermal diffusivity in m2/s; and γ is a dimensionless constant.
As the borehole thermal test is sufficiently long, the outward conduction through the earth from the borehole dominates the heat transfer between the circulating water and the ground. Therefore, it is assumed that the borehole wall temperature, T(b,t), is equal to the mean water temperature inside the U-tubes, T ¯ w , where b is the radius of the borehole. Equation (1) can be therefore rearranged to provide:
T ¯ w = T ( b , t ) 2.303 q 4 π k L ln ( 4 α t γ b 2 ) + T 0 = 2.303 q 4 π k L [ ln ( t ) + ln ( 4 α γ b 2 ) ] + T 0
Equation (2) provides T ¯ w as a function of only t, and more importantly a linear function of ln ( t ) with gradient 2.303 q 4 π k L . If the gradient is denoted β , the ground thermal conductivity can be expressed as:
k = 2.303 q 4 π L β
Figure 3 shows the loop water temperatures and the heat input rate data versus the logarithm of elapsed time. A linear curve fit was applied to the average of the supply and return loop temperature data, starting at the 24th hour, using the method of least squares. The slope of the line was found to be 4.309. Using Equation (3) the thermal conductivity was consequently found to be 2.45 W/(m·K). The thermal diffusivity was estimated to be 0.0093 cm2/s by using the thermal conductivity and the estimated density and specific heat capacity of sandstone.

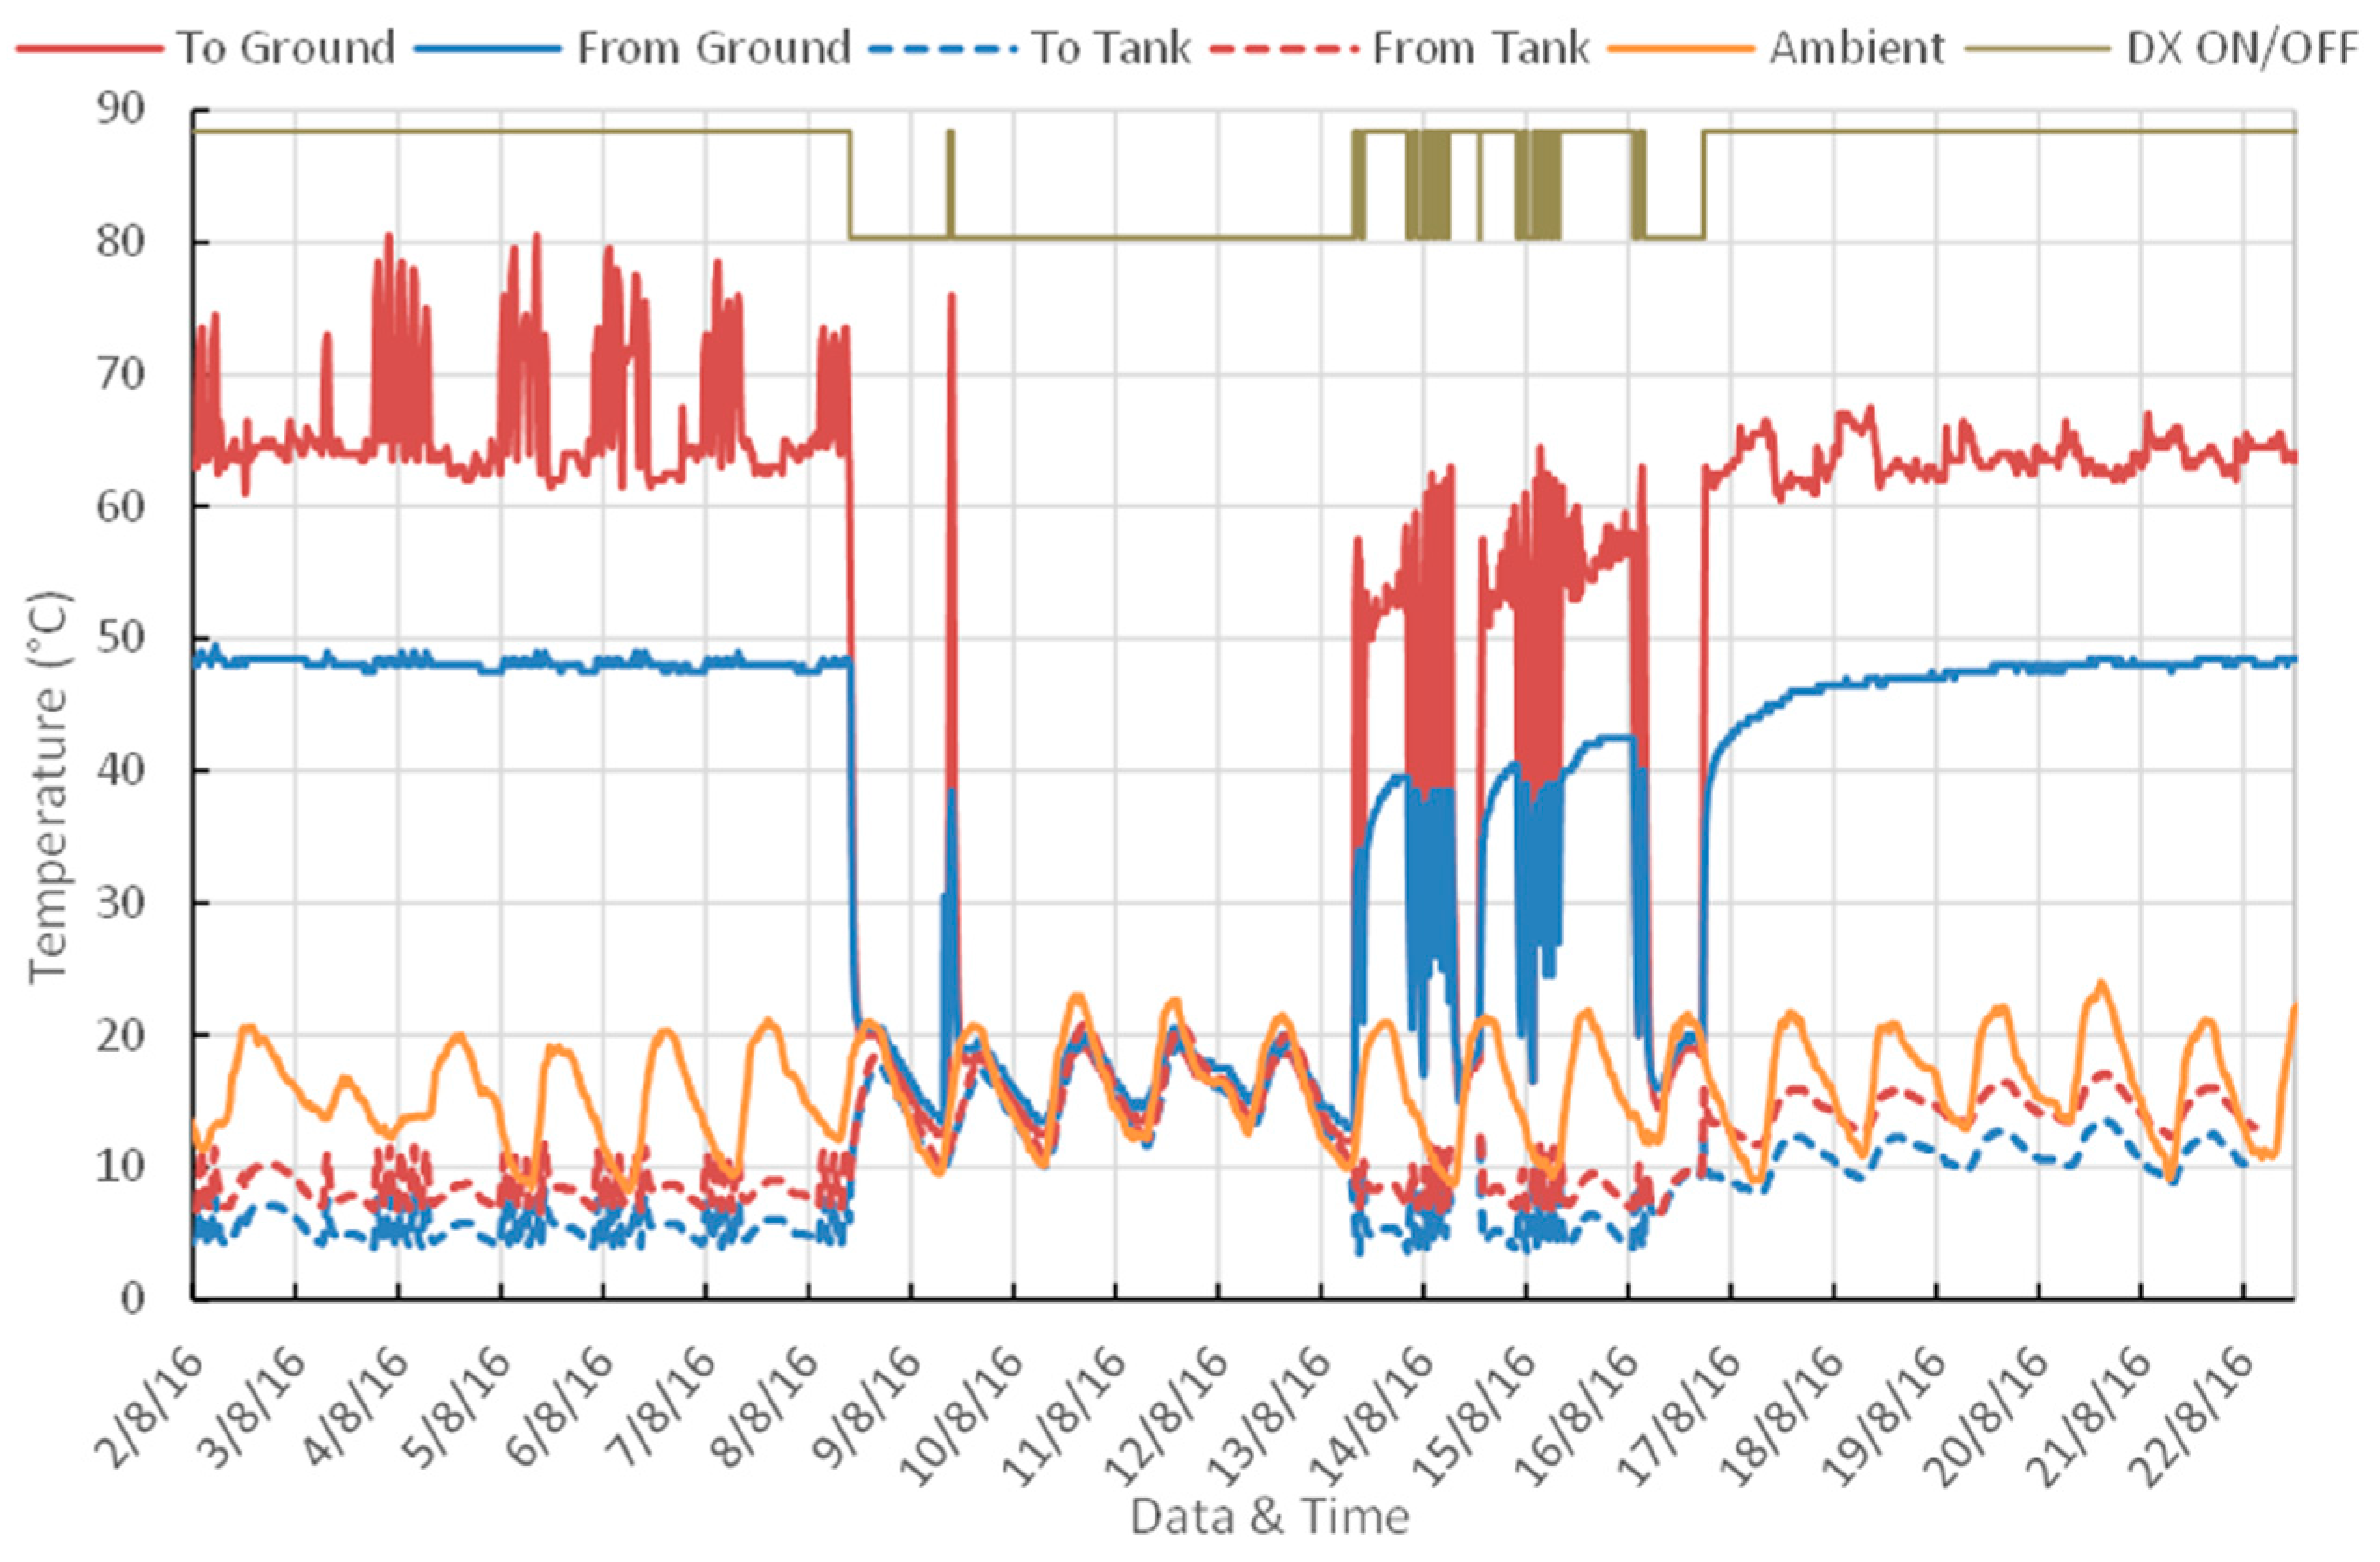
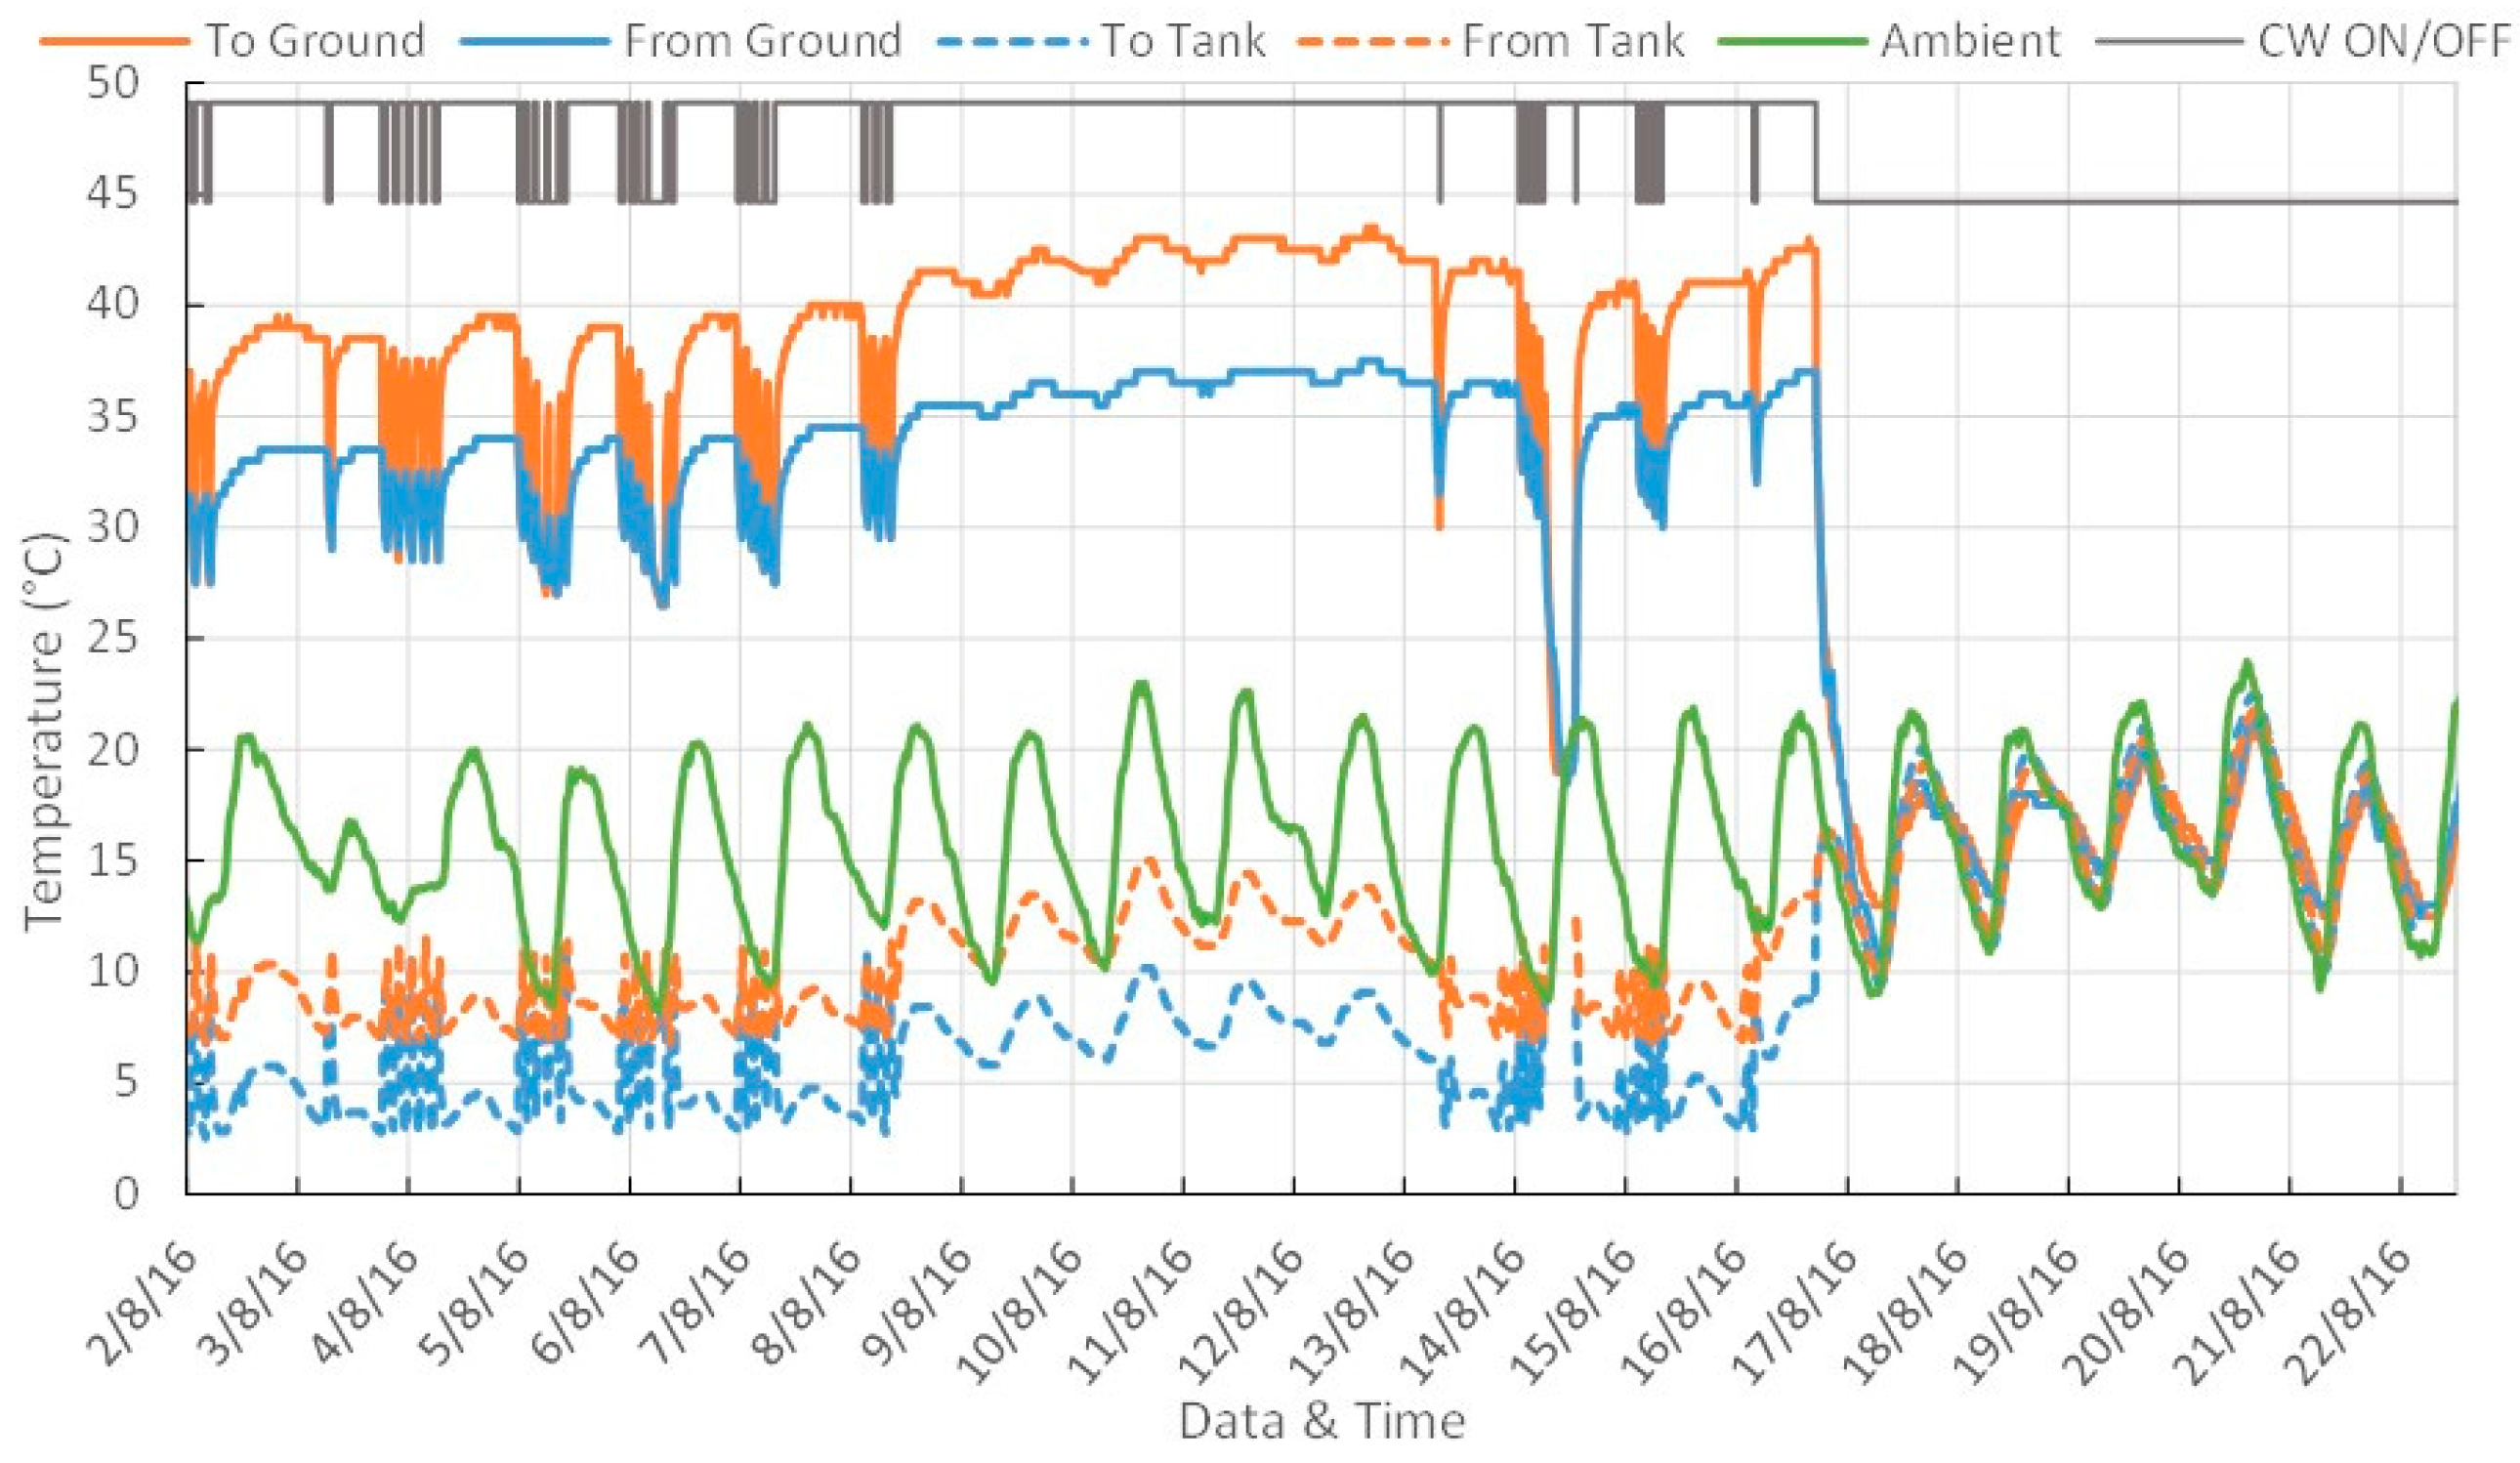
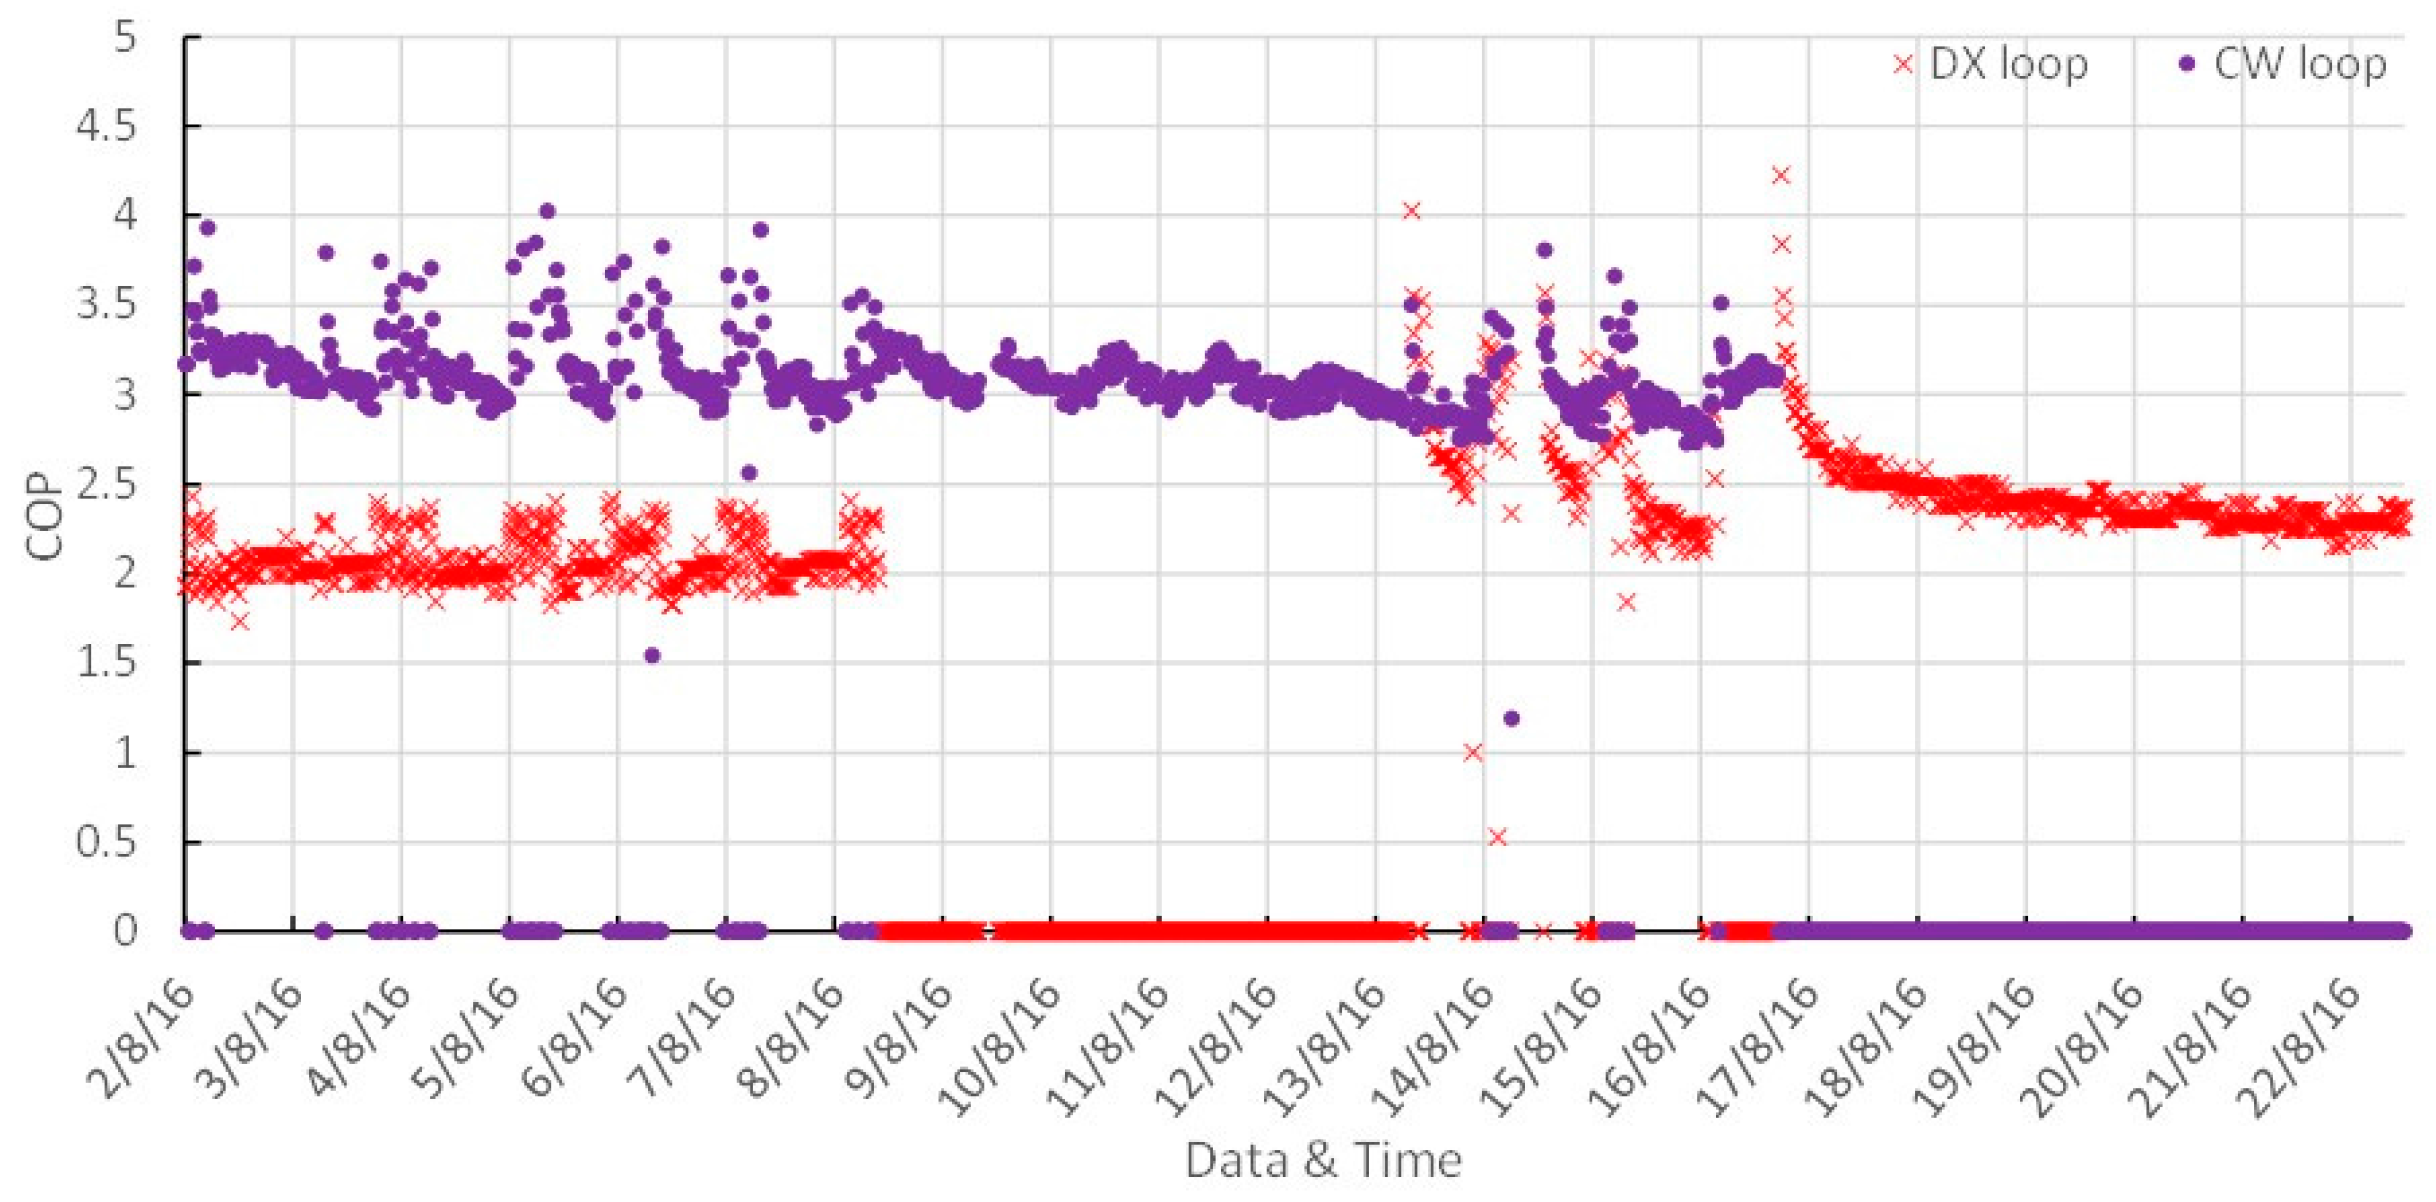
3.3. Up-To-Date Operating Performance

The Gatton GSHP plant began its first year trial run in late January 2016. The plant operates in a cooling mode all the time on a 24/7 basis, targeting the set-point temperature of 14 °C in the Library. However, due to technical issues and maintenance reasons, a number of break-offs occurred in both DX and CW heat pump loops as well as the instrumentation system, resulting in an uncontinuous record of monitoring data. In this section, a part of the monitoring data is presented.
The temperatures of the ground supply and return pipes in both DX and Water systems between August 1 and August 22, 2016 are plotted against time in Figure 4 and Figure 5, respectively.
The ground loop temperatures for both the systems respond rapidly to the sharp variations in the tank supply/return temperatures due to operation controls, mainly seen between August 2 and August 8, 2016. Long continuous operations of the DX and CW systems are seen between August 17 and August 22, and between August 8 and August 12, 2016, respectively. During these periods, the ground loop temperatures fluctuate with the variation of ambient temperature, but show less periodic features. The mean ground loop temperatures in these two periods are listed in Table 4.
The cooling powers are determined based on the instantaneous supply and return temperatures and the water flowrate in the tank loops, namely:
Q c = m ˙ w C p w ( T return T supply )
while the electrical power consumed by the compressors are recorded by the BMS. Then the instantaneous COPs are calculated and plotted in Figure 6. By using the data over the above two periods, the stabilized mean COPs are calculated to be 2.4 for the DX system and 3.1 for the CW system. The zero COPs that appeared during some periods indicate the systems were not working.
The actual COPs are lower than their design specification. Compressor efficiency and geothermal heat exchanger (GHE) performance are the major factors which alter GSHP performance. It is important to note that, in first few hours after every start-up, the COP of either system decreases dramatically from a quite high initial value, which is consistent with the dramatic temperature rises in the ground loops seen in Figure 4 and Figure 5. This implies the low COPs are attributed to insufficient heat dissipation rate in the ground.
The ground temperature variation is an important factor while assessing the performance of the GHE in continuous long-term operation. In cooling mode, the ground U-tube exchangers heat up the ground, leading to a decrease of heat dissipation rate of the exchangers. Temperatures at different depths in one of the heat rejection (denoted as HR) boreholes of the DX system are plotted in Figure 7 for the period from August 1 to August 22, 2016. The three corresponding monitoring boreholes temperatures (denoted as M1, M2, and M3) over the same period are given in Figure 8. Similarly, temperatures in one CW system heat rejection borehole and in its three monitoring boreholes over the same 3 weeks are shown in Figure 9 and Figure 10, respectively.
The heat rejection borehole temperatures vary rapidly when the systems start up or shut down in Figure 7 and Figure 9. Oscillations are seen around the continuous operating temperatures, attributed to diurnal variation in system load. It is noted that, unlike the the CW heat rejection borehole where temperature decrease is regular with depth, the DX borehole temperature peaks at a 60-m depth, followed by a great drop at the 80-m depth. This observation is definitive evidence that the refrigerant condenses near a depth of 60 m, releasing a large amount of latent heat which heats the surrounding borehole up to a high temperature. There is no phase change in CW loop, and consequently the temperature profile is monotonic.
The surrounding earth responds to the heat rejection differently depending on the horizontal offset distance from the heat exchanger bore, but not necessarily on depth, as seen in Figure 8 and Figure 10. Generally speaking, the temperatures in the borehole at a 2-m distance (M1) are the highest, while the variations are also most significant. By contrast, the temperatures remain the lowest and nearly unchanged in the borehole at an 8-m distance (M3) over the three weeks. The observation implies that the “sensible temperature” transfers at a very low speed in the ground—even at a 2-m distance the earth temperatures rise only around half a degree, which is much lower compared to the temperature variations in the heat exchanger bores. This is supporting evidence of the earlier argument that the heat dissipation rate in the ground is insufficient.
The above discussion is based on the observations over a relative short period—3 weeks. The ground temperature variations for a longer time scale are given below. Figure 11 and Figure 12 show the earth temperatures all at a 60-m depth in three monitor boreholes between January 28 and December 2, 2016 for DX and CW systems, respectively. The dashed lines are the accumulated cooling powers of the systems converted into kWh which are equal to the accumulated heat dissipated in the ground. Since temperature change in the surrounding earth is not necessarily related to depth, the data at one depth in a borehole can approximately represent the variation in the entire borehole.
The new finding here which is not seen in the observation for short period (i.e., Figure 8 and Figure 10) is that the ground temperature at a 2-m distance (M1) from the heat injection borehole drops when there is no cooling power output, namely the accumulative power line is flat. However, at an 8-m distance (M3), the temperature always keeps growing, regardless of the operation of the heat pumps. Quantitatively, for the 10 months since the commission of this installation, the ground temperatures at a 2-m distance from the DX and CW operation boreholes increased by roughly 4.5 °C and 3 °C, respectively. In contrast, the temperatures at an 8-m distance increased by less than 1 °C and 0.5 °C, respectively, suggesting again the heat transfer in the ground is very slow.

4. Conclusions

The Australian GSHP industry is urged to establish a set of its own optimisation principles, as the currently widely-used standards developed mainly in North America and Europe are likely to lead unoptimal designs in Australia’s practices. The Gatton ground source heat pump of The University of Queensland is a facility to assist in this area, allowing a series of experimental studies on two of the most popular types of ground heat exchanger-heat pump loops—a refrigerant direct expansion loop and an indirect condenser water loop. The ground thermal test conducted in the plant site found the thermal conductivity of the ground to be 2.45 W/(m·K). The plant was commissioned in early 2016, with work being performed on the cooling mode only until now. The monitored data up to date indicates that:
1
The two ground heat pump loops are both working at COPs lower than their design values in continuous operations, with the temperatures entering the GHEs of both close to their designed upper limits.
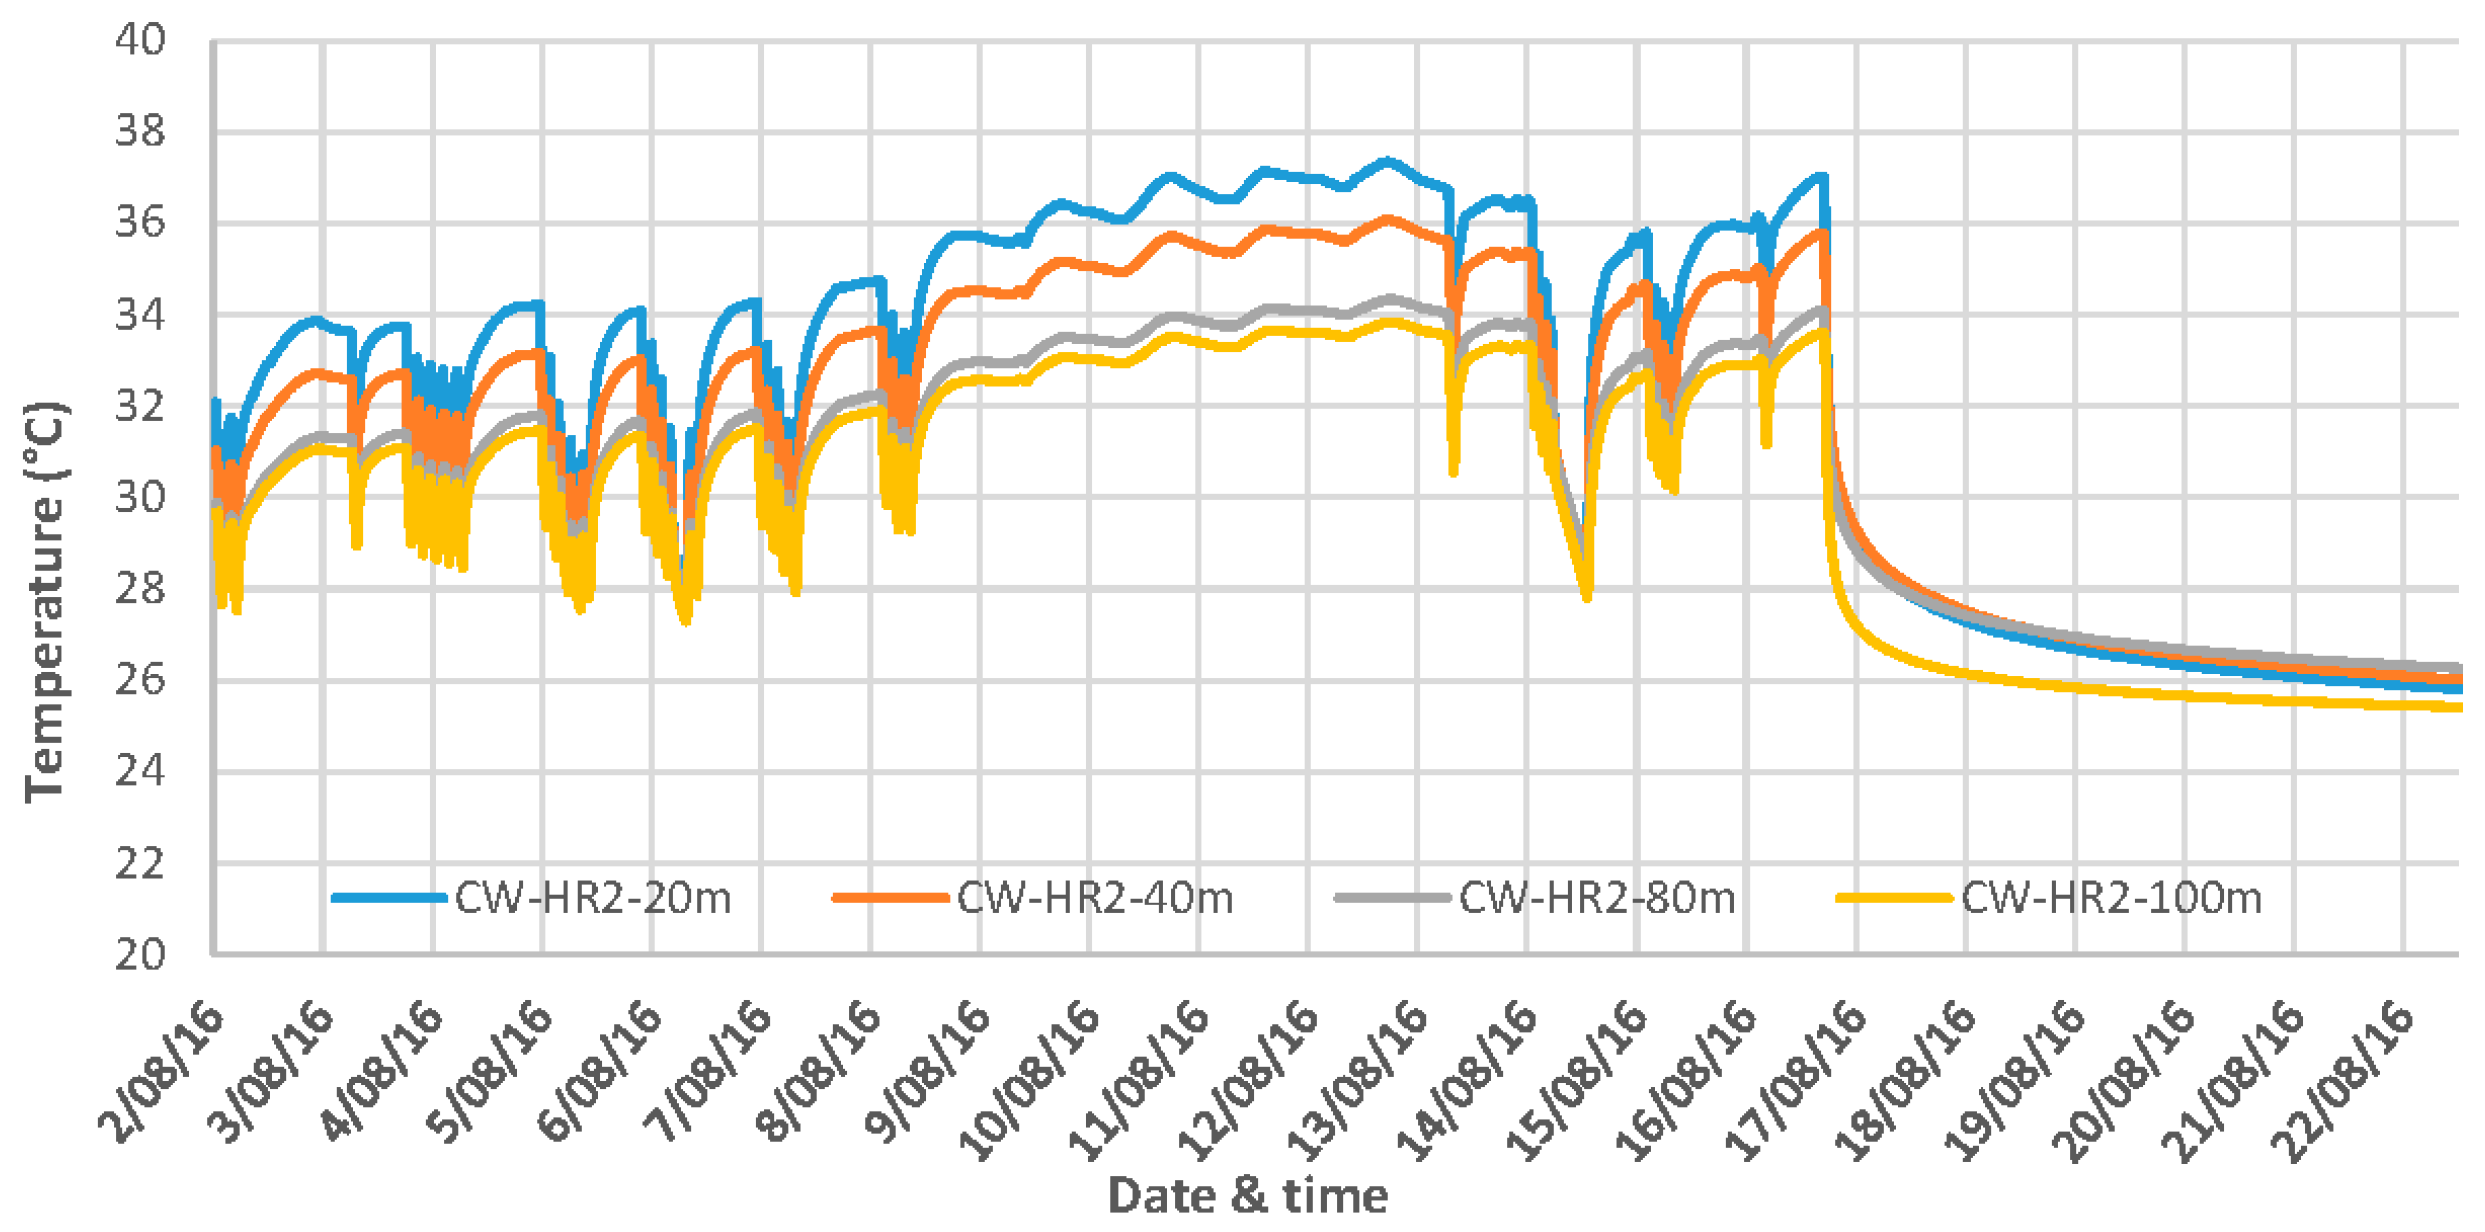
2
In first few hours after each start-up of the facility, the ground loop temperatures in both systems rise dramatically from their initial values.
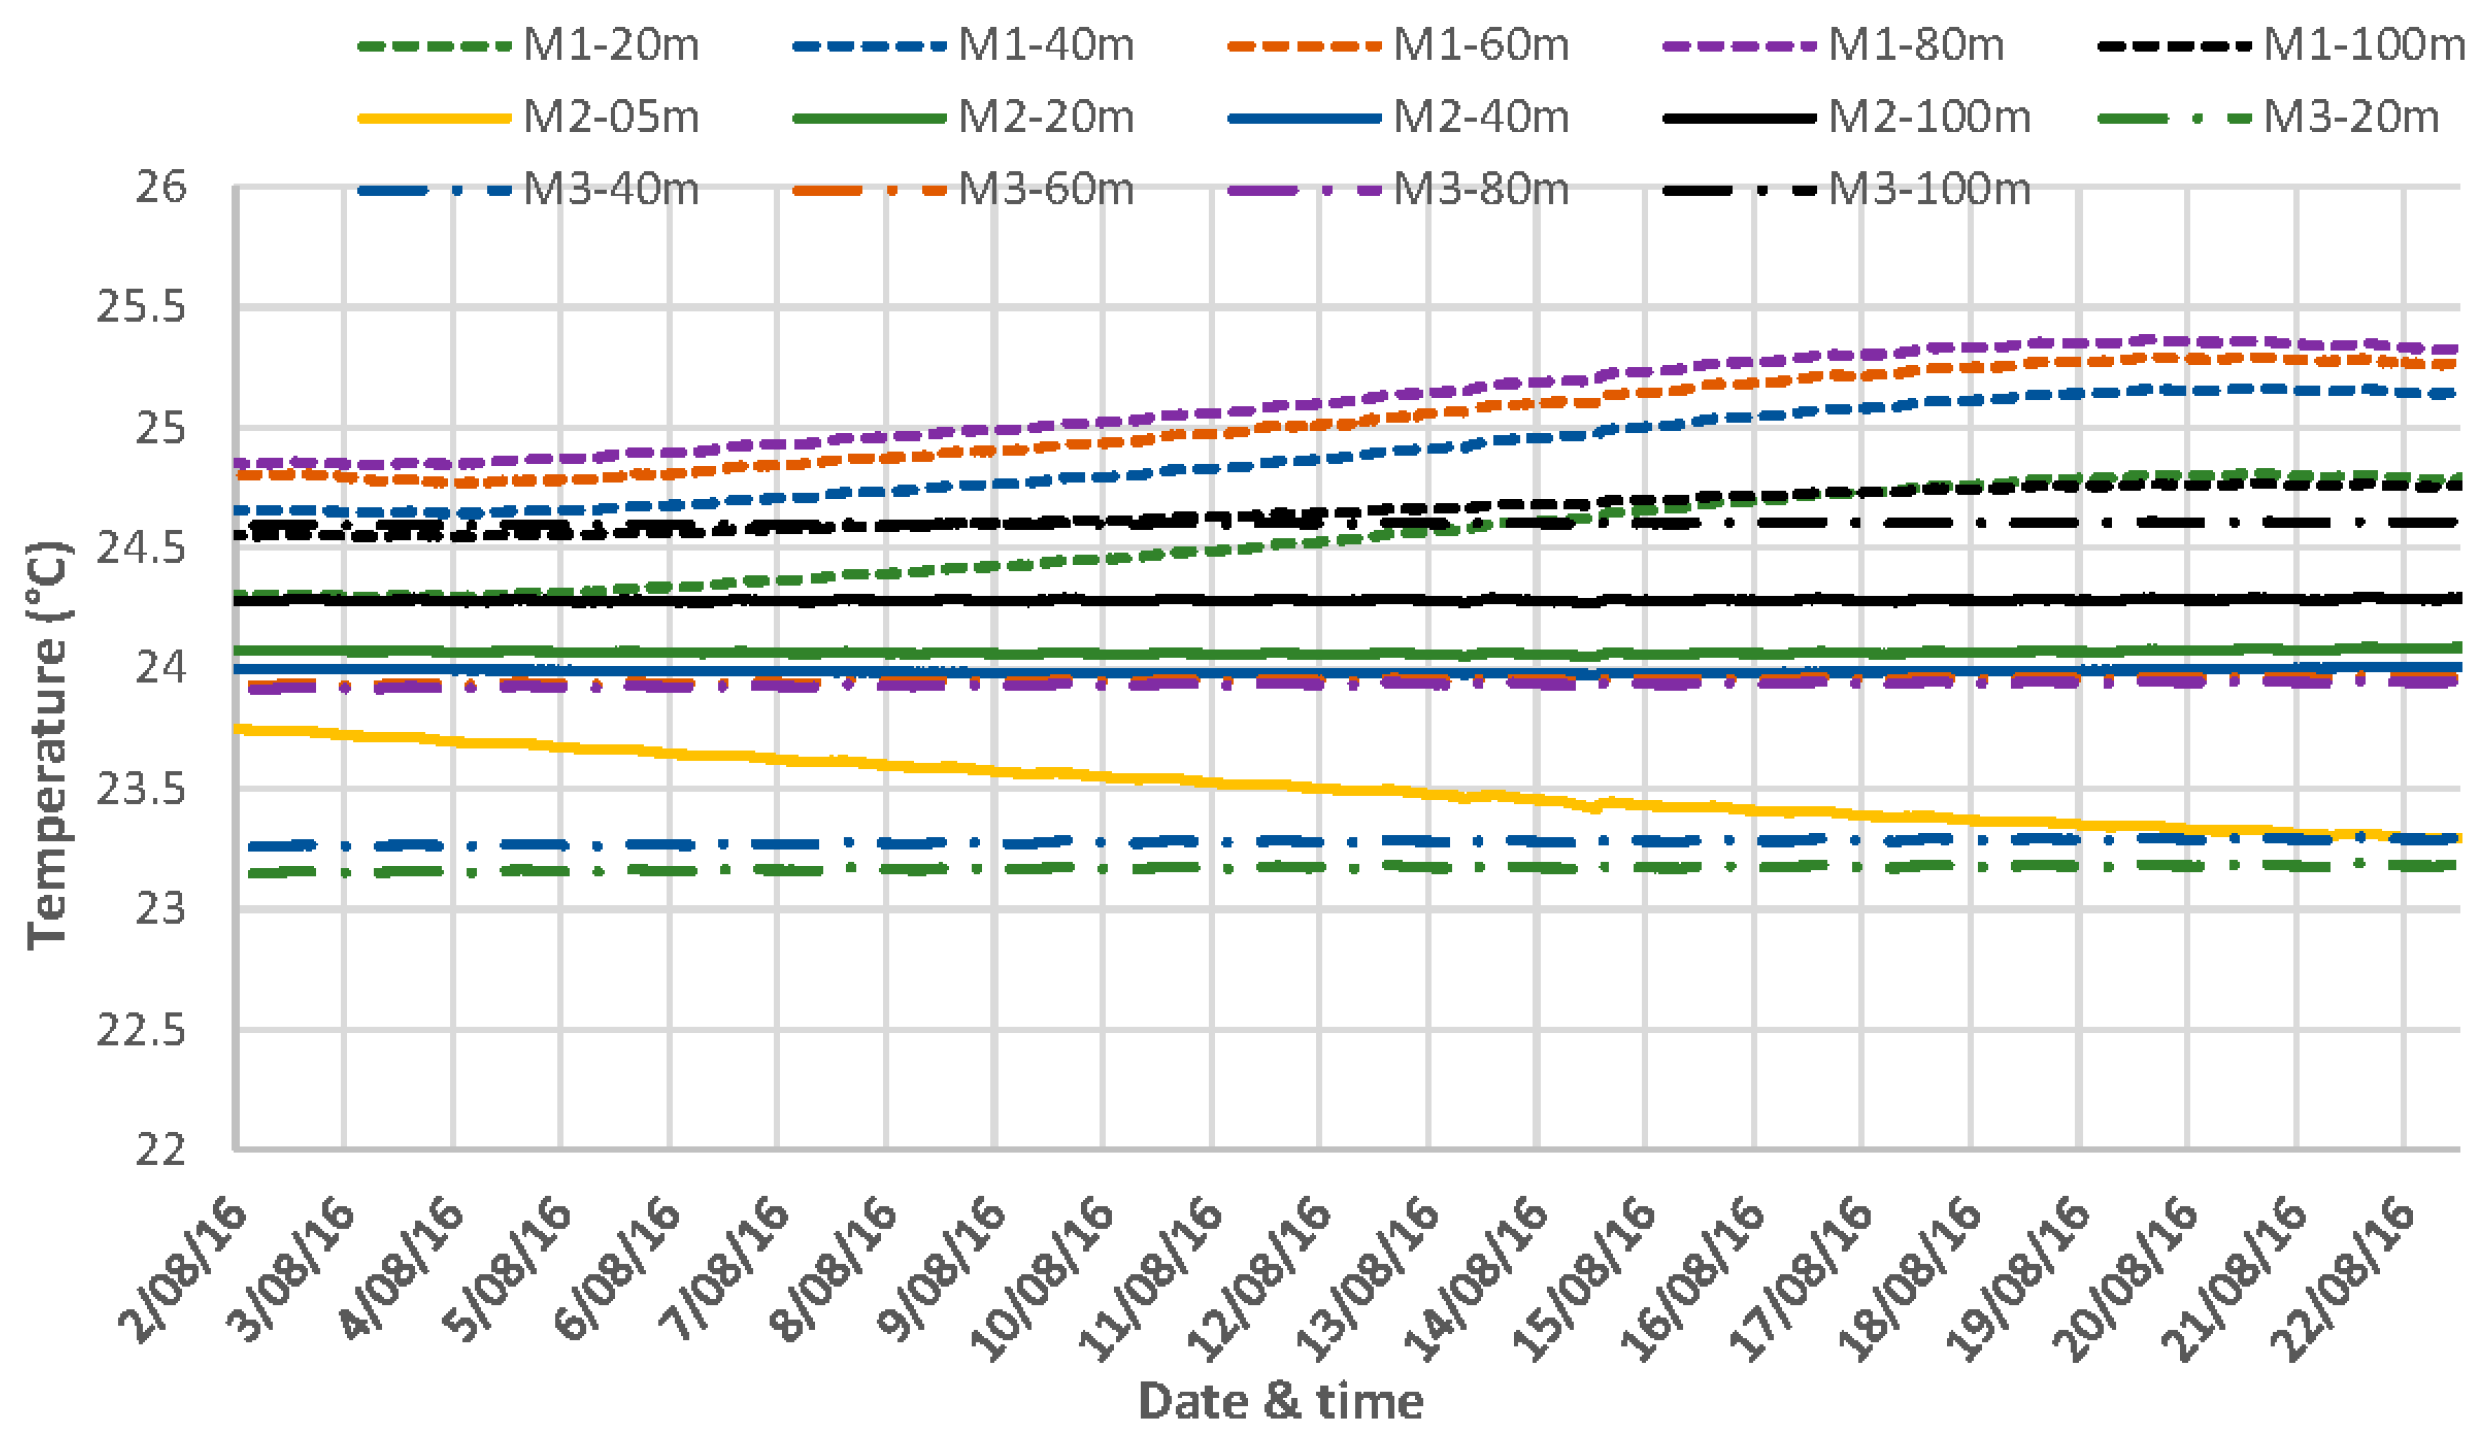
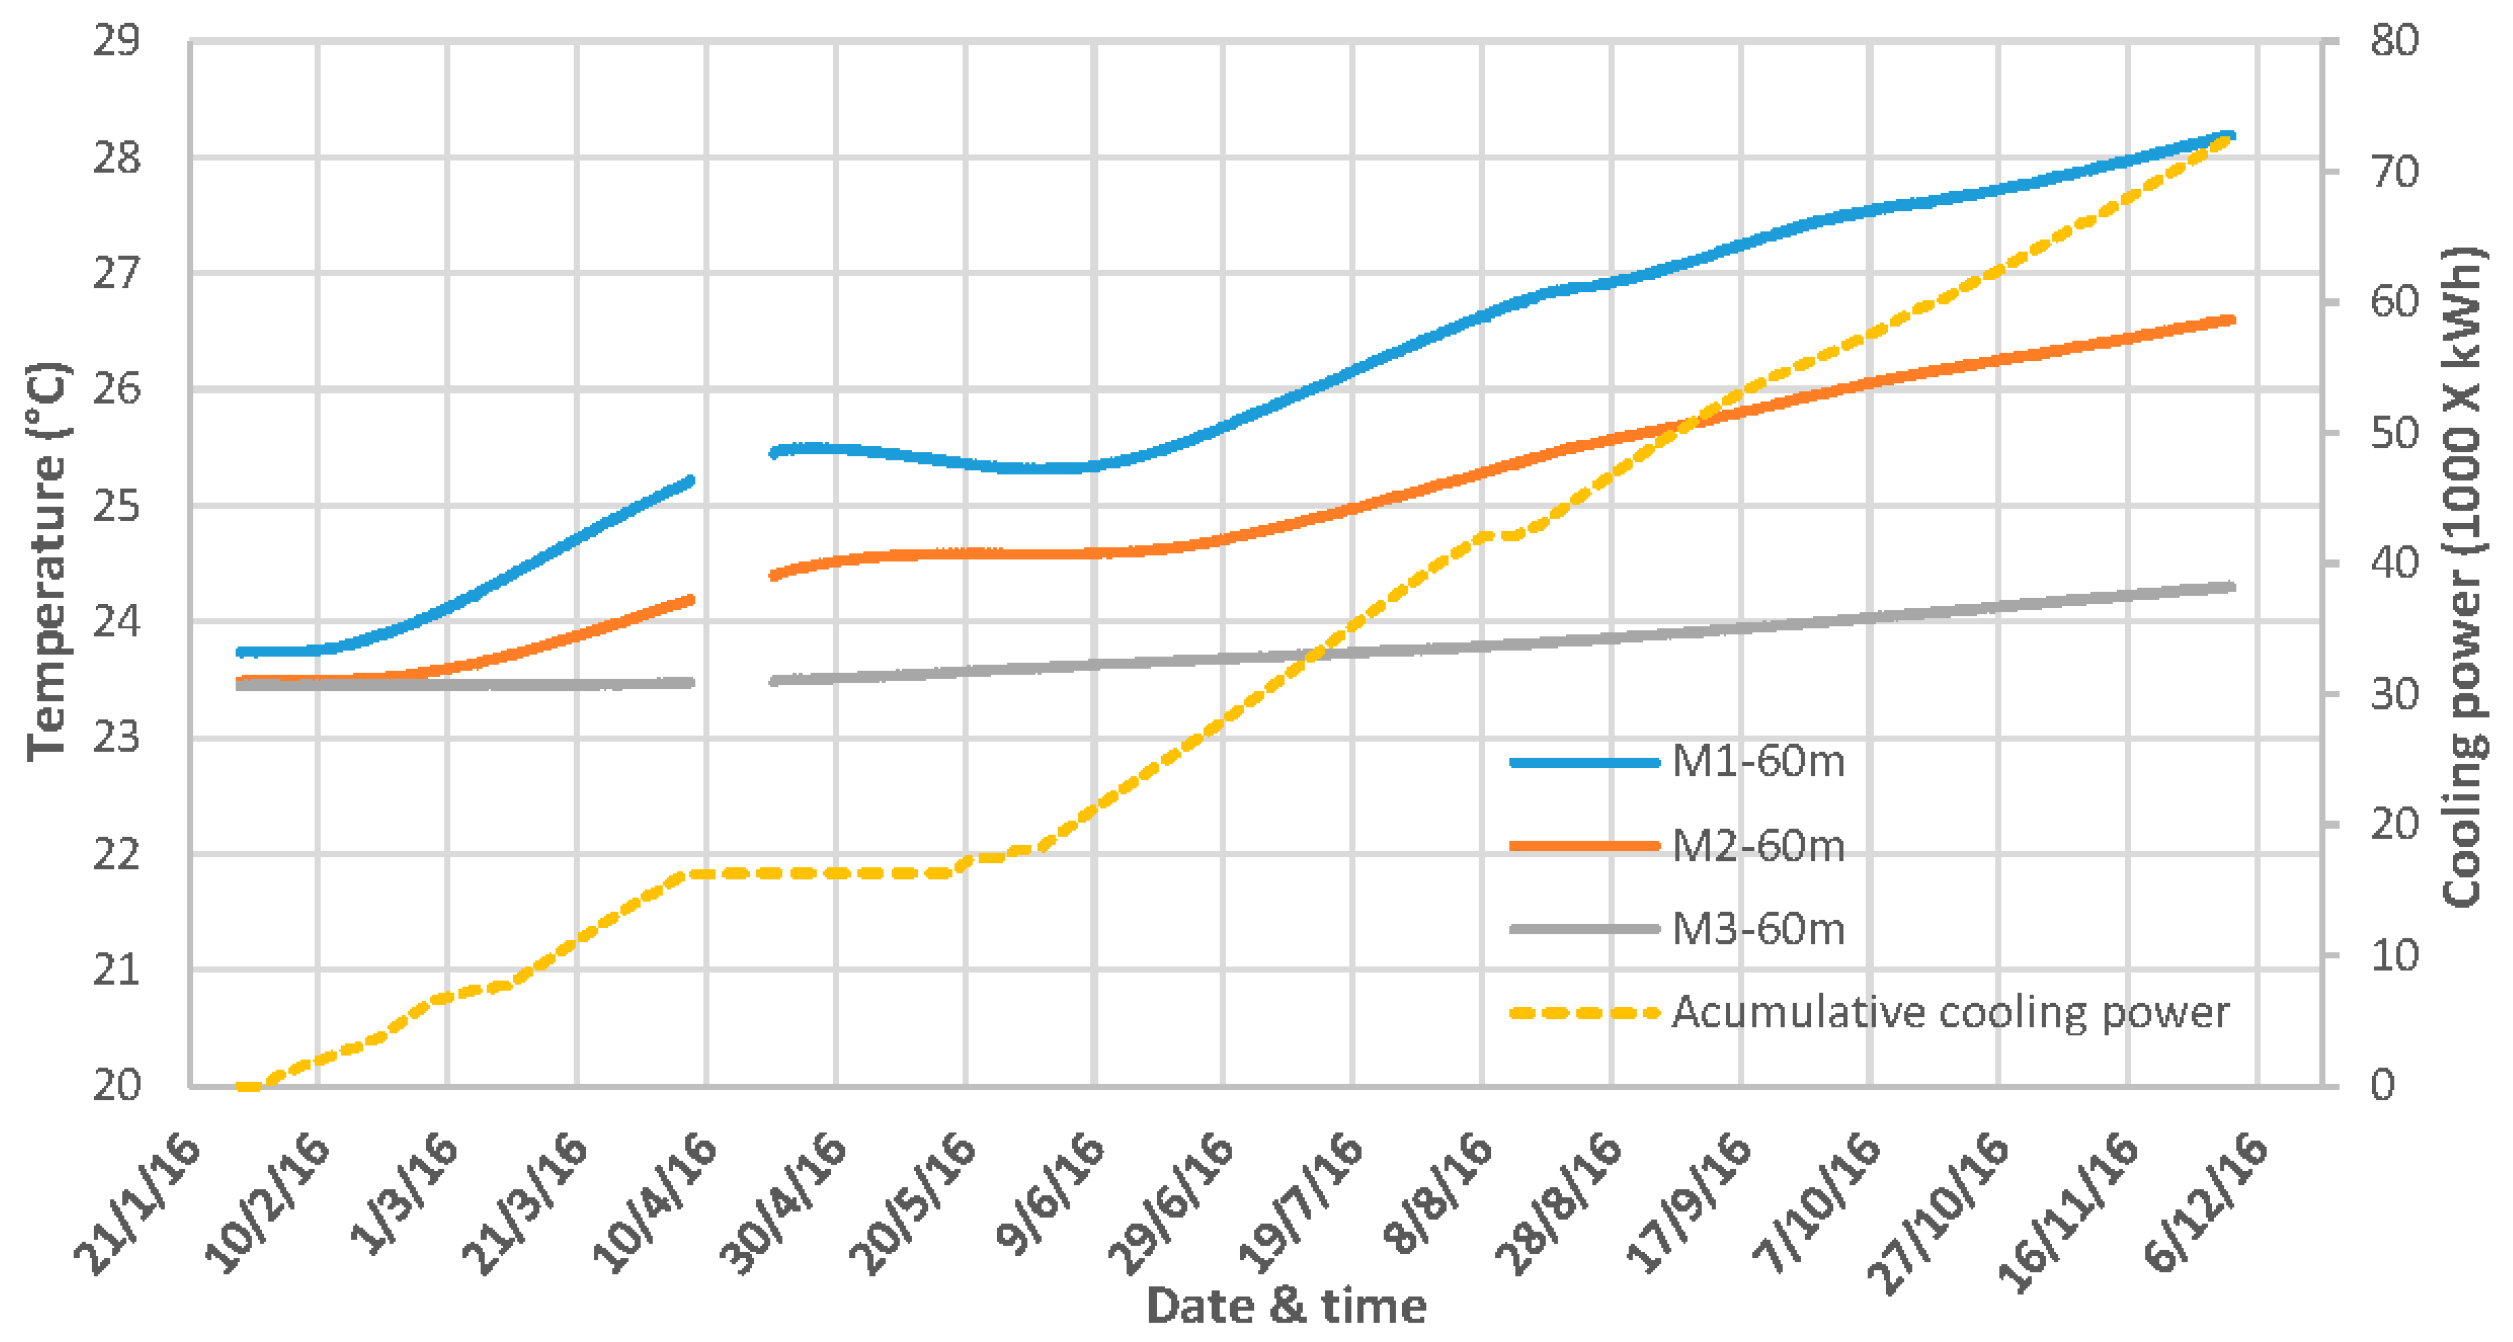
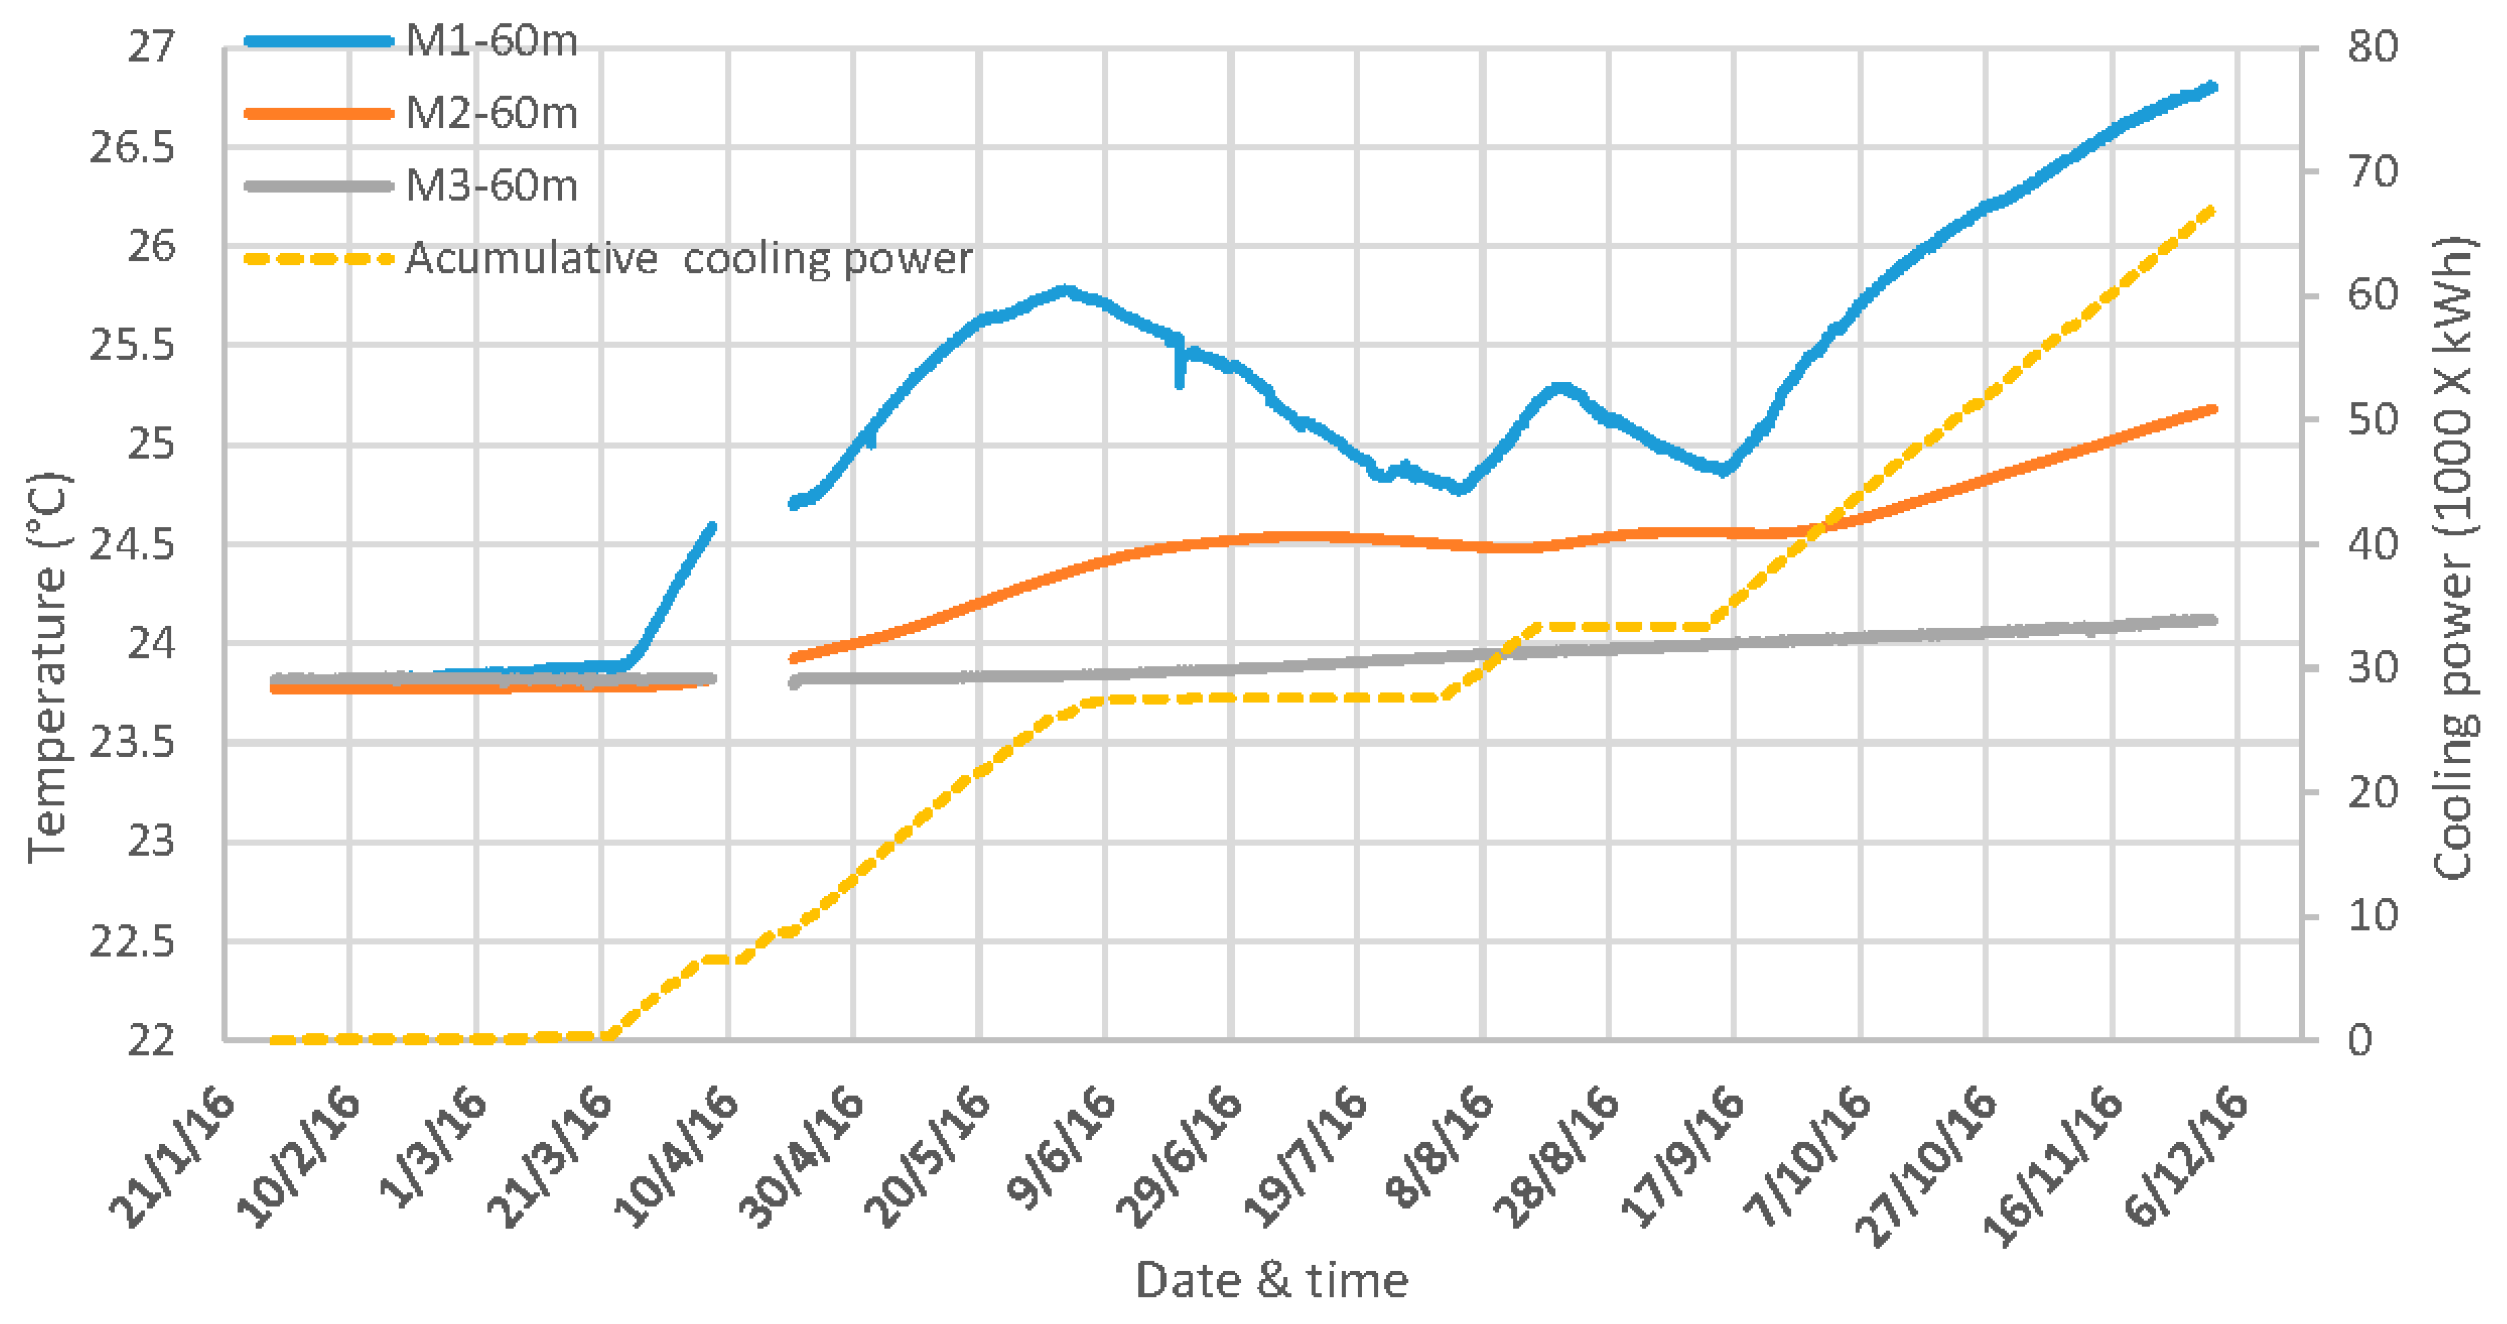
3
The ground temperatures at an 8-m distance from the injection boreholes of both systems increased by less than 1 °C in the 10 months since the commission of the installation.
These observations suggest that the low heat dissipation rate in the ground could potentially be the reason for the under-design performance.

Author Contributions

Yuanshen Lu monitored/analysed the data, reviewed the literature, and wrote the manuscript; Kamel Hooman contributed analysis methods and revised the manuscript; Aleks D. Atrens assisted in the literature review and revised the manuscript; and Hugh Russel assisted in the monitoring and analysis.

Conflicts of Interest

The authors declare no conflict of interest.

Nomenclature

bradius of the borehole (m)
Cpwspecific heat of water (J·kg−1·K−1)
kthermal conductivity (W·m−1·K−1)
Ldepth of borehole (m)
m ˙ w water mass flow rate (kg·s−1)
cpspecific heat (J·Kg−1·K−1)
Qccooling rate (W)
qheat input rate (W)
r radial distance (m)
T temperature (°C)
T0initial (undisturbed) temperature (°C)
T ¯ w mean water temperature in U-tubes (°C)
t time (h)
Greek letters
α thermal diffusivity (m2·s−1)
βgradient
γconstant
Abbreviations
AHUair handling units
BMSbuilding management system
COPcoefficient of performance
CWcondenser water
DXdirect expansion
GHEgeothermal heat exchanger
GSHPground source heat pump
HRheat rejection
Mmonitoring
QGECEQueensland Geothermal Energy Centre of Excellence
UQUniversity of Queensland

References

  1. Sarbu, I.; Sebarchievici, C. General review of ground-source heat pump systems for heating and cooling of buildings. Energy Build. 2014, 70, 441–454. [Google Scholar] [CrossRef]
  2. Soni, S.K.; Pandey, M.; Bartaria, V.N. Ground coupled heat exchangers: A review and applications. Renew. Sustain. Energy Rev. 2015, 47, 83–92. [Google Scholar] [CrossRef]
  3. Lund, J.W.; Boyd, T.L. Direct utilization of geothermal energy 2015 worldwide review. Geothermics 2016, 60, 66–93. [Google Scholar] [CrossRef]
  4. Soni, S.K.; Pandey, M.; Bartaria, V.N. Hybrid ground coupled heat exchanger systems for space heating/cooling applications: A review. Renew. Sustain. Energy Rev. 2016, 60, 724–738. [Google Scholar] [CrossRef]
  5. Li, M.; Lai, A.C.K. Review of analytical models for heat transfer by vertical ground heat exchangers (GHEs): A perspective of time and space scales. Appl. Energy 2015, 151, 178–191. [Google Scholar] [CrossRef]
  6. Luo, J.; Rohn, J.; Xiang, W.; Bertermann, D.; Blum, P. A review of ground investigations for ground source heat pump (GSHP) systems. Energy Build. 2016, 117, 160–175. [Google Scholar] [CrossRef]
  7. Johnston, I.; Narsilio, G.; Colls, S.; Kivi, A.V.; Payne, D.; Wearing-Smith, M.; Noonan, G. Direct geothermal energy demonstration projects for Victoria, Australia. In Proceedings of the 34th New Zealand Geothermal Workshop, Auckland, New Zealand, 19–21 November 2012.
  8. Miskin, A. Geothermal Heat Pump Systems. Bachelor’s Thesis, The University of Queensland, Brisbane, Australia, 2015. [Google Scholar]
  9. Kasherman, J. Numerical Simulation of the Effects of Groundwater Flow on the Performance of Vertical Closed-Loop Ground-Source Heat Pump Systems. Bachelor’s Thesis, The University of Queensland, Brisbane, Australia, 2015. [Google Scholar]
  10. Isdale, J. Using Geothermal Heat Pumps for Air Conditioning in Brisbane. Bachelor’s Thesis, The University of Queensland, Brisbane, Australia, 2015. [Google Scholar]
  11. Chu, K.J. Geothermal Heat Pumps for Queensland a Feasibility Analysis. Bachelor’s Thesis, The University of Queensland, Brisbane, Australia, 2015. [Google Scholar]
  12. Stern, H.; de Hoedt, G.; Ernst, J. Objective classification of Australian climates. Aust. Meteorol. Mag. 2000, 49, 87–96. [Google Scholar]
  13. Australia Government—Bureau of Meteorology. Climate Data Online. Available online: http://www.bom.gov.au/climate/data/index.shtml?bookmark=200 (accessed on 22 December 2016).
  14. Brodribb, P. Cold Hard Facts 2—A Study of the Refrigeration and Air Conditioning Industry in Australia; Expert Group: Victoria, Australia, 2013. [Google Scholar]
  15. Australian National Greenhouse Accounts-Quarterly Update of Australia’s National Greenhouse Gas Inventor December Quarter 2011; Department of the Environment, Australia Government: Canberra, Australia, 2012.
  16. Department of Climate Change and Energy Australia Government. Australia’s 2030 Climate Change Target; Australia Government: Canberra, Australia, 2015.
  17. Australian Energy Market Commission (AEMC). 2015 Residential Electricity Price Trends; AEMC: Sydney, Australia, 2015.
  18. U.S. Energy Information Administration. Electric Power Monthly with Data for April 2016; U.S. Department of Energy: Washington, DC, USA, 2016.
  19. Eurostat Energy Statistics. Electricity Prices for Domestic Consumers—Bi-Annual Data (from 2007 onwards). Available online: http://appsso.eurostat.ec.europa.eu/nui/show.do?dataset=nrg_pc_204&lang=en (accessed on 22 December 2016).
  20. Pink, B. Year Book Australia 2012; Australian Bureau of Statistics: Canberra, Australia, 2012.
  21. Beardsmore, G.; Budd, A.; Huddlestone-Holmes, C.; Davidson, C. Country update—Australia. In Proceedings of the World Geothermal Congress 2015, Melbourne, Australia, 19–25 April 2015.
  22. Rosiek, S.; Batlles, F.J. Renewable energy solutions for building cooling, heating and power system installed in an institutional building: Case study in southern Spain. Renew. Sustain. Energy Rev. 2013, 26, 147–168. [Google Scholar] [CrossRef]
  23. Johnston, I.W. Geothermal energy using ground source heat pumps. In Proceedings of the 34th New Zealand Geothermal Workshop, Auckland, New Zealand, 19–21 November 2012.
Figure 1. (a) The main ground components of the ground source heat pump (GSHP) system; and (b) the three monitoring wells in direct expansion (DX) loop.
Energies 10 00138 g001
Figure 2. Gatton GSHP Facility schematic, showing air handling units (AHUs), water tanks, the two separate refrigerant direct expansion (DX) and condenser water (CW) heat pumps and their respective ground heat exchangers and monitoring wells.
Energies 10 00138 g002
Figure 3. Thermal conductivity test measurements of loop water temperatures and heating rate vs. time.
Energies 10 00138 g003
Figure 4. Temperatures of DX ground loop, DX tank loop and the ambient air between August 1 and August 22, 2016. The heat pump On/Off status is also shown by the curve on the top.
Energies 10 00138 g004
Figure 5. Temperatures of the condenser water loop (CW) ground loop, CW tank loop and the ambient air between August 1 and August 22, 2016.
Energies 10 00138 g005
Figure 6. Coefficients of performance (COP) of both ground loop systems observed between August 1 and August 22, 2016.
Energies 10 00138 g006
Figure 7. Heat rejection (HR) boreholes temperatures of DX system with different depths as indicated between August 1 and August 22, 2016.
Energies 10 00138 g007
Figure 8. Monitoring boreholes (M1, M2, M3) temperatures of DX system with different depths as indicated from August 1 to August 22, 2016.
Energies 10 00138 g008
Figure 9. Heat rejection (HR) boreholes temperatures of CW system with different depths as indicated between August 1 and August 22, 2016.
Energies 10 00138 g009
Figure 10. Monitoring boreholes (M1, M2, M3) temperatures of CW system from August 1 to August 22, 2016.
Energies 10 00138 g010
Figure 11. The ground temperature variation in the monitor boreholes of the DX system (M1, M2, M3) since the commission of the heat pump.
Energies 10 00138 g011
Figure 12. The ground temperature variation in the monitor boreholes of the CW system (M1, M2, M3) since the commission of the heat pump.
Energies 10 00138 g012
Table 1. Statistics of the hot and cold days in major Australian cities (all numbers are averaged over 2005–2015) *.
CityNo. of Days with Daily Max. Temperature > 30 °CNo. of Days with Daily Min. Temperature < 10 °CAnnual Mean Daily Max. TemperatureAnnual Mean Daily Min. Temperature
Sydney32.567.223.1 °C14.9 °C
Melbourne36186.420.9 °C10.2 °C
Brisbane76.883.326.6 °C14.7 °C
Perth41.123721.0 °C6.6 °C
Adelaide51.4126.422.3 °C12.3 °C
Darwin335.1032.5 °C23.1 °C
* Data source: Australia Government Bureau of Meteorology [13].
Table 2. Specifications of the two Gatton ground source heat pump systems.
SpecificationSystem 1—DXSystem 2—Water
Design/Maximum cooling or heating load20 kW/25 kW
Designed cooling coefficients of performance (COP)64
Heat pump electrical (Volts/Phases/Full-Load Amp/Operating Amp)415/3/13/9.1415/3/14.3/11.5
Max temperature entering the geothermal heat exchangers (GHE)65 °C45 °C
Heat pump working fluidR410a
Fluid mass density1040 kg/m3 @ 30 °C
Fluid specific heat capacity0.84 kJ/(kg·K)
Ground materialInterbedded Gatton Sandstone with medium sand grain and silt returns
Measured ground conductivity2.59 W/(m·K)
Measured ground thermal diffusivity0.084 m2/day (0.0097 cm2/s)
Estimated average ambient ground temperature23 °C
Grout thermal conductivity2.343 W/(m·K) (±0.045)
Grout density1.841 kg/m3
GHE working fluidR410aWater
GHE spacing/arrangement8 m/linear8 m/diamond grid
GHE depth/diameter80 m/125 mm100 m/125 mm
GHE borehole well number24
Condenser water flow rateN/A4.6 m3/h
GHE pipe typeCopper (R410a Grade)high-density polyethylene (HDPE)
GHE pipe diameter20 mm (vapour)/12.7 mm (liquid)32 mm
Wall thickness0.91 mm8.8 mm
GHE pipe thermal conductivity392.869 W/(m·K)0.389 W/(m·K)
GHE pipe configurationVertical U-BendVertical U-Bend
Table 3. Summary of the thermal conductivity test statistics for 24–48 h and results of analysis.
ParametersValues
Borehole diameter150 mm (6 inch), 0–12 m (0–39 foot); 125 mm (5 inch), 12–100 m (39–328 foot)
U-bend size32 mm (1.25 inch)
U-bend depth100 m (328 foot)
Average voltage232.5 V
Average heat input rate5750 W (19,620 Btu/h)
Averaged heat input rate per foot of bore57.5 W/m (17.6 W/ft)
Calculated circulator flow rate0.34 L/s (5.4 gpm)
Standard deviation of power1.05%
Maximum variation in power3.31%
Initial (undisturbed) ground temperature23.35 °C (73.69 °F)
Ground thermal conductivity2.45 W/(m·K) (1.42 Btu/(h·ft·°F))
Ground thermal diffusivity0.0093 cm2/s (0.89 ft2/day)
Table 4. The mean ground loop temperatures during their stable continuous operations.
TemperaturesDX SystemCW System
supply to ground65.1 °C42.1 °C
return from ground47.8 °C36.3 °C
ambient15.9 °C16.0 °C

