1. Introduction
In many countries, access to clean and pure water is seen as a vital necessity. Most of the available water resources are salty or contain harmful bacteria. Although water covers 71% of the Earth’s surface, only 2.5% of the Earth’s water is fresh water, and 98.8% of that water is in ice and groundwater [
1]. Thus, it is clear that freshwater resources are very limited and access to it is difficult in many regions. There are several methods of producing required distilled water. Due to the increasing cost of fossil fuels, reduction of sources and the pollution resulting from the use of these fuels, a solar still is a simple way of distilling water which uses the heat of the sun and ambient air. Therefore, this method can be properly exploited in areas with high solar radiation. Over the last decades, solar desalination has been considered by many researchers around the world [
2,
3,
4,
5]. Some researchers also proposed new working fluids to work in different conditions [
6,
7,
8,
9,
10,
11]. A large number of studies have been dedicated to experimental or theoretical analysis of the basin solar still. For example, Samee et al. [
12] designed a simple single basin solar still with a base area of 0.54 m
2 and glass cover inclined at 33.3° for Pakistan. The average daily output and efficiency of the solar still were found to be 3.15 L/day∙m
2 and 30.65%, respectively. Ayav and Atagunduz [
13] performed an experimental and theoretical investigation on a single basin fabricated in Turkey. Their model had a basin area of 1.47 m
2 with a glass cover inclined at 38°. They derived equations of energy balance for the solar still and compared the theoretical and experimental results, which showed good agreement. Setoodeh et al. [
14] carried out a study on the modeling and transport parameter determination of a basin solar still using the computational fluid dynamics (CFD) method. They compared the simulation results with the available experimental data and showed that they were in good agreement with each other. A theoretical and experimental work on a double slope single basin and double basin solar still was performed by Rajaseenivasan and Murugavel [
15]. They incorporated an additional basin with a common single basin still to improve the efficiency of the double slope solar still. Theoretical and experimental results showed that providing an additional basin increases productivity by about 85%. The comparison between theoretical and experimental results revealed that deviation was within 10%. Almost all previous studies have shown that the rate of produced distilled water decreases during sunset times. Accordingly, numerous studies have been carried out to store the energy during sunshine hours with higher solar incidence for use at sunset times. One way to improve the storage of solar energy is use of materials with a high heat capacity, which has been studied by some researchers such as Farshchi and Zolfaghari [
16], Shanmugan et al. [
17], Rajaseenivasan et al. [
18], and Gugulothu et al. [
19].
In the past decade, many modifications have been performed to enhance the productivity of the distillate of a basin still, such as using a photovoltaic powered turbulence system [
20], cooling the glass cover [
21], integrating fins at the basin of the still [
22], increasing the evaporating surface [
23], attaching vacuum tubes [
24], using a vacuum pump [
25], using a reflector [
26], and so on. Among these modifications, adding reflectors can lead to a higher solar incidence on the basin, which increases the distillate productivity of a basin solar still. Tanaka [
27,
28,
29] frequently analyzed the effect of adding reflectors to the basin solar still. He proposed some geometrical models to calculate the direct solar radiation reflected by the external and/or internal reflector and then absorbed onto the basin liner. He also performed numerical analysis of heat and mass transfer in the still and found that reflectors can significantly enhance distillate productivity. Khalifa and Ibrahim [
30] presented an experimental study on the productivity of a basin solar still with an external and internal reflector tilted at different angles for various still cover angles. They indicated that the daily productivity is greater for a still with a larger cover angle at any reflector angle. They also found that a still with a cover angle of 20° and an internal and external reflector inclined at 20° is the most productive basin solar still that can distill water, producing around 2.45 times that of a simple still with no reflectors. A transient mathematical model for a single basin solar still with and without an external reflector was presented by El-Sebaii and Al-Dossari [
31] showed that by adding an external reflector, the efficiency is increased by 6.09% and 7.28%, respectively, for the summer and winter.
The review of previous research shows that a basin solar still has been experimentally and theoretically investigated in many studies. The mathematical models have been proposed to calculate the distillate productivity of a basin solar still. On the other hand, it was observed that a number of researchers have used the reflectors to enhance the efficiency of the solar still. Although there have been a number of studies on basin solar stills, there still remains room for discussion. For example, Ayav and Atagunduz [
13] performed an experimental and theoretical investigation on a single basin but they did not use the correlations related to external reflector in the numerical simulation. In addition, Tanaka [
27,
28,
29] frequently analyzed the effect of adding reflectors to the basin solar still but did not use energy balance and external reflector equations simultaneously. In this work, a new mathematical model, which has never before appeared in open literature, is developed. The correlation of external reflectors and accurate energy balance equations included in the model and are solved simultaneously. In order to verify the model, an experimental apparatus is constructed and a number of tests are carried out. The theoretical values of the temperature and distillation productivity of the basin solar still are compared with the measured data at the same experimental conditions.
2. Theoretical Evaluation
The principle of a basin solar still is water vaporization and condensation. In a single-slope solar still, solar radiation passes through the glass cover. This solar energy passes through the water in the pond, a percentage of energy is absorbed by the thin saline water layer, and the black surface on the basin absorbs the transmitted energy. Consequently, basin and saline water are heated by the solar energy. The heat is transferred from the black surface into the saline water, and thus the temperature of the saline water rises. Evaporation occurs at the interface (between the saline water surface and air inside of the solar still is called interface), which is the semipermeable surface. Natural convection, due to the temperature difference between the interface and air inside of the solar still, and diffusion, due to the partial pressure difference, transport the saturated air into the glass cover. Because of the temperature difference between the glass cover and surroundings, these vapors condense and distilled water streams along the inclined cover and collects through a channel. Finally, the water collects in a storage container outside of the still. The 3D schematic view of the solar still is presented in
Figure 1.
In this study, the energy balance method is applied to calculate the daily produced distilled water. For this purpose, the following assumptions are considered.
The temperatures and radiation intensity are constant in a one-hour interval of time.
The volume of water in the basin is constant.
The variation of the thermal energy of the water remaining in the basin, is neglected.
Radiation heat loss occurs only through the glass cover, and in the other area it is neglected.
The wind speed is constant during the experiments.
The solar still performance is expressed as the amount of distilled water by unit area of the basin in one day. This can be estimated by establishing the conservation of mass and energy equations of the several components of the still including the glass cover, saline water interface, and black cover. The conservation of mass and energy equation is also deployed on the whole solar still. There are four unknown variables in the mentioned equations. These variables are the bottom temperature (), interface temperature (), glass cover temperature (), and temperature of inside saturated air (). The amount of distilled water can be achieved by determining these variables. The energy balance equations will be given next.
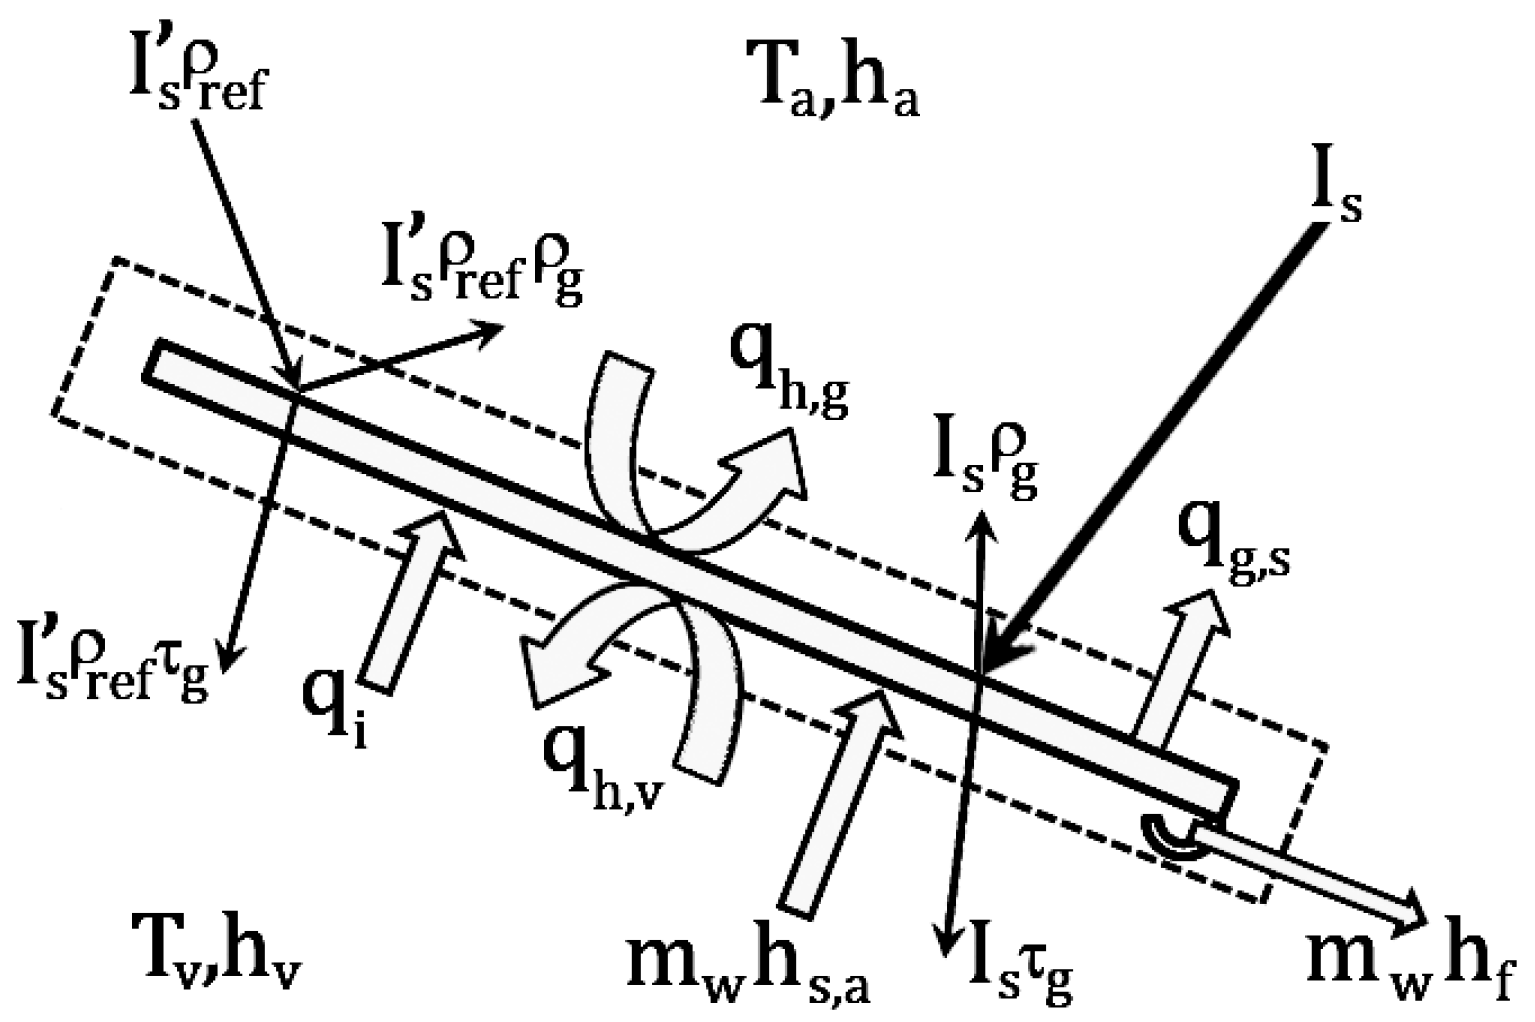
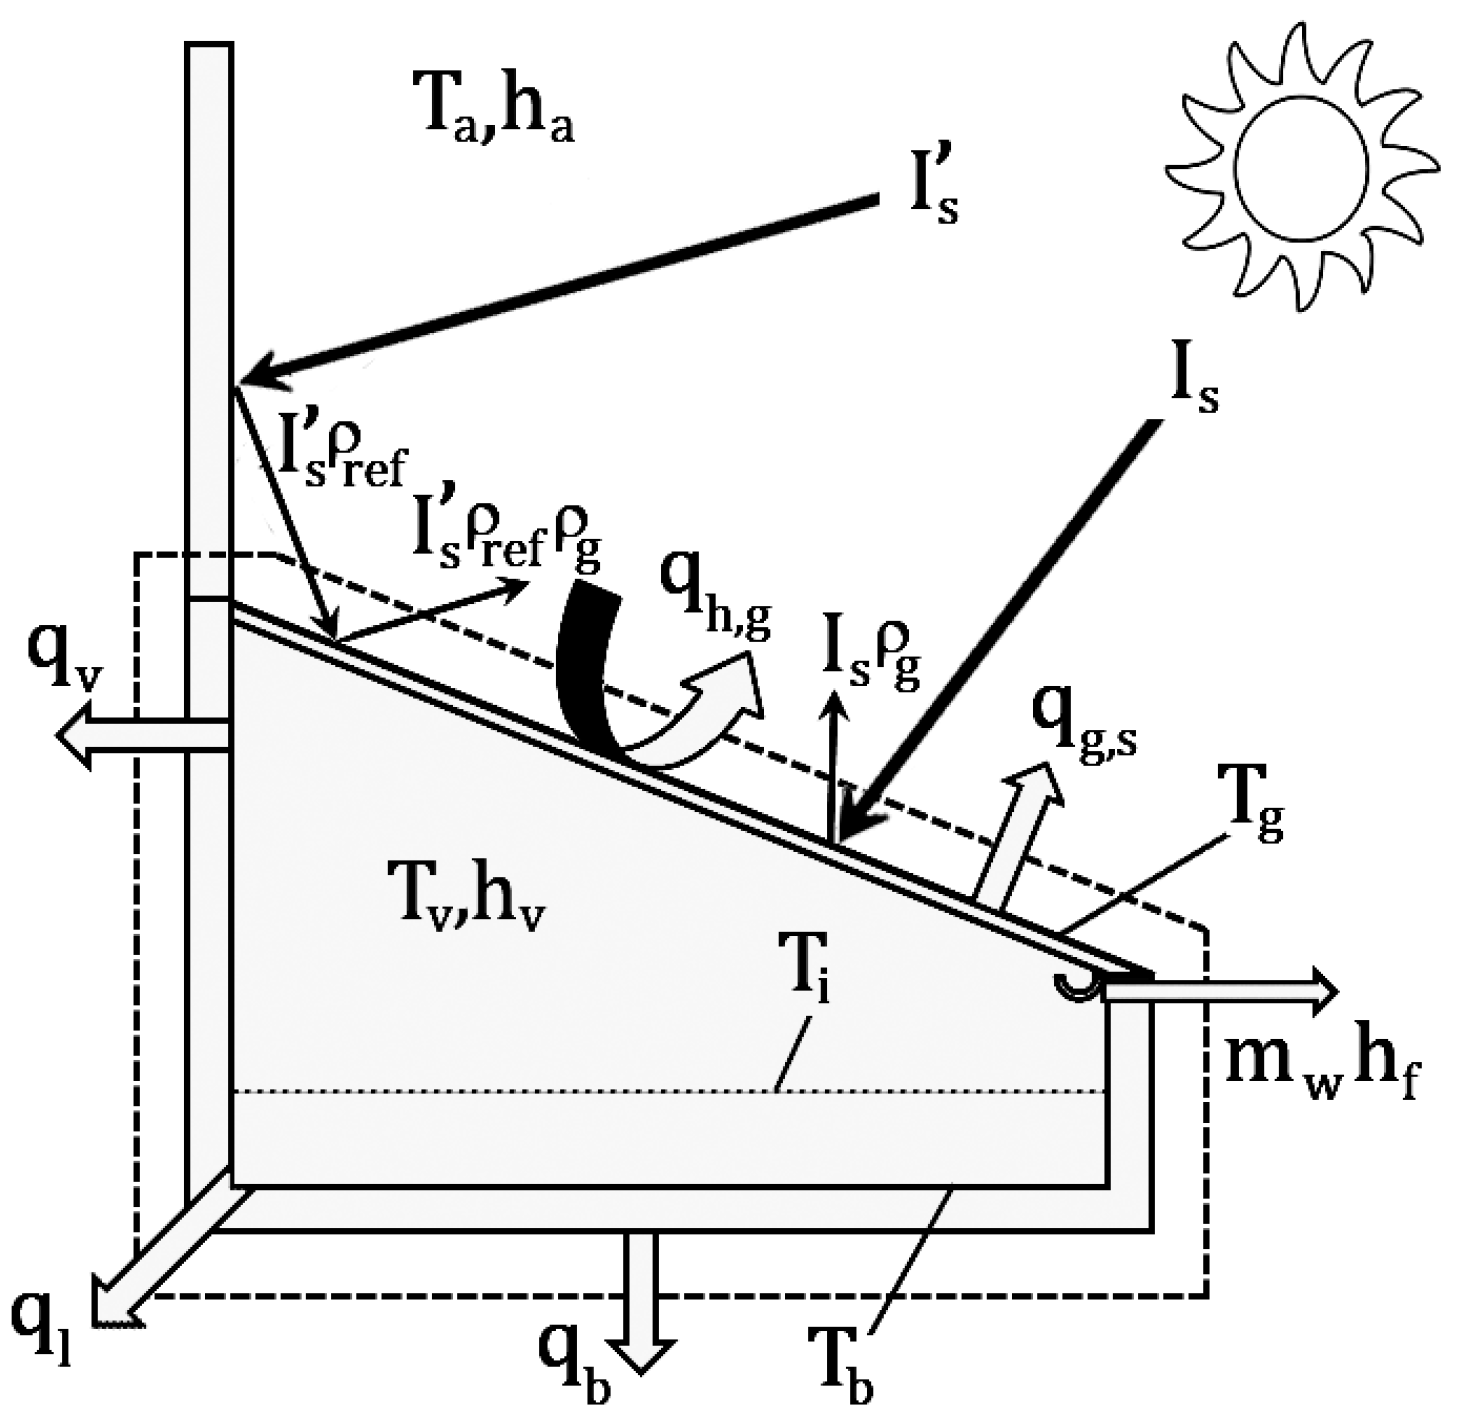
2.1. Energy Balance for the Whole Still
First, the energy balance equation is derived for the whole still. The input and output energies due to heat and mass transfer are shown in
Figure 2.
Therefore, the energy balance equation of the whole solar still can be written as:
where
is the solar radiation intensity on the glass cover;
and
are respectively the reflectivity of the reflector (
) and glass cover (calculated according to [
32]);
is the enthalpy of saturate water at
; and
is the mass flow rate of condensed water. Also,
,
,
and
are the effective areas respectively corresponding to the glass cover, bottom, saline water, and inside saturated air.
is the solar radiation reflected from the external reflector and met with the glass cover surface that was inspired by Tanaka and Nakatake [
33],
in which
is the azimuth angle of the still and
is the angle of the glass cover.
and
indicate the azimuth and altitude angle of the sun, respectively. Furthermore,
is the height of the reflector and
is the width of the basin and reflector.
The rate of heat transfer from the cover to the atmosphere by convection,
, can be determined as follows:
In this equation,
and
are the glass cover temperature and ambient temperature, respectively.
is the convective heat transfer coefficient, which is given by McAdams [
34] as follows:
where
is the prevailing wind speed in m/s.
Radiation heat transfer between the glass cover and the atmosphere,
, is defined as:
where
is the emissivity of the glass (
),
is the Stefan–Boltzmann constant (5.67 × 10
−8 W/m
2K
4), and
is the sky temperature in
(K), which is given by Tanaka et al [
35] as:
in which
is the dew point of ambient air.
The overall heat transfer from the bottom to the atmosphere,
, can be formulated as:
where,
in Equation (8),
is the convective heat transfer coefficient of ambient air, and
and
are the thickness and thermal conductivity of galvanized iron plates, respectively.
and
indicate the thickness and thermal conductivity of polystyrene, respectively.
The overall heat transfer from the inside saturated air to the atmosphere,
, can be considered as:
where,
in which
is the convective heat transfer coefficient of inside saturated air and is calculated by Equation (15).
Eventually, the overall heat transfer from the saline water to the atmosphere,
, can be expressed as:
in which,
and
. In Equation (11),
is the convective heat transfer coefficient of saline water, which is considered
due to its high value compared to the ambient air.
2.2. Energy Balance for the Glass Cover
Considering the glass cover as a volume control, as shown in
Figure 3, the energy balance equation of the glass cover is expressed as:
where
is the enthalpy of the saturated water at
, and
is the transmittance of the glass cover for visible light (
). It should be noted that heat losses from the front and back borders of the glass are very low, which can be neglected for calculations.
Radiation heat transfer from the water to the glass,
, is given by Atagunduz et al. [
36] as follows:
where
is the emissivity of water (
) and
is the transmittance of glass for infrared radiation (
).
Convective heat transfer from the saline water to the glass,
, is:
in which
is the convective heat transfer coefficient corresponding to the inside saturated air. This coefficient is given by Dunkle [
37] in the following expression:
where
and
are the water vapor partial pressures in (N/m
2) at
and
, respectively.
and
can be calculated by Equation (16), which is presented by Fernandez and Chargoy [
38]:
In this equation, is the temperature of the water or glass cover in K.
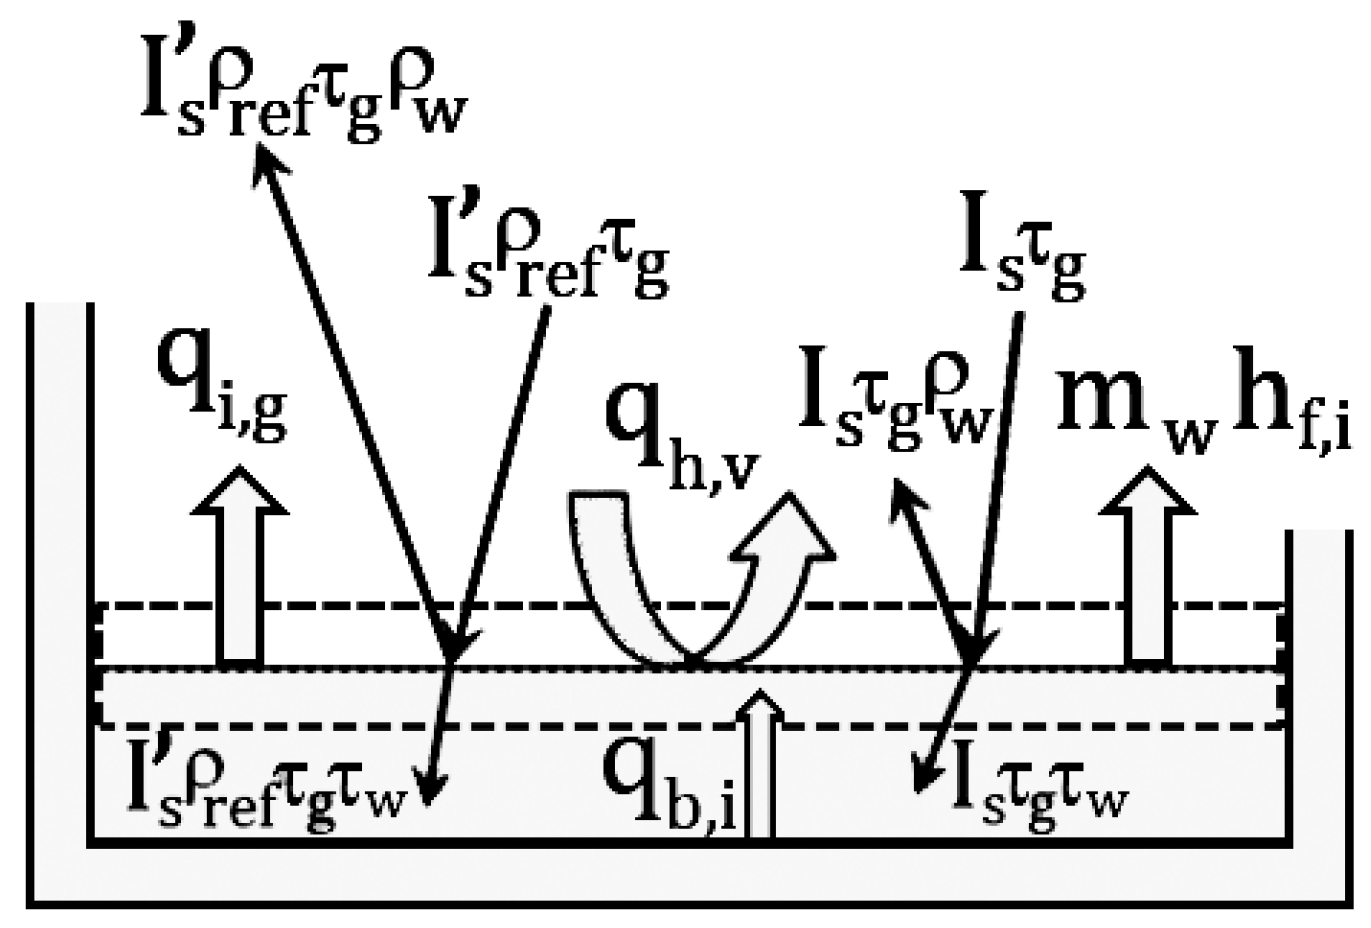
2.3. Energy Balance for the Saline Water Interface
By using
Figure 4, and considering the saline water interface as a surface control, the energy balance for the saline water interface can be represented as:
where
is the enthalpy of saturate water at
,
and
are the water reflectivity (
) and transmittance of water (
), respectively.
is an area at the bottom of the basin that is affected by radiation reflected from the reflector.
can be calculated as:
Also,
is the conductive heat transfer from the bottom to the saline water interface, which can be expressed as:
in which
and
are respectively the depth and thermal conductivity of water.
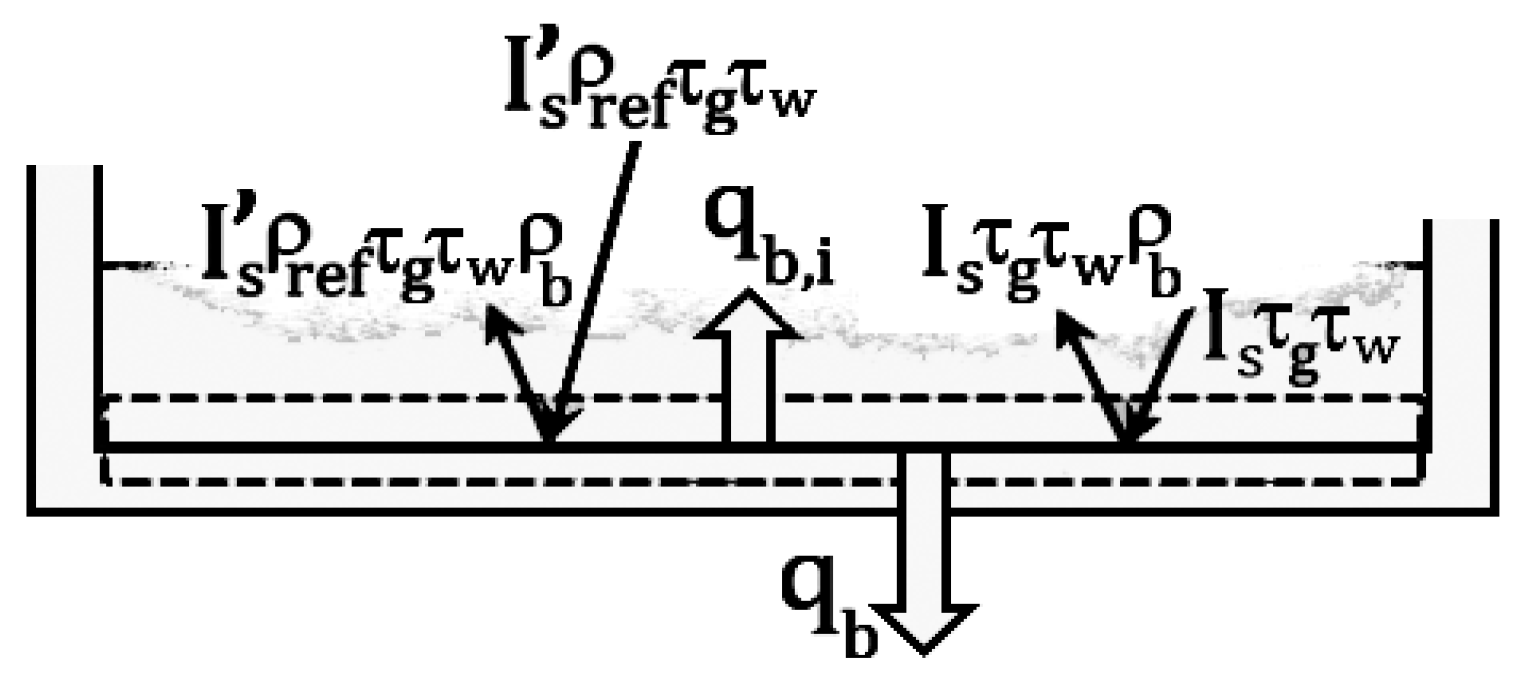
2.4. Energy Balance for the Black Basin Bottom
By referring to
Figure 5, the energy balance for the basin bottom can be given as:
In Equation (19), is the reflectivity of the black basin bottom.
As noted in Equations (1), (12) and (17),
is the mass flow rate of condensed water, which is equal to the mass flow rate of the evaporated water mass. This mass flow rate can be determined by Equation (21) [
39].
T denotes the inside saturated air temperature in (K), and R indicates the universal gas constant in (Nm/kgK). Also, and are the water vapor partial pressures in (N/m2) at and , respectively.
In Equation (21),
is the mass transfer coefficient for the semi-permeable plane and can be expressed as [
13]:
where
is the mass transfer coefficient for the non-permeable plane in (m/s) [
13] and
is the inside air pressure of the still in (N/m
2).
By solving the above equations and calculating the mass flow rate of the condensed water, the hourly efficiency of the solar still can be calculated by the following equation [
13]:
where
is the total condensed water in one hour (kg/m
2h),
is the latent heat of evaporation of water (kJ/kg), and
is the total solar radiation in one hour (kJ/m
2h).
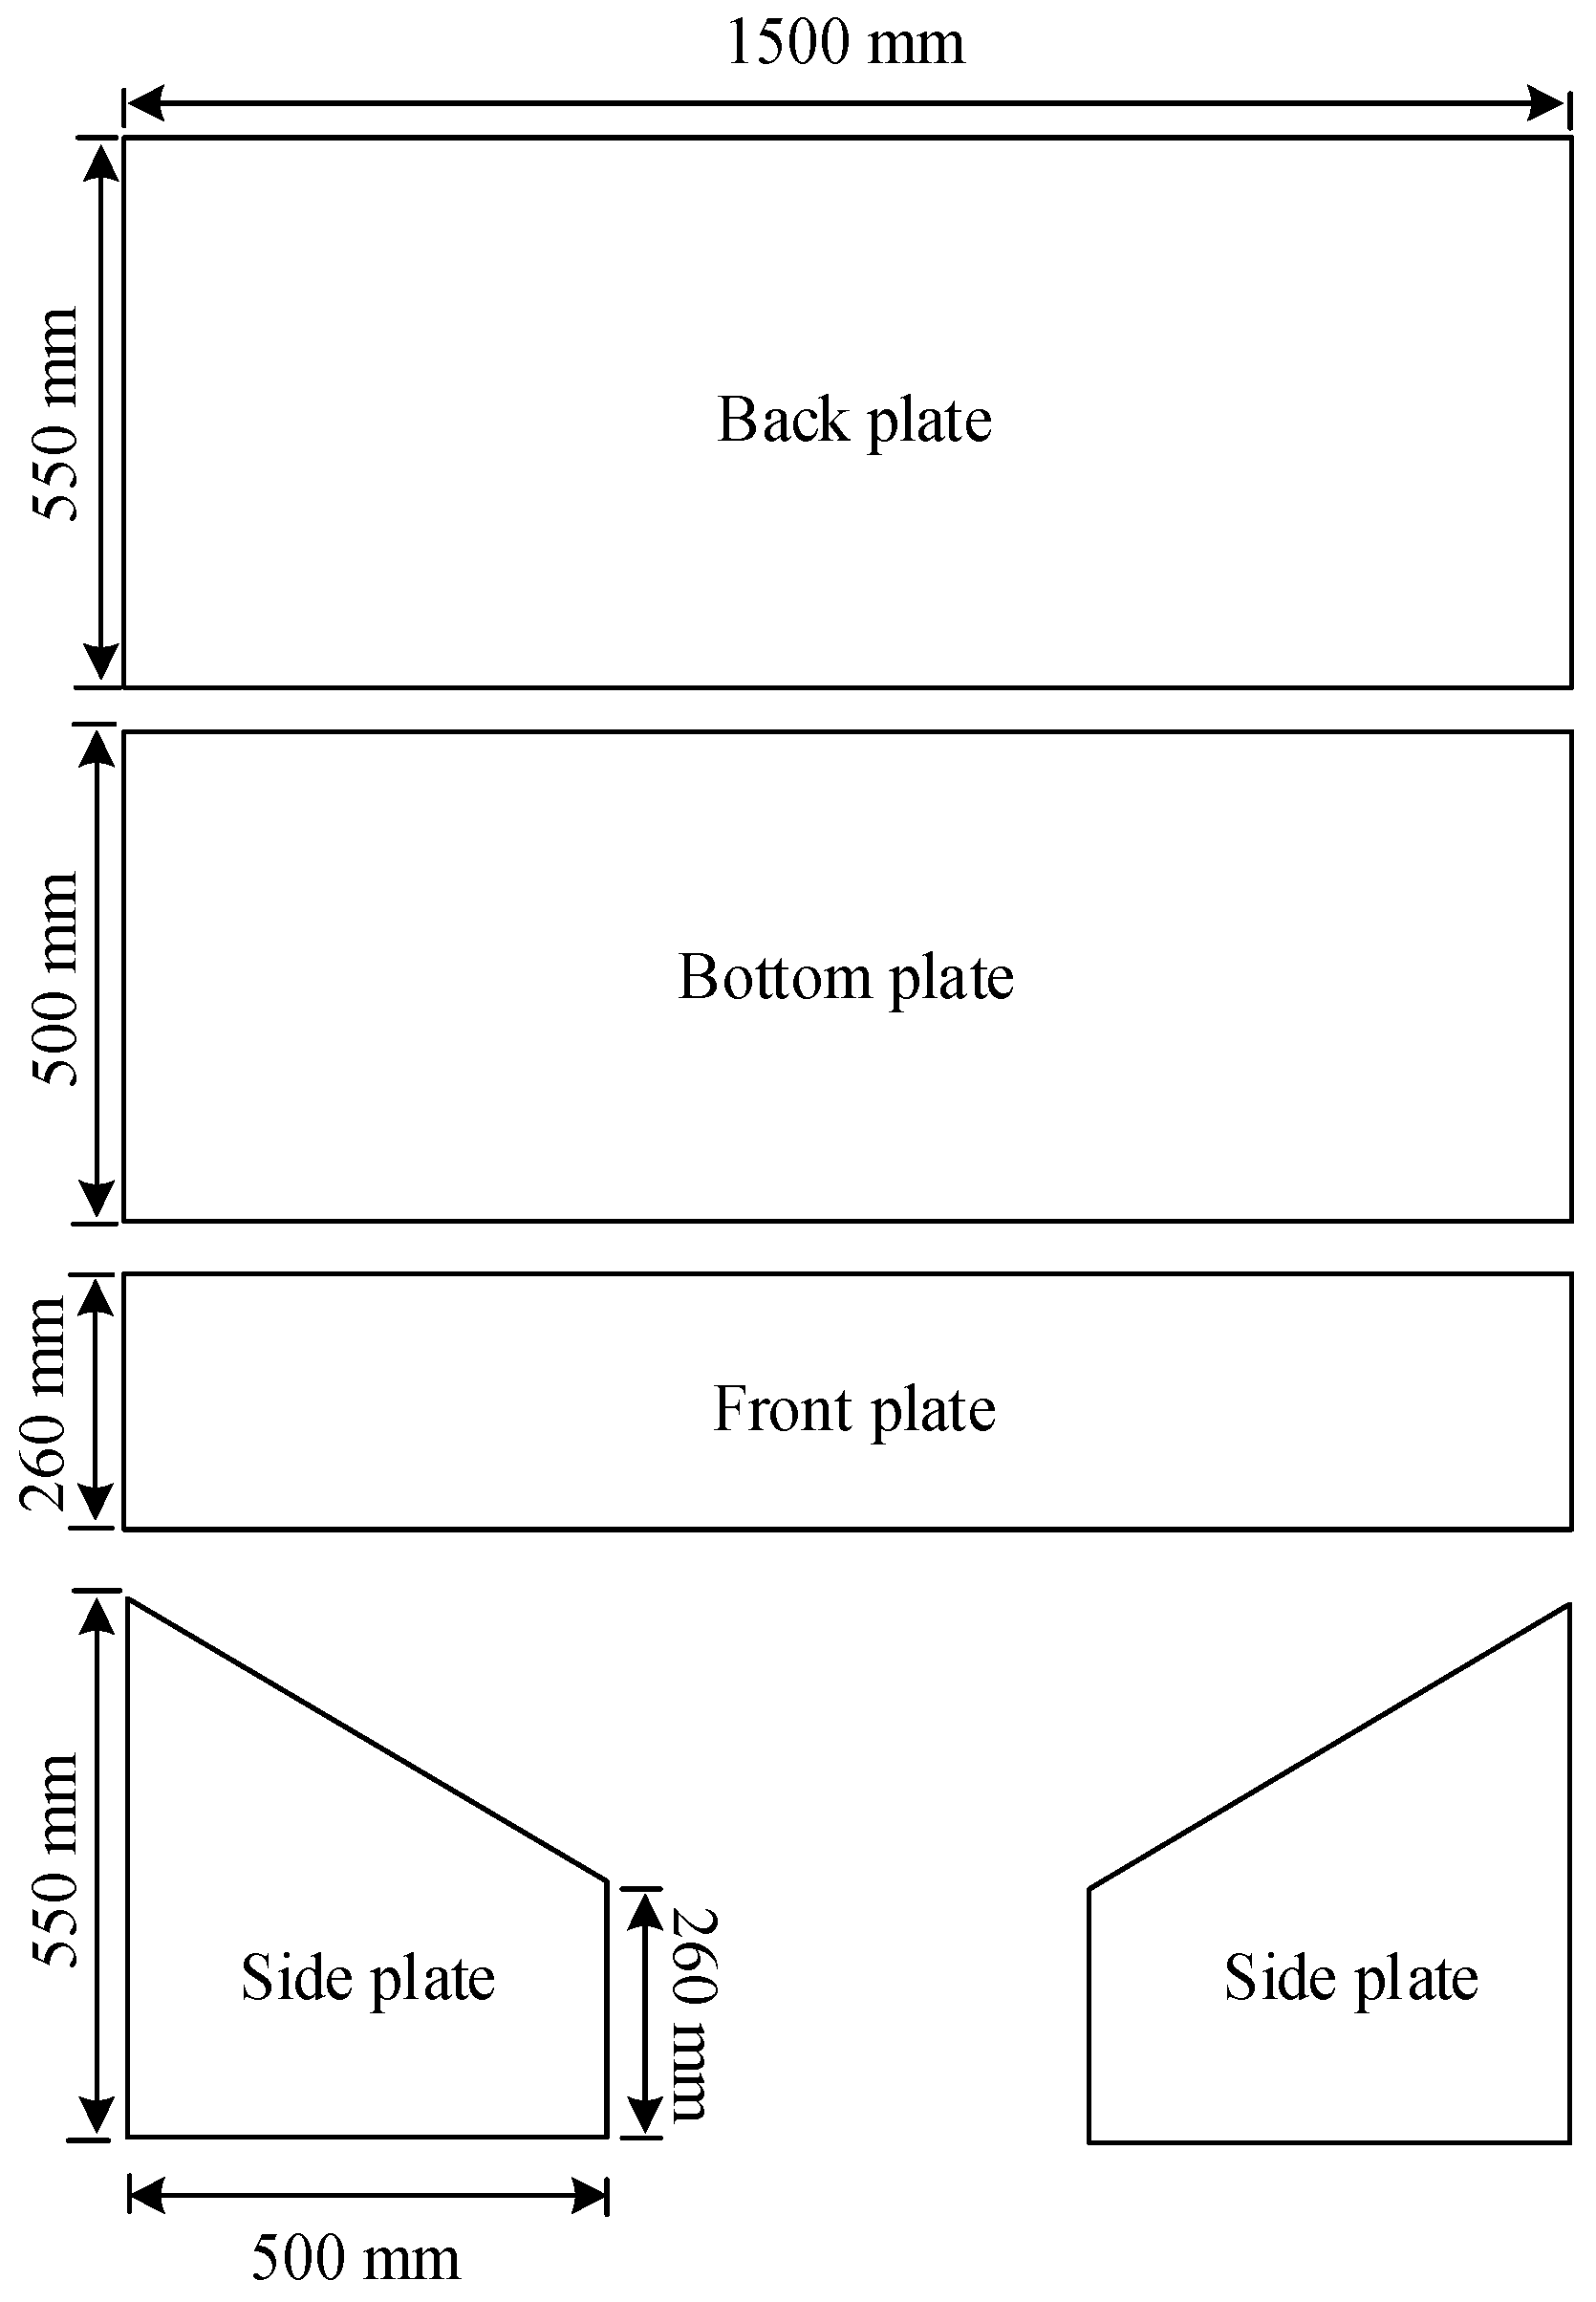
3. Experimental Procedure
The basin solar still with an external reflector was constructed in the climatological conditions of Najafabad (32°38′ N, 51°23′ E), Iran. This solar still was made of galvanized iron plates with a thickness of 0.002 m. The dimensions of the plates that were used for the inside box are displayed in
Figure 6. These parts were connected to each other by welding. To absorb more radiation, the upper surface of the box was cut at an angle of 32°, which was equal to the latitude of the place [
40]. All of the walls of the box were well insulated by polystyrene, with a thermal conductivity of 0.044 w/m∙K, and the box was enclosed by a galvanized plate. The glass cover was made of ordinary glass with a thickness of 3 mm, which was placed inside a frame. The frame was attached to the main body by rivets. To collect the condensed water, two channels were located under the lower side of the glass cover. The channels are ended with a plastic tube in order to drain the fresh water into an external container. The pond was located at the bottom of the device, which was made of a galvanized sheet with dimensions of 1500 mm × 500 mm as an absorber of solar energy. This sheet was painted with a black color and connected to the floor by welding. Three holes were also drilled to the body of the solar still, and three tubes with a size of 0.5 inch were connected to the holes. One of the tubes was for the saline water inlet, which was connected on one side to the supply tank, and the other side was connected to the pond. The second tube was for the condensed water outlet, which was connected between the solar steel and the distilled water container. Moreover, the third tube was used to discharge the remaining saline water. A mirror with a thickness of 3 mm measuring 1500 mm × 500 mm was attached to the still as an external reflector. This reflector focuses the incident solar radiation. The external mirror was placed within the frame of the galvanized sheet with a thickness of 4 mm, which can be set at different angles. Before fixing the glass cover, four Ni-Cr and K type thermocouples, with maximum error of 0.1 °C, were located to measure the temperature of different places of the solar still. They were located in the outside glass cover, pond, saturated air, and saline water interface. During the experiments, the long wall of the solar still was oriented to west-east direction.
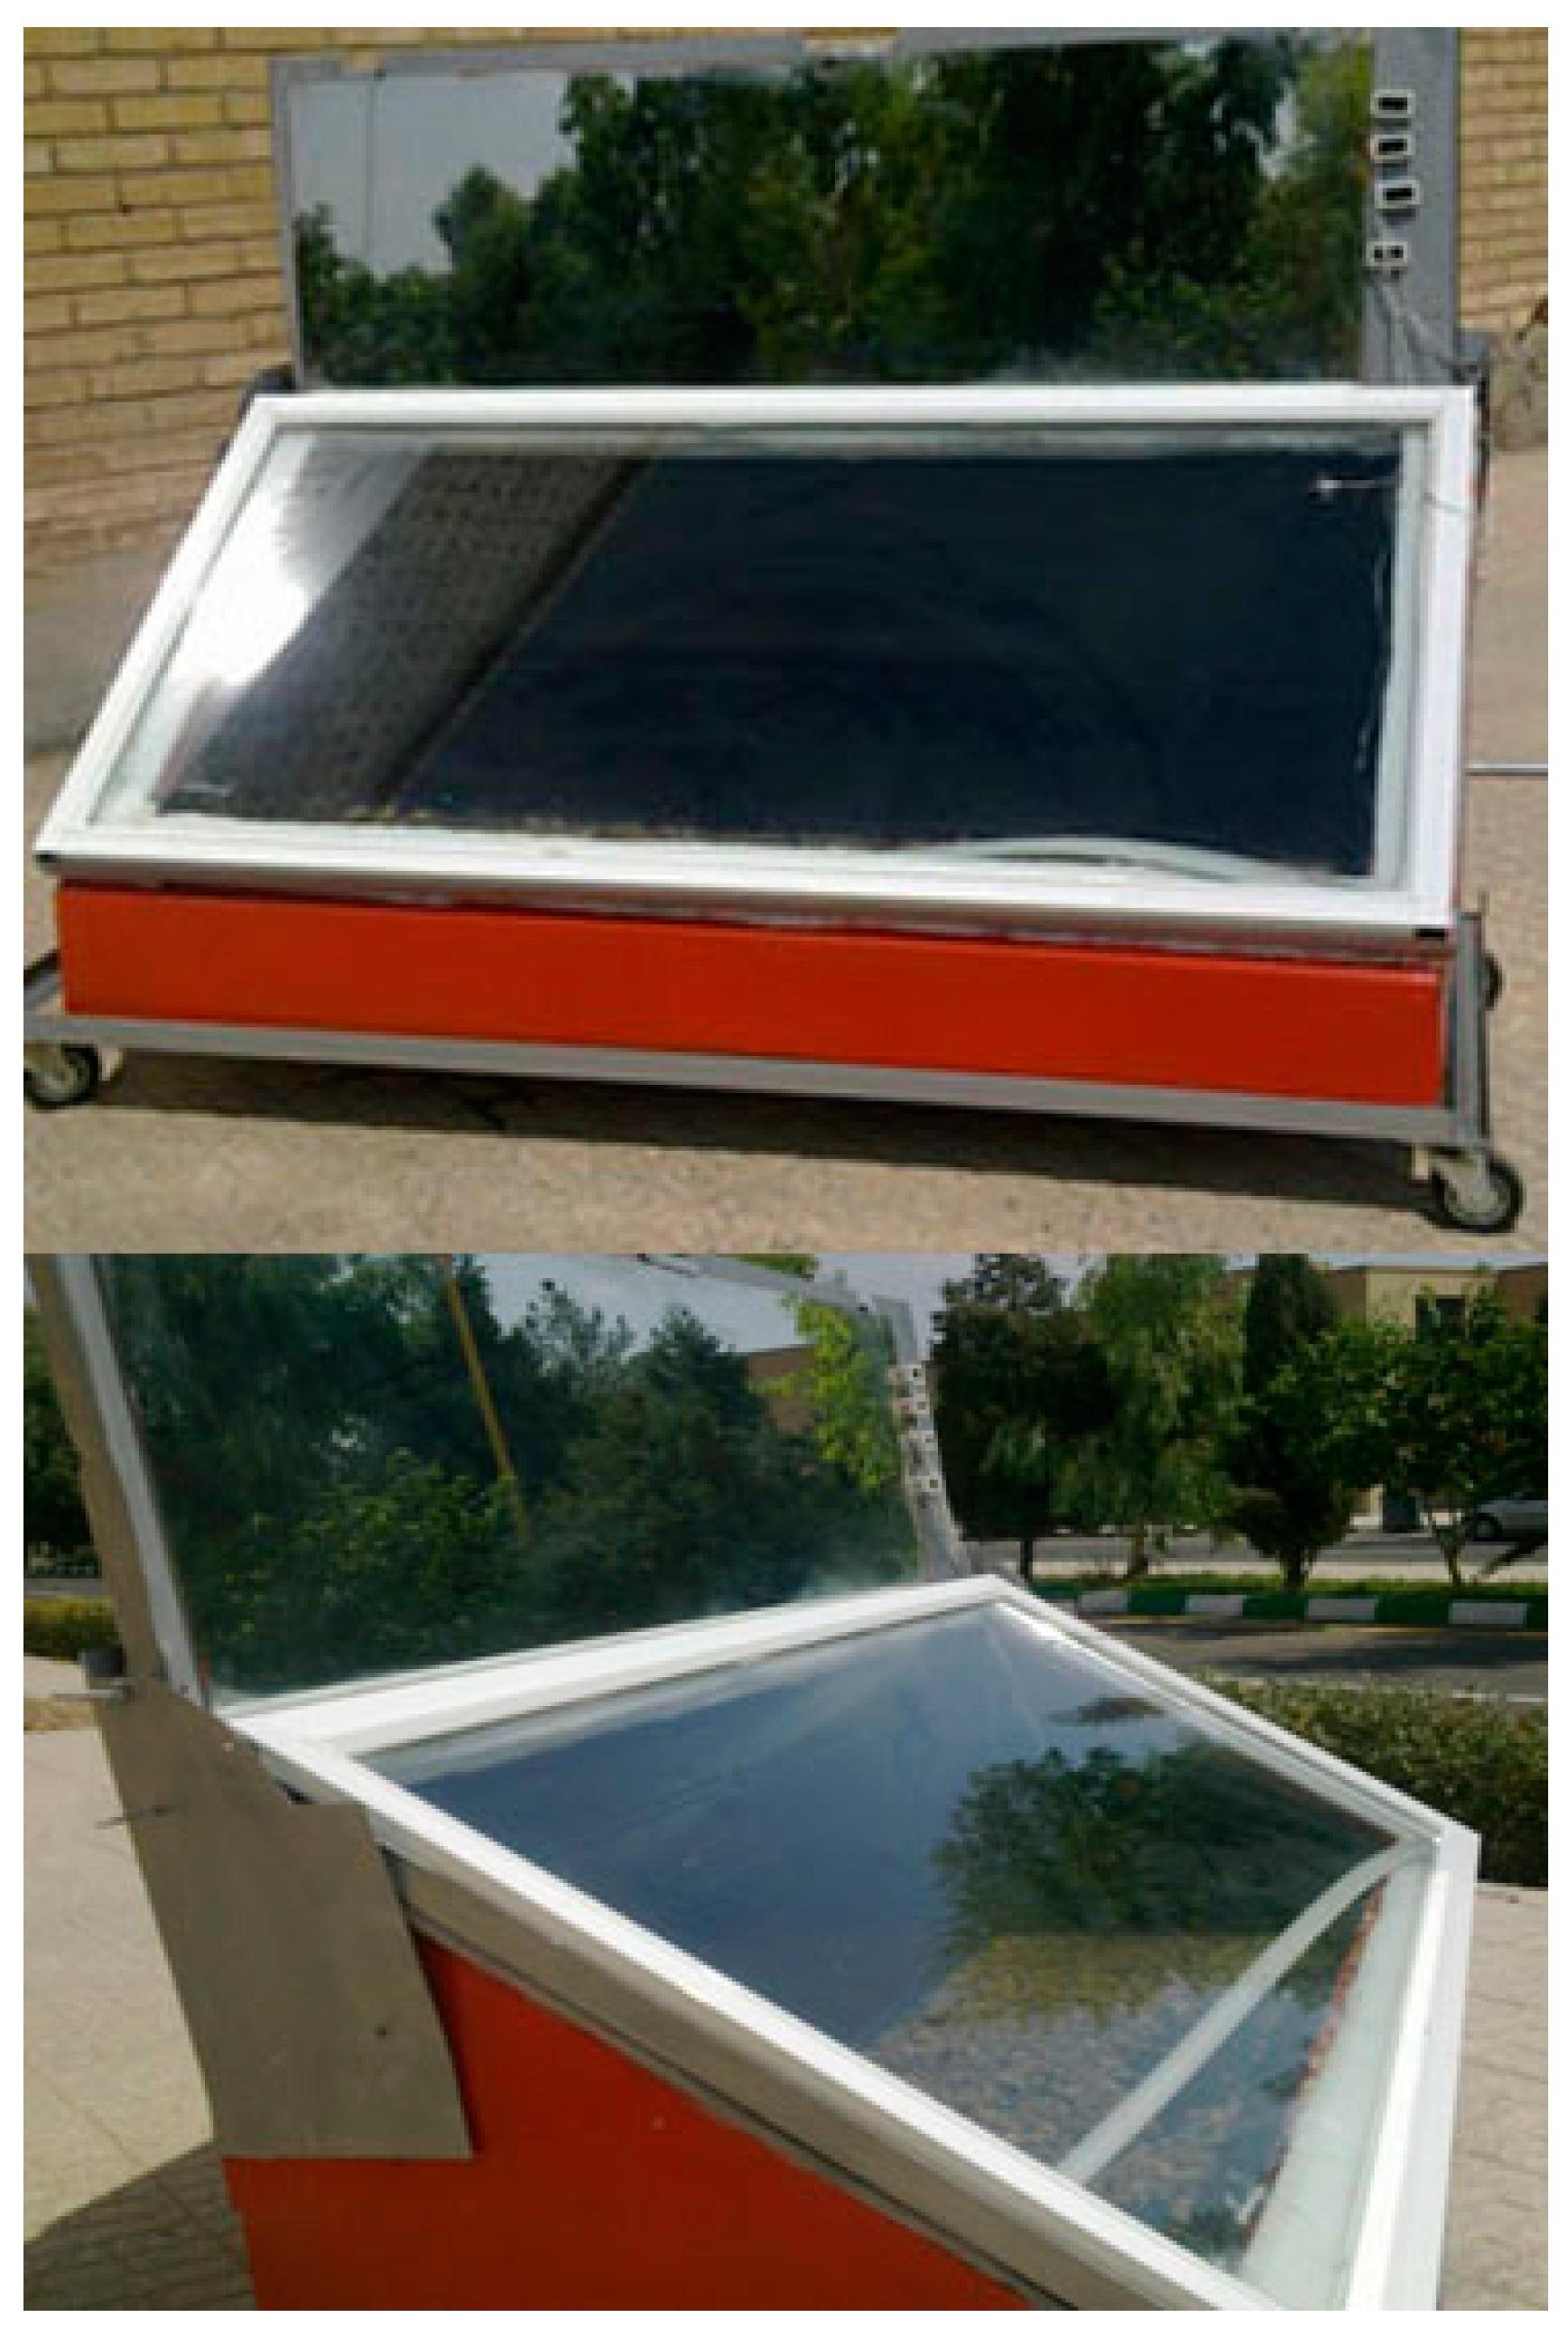
Figure 7 shows the photograph of the solar still. To perform the experiments, the basin was filled to 10 cm with saline water.
Experiments were conducted on the solar still at the Department of Mechanical Engineering, Najafabad Branch, Islamic Azad University, Najafabad, Iran. Testing began at 7 a.m. and continued until 6 p.m. on August 5. The hourly temperature values for different places of the still and amount of distilled water were measured. The results are shown in the next section.
4. Results and Discussion
In this study, the solar distillation in a basin type solar still, with the designs and dimensions shown in the previous section, was investigated theoretically and experimentally. As previously described, a mirror was added to the solar still. In addition, the still was equipped with an inclined glass cover to absorb more radiation.
In the theoretical analysis, the solar radiation values corresponding to the inclined glass cover and reflector were calculated by the method presented by Ayav and Atagunduz [
41] and a computer code. Using another computer code, the mentioned energy balance equations were numerically solved to make comparisons with the experimental results. In this code, four non-linear energy balance equations were solved by a gradient-based optimization method. By solving these equations, the temperatures of the bottom, interface, inside saturated air, and glass cover were calculated. The values of these temperatures led to the calculation of the theoretical amount of evaporated water. All calculations were performed on August 5.
In the experimental section, the level of distilled water and temperature values were noted in each hour on August 5.
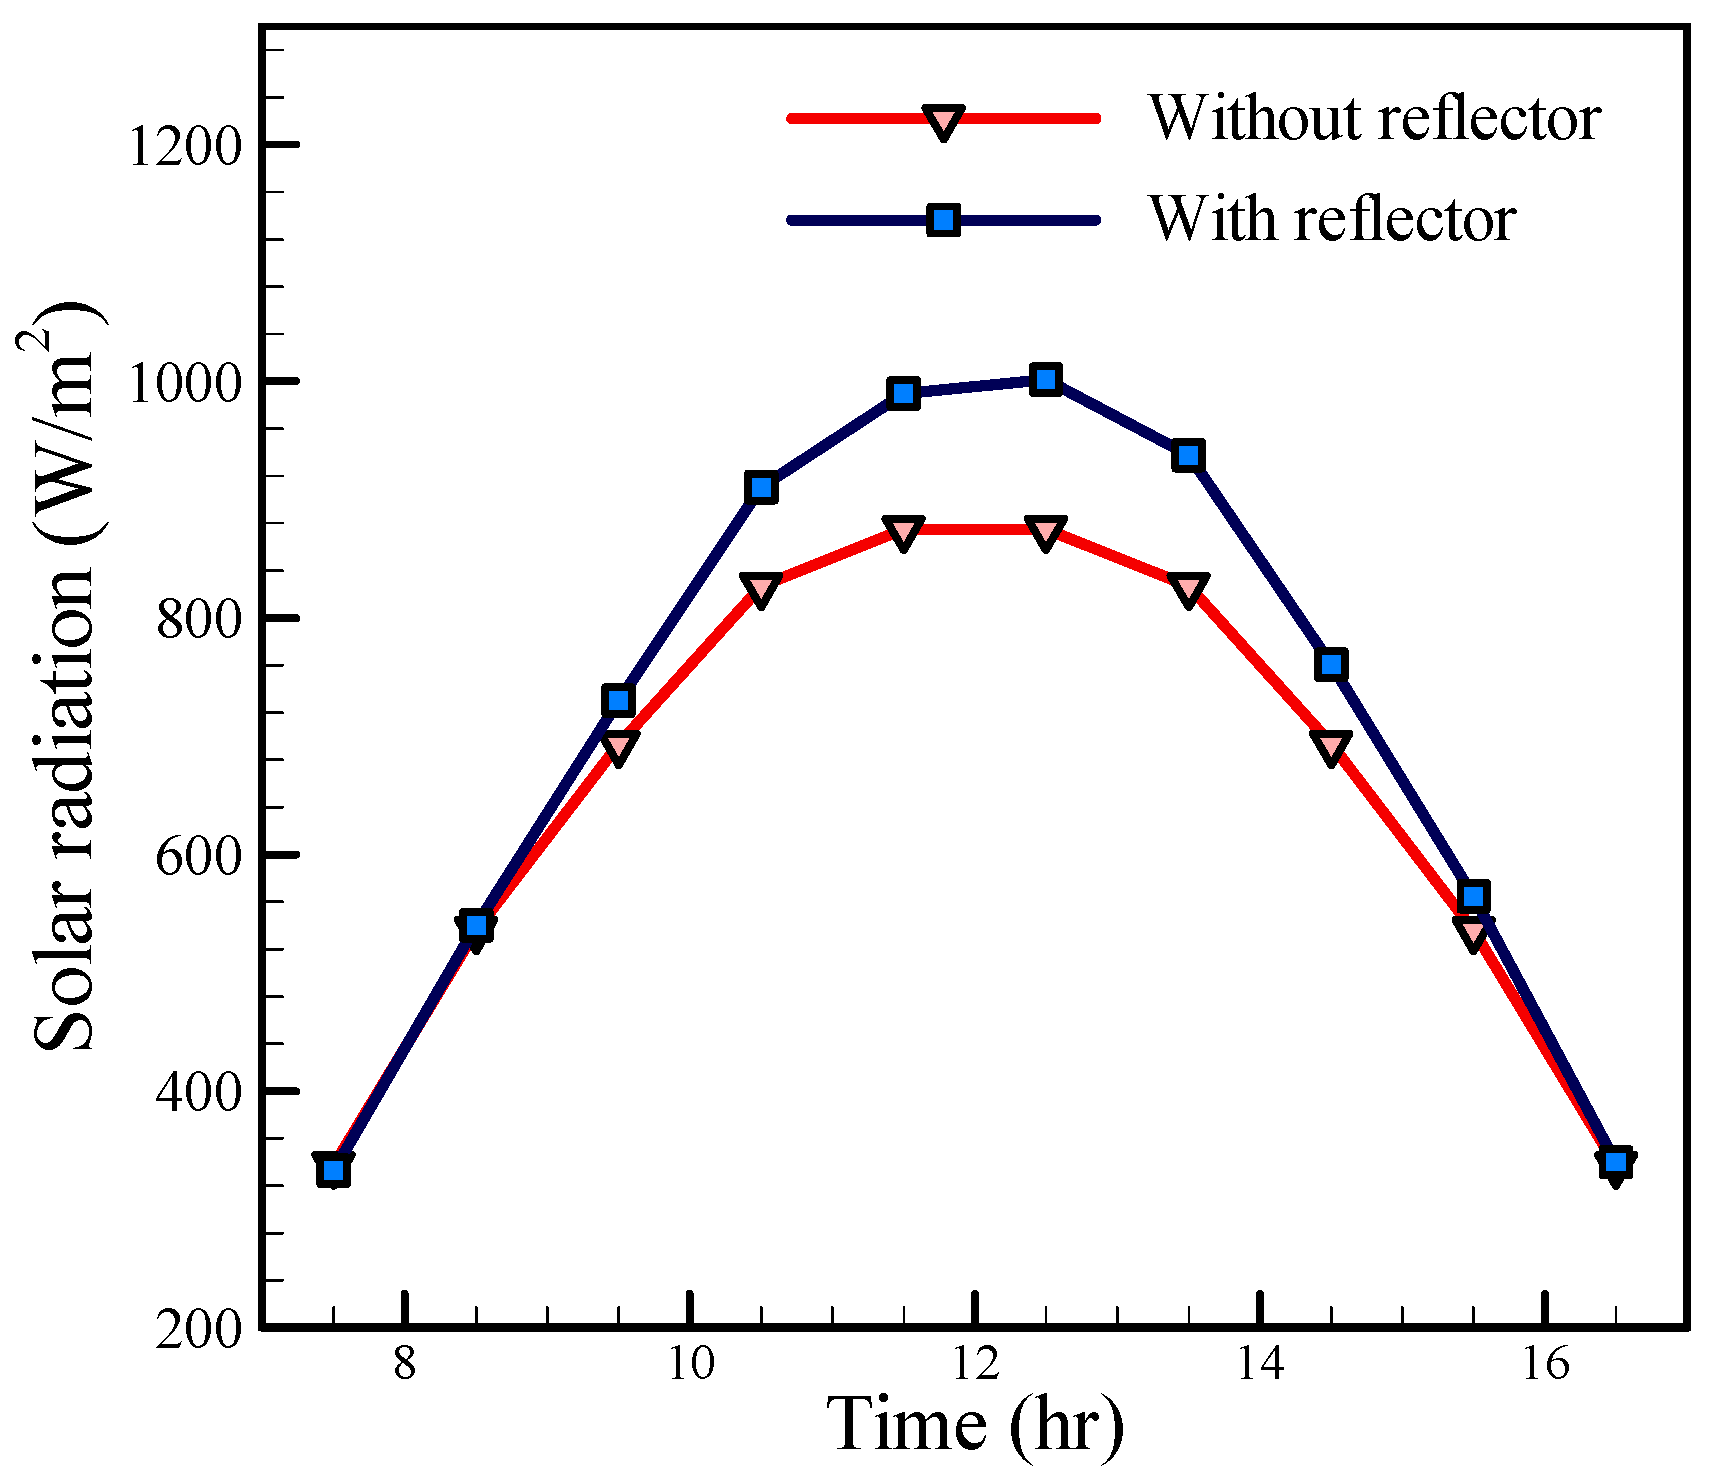
Figure 8 shows the hourly solar radiation values on the solar still with and without a reflector for August 5. It was found that by adding the reflector, solar radiation could be enhanced. This enhancement is at maximum value at noon (about 20%).
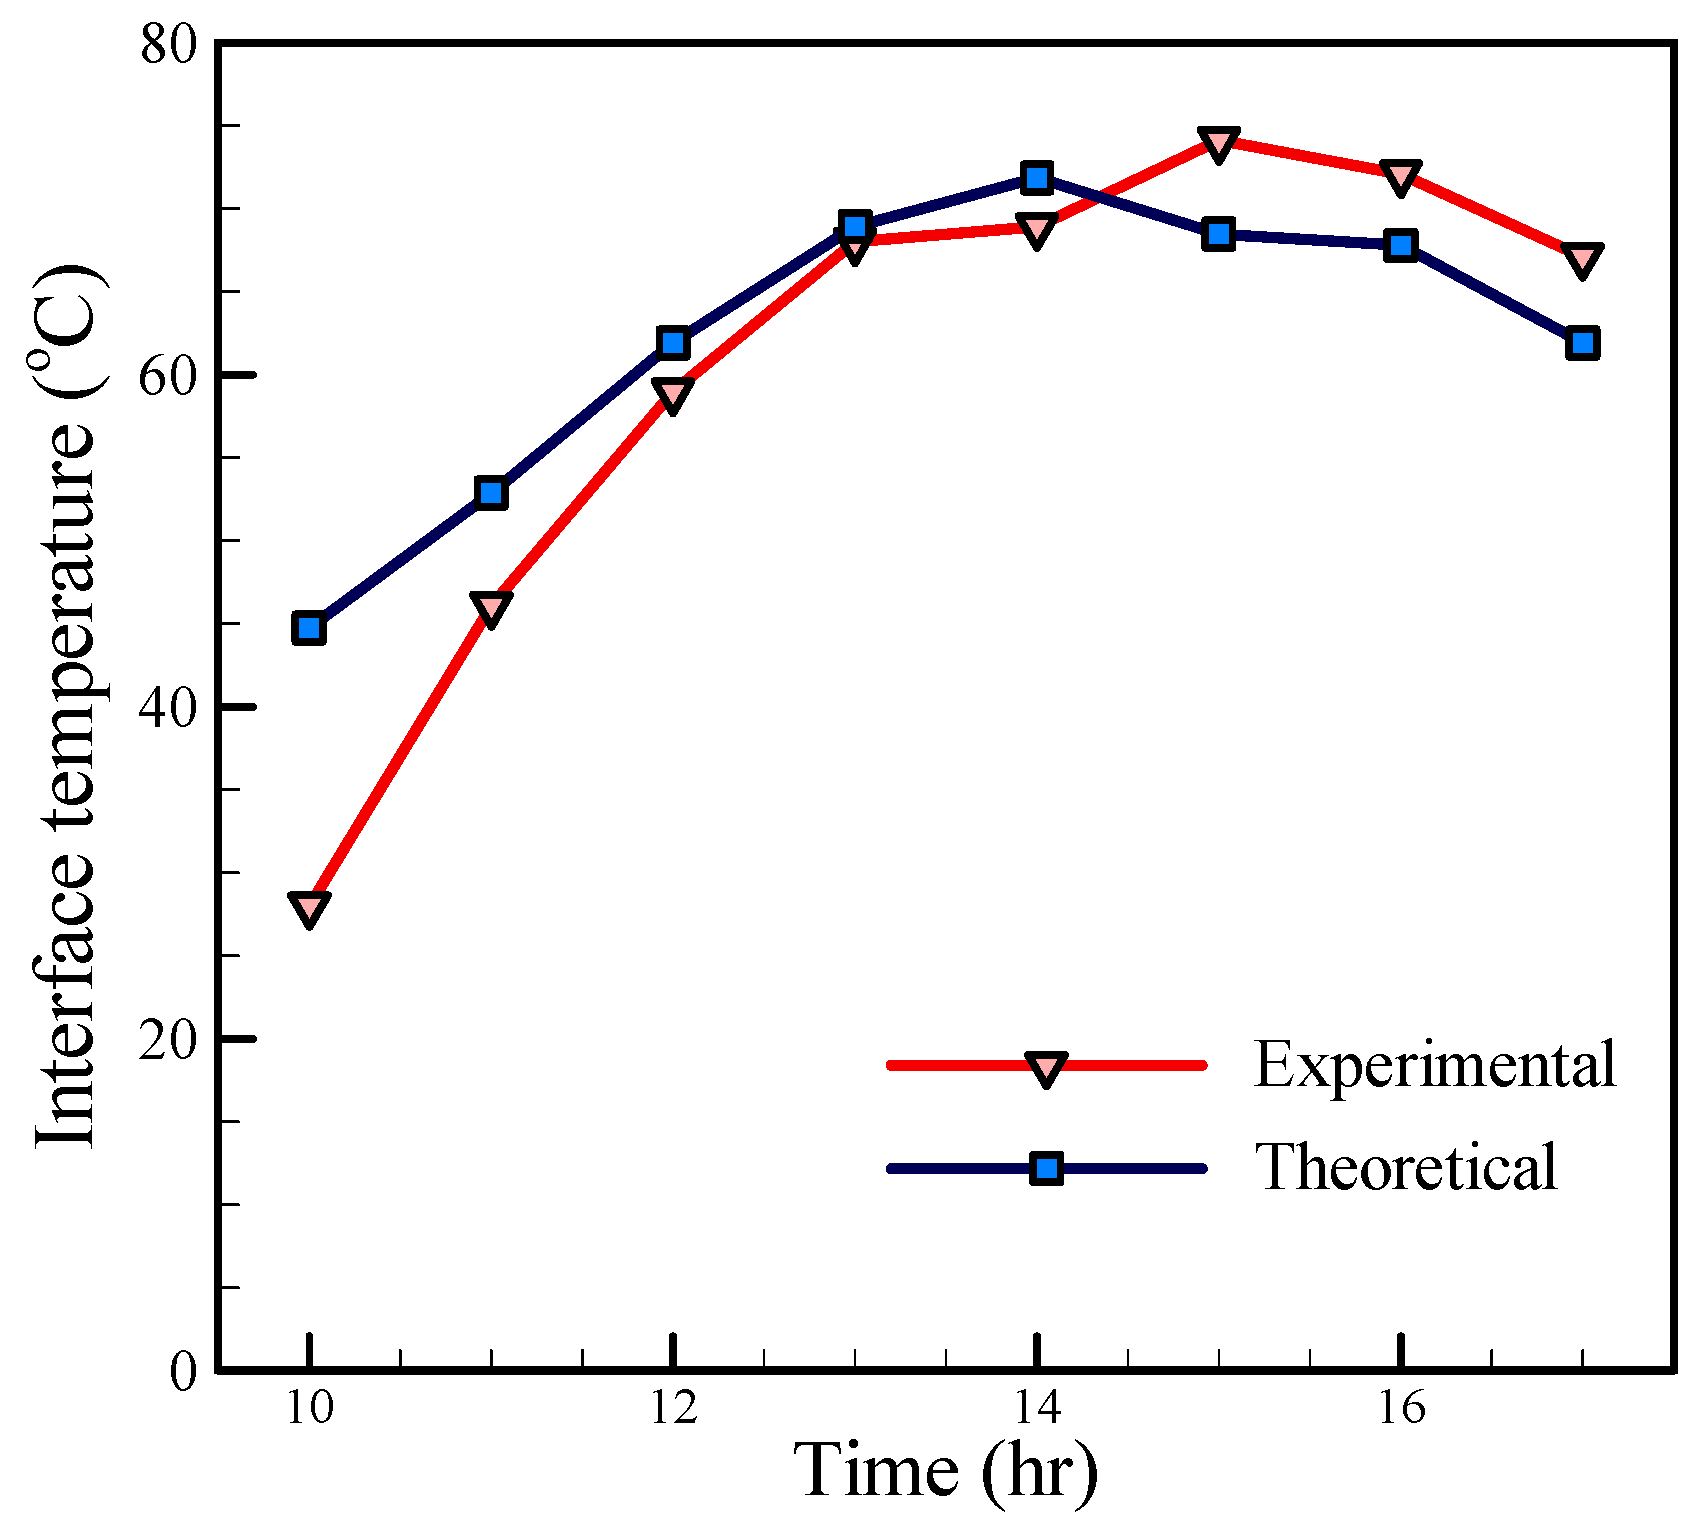
In order to evaluate the theoretical model of the basin solar still,
Figure 9,
Figure 10 and
Figure 11 show a comparison of the theoretical and experimental temperatures of the interface, inside air, and glass cover, respectively. As shown in
Figure 9, the temperatures have the same trend, but these are far apart in the morning, and the experimental temperatures are lower than the theoretical temperatures. This behavior is due to the fact that the amount of energy stored in the saline water and still body which has not been considered in the theoretical calculations. With the reducing solar radiation in the afternoon, the experimental temperatures are higher than the theoretical temperatures, which are also related to the thermal capacity of the saline water and the energy stored in it. Since the inside air is in contact with the saline water, this phenomenon can also be seen in
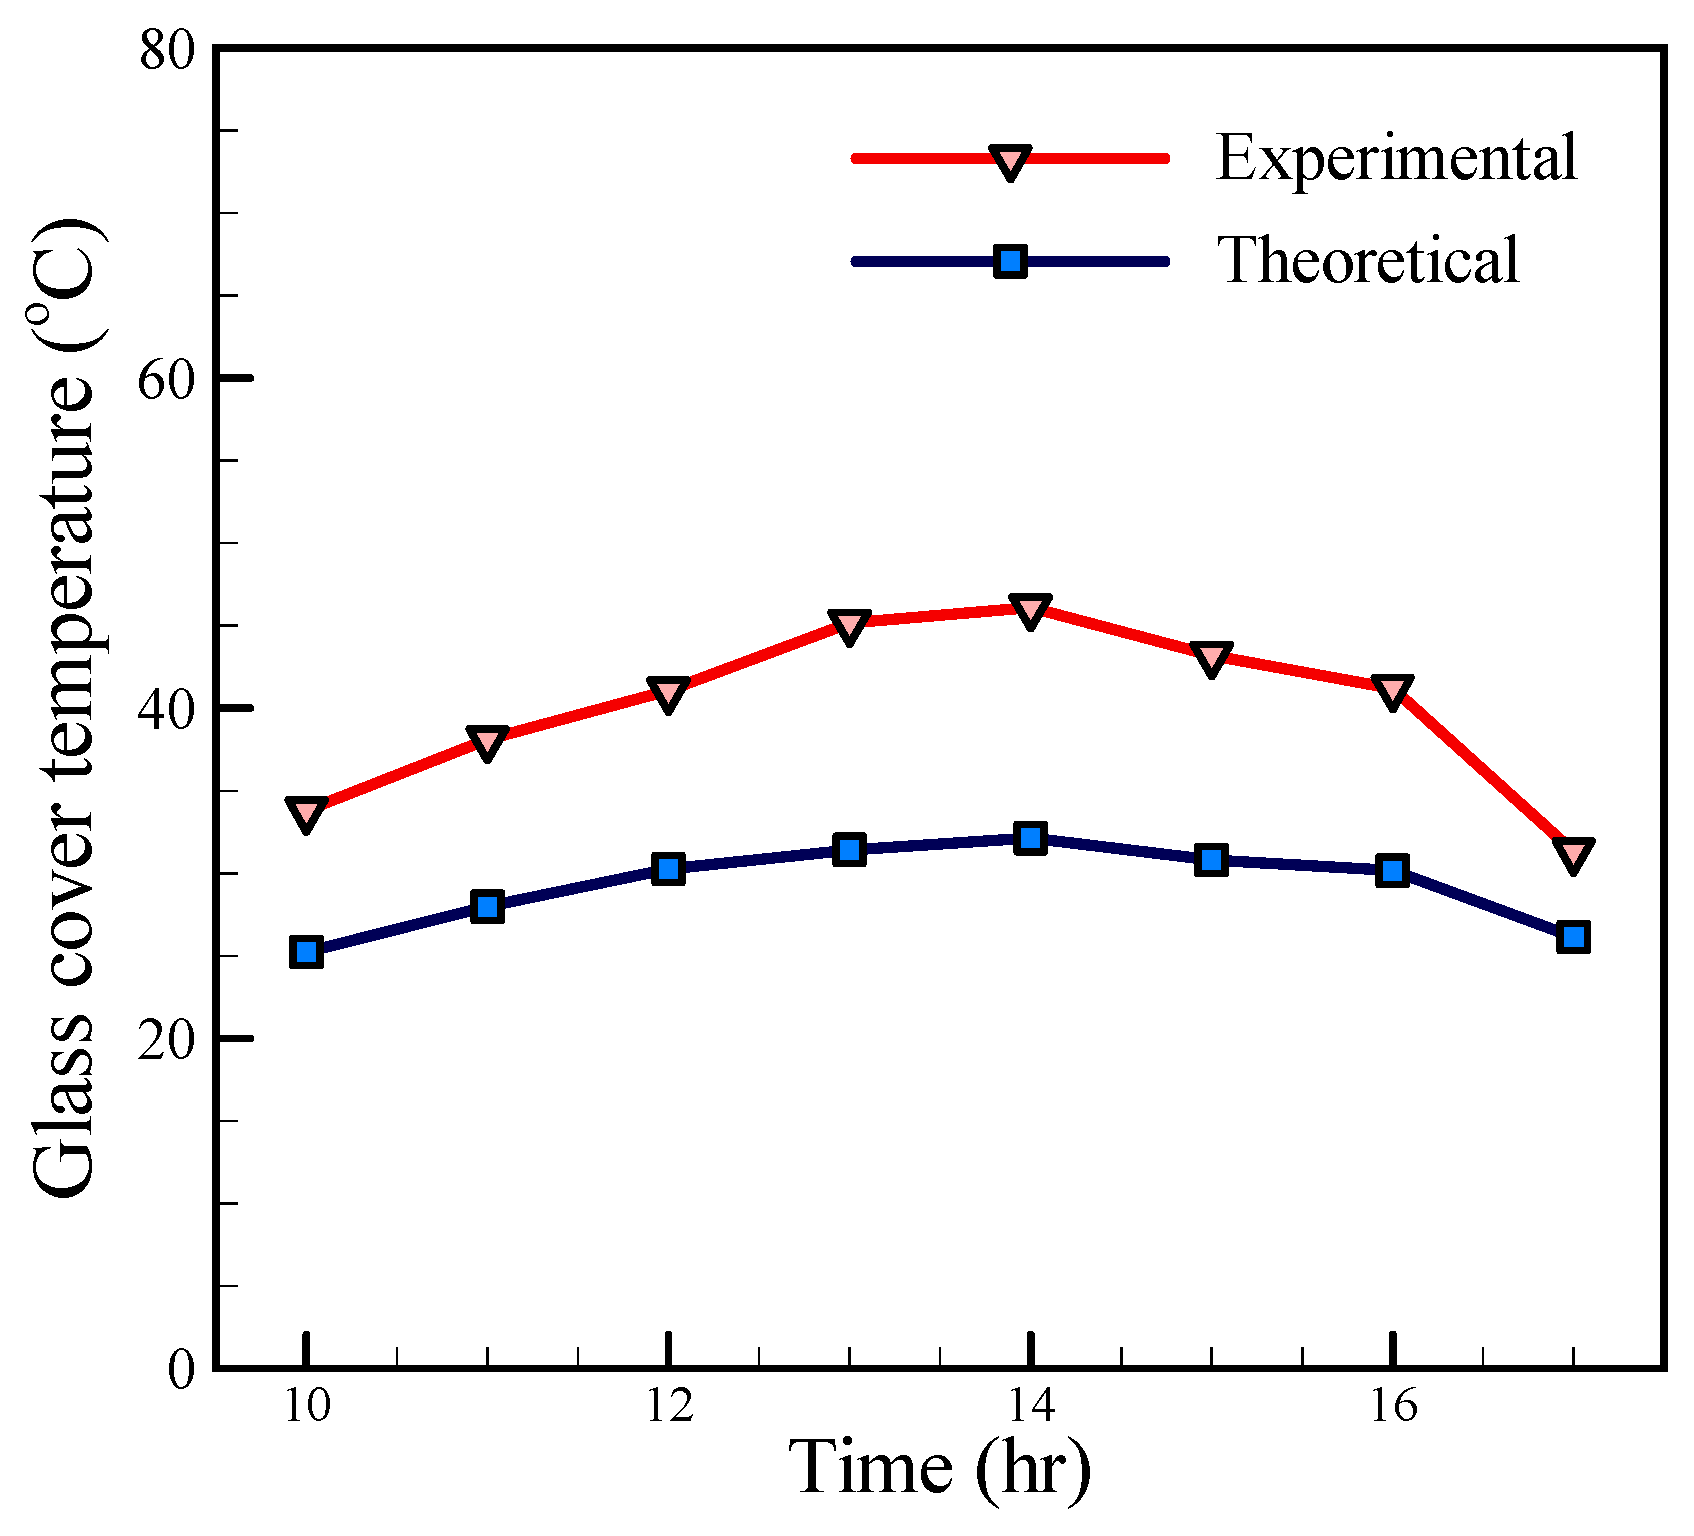
Figure 10. A comparison between the theoretical and experimental temperatures of glass, as shown in
Figure 11, illustrates that the theoretical and experimental diagrams have a similar trend, but the great difference between them is observed. This difference is due to the effect of solar radiation on the thermometer lactated on the glass, which leads to a higher value of the experimental temperature in comparison with the theoretical temperature.
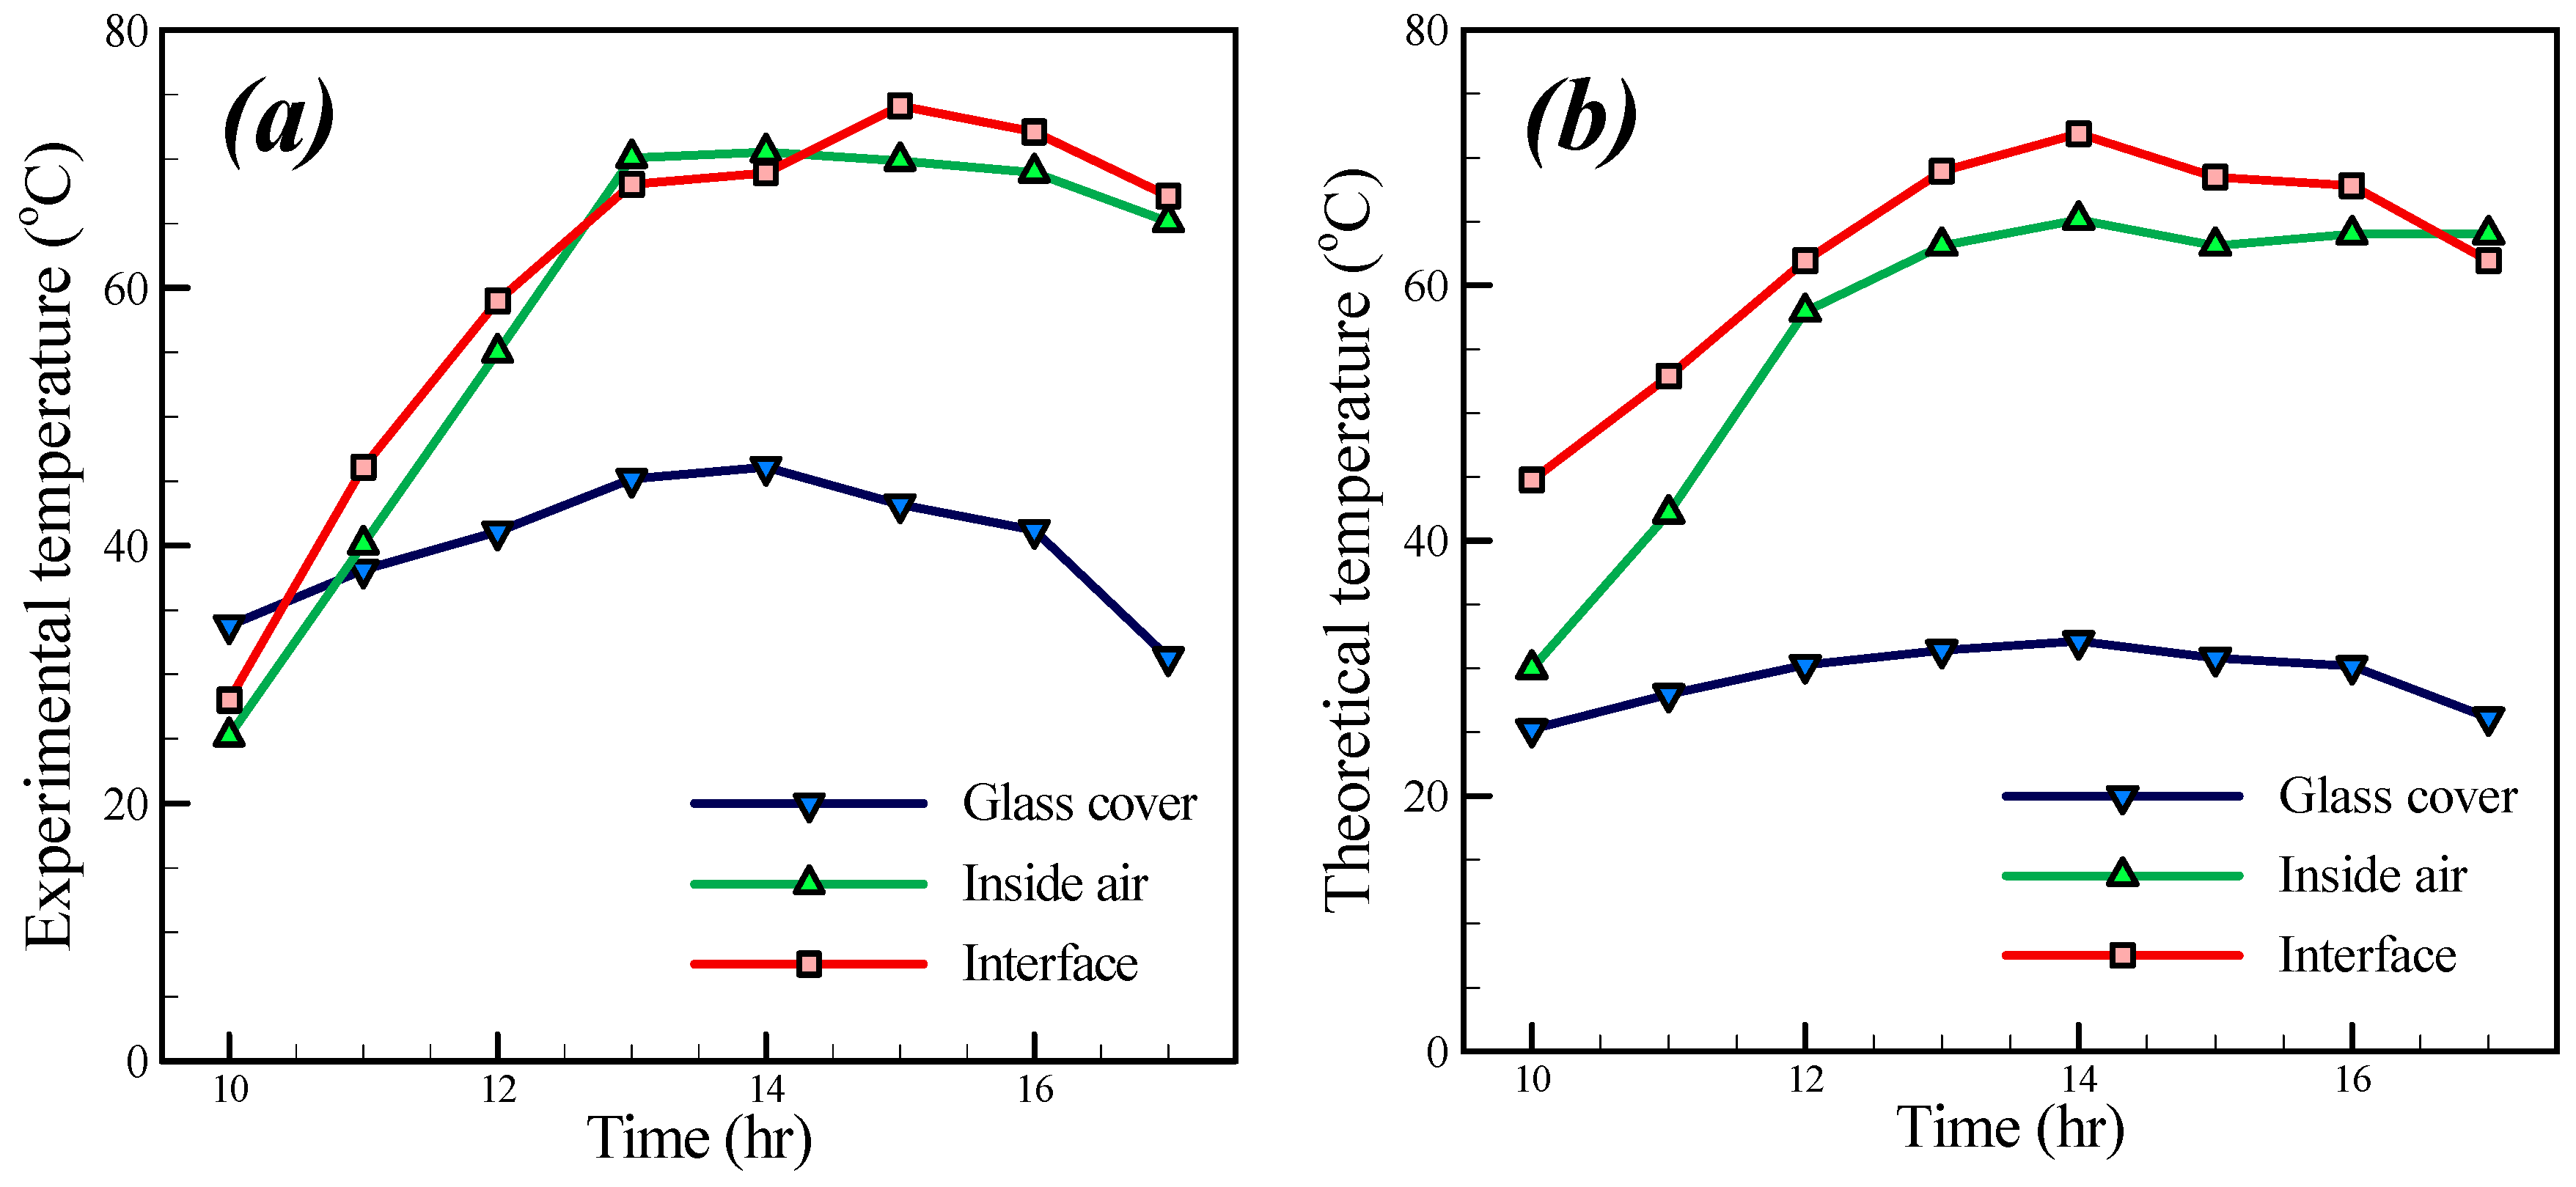
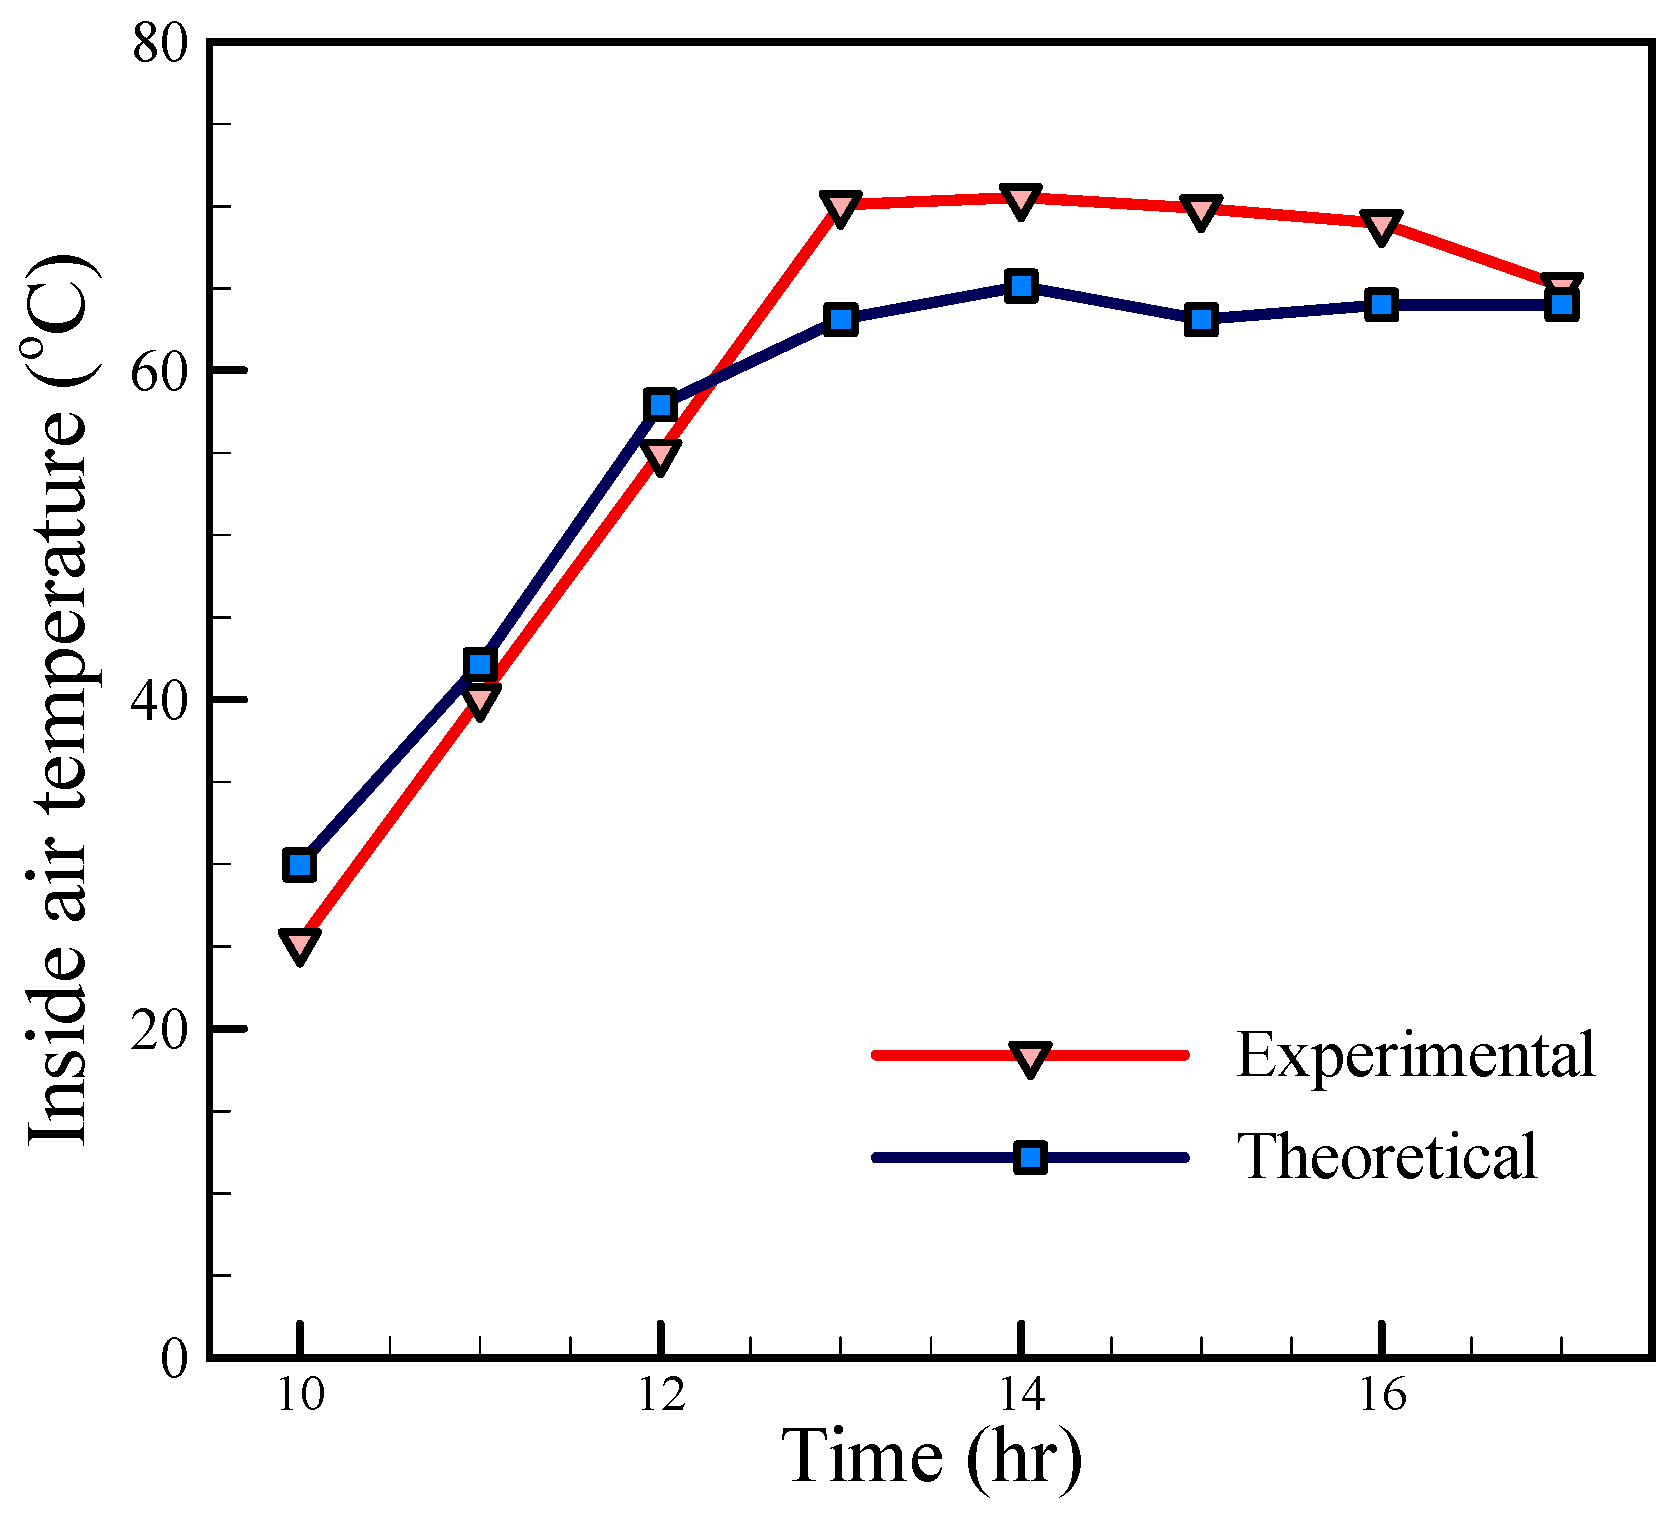
The hourly variation of theoretical and experimental temperatures on the solar still is depicted in
Figure 12. As shown in
Figure 12a,b, the trend variation of glass cover temperature, air inside the basin and water surface temperature are similar to the change of input solar radiation (
Figure 8). Over time a greater radiation flux enters the basin and consequently increases the temperature of the glass cover, water and air in the basin. However, all three temperature decrease with less input flux.
The glass surface exchanges heat with ambient air; thus, it has a lower temperature than the water surface. This can be observed in
Figure 12a,b. In general, the water surface temperature is higher than that of the air inside the basin in all points. From 12 p.m. to 2 p.m., the thermocouple which is placed in the basin to measure the air temperature receives much radiation and therefore shows a higher temperature than in reality. Hence through the mentioned range of times, the air temperature is higher than the water surface temperature.
Regarding
Figure 12a during the primitive hours, the surface temperature is higher than that of the air inside and the water surface temperature. This is attributed to the fact that the input energy is used to dominate the internal energy of the water. However, in
Figure 12b the water surface temperature is always greater than that of the glass cover. This is because that the change of the internal energy of water is negligible. As already mentioned, convection heat transfer between the glass cover and ambient air would result in decreased glass cover temperature in comparison with that of the water surface.
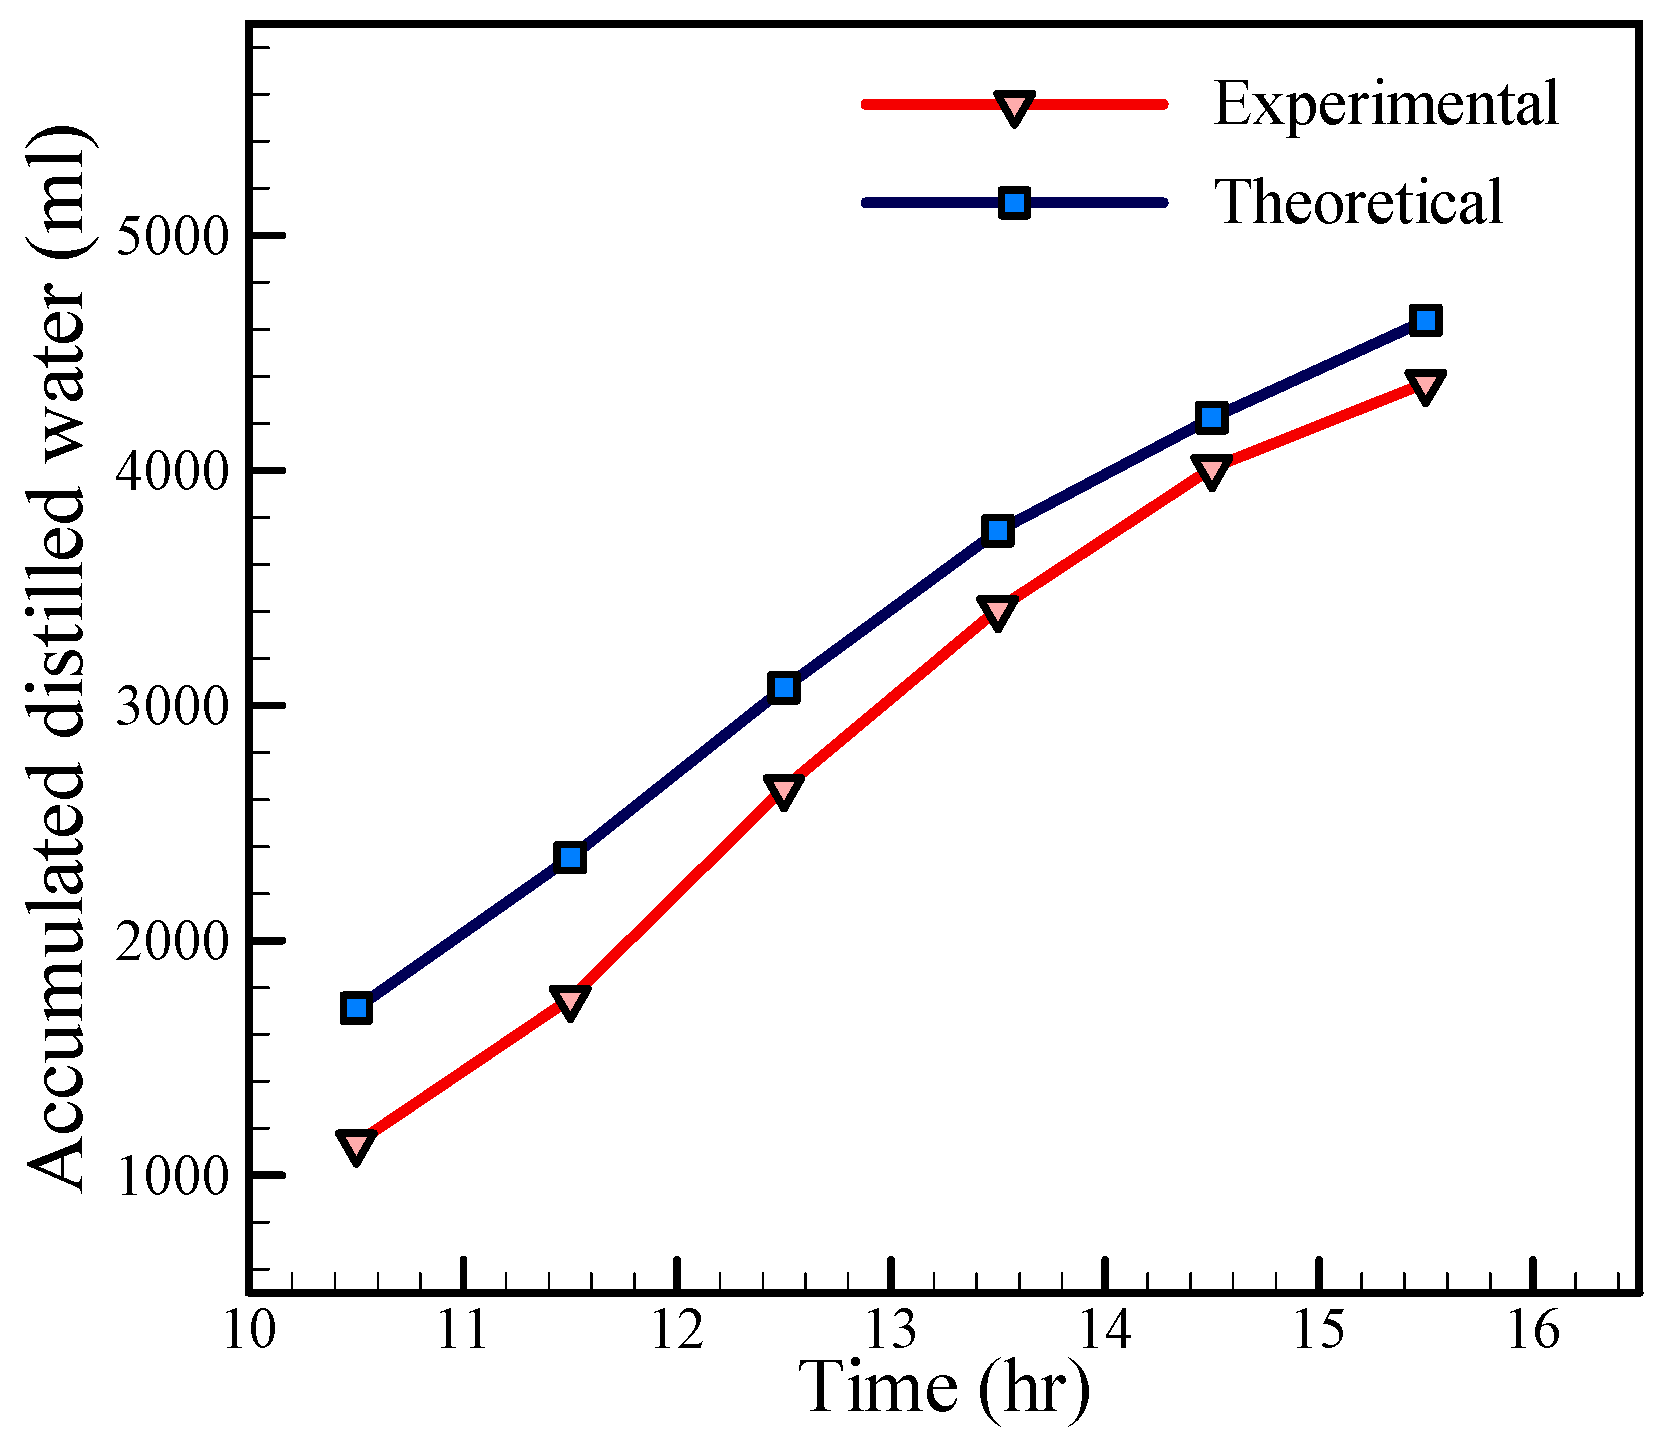
The hourly variation of the accumulated distilled water, calculated theoretically and measured experimentally, is presented in
Figure 13. It can be concluded that the accumulated distilled water is 4600 mL/day and 4300 mL/day for theoretical and experimental investigations, respectively. The difference between the theoretical and experimental results is due to various factors such as leakage from the still, water dripping from the glass, neglect of the thermal storage, and so on. Moreover, by referring to
Figure 13, it is found that the production of distilled water increases at noon. Also, by inspecting the temperatures of the inside air and interface in
Figure 12, and comparing them with
Figure 13, it can be seen that when the temperature difference between the inside air and interface increases, the production rate of distilled water increases, which is in good agreement with Equations (21) and (22). Moreover, there is a significant difference between the production of distilled water in experimental and analytical approach in the early hours. However, over time the differences would gradually decrease. From
Figure 12a,b, it can be observed that the temperature difference between the glass cover and water surface is higher in the analytical results than the experimental results; i.e.,:
On the other hand, the increase in difference temperature promotes the production of distilled water. Hence the higher analytical temperature difference in comparison with the experimental temperature difference leads to greater water production in the analytical approach than in the experimental approach. However, the difference between the production of distilled water in experimental and analytical approach is decreased over time according to
Figure 13.
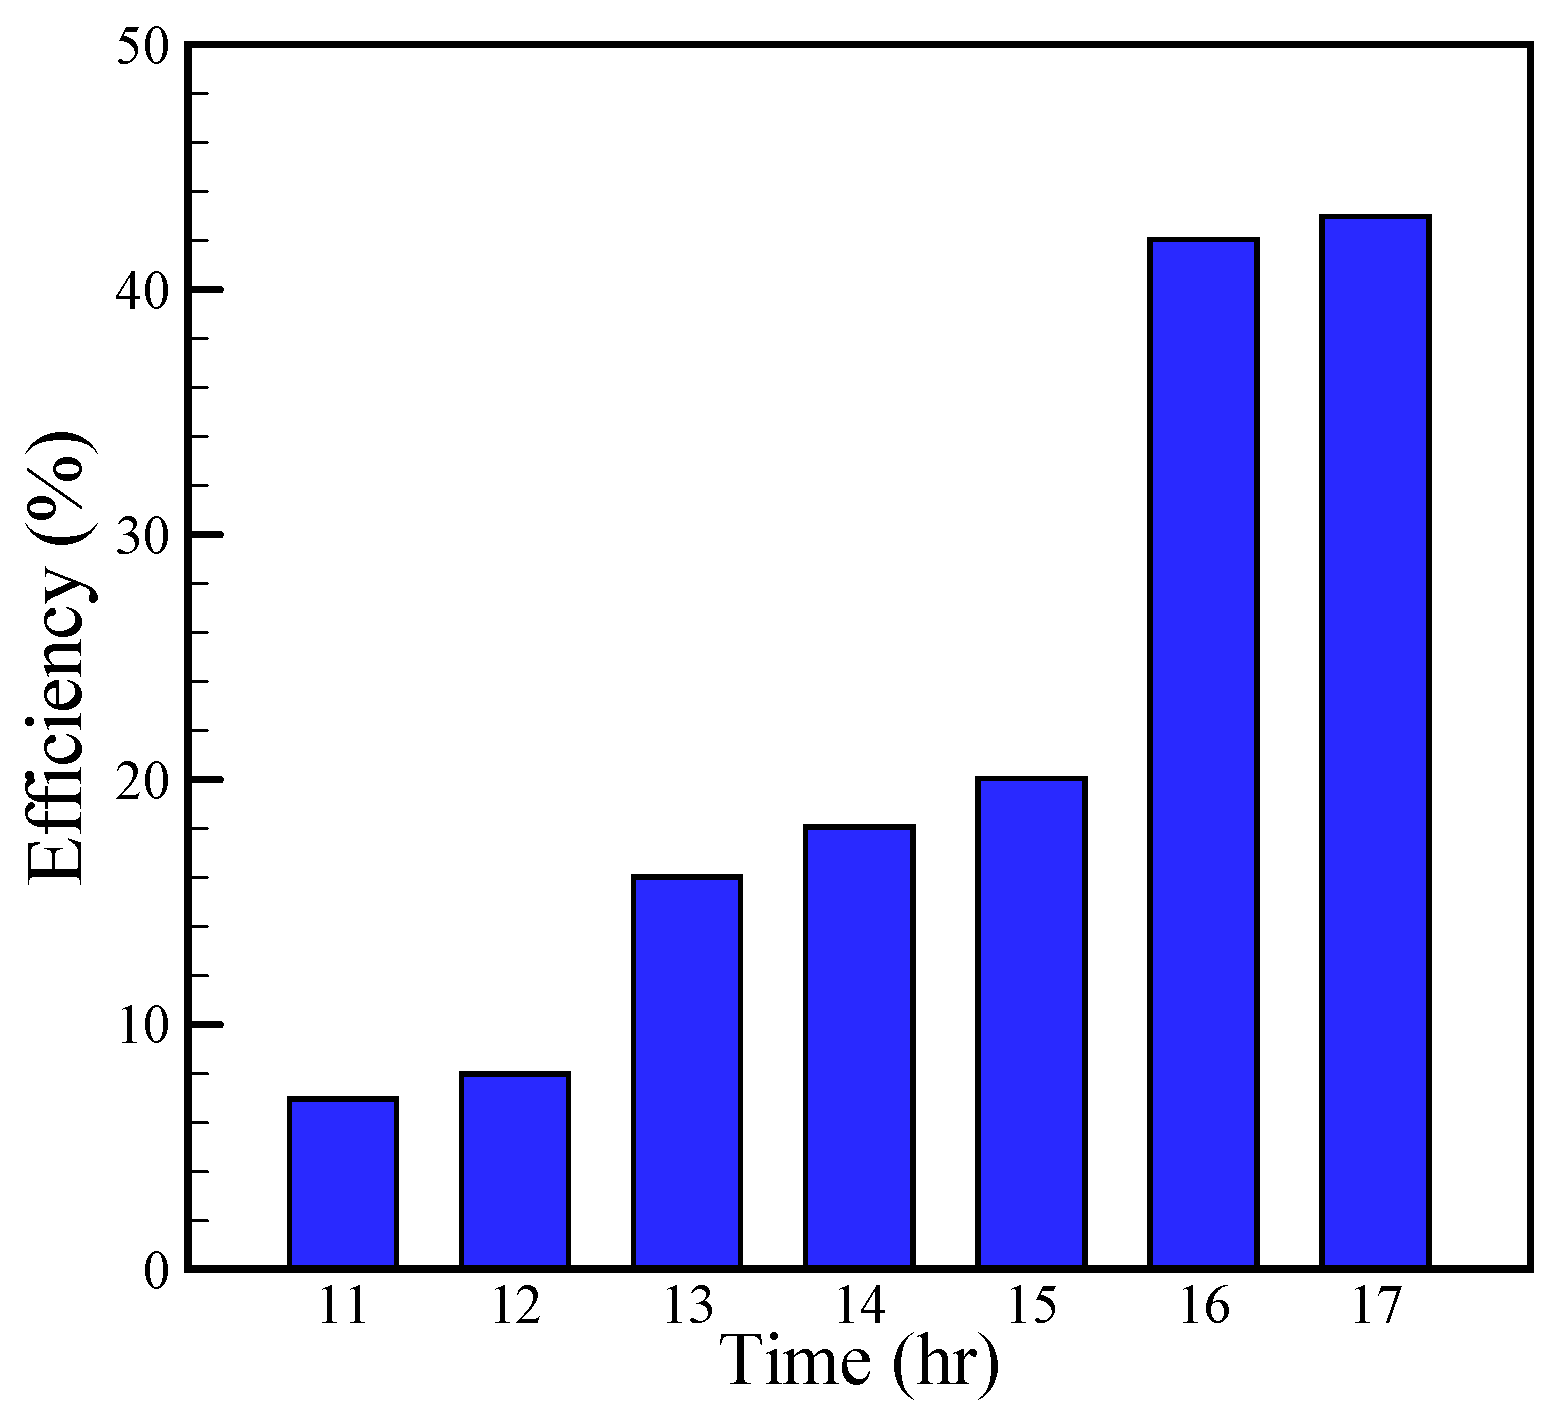
The experimental hourly efficiency of the solar still for August 5 is calculated with Equation (23) and is shown in
Figure 14. This figure demonstrates that the efficiency of the solar still enhances by 44% in the afternoon. The heat capacity of the water in the basin acts like a capacitor. In the early hours, some part of input energy is used to fill the capacitor and remaining part provides the required vaporization enthalpy. Hence, the less part of input radiation is used for water evaporation in the early hours. Consequently, efficiency is low in the early hours according to
Figure 14. Over time, the capacitor would be filled and more parts of input energy radiation would be used for water evaporation, which implies higher efficiency. Although in the final hours, the efficiency is high due the following reasons:
- (1)
The input radiation rate has decreased and denominator of Equation (23) has also decreased which would lead to greater efficiency.
- (2)
The filled capacitor is unchanging and some part of required vaporization enthalpy would be gained from the capacitor which means a greater efficiency value.


