1. Introduction
Atomization is widely seen in everyday life as well as in industry sectors, e.g., sprays combustion in gas turbines, crop spraying, spray drying and many other applications [
1]. In order to design and improve product performance, it is necessary and important to have a better understanding of the fundamentals of droplet deformation during the atomization process. There are numerous spray atomizers that have been developed, including twin-fluid atomizers, swirl atomizers, hydraulic atomizers and rotary atomizers [
2], which are known as traditional atomizers because the process of atomization conducted by these atomizers is mainly caused by relative motion between the liquid and gas phase. It is also noteworthy that, as the first step of liquid fuel combustion, atomization plays an important and fundamental role in propulsion engineering. For example, with increased atomization performance, the diameter of fuel droplets will decrease and they will be well distributed, which in return will enhance heat transfer between fuel droplet and flow. Finally, better understanding of atomization may help in reducing fuel consumption and CO
2/NO
2 emissions, which may help combat global warming.
Recent developments have shown that the process of atomization can be affected by the introduction of acoustics. Sujith et al. [
3,
4,
5,
6,
7] conducted several theoretical and experimental investigations into the effects of acoustics on spray, and their results showed that, because of the relative motion between the droplets and the air phase, the presence of an acoustic field could enhance heat and mass transfers to and from the droplets. Danilov et al. [
8] published a theoretical study of the breakup process of a droplet in a high-intensity acoustic field, where it was demonstrated that small-scale instabilities on the surface of the droplet were responsible for the formation of micron-size fractions of atomized liquid, while parametric instabilities caused the breakup of the droplet. Karlsen et al. [
9] conducted a theoretical analysis of acoustic radiation force on a single small spherical particle in the field of a viscous and heat-conducting fluid medium; they reported that there was a sign change in the acoustic radiation force on different-sized particles, and forces’ orders of magnitude were larger than predicted by ideal-fluid theory. Murray et al. [
10] simulated the unsteady, nonlinear response of a liquid droplet to an imposed acoustic perturbation, and found that several types of droplet atomization could be observed as increasing acoustic intensity.
Dalmoro et al. [
11] explained that the introduction of acoustic (sonic and ultrasonic) energy into a fuel-injection system improved the atomization and subsequent combustion of liquid fuel spray. Applications of ultrasonic atomization have a wide range, from ordinary liquids to molten metals; the throughputs could be from fractional gallons per hour to more than 100 imperial gallons per hour, and the droplet size varied from just above 1 μm to 180 μm with a narrow size spectrum [
12,
13]. For fuel spray applications, aerodynamic acoustic generators are preferred over other types since the air required for combustion is also used for the generation of sound.
Hartmann [
14] first demonstrated the possibility of obtaining high acoustic efficiencies when a jet was aimed at the open end of a tube; this device could be capable of producing tones over a wide range of frequencies (i.e., around 100 Hz–25 kHz) with very high amplitudes (i.e., 150+ dB). This device is now known as the Hartmann Resonance Tube (HRT). For its advantages in terms of operational case, controllability, and design simplicity, the HRT has attracted numerous studies. Some researchers have examined its working principles, and others have developed geometric variants and explored industrial applications. Recently, Narayanan et al. [
15,
16,
17,
18] conducted several experimental studies to find out the effects of geometric variables on the features of the acoustic field. Detailed schlieren figures of the flow field near the mouth of the resonator and descriptions of its acoustic characteristics were provided by their study. They pointed out that the intensive unsteady reciprocating motion of the air in the resonator was mainly responsible for the generation of high acoustic frequency. Numerical simulations of unsteady flow in a HRT were carried out by Hamed et al. [
19], whose results showed that there were three working modes for the HRT and these different operating modes highly depend on the jet Mach number. Michael et al. [
20] compared the flow characteristics of a HRT, with and without shielding, with the SA one-equation turbulence model, and they reported that the presence of a shield caused intense flow/shock oscillation around the cavity mouth. Raman et al. [
21] concluded that properly designed HRT had significant advantages over conventional actuators, such as acoustic, piezo, and oscillatory microstructures, and could be widely used in an active-flow-control field.
There are many applications based on the HRT for combustion and propulsion engineering. References [
22] and [
23] developed new resonance ignition systems based on the HRT and used it for multiple ignitions without additional mechanical complexities. Ma [
24] successfully implemented stable and high efficiency oil combustion in an industrial furnace with an ultrasonic atomizer based on a HRT. Li et al. [
25] and Zhang et al. [
26] illustrated that an ultrasonic atomizer based on the HRT can even have the ability to achieve a high quality atomization for high viscosity heavy oil.
While literature reviews demonstrate avid interest in understanding the various mechanisms of HRT, the primary focus of published work is to establish the relationship between geometric variables and the features of acoustic field, and there is little investigation of the behavior of droplets and spray in the acoustic field induced by a HRT, an understanding of which is important for the design and optimization of ultrasonic air-blasted atomizers based on HRT.
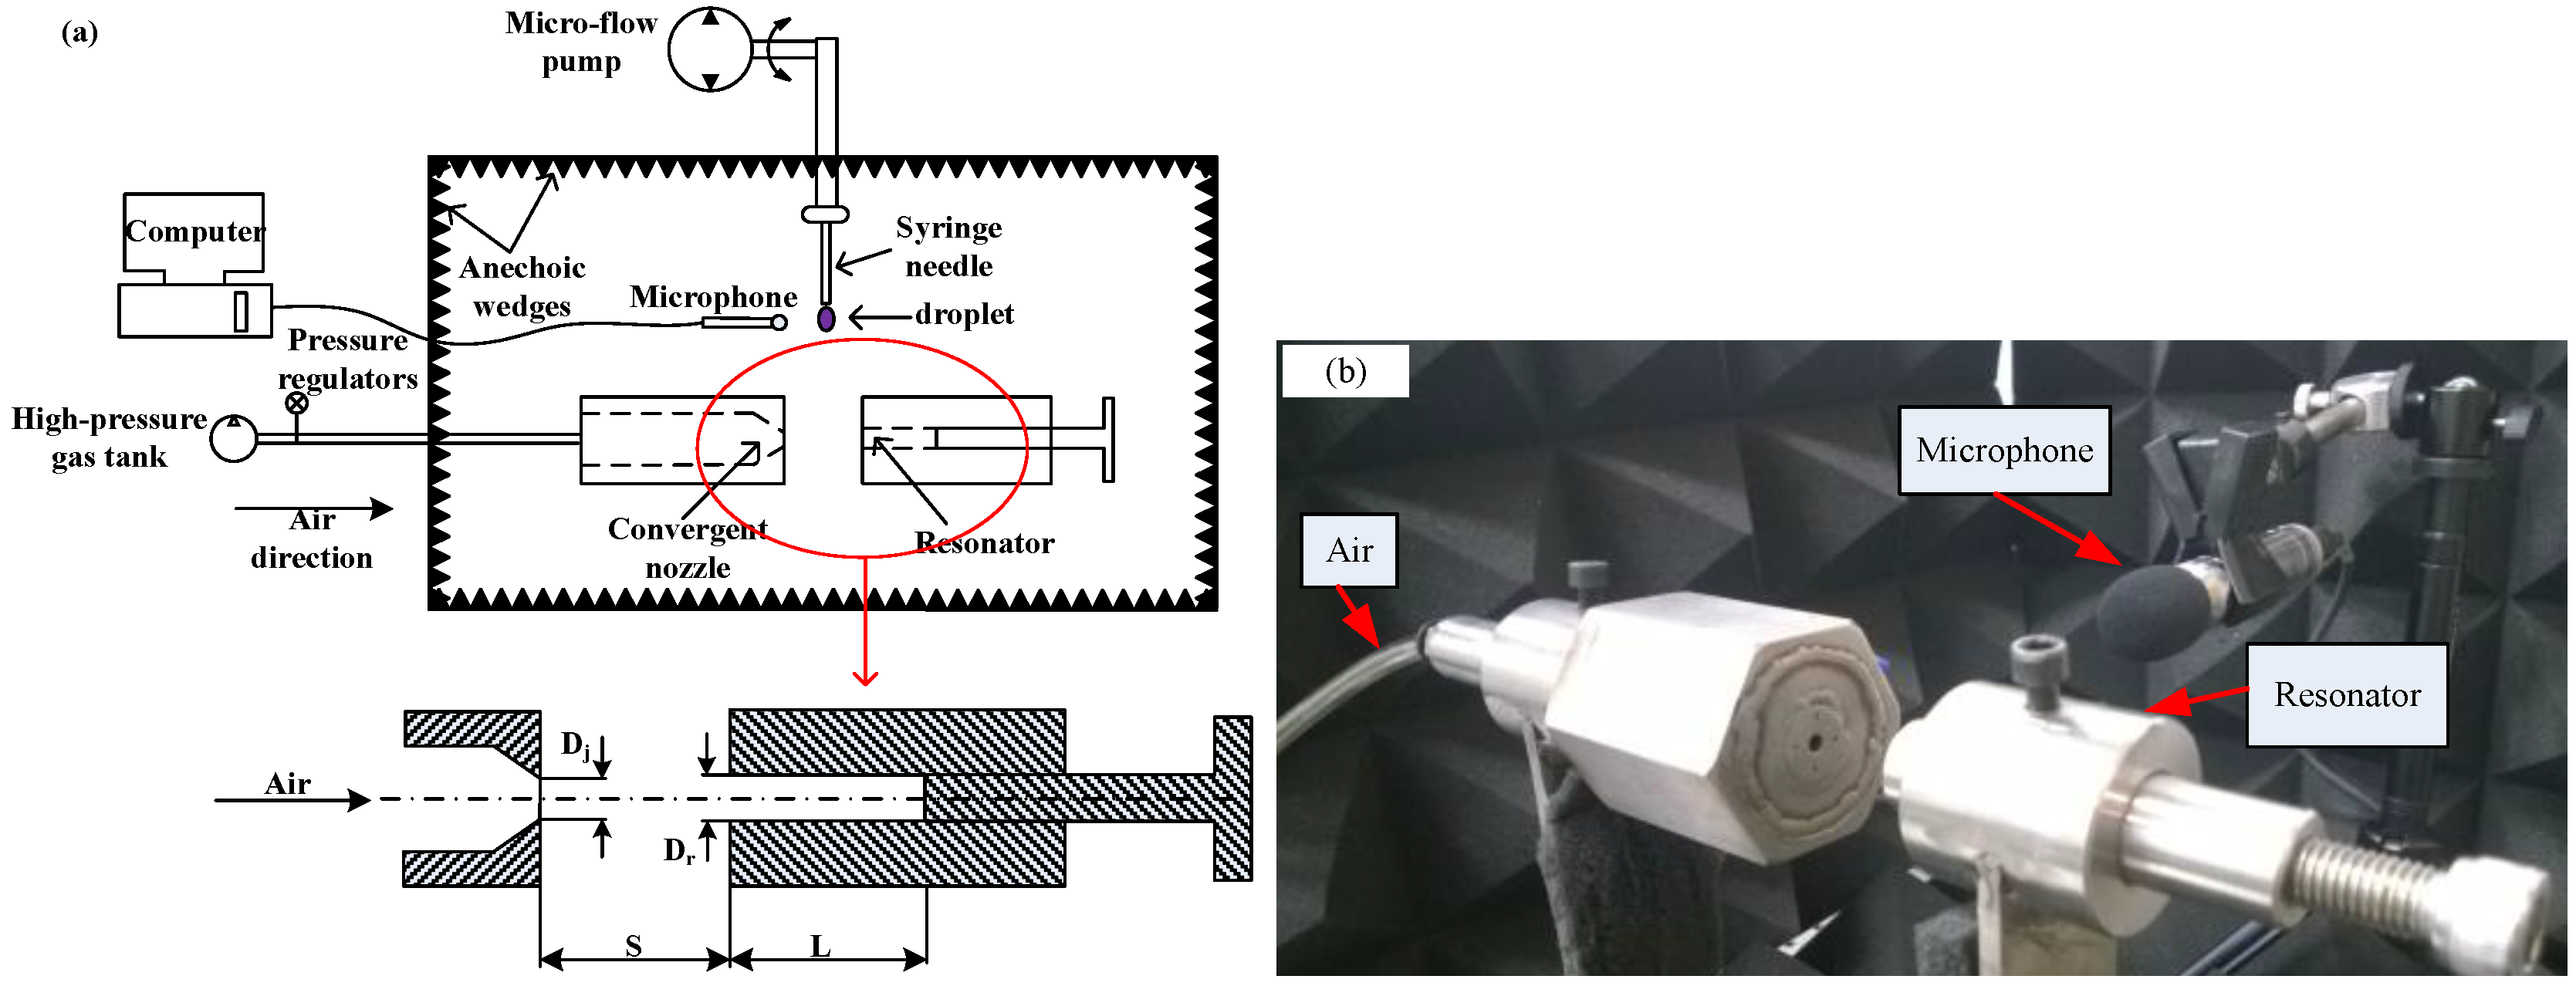
The present study seeks to clarify the influence of the acoustic field on the deformation process of the droplet with experiments and theoretical analysis. Experiments were performed with water droplets injected into a test section in which acoustic oscillations induced by a HRT could be excited. A high-speed camera was used to get detailed deformation pictures of the droplets in the test field, and the changes in droplet diameters in time were used to determine their oscillation levels. A theoretical model was also developed based on the vibration equation of the droplet, where the frequency and sound pressure level (SPL) of the acoustic field obtained by a microphone provided initial acoustic conditions for the theoretical model, and the experimental results were compared with the predictions based on the theoretical analysis.
3. Theoretical Model Description and Validation
In this section, a theoretical differential vibration model for a droplet in the acoustic field induced by HRT will be developed and discussed. The initial droplet shape is treated as a perfect sphere, as shown in
Figure 2, in which the initial droplet radius is
r and the deformation size along
x direction is
r(
t). It is assumed that the deformation size in
y and
z directions is
kr(
t) as shown in
Figure 2.
By taking the force caused by surface tension
Ft and the force caused by viscosity
Fμ into consideration, Shi et al. [
27] developed an oscillation model to establish the effects of surface tension and viscosity on the spreading process of the droplet, expressed as:
if we add the force caused by the acoustic field, namely
Fs, into Equation (1) to analyze the effect of the acoustic field on the droplet oscillation, Equation (1) can be rewritten as:
where
,
,
,
,
is the surface tension coefficient of the droplet,
is the coefficient of viscosity,
is the density of water, and
and
represent the amplitude and frequency (obtained with a microphone in experiments) of the acoustic field respectively. Then, Equation (2) can be further written as:
Let
,
and
, and Equation (3) can be rewritten as:
Equation (4) is a standard second order, linear, and inhomogeneous differential vibration equation, and the solution of
R can be obtained mathematically as:
where the first part
reduces to zero with the increase of time. Thus the final stable solution of
R is:
After rearranging, we get the deformation value,
r(
t), as:
with:
For different modes of oscillation, according to Equation (4), the oscillation equation at
n resonance mode is:
where
and
denotes the deformation distance in
x direction at
n resonance mode. The
n mode natural frequency of the droplet can be calculated using the Rayleigh equation [
28] as:
As with Equation (6), we can obtain the solution for
as:
where:
Let
, and we can get a critical driving frequency for the
n mode natural frequency of the droplet as:
When
, the amplitude of the droplet oscillation reaches its maximum value of:
Figure 3 compares the droplet outline at different resonance modes obtained by the high speed camera [
29] and theoretical model developed in this study (the initial radial
r = 1 mm). It can be seen that the theoretical model can successfully predict the oscillation outline of the droplet at different resonance modes. It is also worth noting that different oscillation modes appear at the same time when the droplet is excited by an acoustic field; however, the deformation level decreases with the increase of the mode, which means the lower oscillation modes play the primary role in the deformation process of the droplet.
The Legendre polynomials [
30]:
are introduced to analyze the shape of oscillation with all different modes together. In this method [
29], the shape of a droplet is represented by a linear combination of an infinite number of shape modes. Then the instantaneous deformation distance
at a different corresponding circumferential angle can be expressed as:
Hence, the instantaneous deformation distance at each circumferential angle is:
By setting the coordinate origin at the center of the droplet, the shape of a droplet can be expressed as a linear combination of Legendre polynomials as:
The ratio of the maximum deformation distance
during one oscillation cycle and the initial radial
r is defined to quantify the shape deformation level of the droplet, namely,
At the same time,
denotes the pressure of the sound, and
SPL is defined as:
where
presents the reference pressure and
=
, SPL can be obtained with the microphone in experiments. Using Equations (20) and (21) we can finally obtain:
In the following chapters, the effect of systematic variables of the HRT on the characteristics of acoustic field and droplet oscillation will be discussed.
4. Effects of Systematic Variables on Behavior of Droplet
In this experiment, the cavity length L increases from 5 mm to 35 mm at steps of 5 mm. The corresponding spectrograms for different cases will be shown. For air-blast ultrasonic atomization, NPR is one of the main aerodynamic working variables that should be determined; therefore, the influence of NPR on acoustic characteristics and droplet behavior is also investigated. Considering that different droplet sizes will behave differently in the same acoustic field, a total of five different droplet diameters are generated and tested. Note that in order to eliminate the influence of hydrodynamics on droplet deformation, the visualization of the droplet is conducted in a region without air flow.
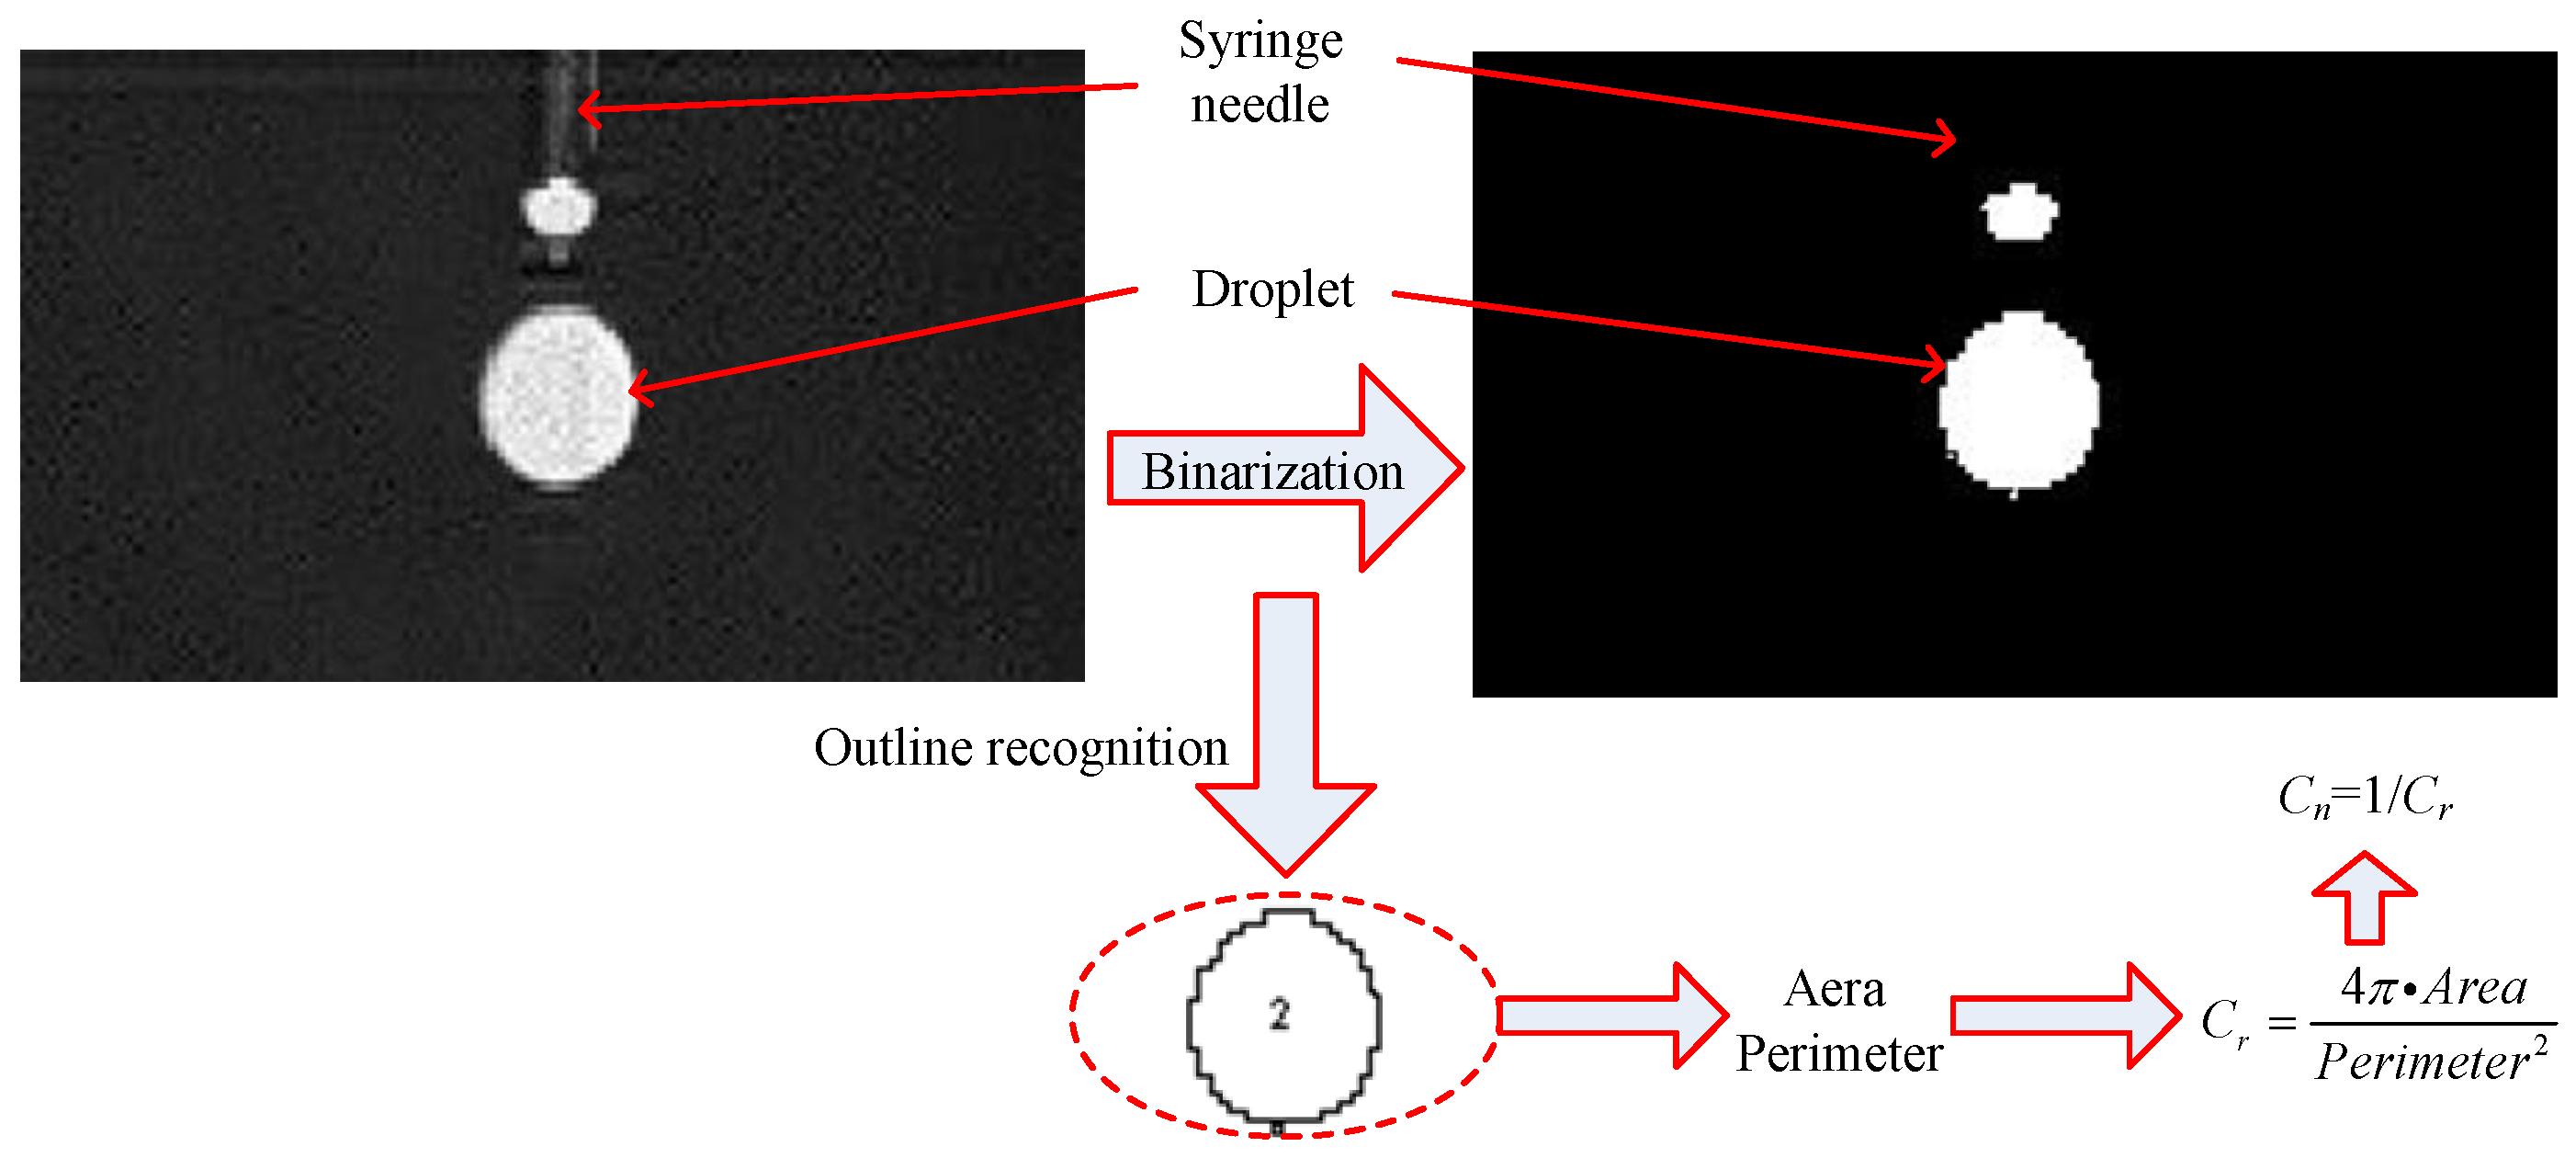
A detailed experimental process schematic is shown in
Figure 4. The raw droplet images are first binarized, then the outline of the droplets is drawn using an open source Java image processing program, ImageJ [
31]. The non-dimensional parameter circularity (
Cr) is defined as:
where
Area and
Perimeter are the area and the perimeter of the droplets, respectively, and obtained from experimental images.
Cr ranges from 0 to 1; for a perfect circle,
Cr = 1. A
Cr value of less than 1 indicates that the shape of the droplet is more irregular, which represents a stronger deformation of the droplet. To have a better visualization, the reciprocal form of
Cr is used and can be expressed as
Cn is always greater than 1 and it is in positive correlation with the level of deformation. In the following sections, Cn will be used to quantify the degree of deformation instead of Cr.
4.1. Effect of Cavity Length
Raman et al. [
13] pointed out that the frequency of HRT can be adjusted to meet the desired value by changing the length of the resonator. In fact, as for HRT, the frequency of the acoustic field can be calculated based on a formula [
14] such as:
where
ft is the theory frequency of the acoustic field,
c is the speed of sound and
L represents the length of the resonator as shown in
Figure 1a.
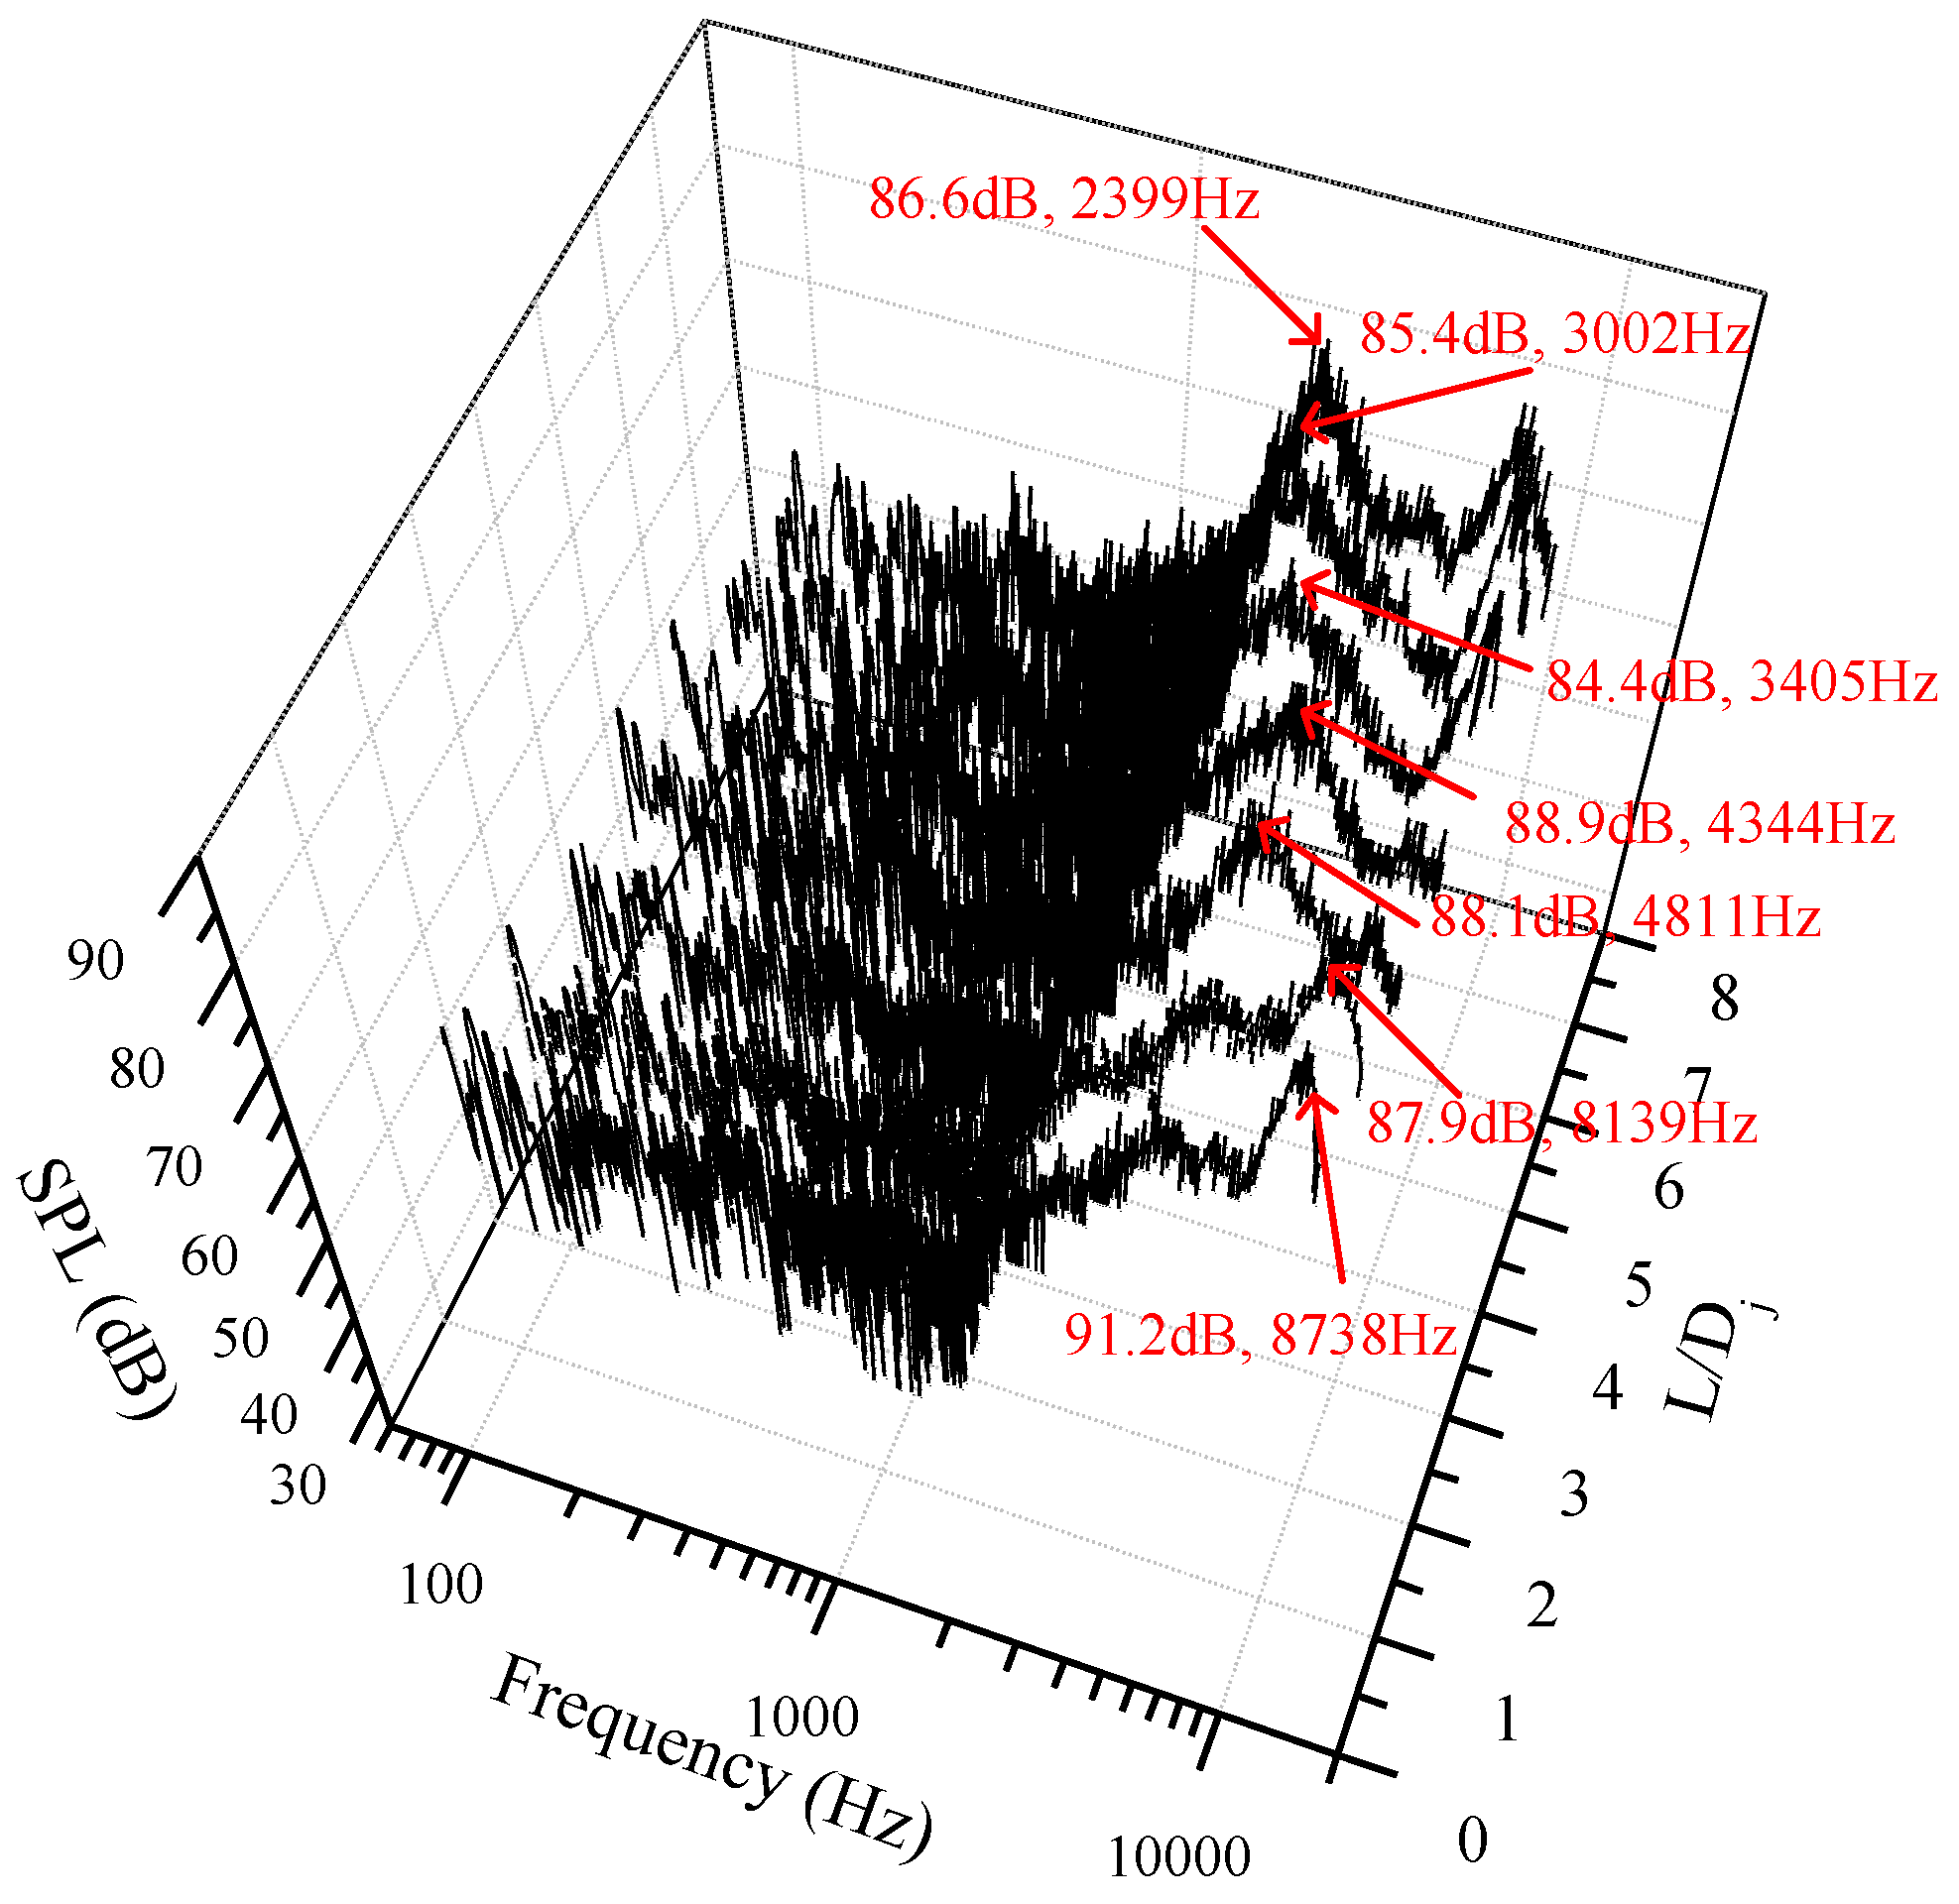
The effect of the change in cavity length
L on the deformation of droplet is investigated first. The acoustic spectrograms of HRT at NPR = 6 (the diameter of the syringe needle is 1.07 mm) for various values of
L/
Dj (1–7) are shown in
Figure 5. The presence of sharp discrete tones at its fundamental harmonic can be clearly identified, and the fundamental frequency and corresponding SPL are summarized in
Table 1. We found that the acoustic frequency of the droplets decreases with the increase of
L, and this observation agrees well with the prediction shown in Equation (24) when
L/
Dj is larger than 2. However, when
L/
Dj = 1, the frequency predicted by Equation (24) is much larger than experimental results, as shown in
Figure 6. It is also interesting to note that SPL decreases slightly with the increase of
L, which has rarely been reported in the published literature.
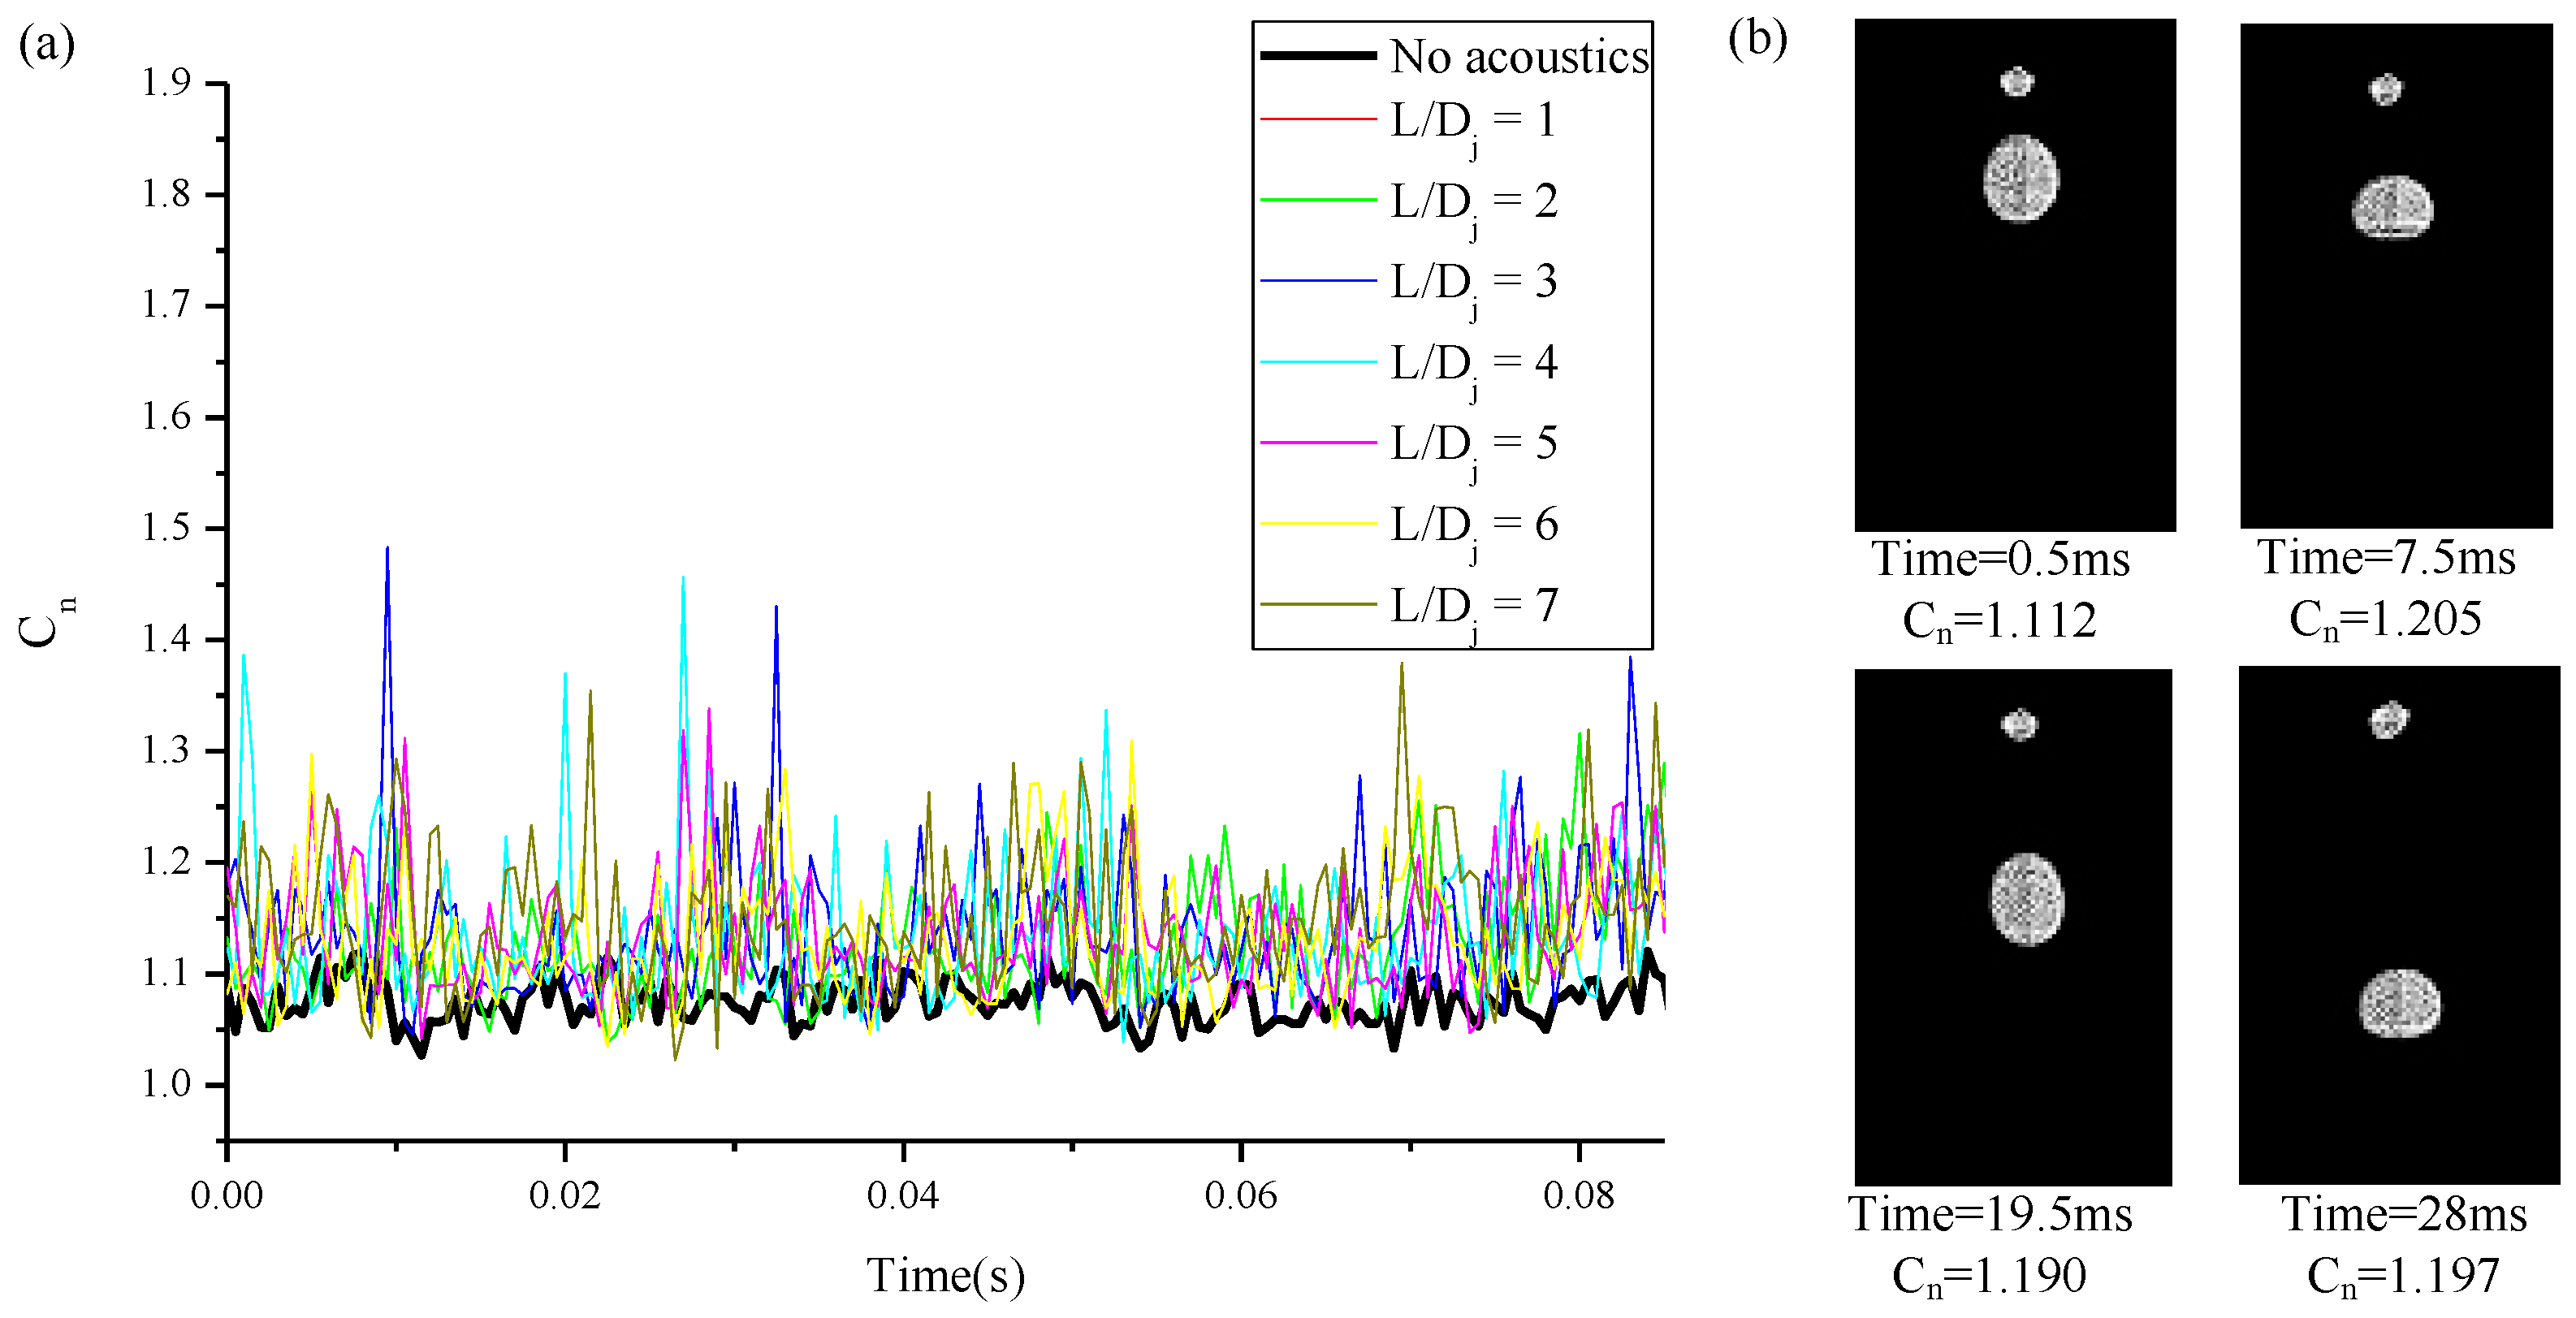
Comparisons between
Cn distributions for the droplet with and without acoustic field at different cavity lengths
L are shown in
Figure 7a. Nearby periodic oscillations can be seen in the cases with and without acoustic fields. It is also observed that the values for
Cn are much smaller for the cases without an acoustic field, compared with those cases with the acoustic field, which means the presence of the acoustic field can greatly enhance the deformation of the droplet.
Figure 7b gives an example of the oscillation shape of a droplet for case
L/Dj = 1 at different times. We can see that the oscillation reaches its maximum at times 0.5 ms (
Cn = 1.112), 7.5 ms (
Cn = 1.205), 19.5 ms (
Cn = 1.190) and 28 ms (
Cn = 1.197), during the first two fluctuation cycles.
Note that
Cn can reach its maximum two times during every cycle. In order to have a better understanding of the relationship between resonator length and circularity, the maximum
of every cycle during the whole testing period is added together and averaged, and the resulting value is marked with
. The variation of
with resonator length is shown in
Figure 8a. It can be seen in this figure that
fluctuates with the increase of
, which indicates the effect of the acoustic field causes the droplet to oscillate. The deformation level of the droplet also does not change linearly with the resonator length, and the oscillation level for cases
L/
Dj = 1, 3 and 6 are relatively small comparing with their adjacent cases.
The theoretical calculation result of
using Equation (19) is shown in
Figure 8b, and we can see that the variation trend in the deformation level is in good qualitative agreement with that of experiment, shown in
Figure 8a. In a similar manner, fluctuations can be seen for variation of
rd with
L. These findings demonstrate that the deformation level of the droplet does not linearly increase with resonator length, which can also be determined using Equations (11)–(14), which indicate that the radial of the droplet reaches its maximum when the driving frequency
is close to the
n mode resonance
. Hence, the oscillation shape of the droplet only reaches its maximum when the frequency of the droplet is close to
: from this point, the relationship between droplet oscillation and driving frequency is nonlinear. A similar phenomenon is also reported in Reference [
10].
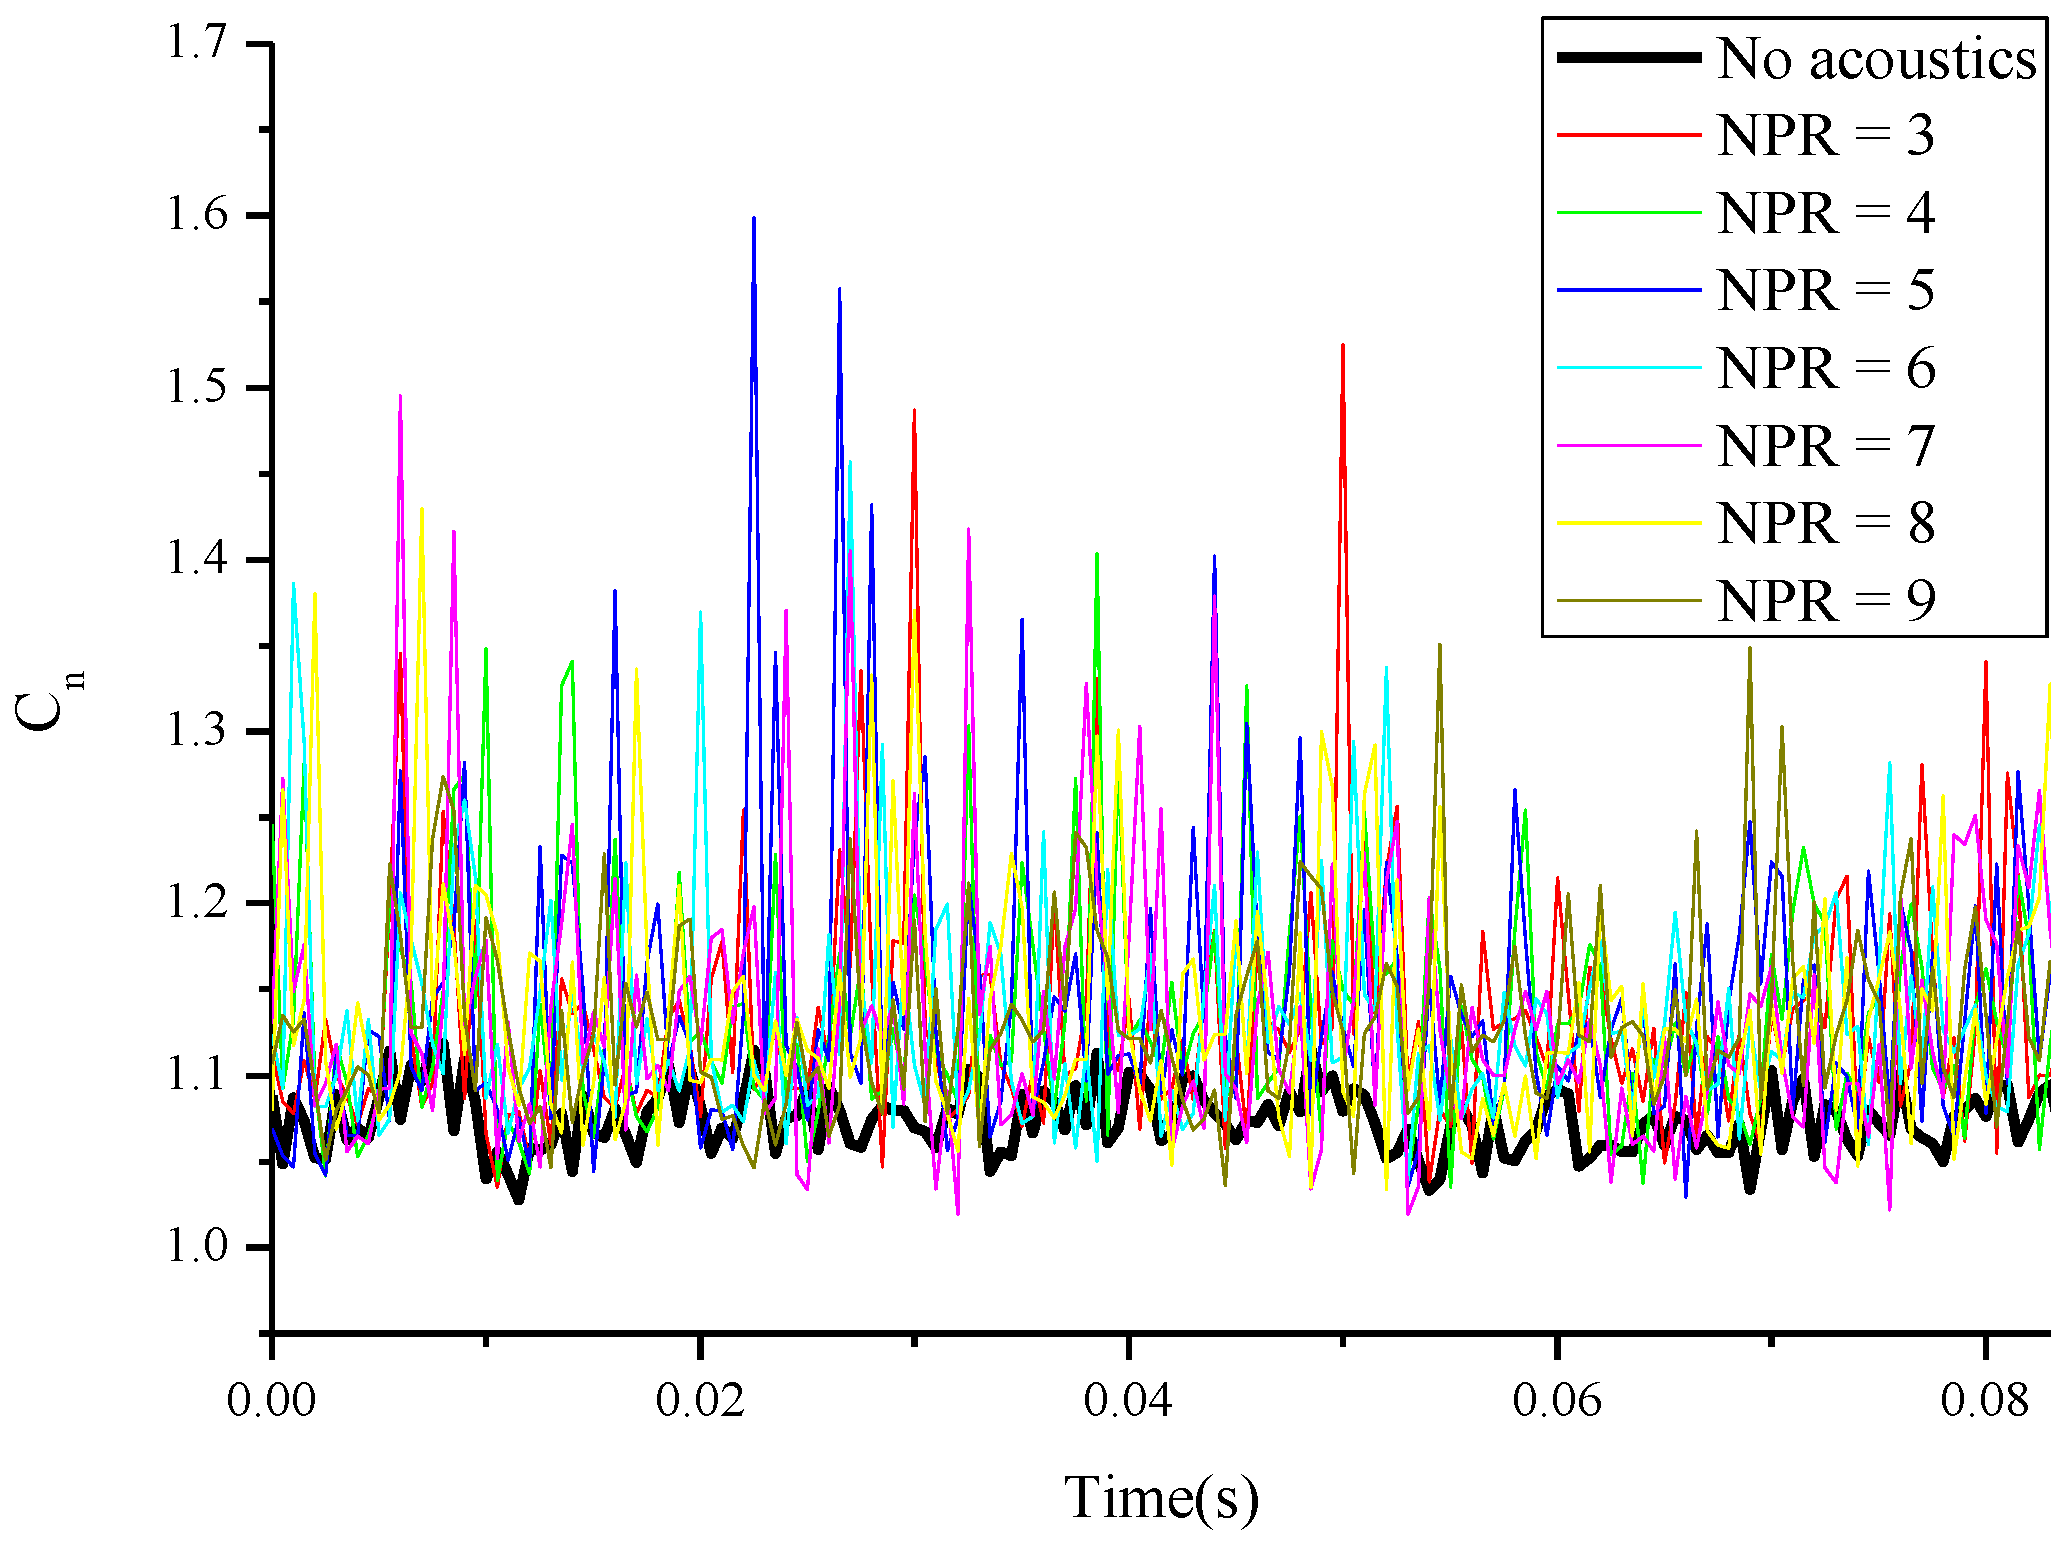
4.2. Effect of Nozzle Pressure Ratio
By keeping the cavity length
L = 4
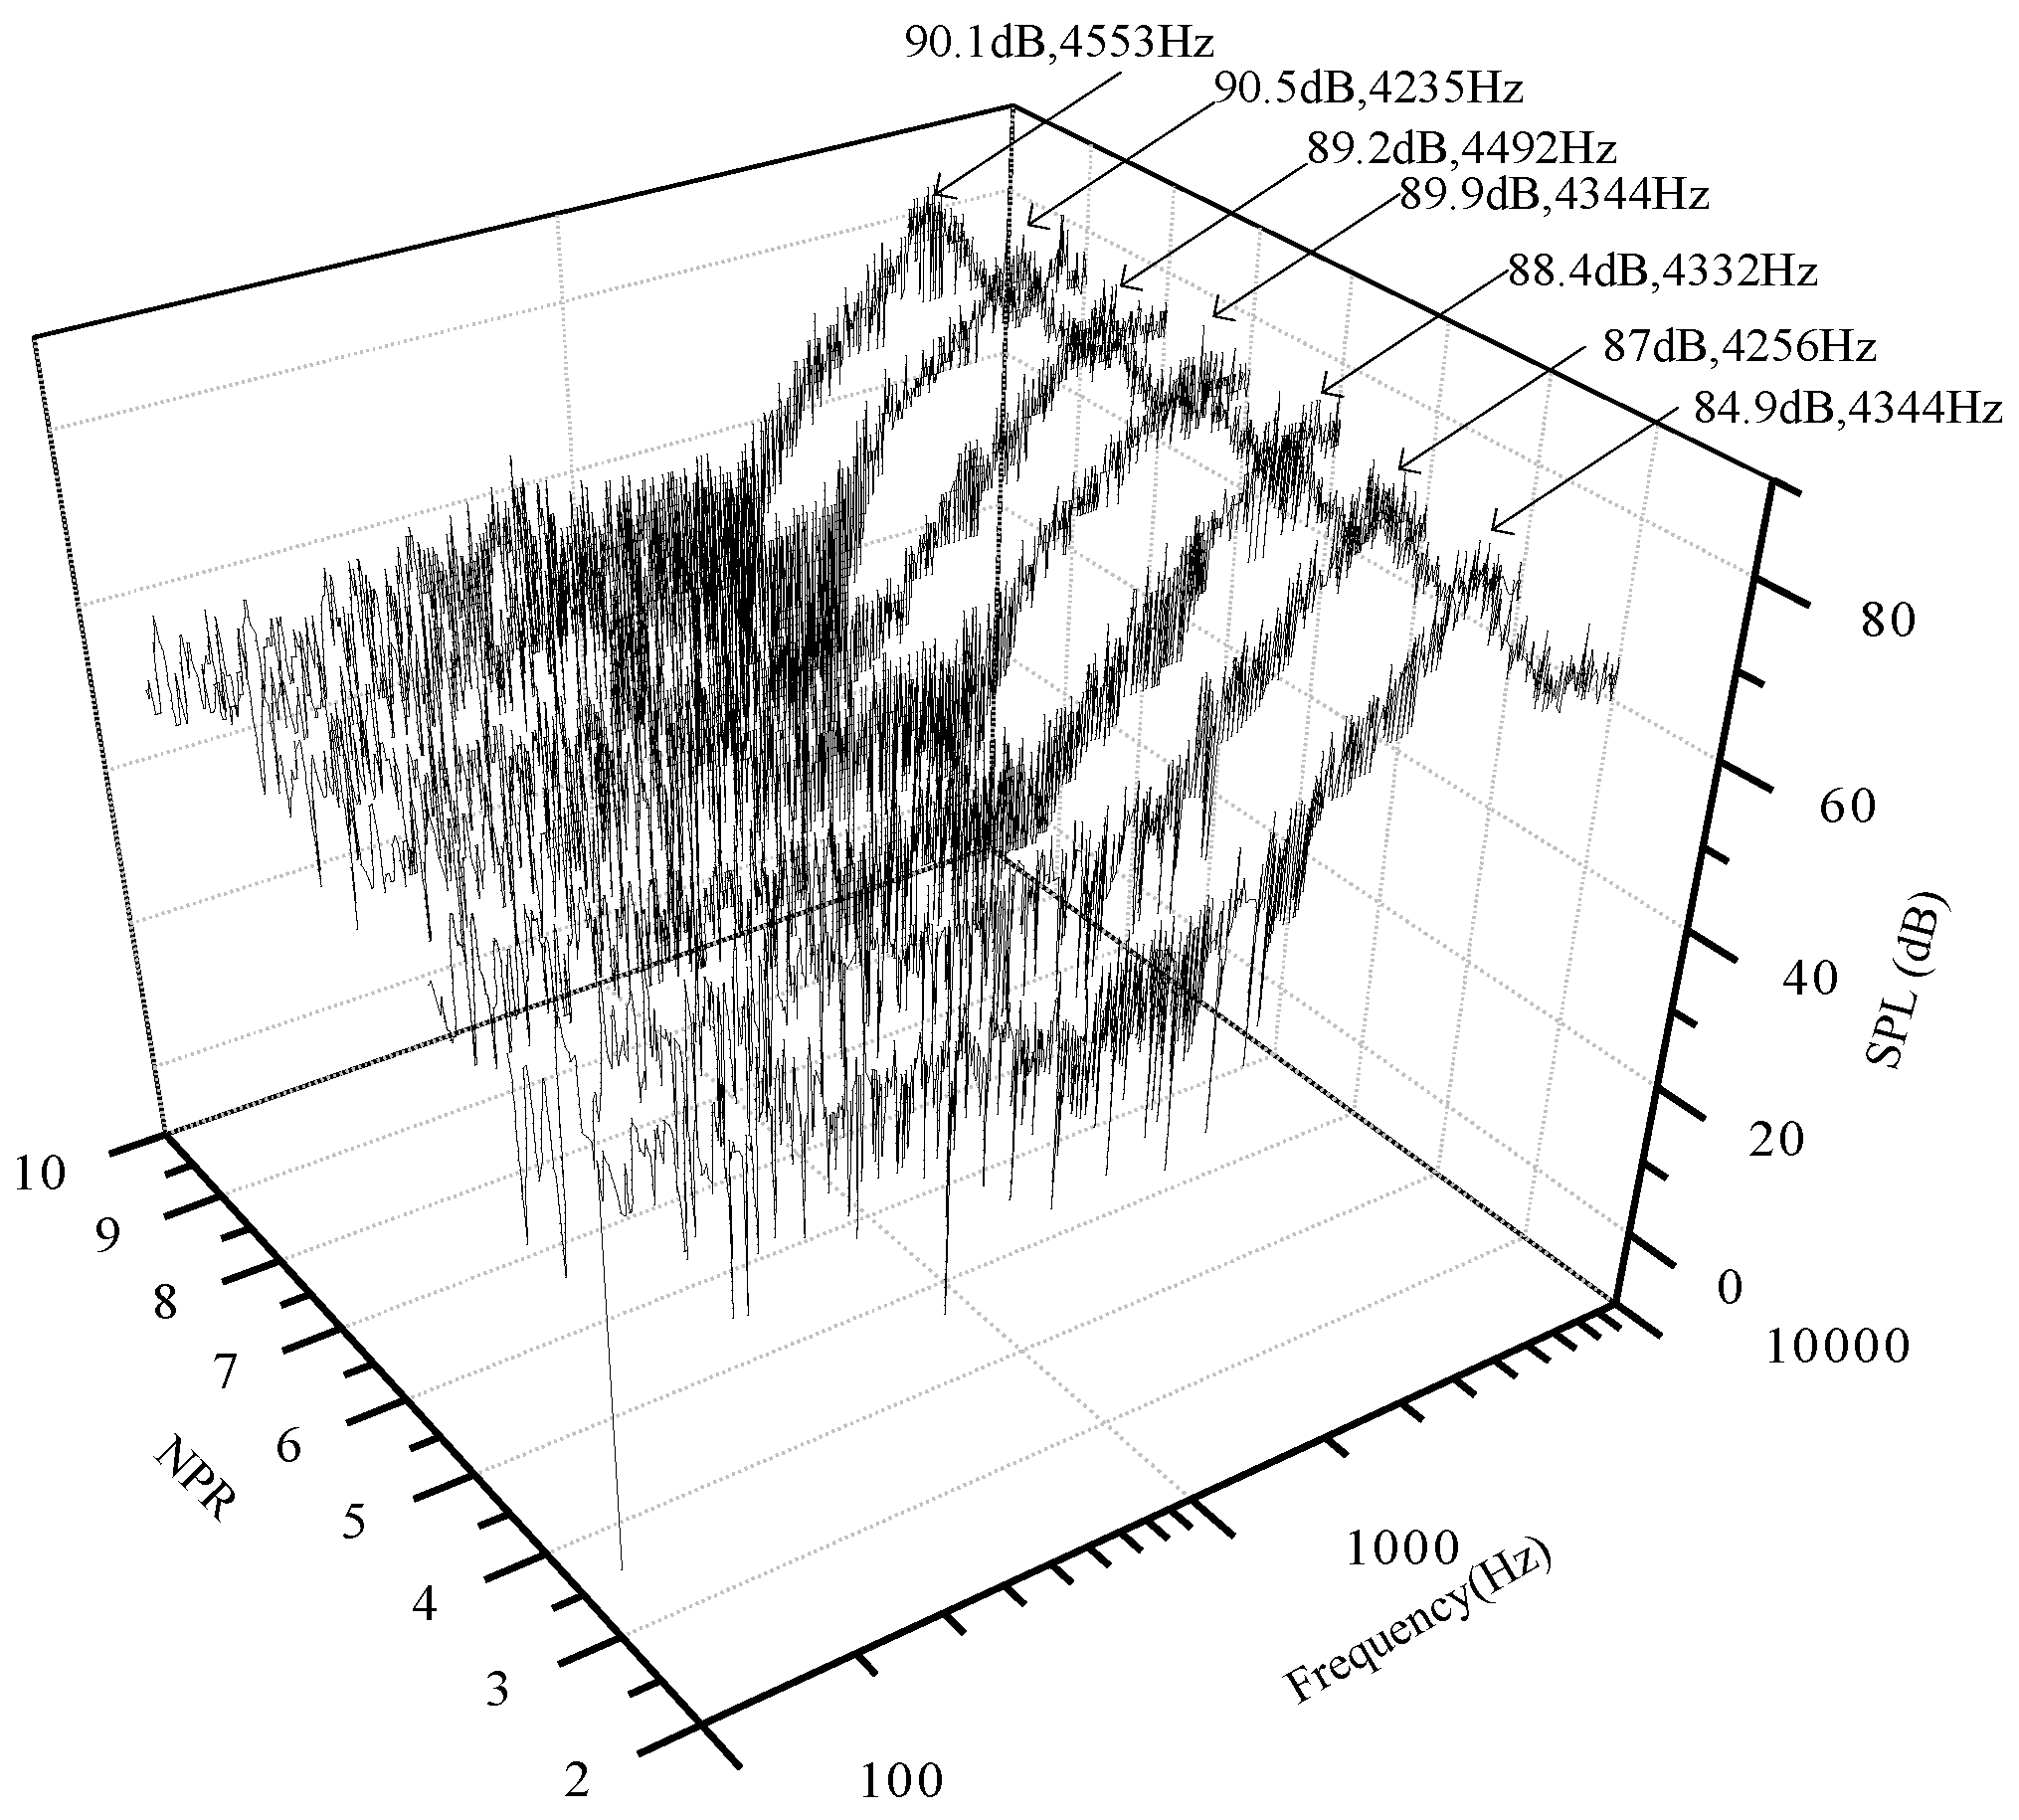
Dj, and the diameter of the syringe needle 1.07 mm constant during the whole experiment, our test demonstrates the behavior of the droplets’ oscillation under different NPR values and the effect of NPR on the characteristics of the acoustic field. The spectrograms of the acoustic field for NPR ranging from 3 to 9 are shown in
Figure 9, and the corresponding frequencies
f and SPL data are summarized in
Table 2. It can be observed that the frequency changes slightly with the increase of NPR, and the SPL increases with the increase of NPR when NPR ranges 3–8; after that a slight drop can be seen. A similar variation trend can also be seen in Narayanan et al. [
15]. The slight modification in frequency may be due to the fact that a shock is developed before the inlet of the resonator for all NPR values; thus the velocity of the air at the inlet of the resonator is similar for different nozzle pressure ratios, as shown in Reference [
19], so the time needed for the unsteady reciprocating motion of the air in the resonator is approximate. Thus the fluctuation frequency of the sound pressure is similar, which leads to the similar frequency of the acoustic field. However, the increase of NPR can enhance the pressure oscillation of the flow field near the mouth of the resonator, which will lead to a higher sound pressure level.
For the seven different NPR values tested, the variations of
Cn with time and with and without acoustics are compared in
Figure 10. Again, smaller
Cn values for cases without acoustics indicate that the shape of the droplet is less deformed; otherwise it is elongated due to the presence of acoustic oscillation.
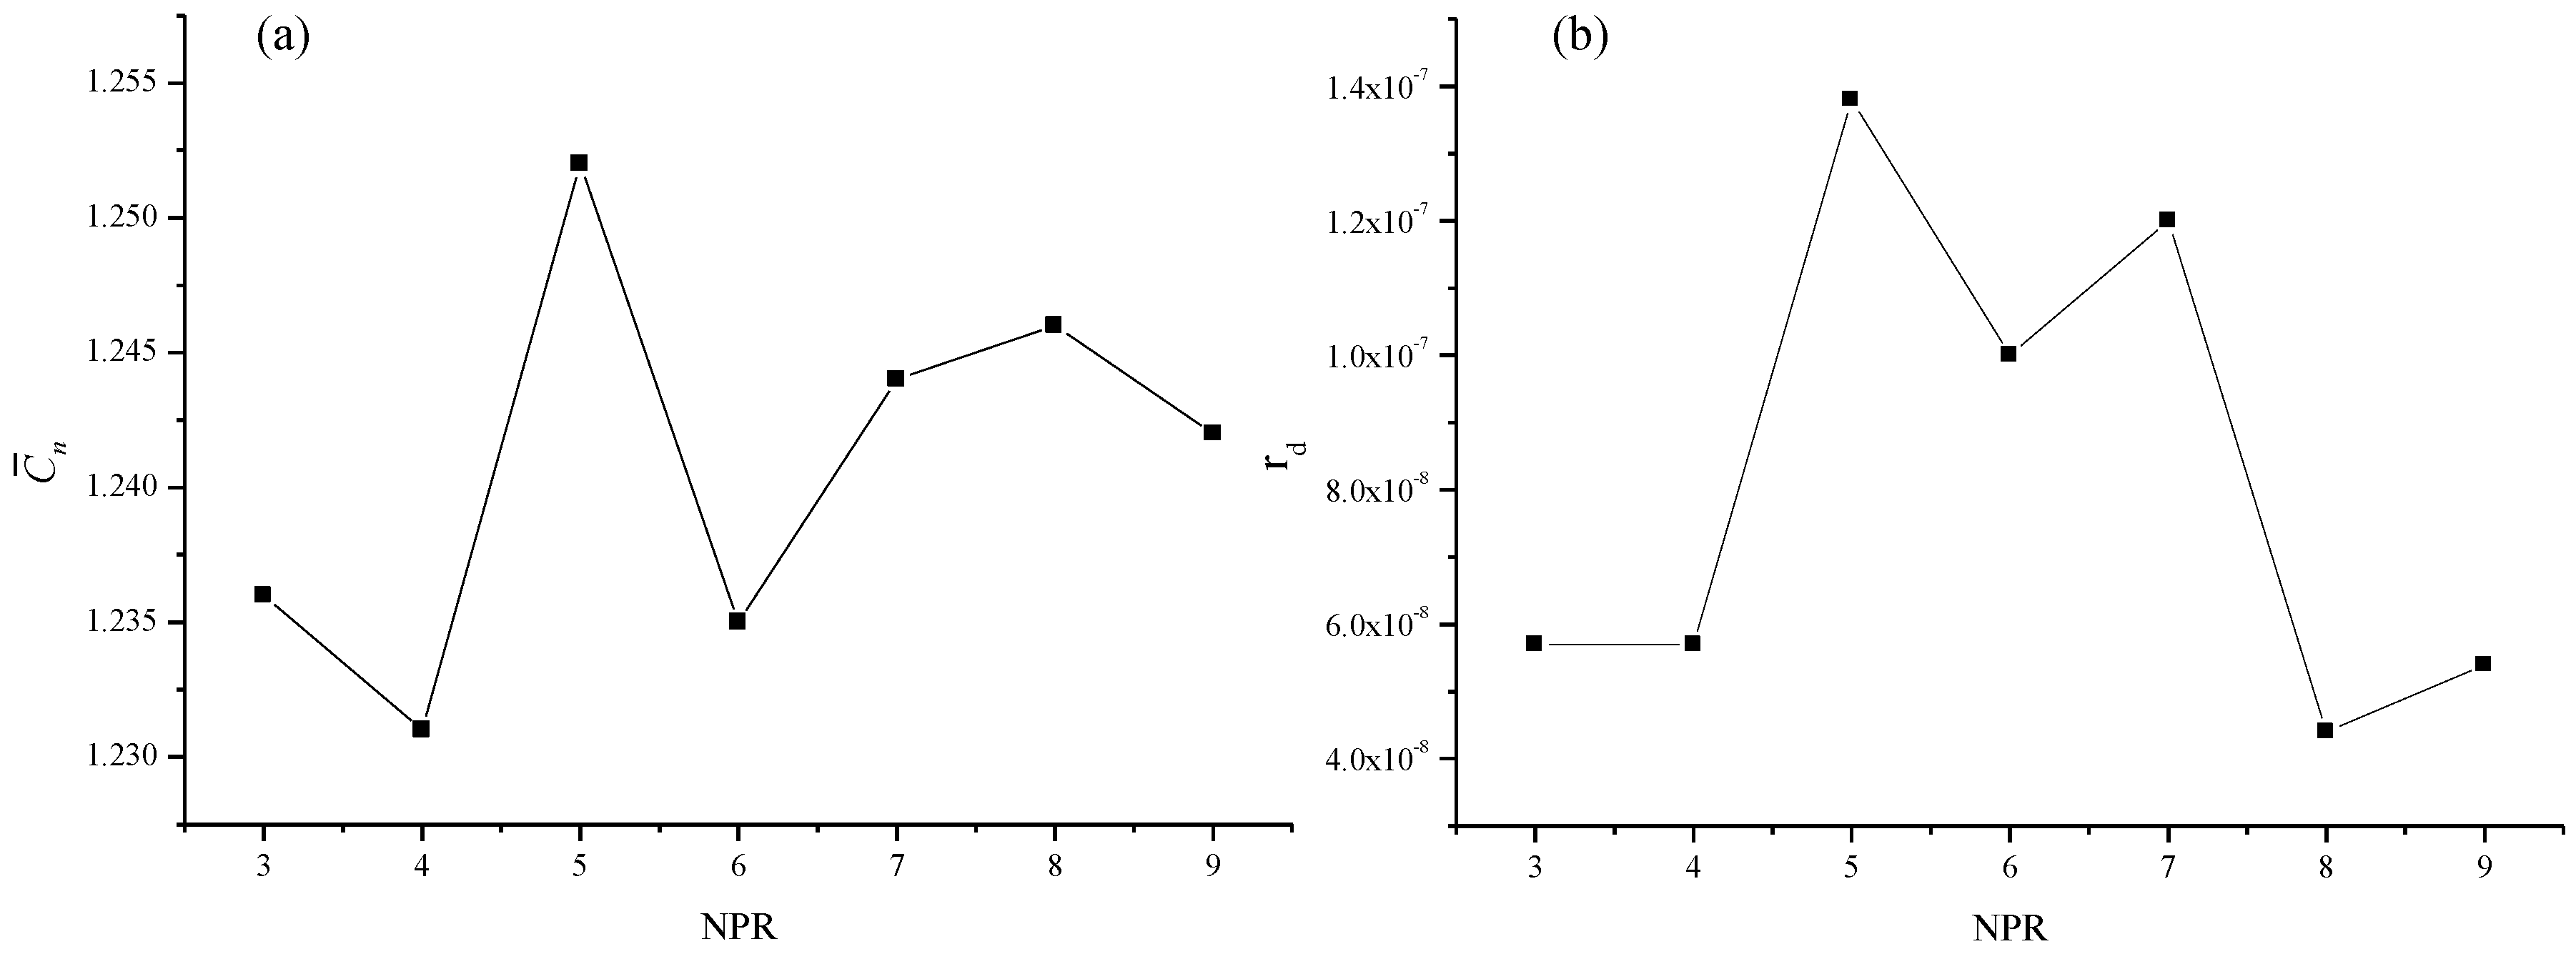
As seen in
Figure 10, the
Cn values of the seven tested different NPR cases also differ from each other. To more clearly illustrate this phenomenon, the variation of
and NPR is shown in
Figure 11a, where it can be seen that
drops slightly when NPR increases from 3 to 4 and reaches its peak when NPR = 5, after which oscillation is observed, which also demonstrates that the increase of NPR cannot cause a linear increase of the shape deformation level. Applying
f and SPL data obtained by experiment to the theoretical model as described in Equations (20) and (21), the resulting variation curve between
rd and NPR is shown in
Figure 11b. Again, its variation trend agrees well with experiment. Using Equation (21), we can see that the increase of SPL can cause the sound driving force
S to increase exponentially, which in return increases the amplitude of the oscillation, as shown in Equation (8). However, the frequency of the acoustics field changes at different NPR, which also greatly influences the oscillation process of the droplet, and finally makes
rd experience some fluctuations with NPR.
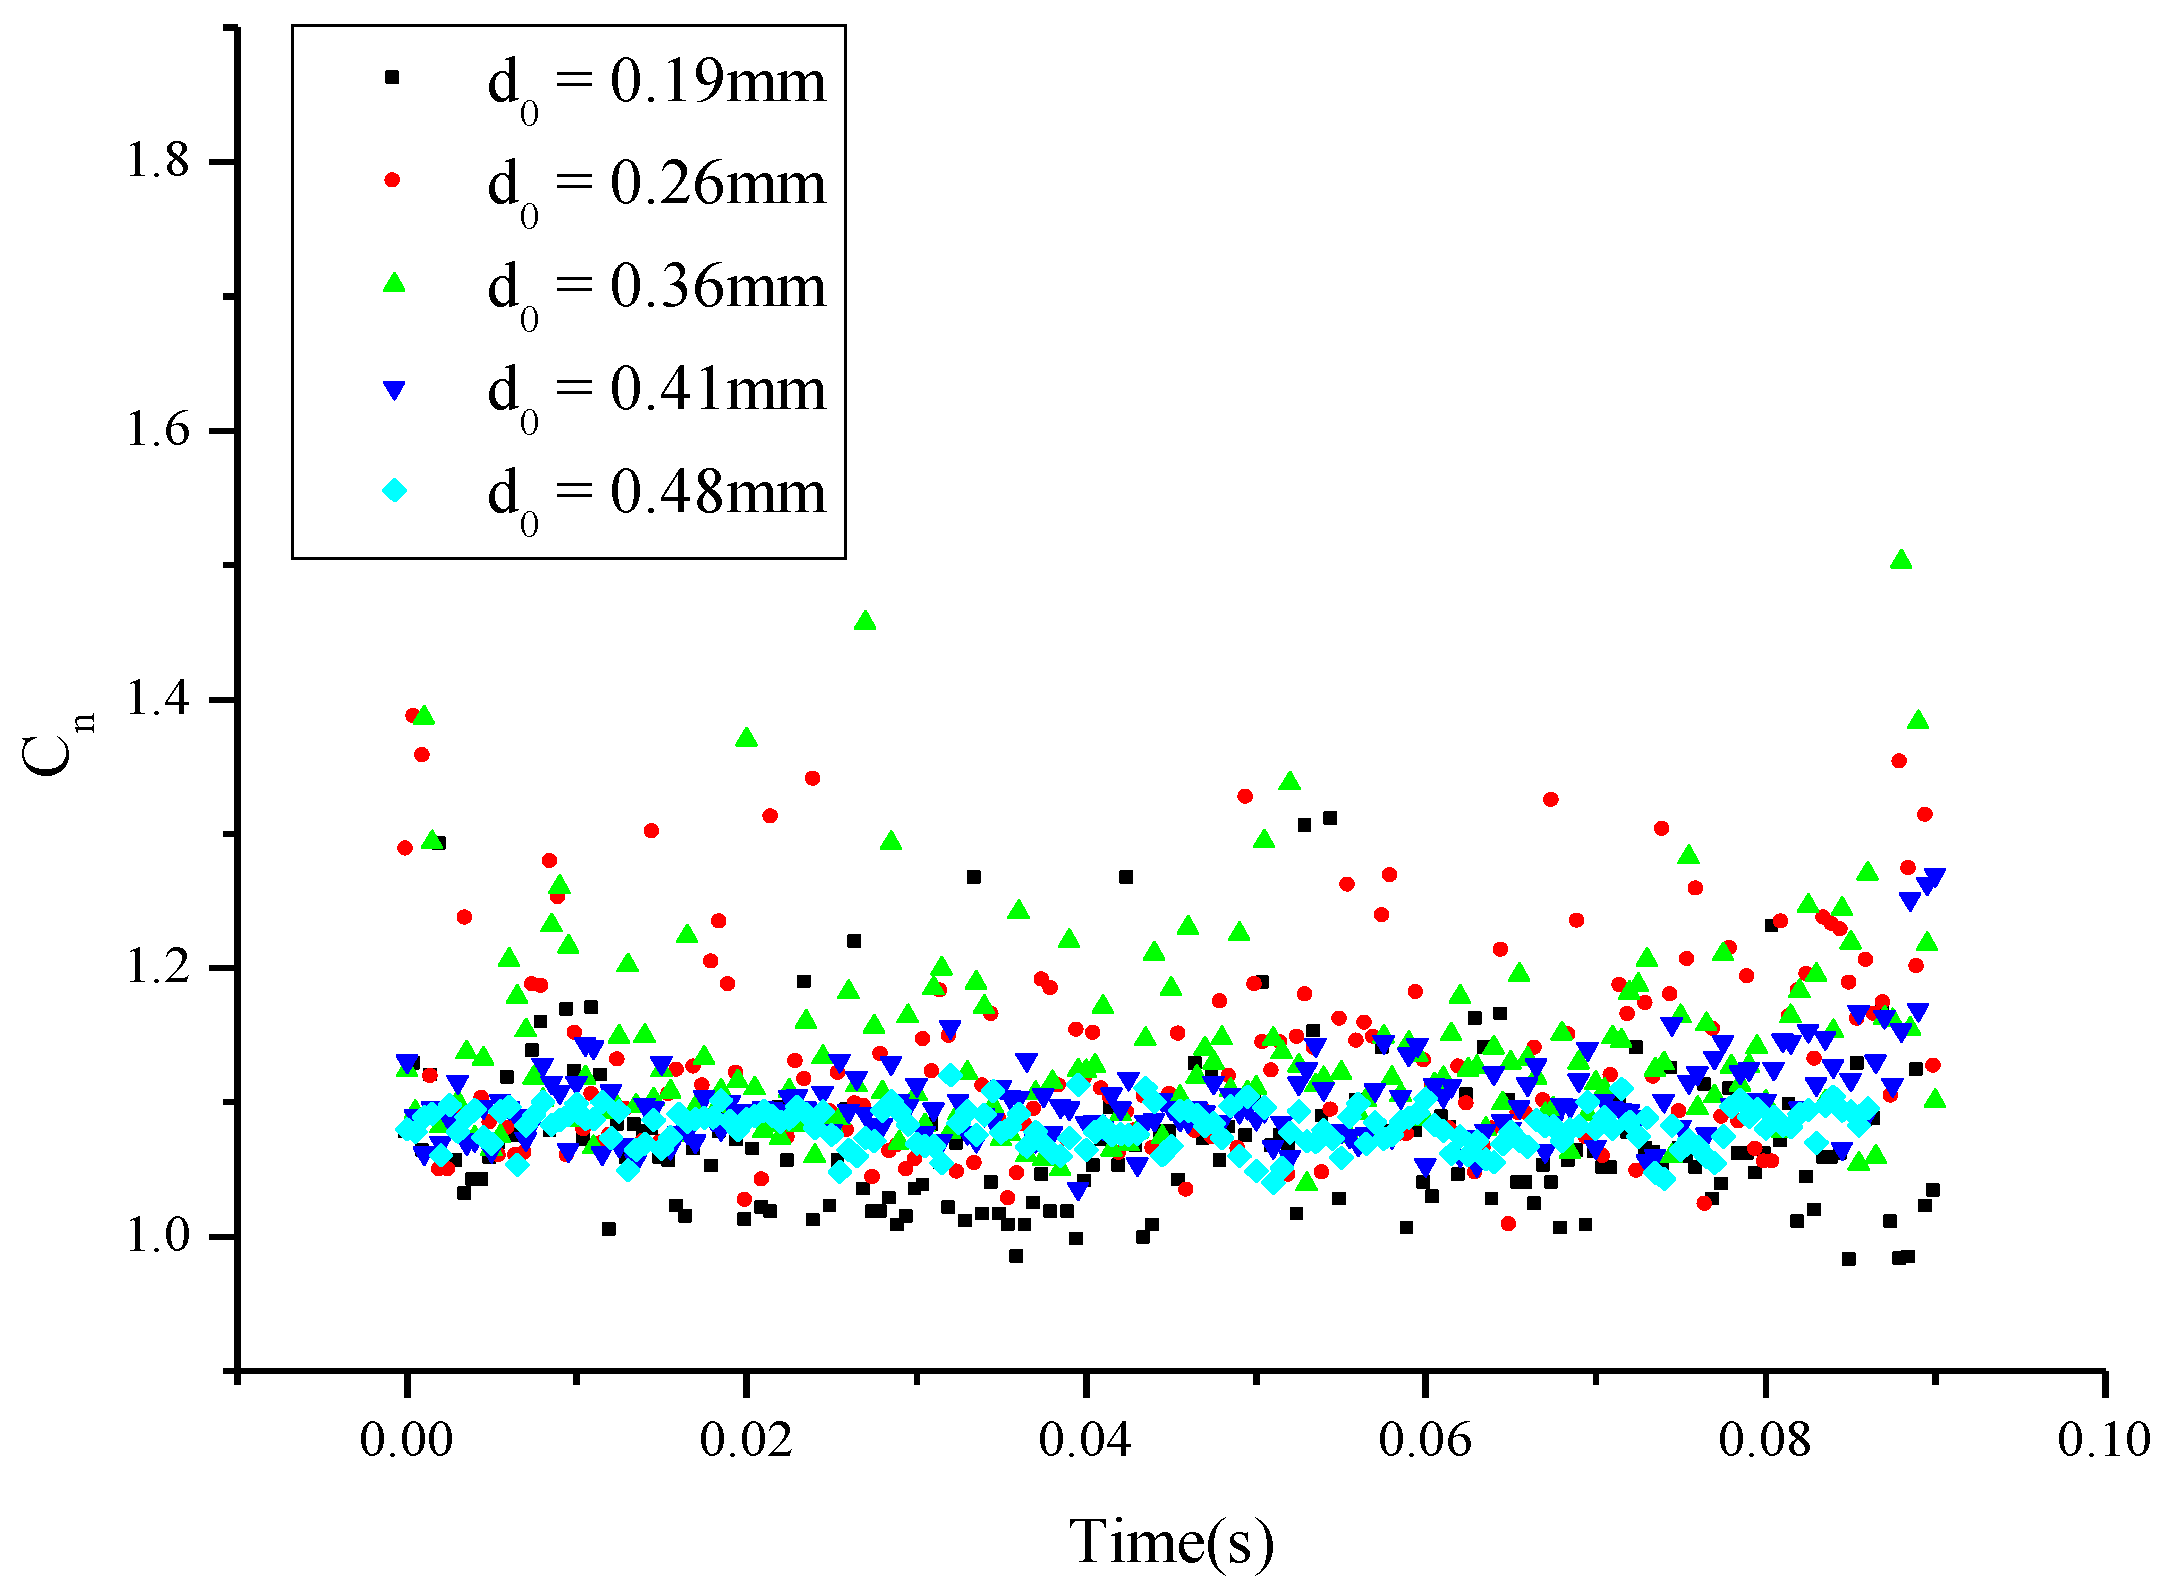
4.3. Effect of Initial Droplet Diameter
In real atomization applications, the diameters of the droplets are different. In this section, the response of droplets with different diameters to acoustic excitation will be investigated. The initial diameter of the droplet is adjusted by changing the diameter of the syringe needle, which also determines the initial radial
r for calculation. The relationship between the diameter of droplet
D and the diameter of syringe needle
d0 was suggested by Lefebvre [
1] as:
where
D is the diameter of the droplet,
d0 is the diameter of the syringe needle,
g is the coefficient of gravity,
is the liquid tension coefficient of the droplet and
is the density of water (i.e.,
,
,
). In these experiments, NPR = 6 and
L = 4
Dj are kept as constants during the whole test, the syringe needle diameters (
d0) are 0.16 mm, 0.4 mm, 1.07 mm, 1.6 mm and 2.5 mm, and the corresponding diameters of the droplets are listed in
Table 3.
Figure 12 gives the distributions of
Cn for different droplet diameters in the same acoustic field induced by HRT. It can be seen that the scattered
Cn data from the smallest diameter,
d0 = 0.19 mm, and the largest diameter,
d0 = 0.48 mm, are mainly concentrated in the range from 1.0 to 1.1, which indicates a relatively smaller shape oscillation compared to those from diameters
d0 = 0.26 mm, 0.36 mm, and 0.41 mm. This suggests that, for an acoustic field with specific frequency and SPL, droplets with different diameters will have different responses, confirming the non-linear nature of the problem.
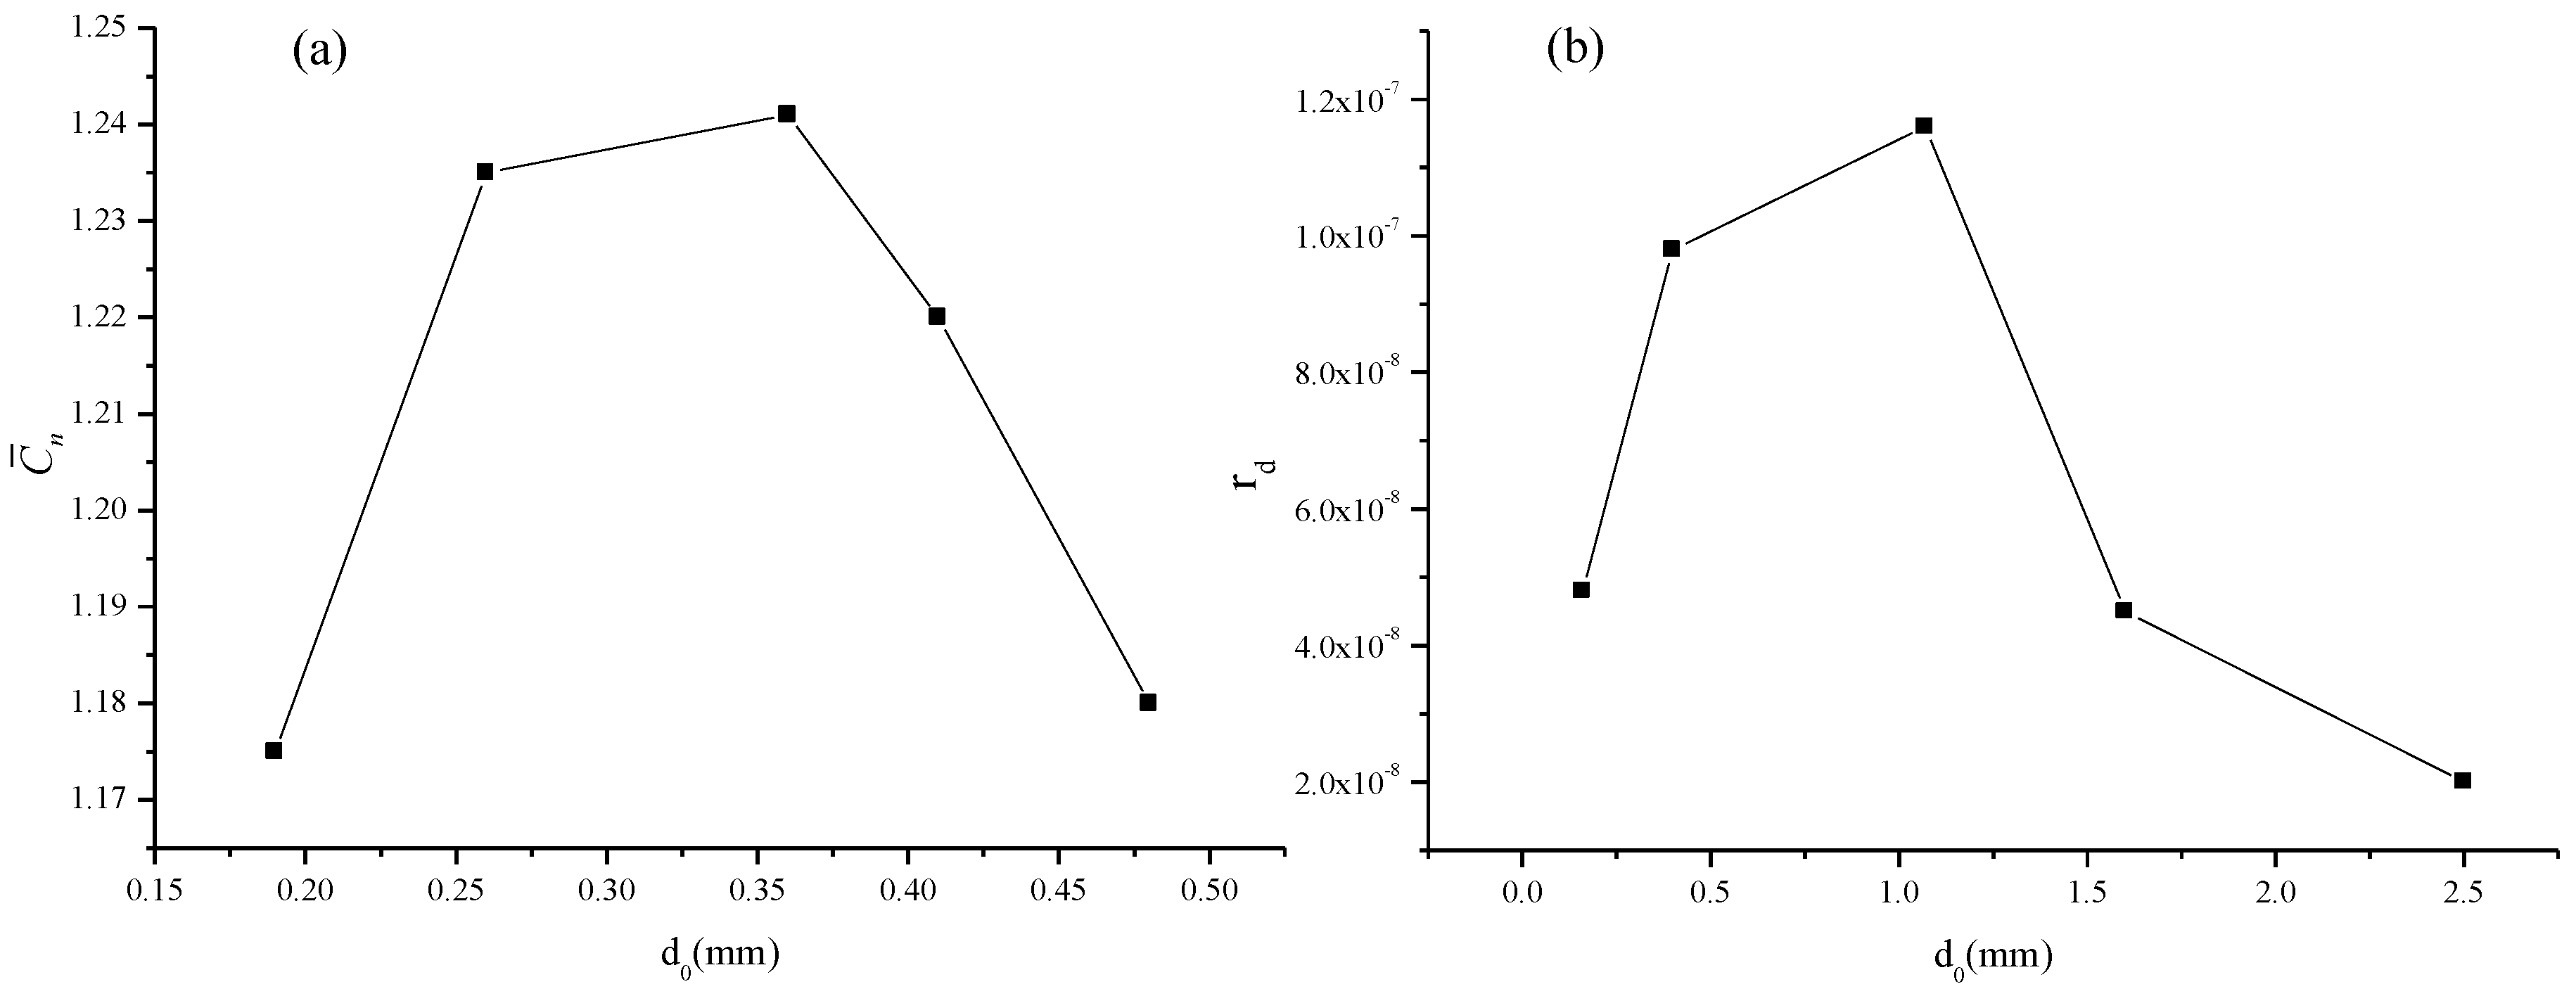
As with the discussion for cases with different cavity lengths and nozzle pressure ratios in
Section 4.1 and
Section 4.2,
and theoretical results of
rd for different droplet diameters are illustrated in
Figure 13. When NPR = 6 and
L = 4
Dj, experimental and numerical results show that the droplets with
d0 = 0.26 mm and 0.36 mm experience larger oscillations compared to
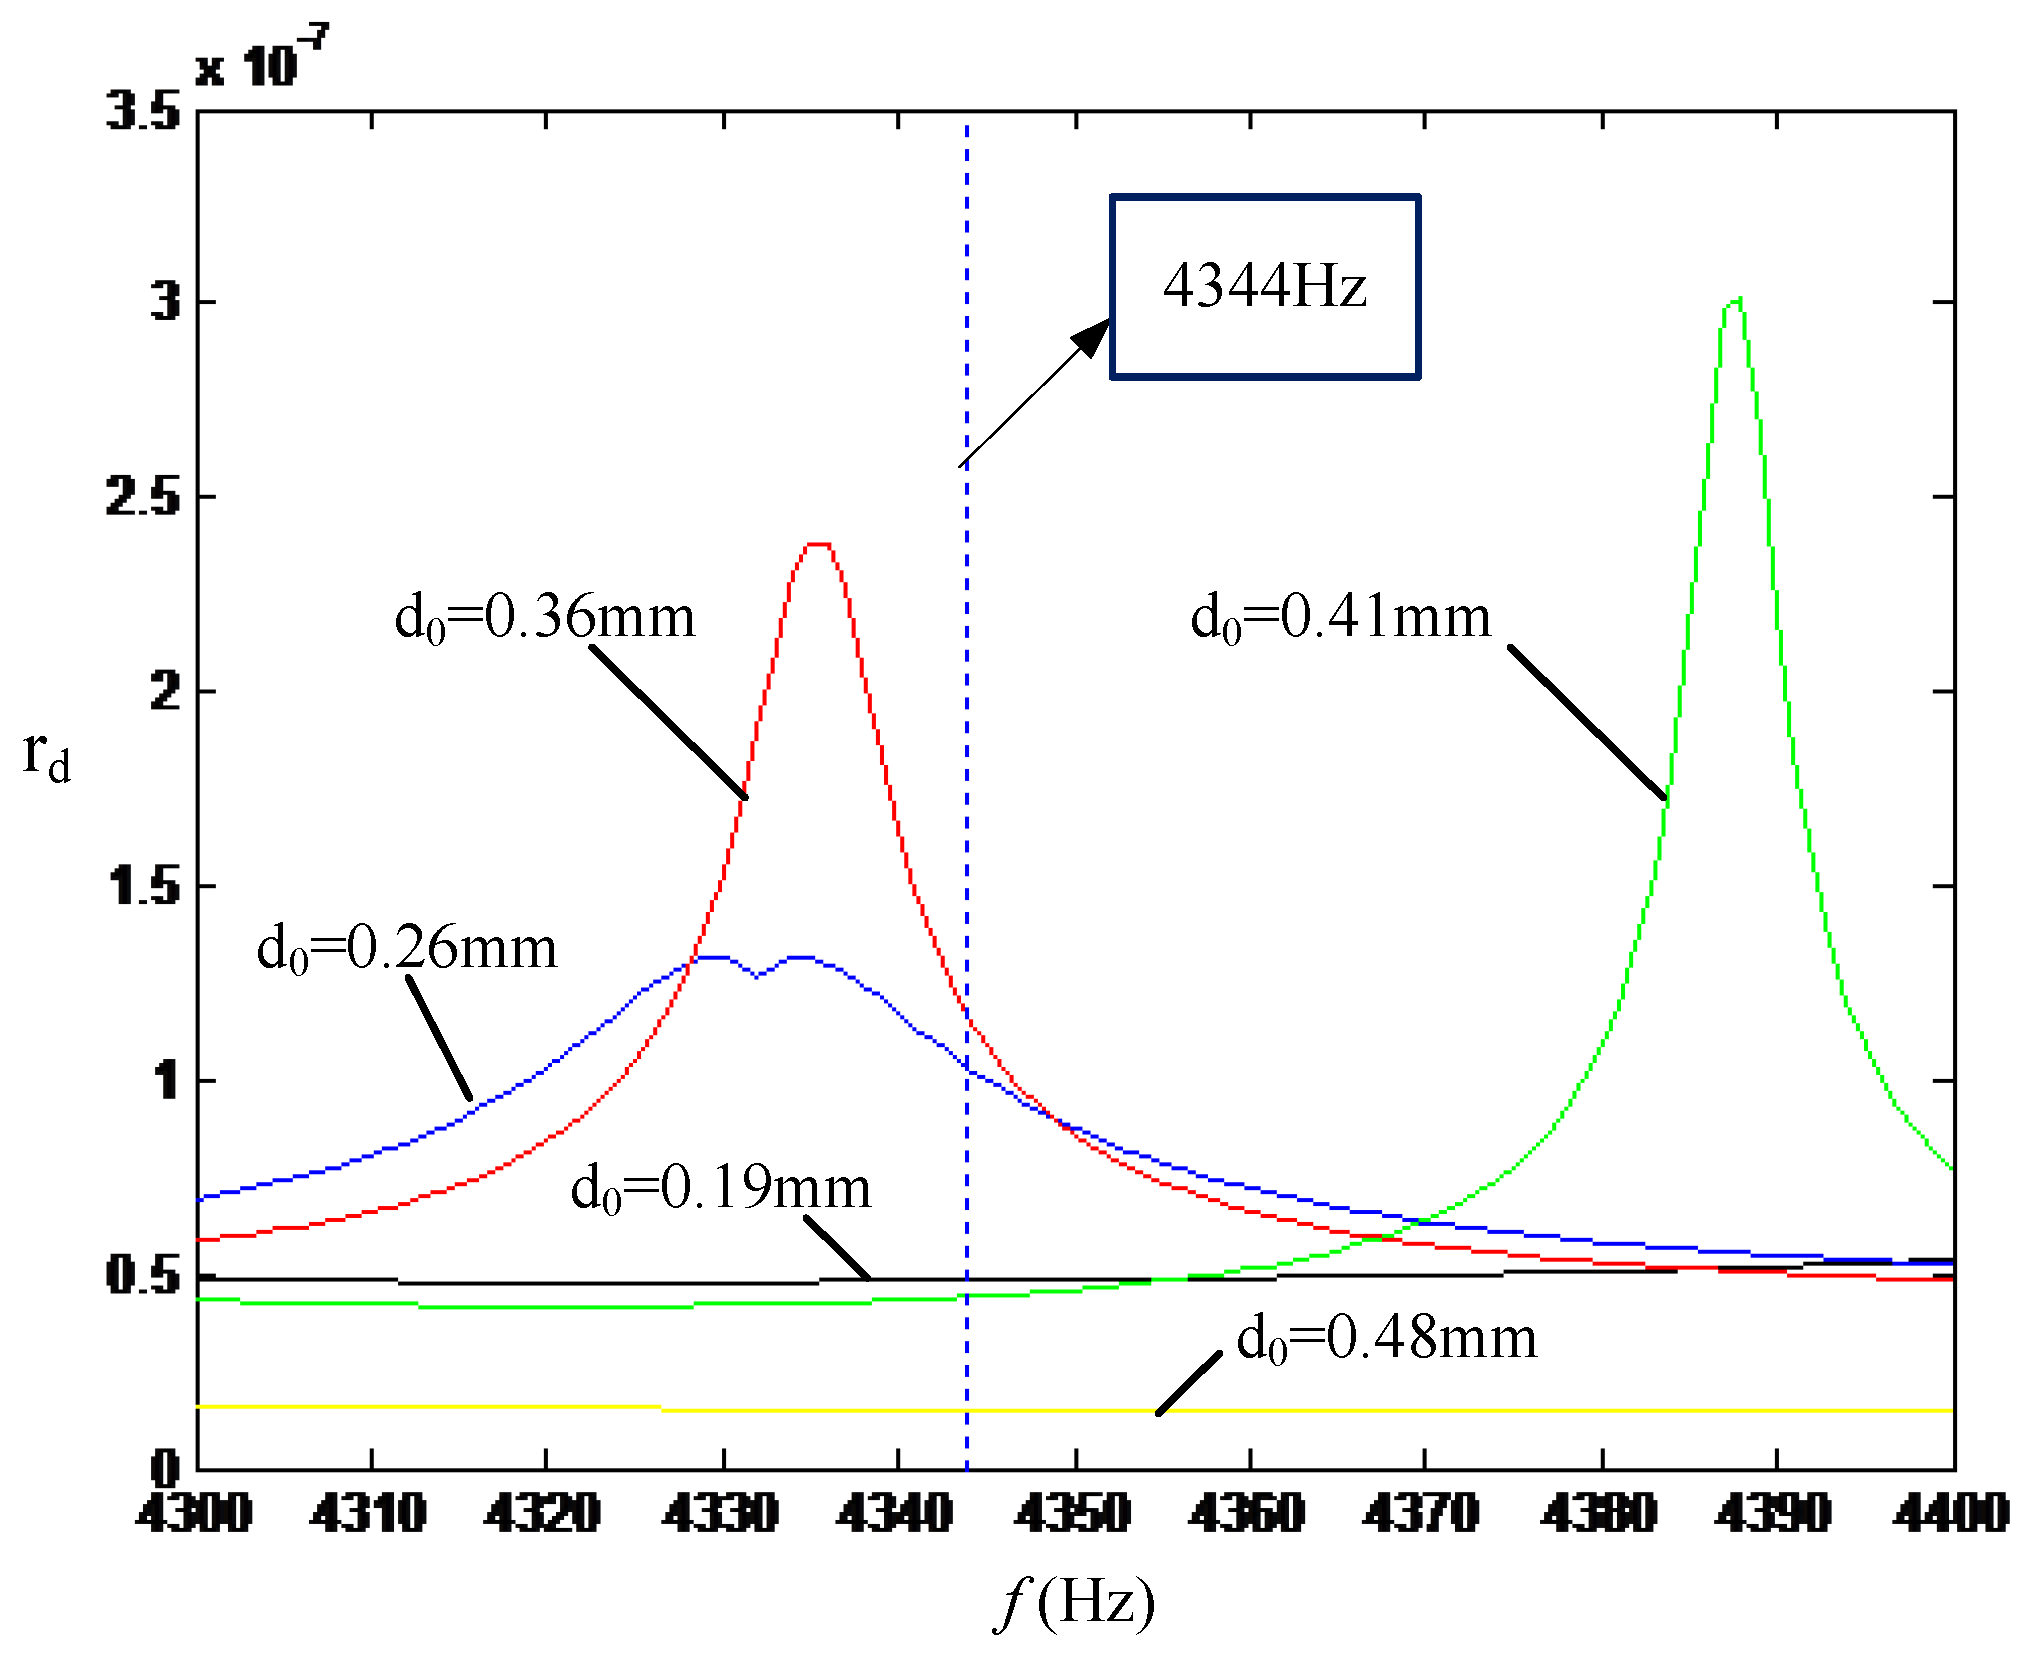
d0 = 0.19 mm, 0.41 mm and 0.48 mm. Variation of
rd and frequency
f for cases with different initial diameters is shown in
Figure 14. Based on these calculation results,
rd peaks when
f is close to the resonance frequency of the droplet. However, for the droplets with different initial diameters, the resonance frequency happens at different values and modes, which means that for a specific acoustic frequency, when the resonance frequency of the droplet matches the acoustic frequency, the shape oscillation will reach its maximum. On the other hand, the SPL of the acoustics only affects the specific deformation amplitude, as described in Equations (8) and (21).


