
Ion Migration in the Process of Water Freezing under Alternating Electric Field and Its Impact on Insulator Flashover


Abstract
:1. Introduction
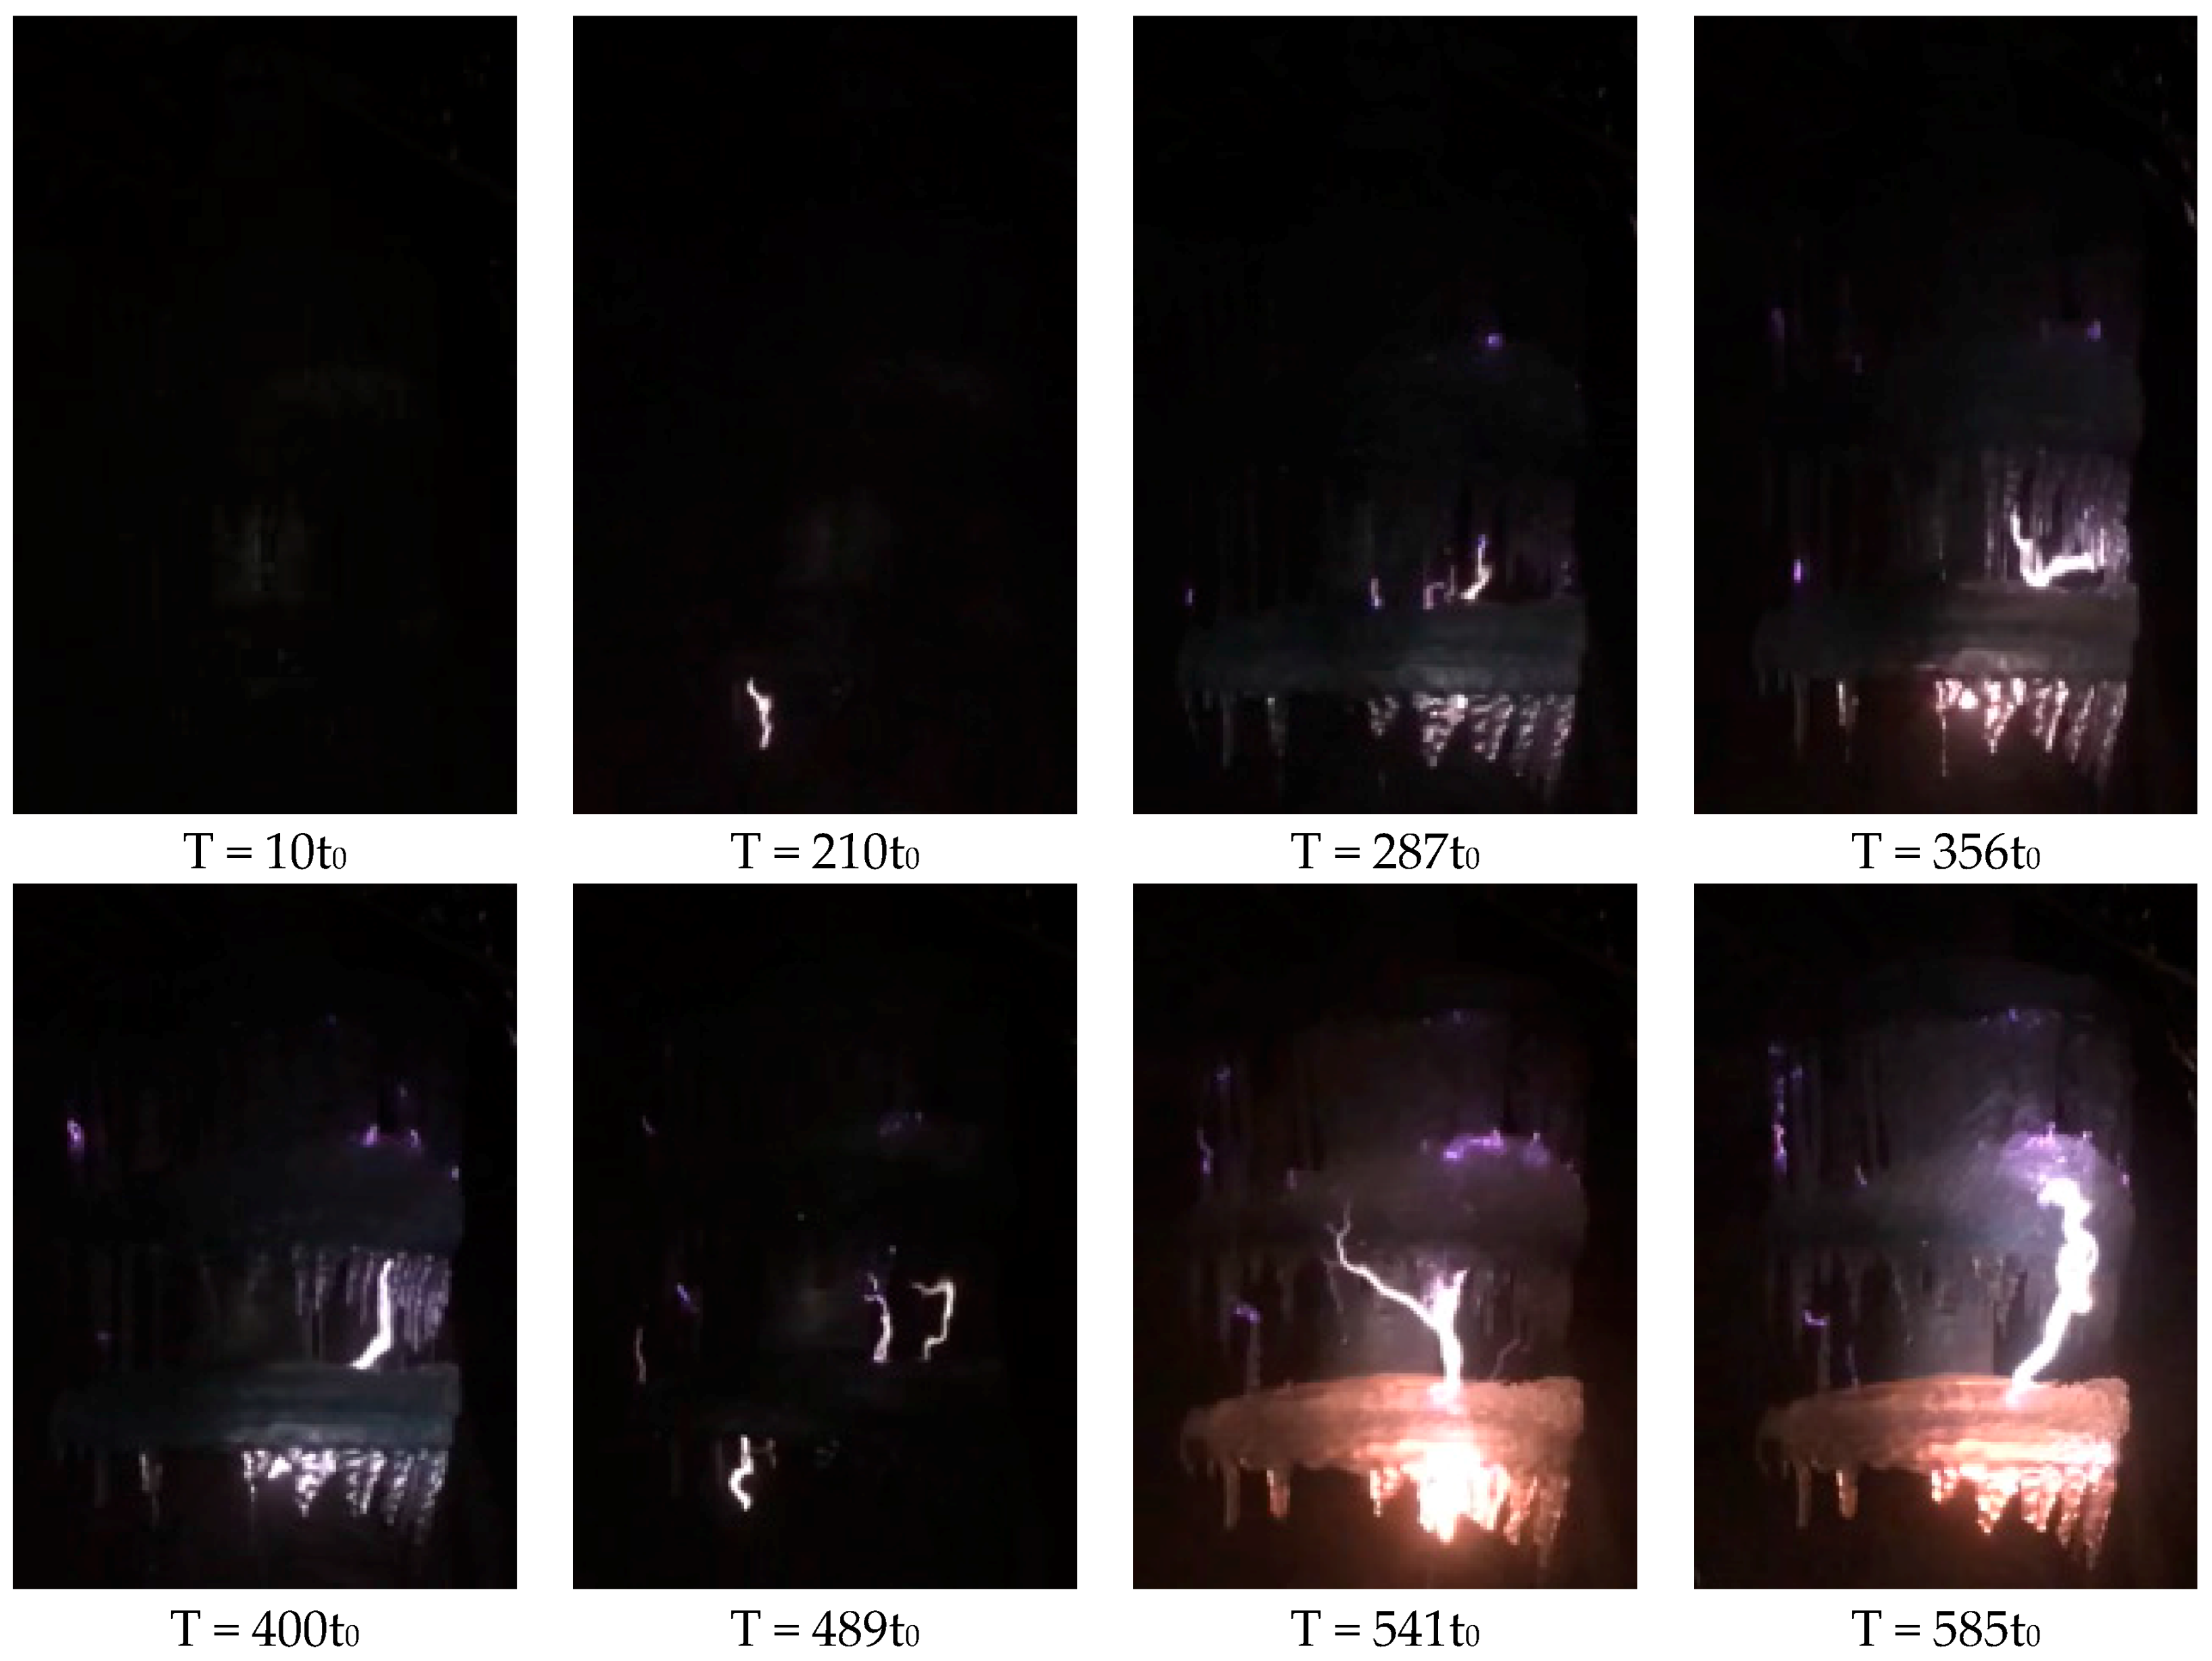
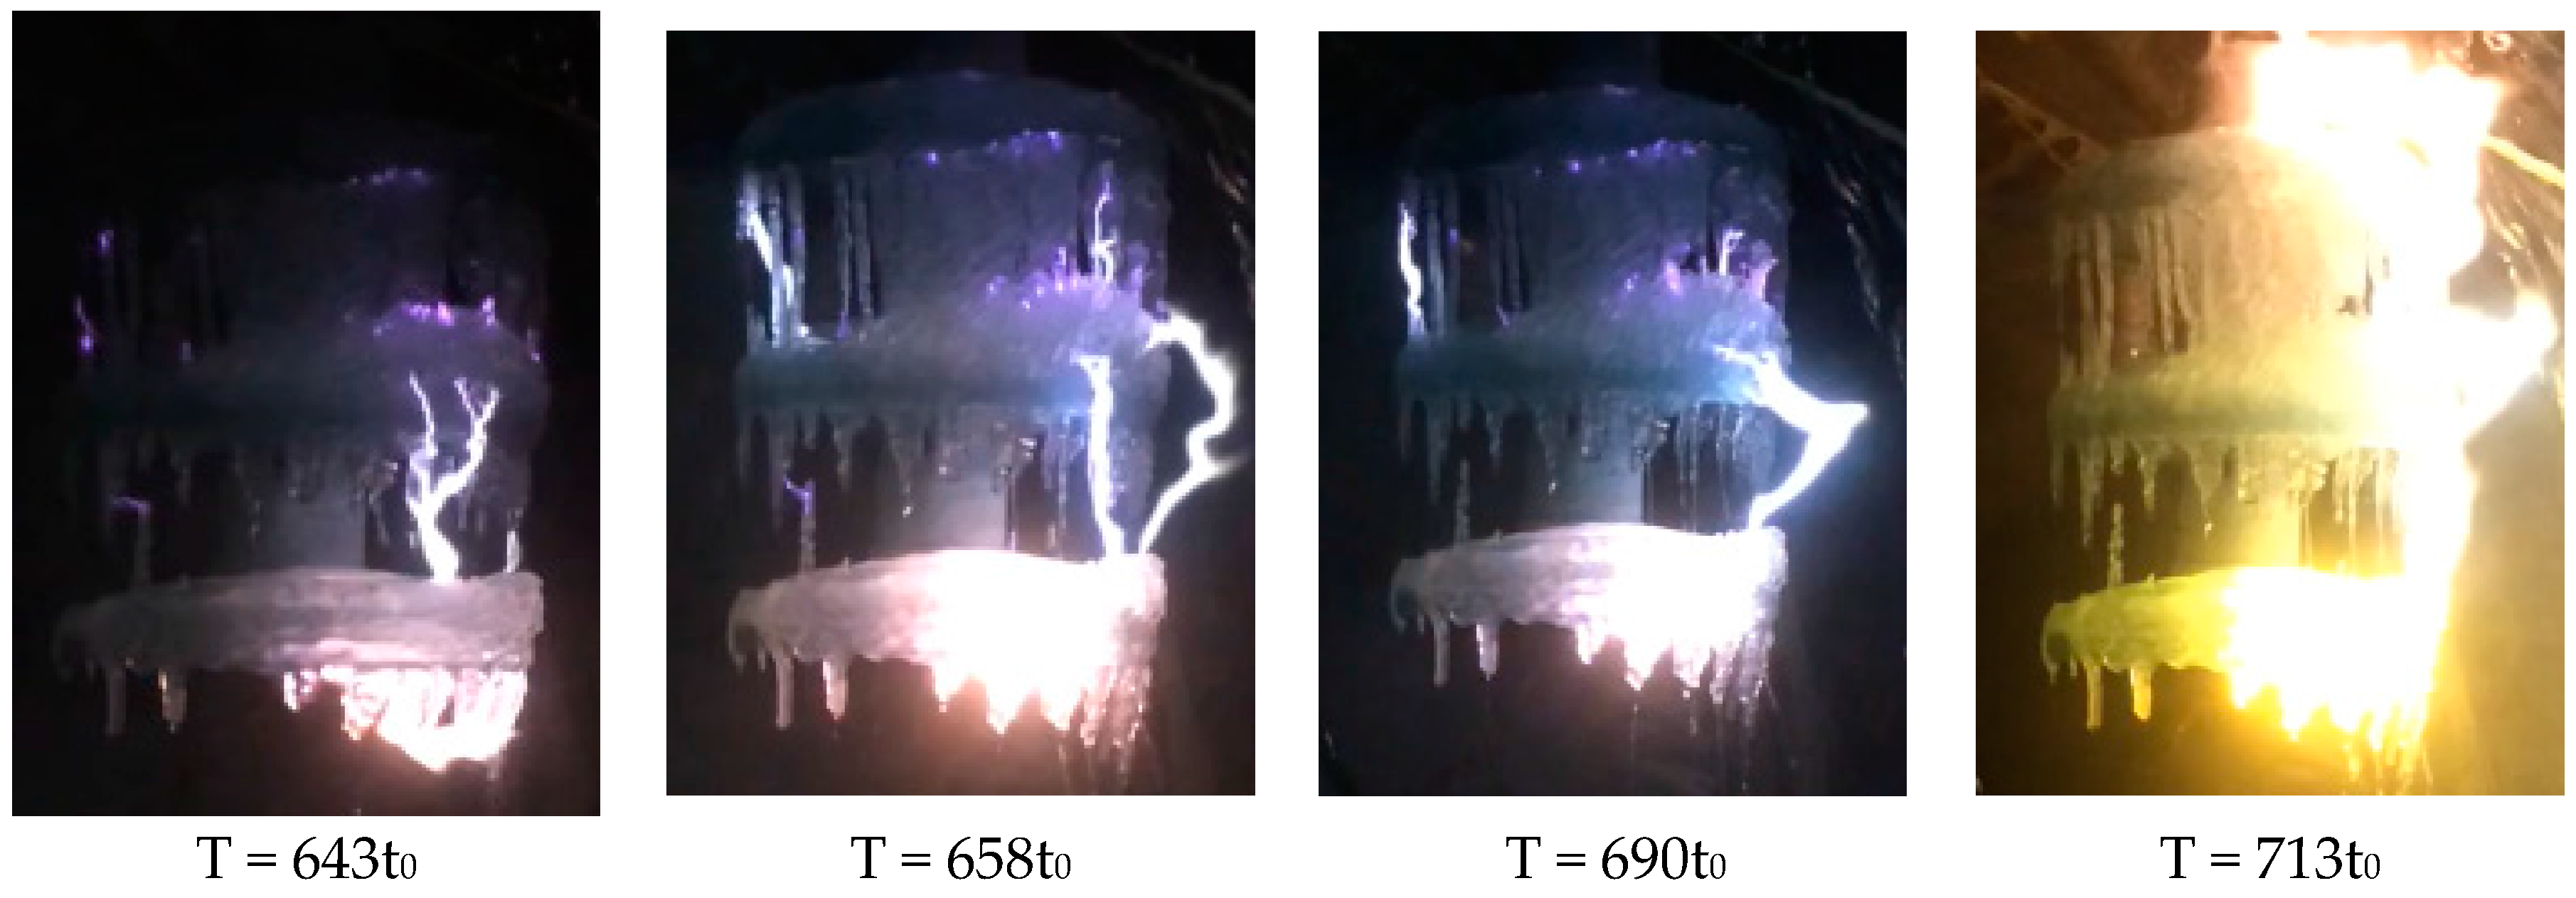
2. Freezing of Water Droplets under Alternating Electric Field
3. Ion Distribution in Ice Layer under Alternating Electric Field
4. Ion Migration of Freezing Water during the Icing of Insulator under Alternating Electric Field
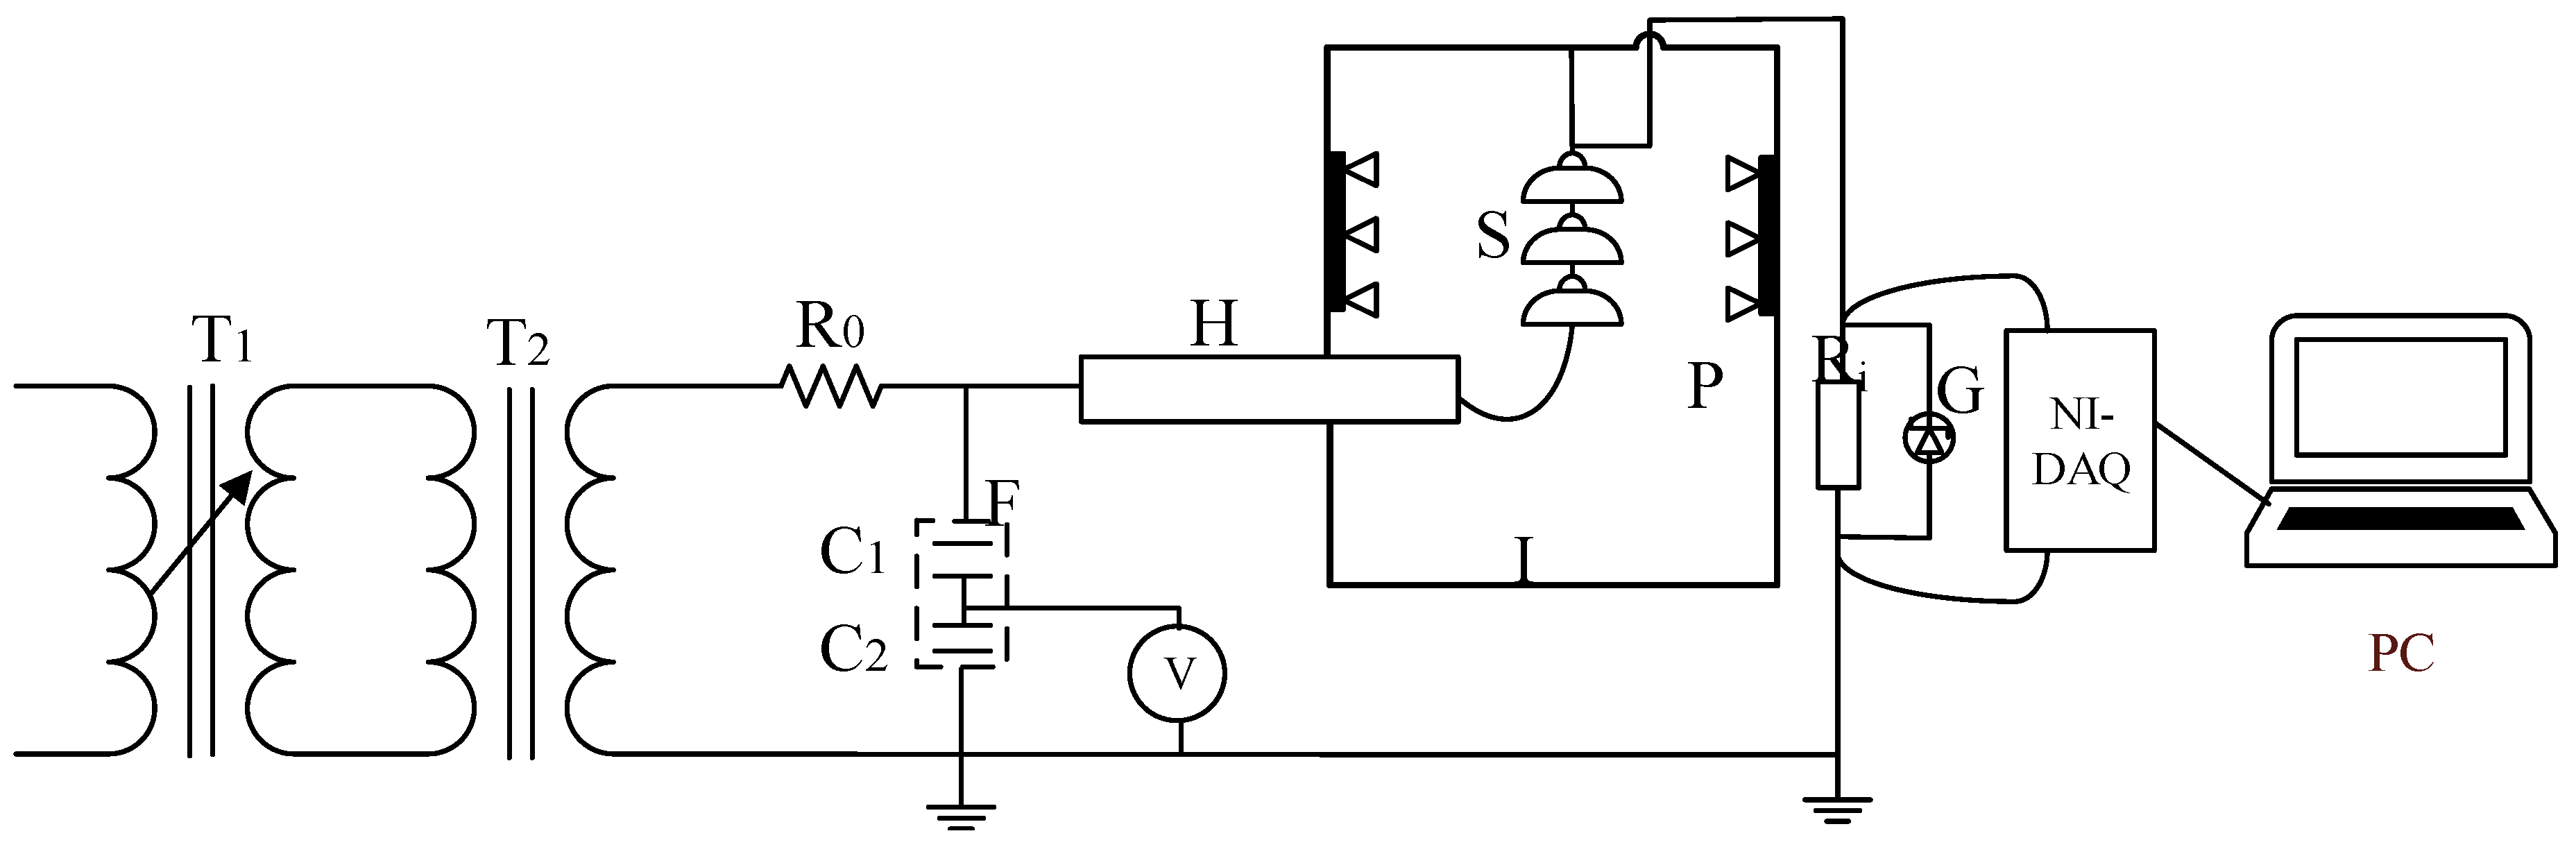
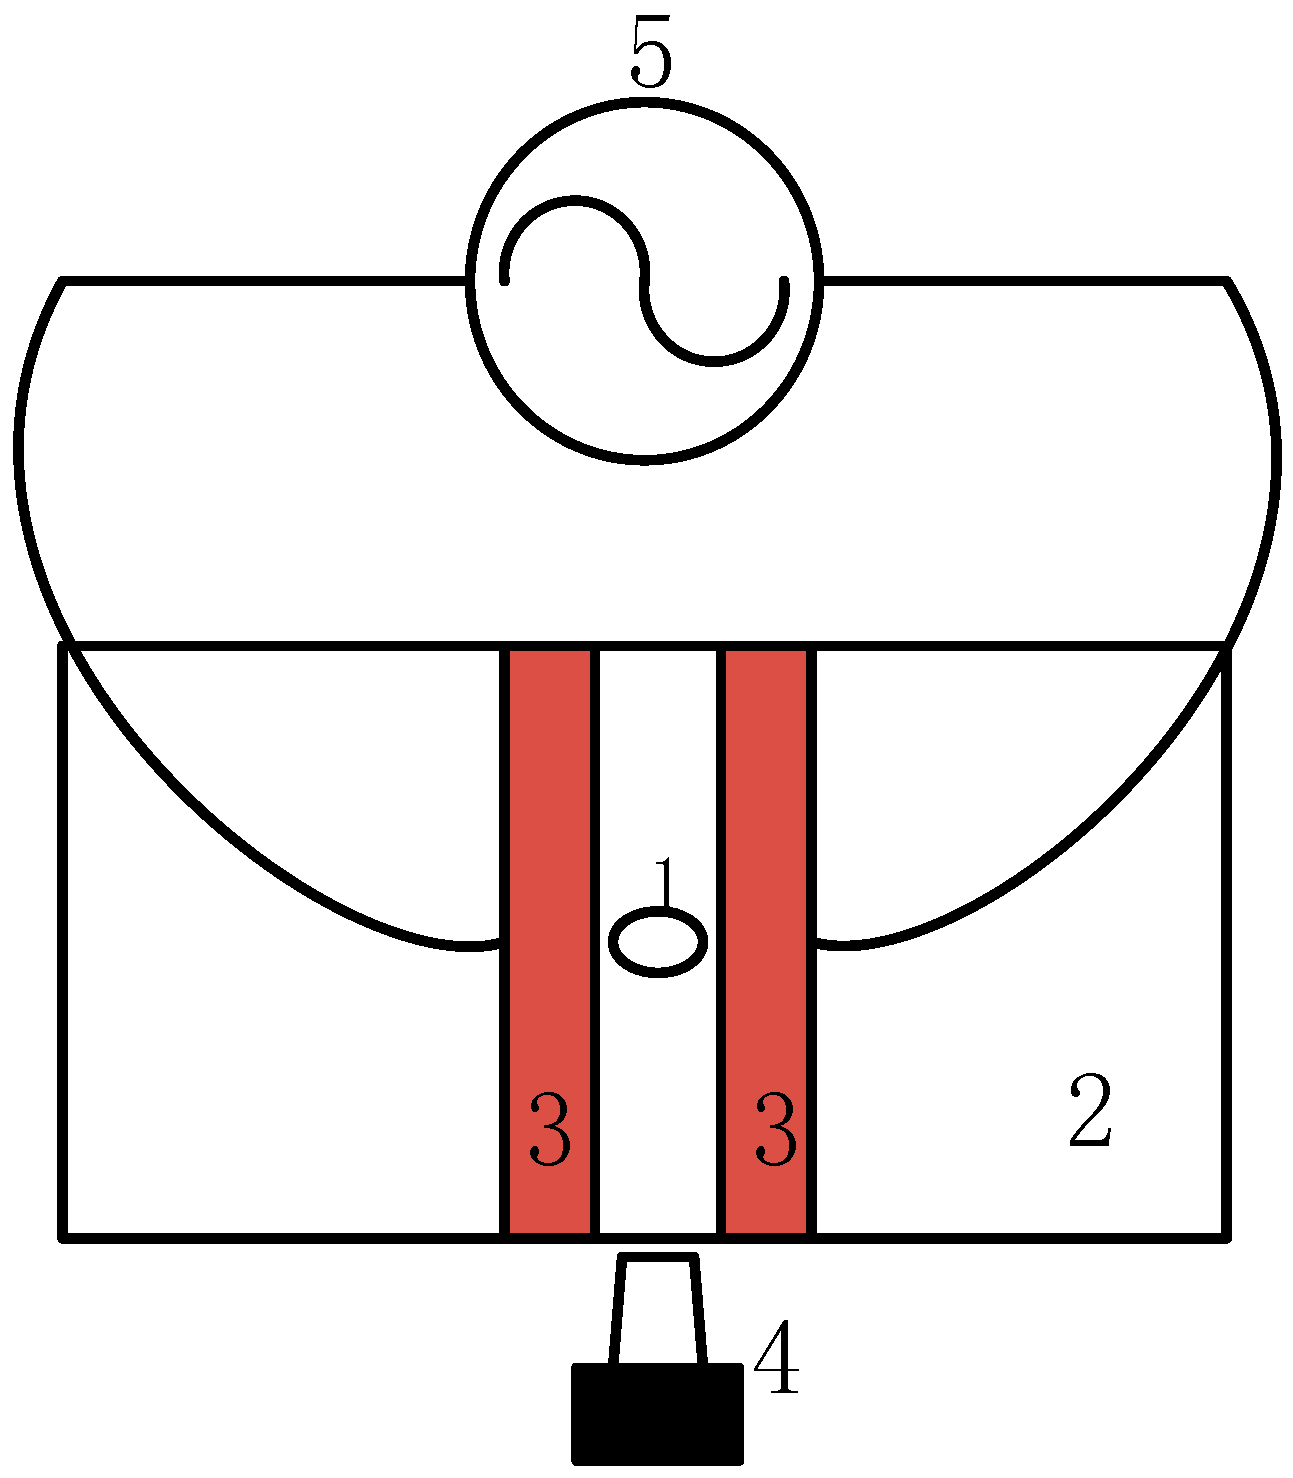
4.1. Experimental Equipment and Sample
4.2. Test Procedures
4.3. Test Results and Analysis
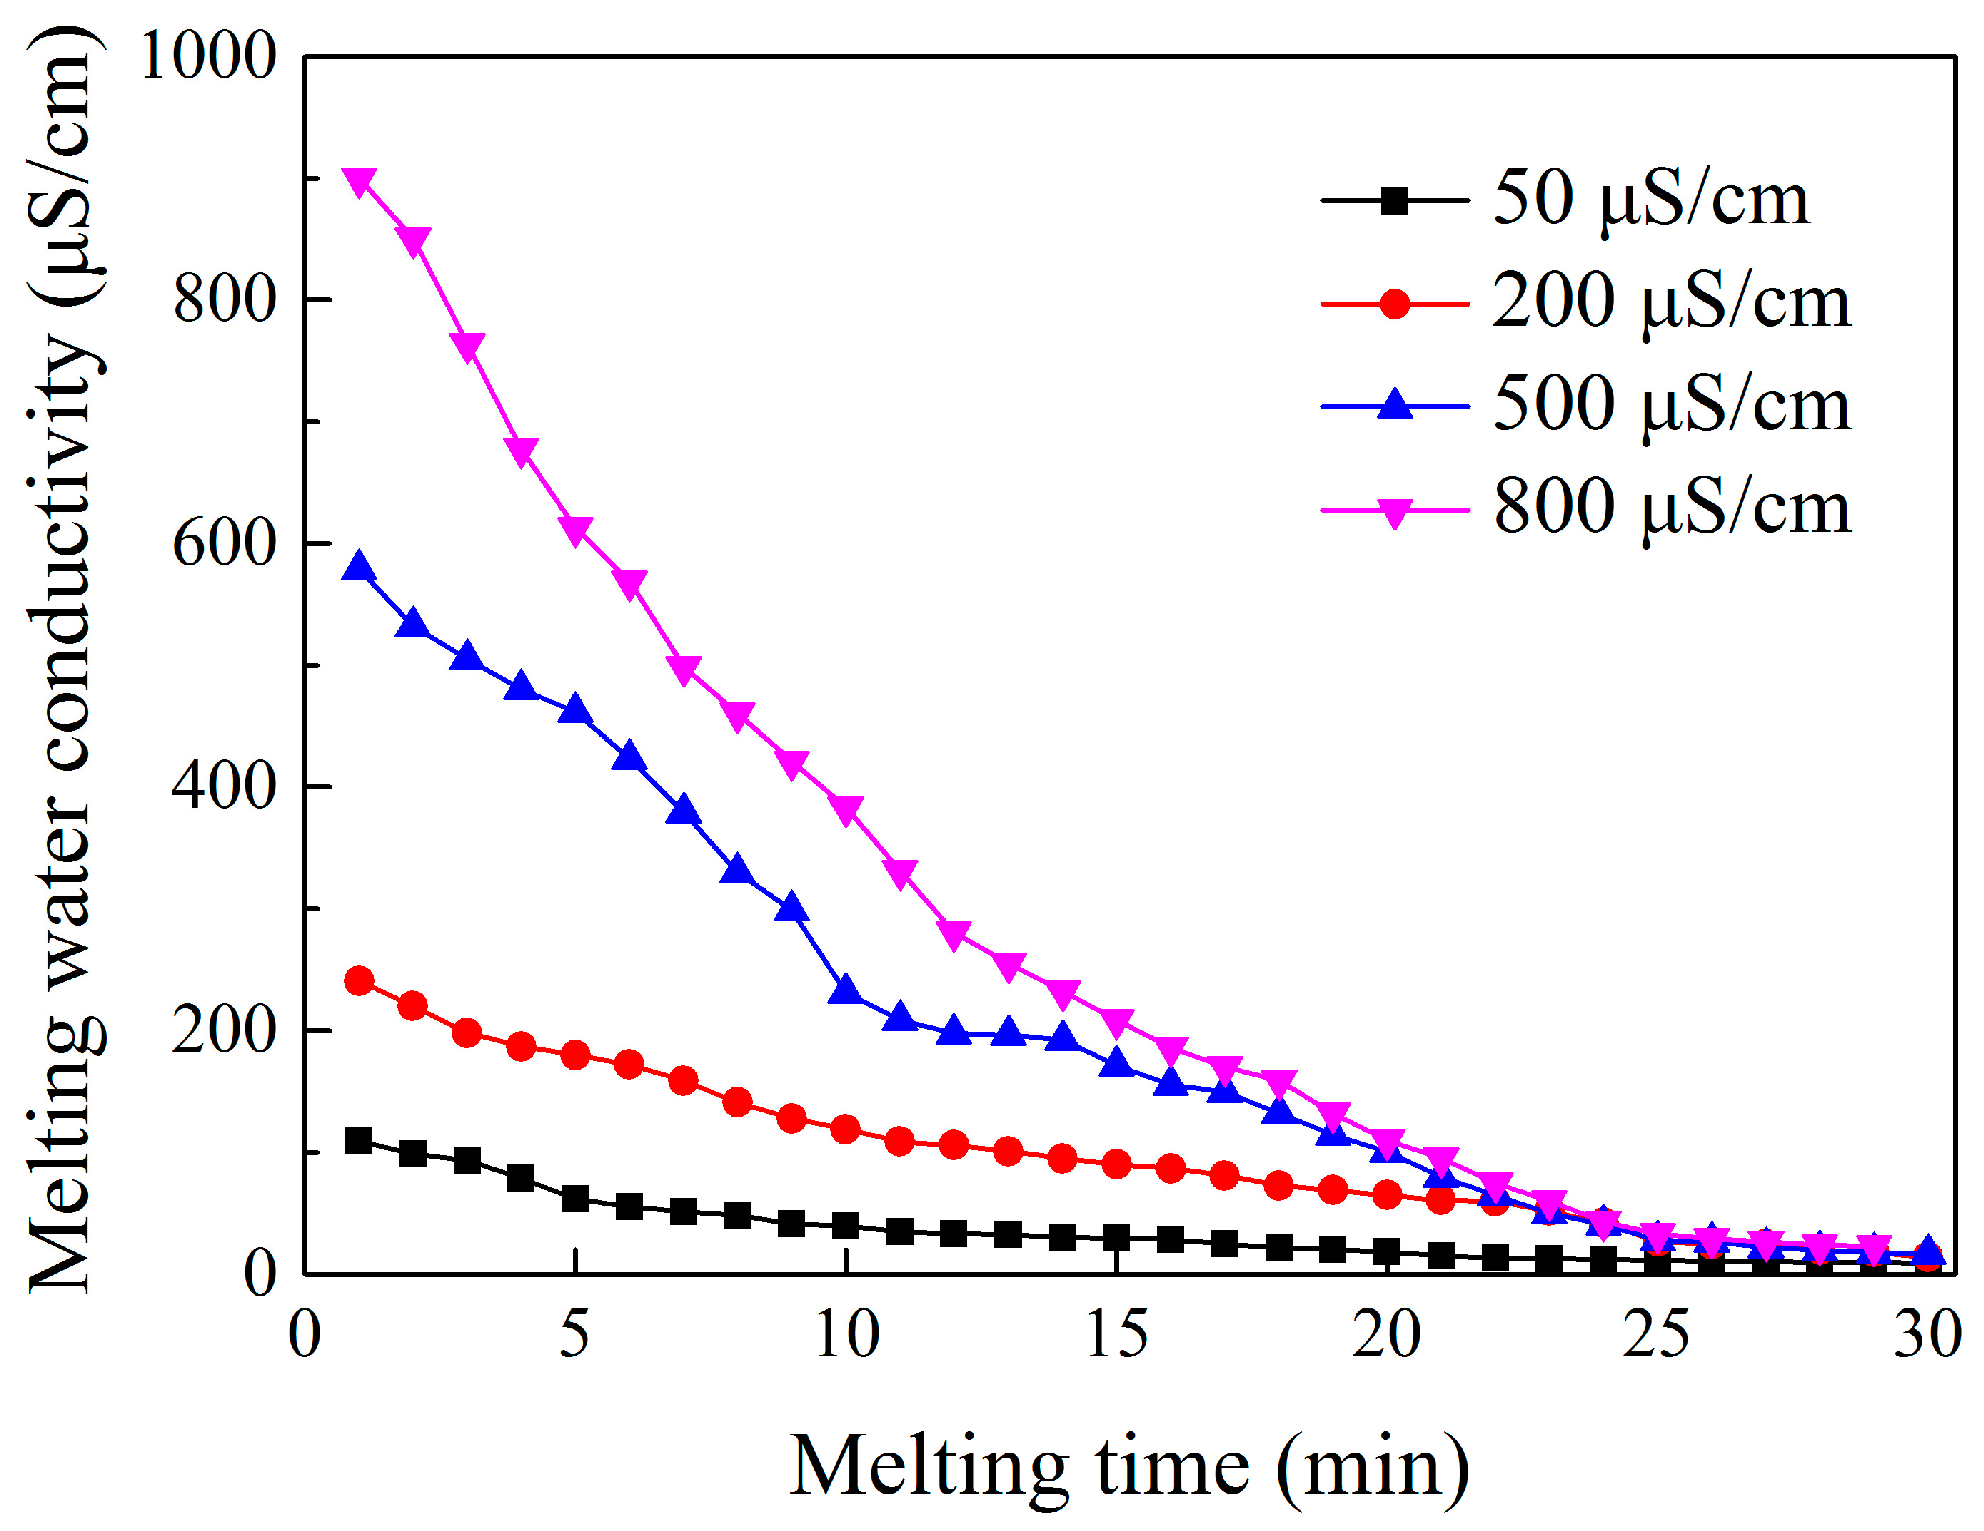
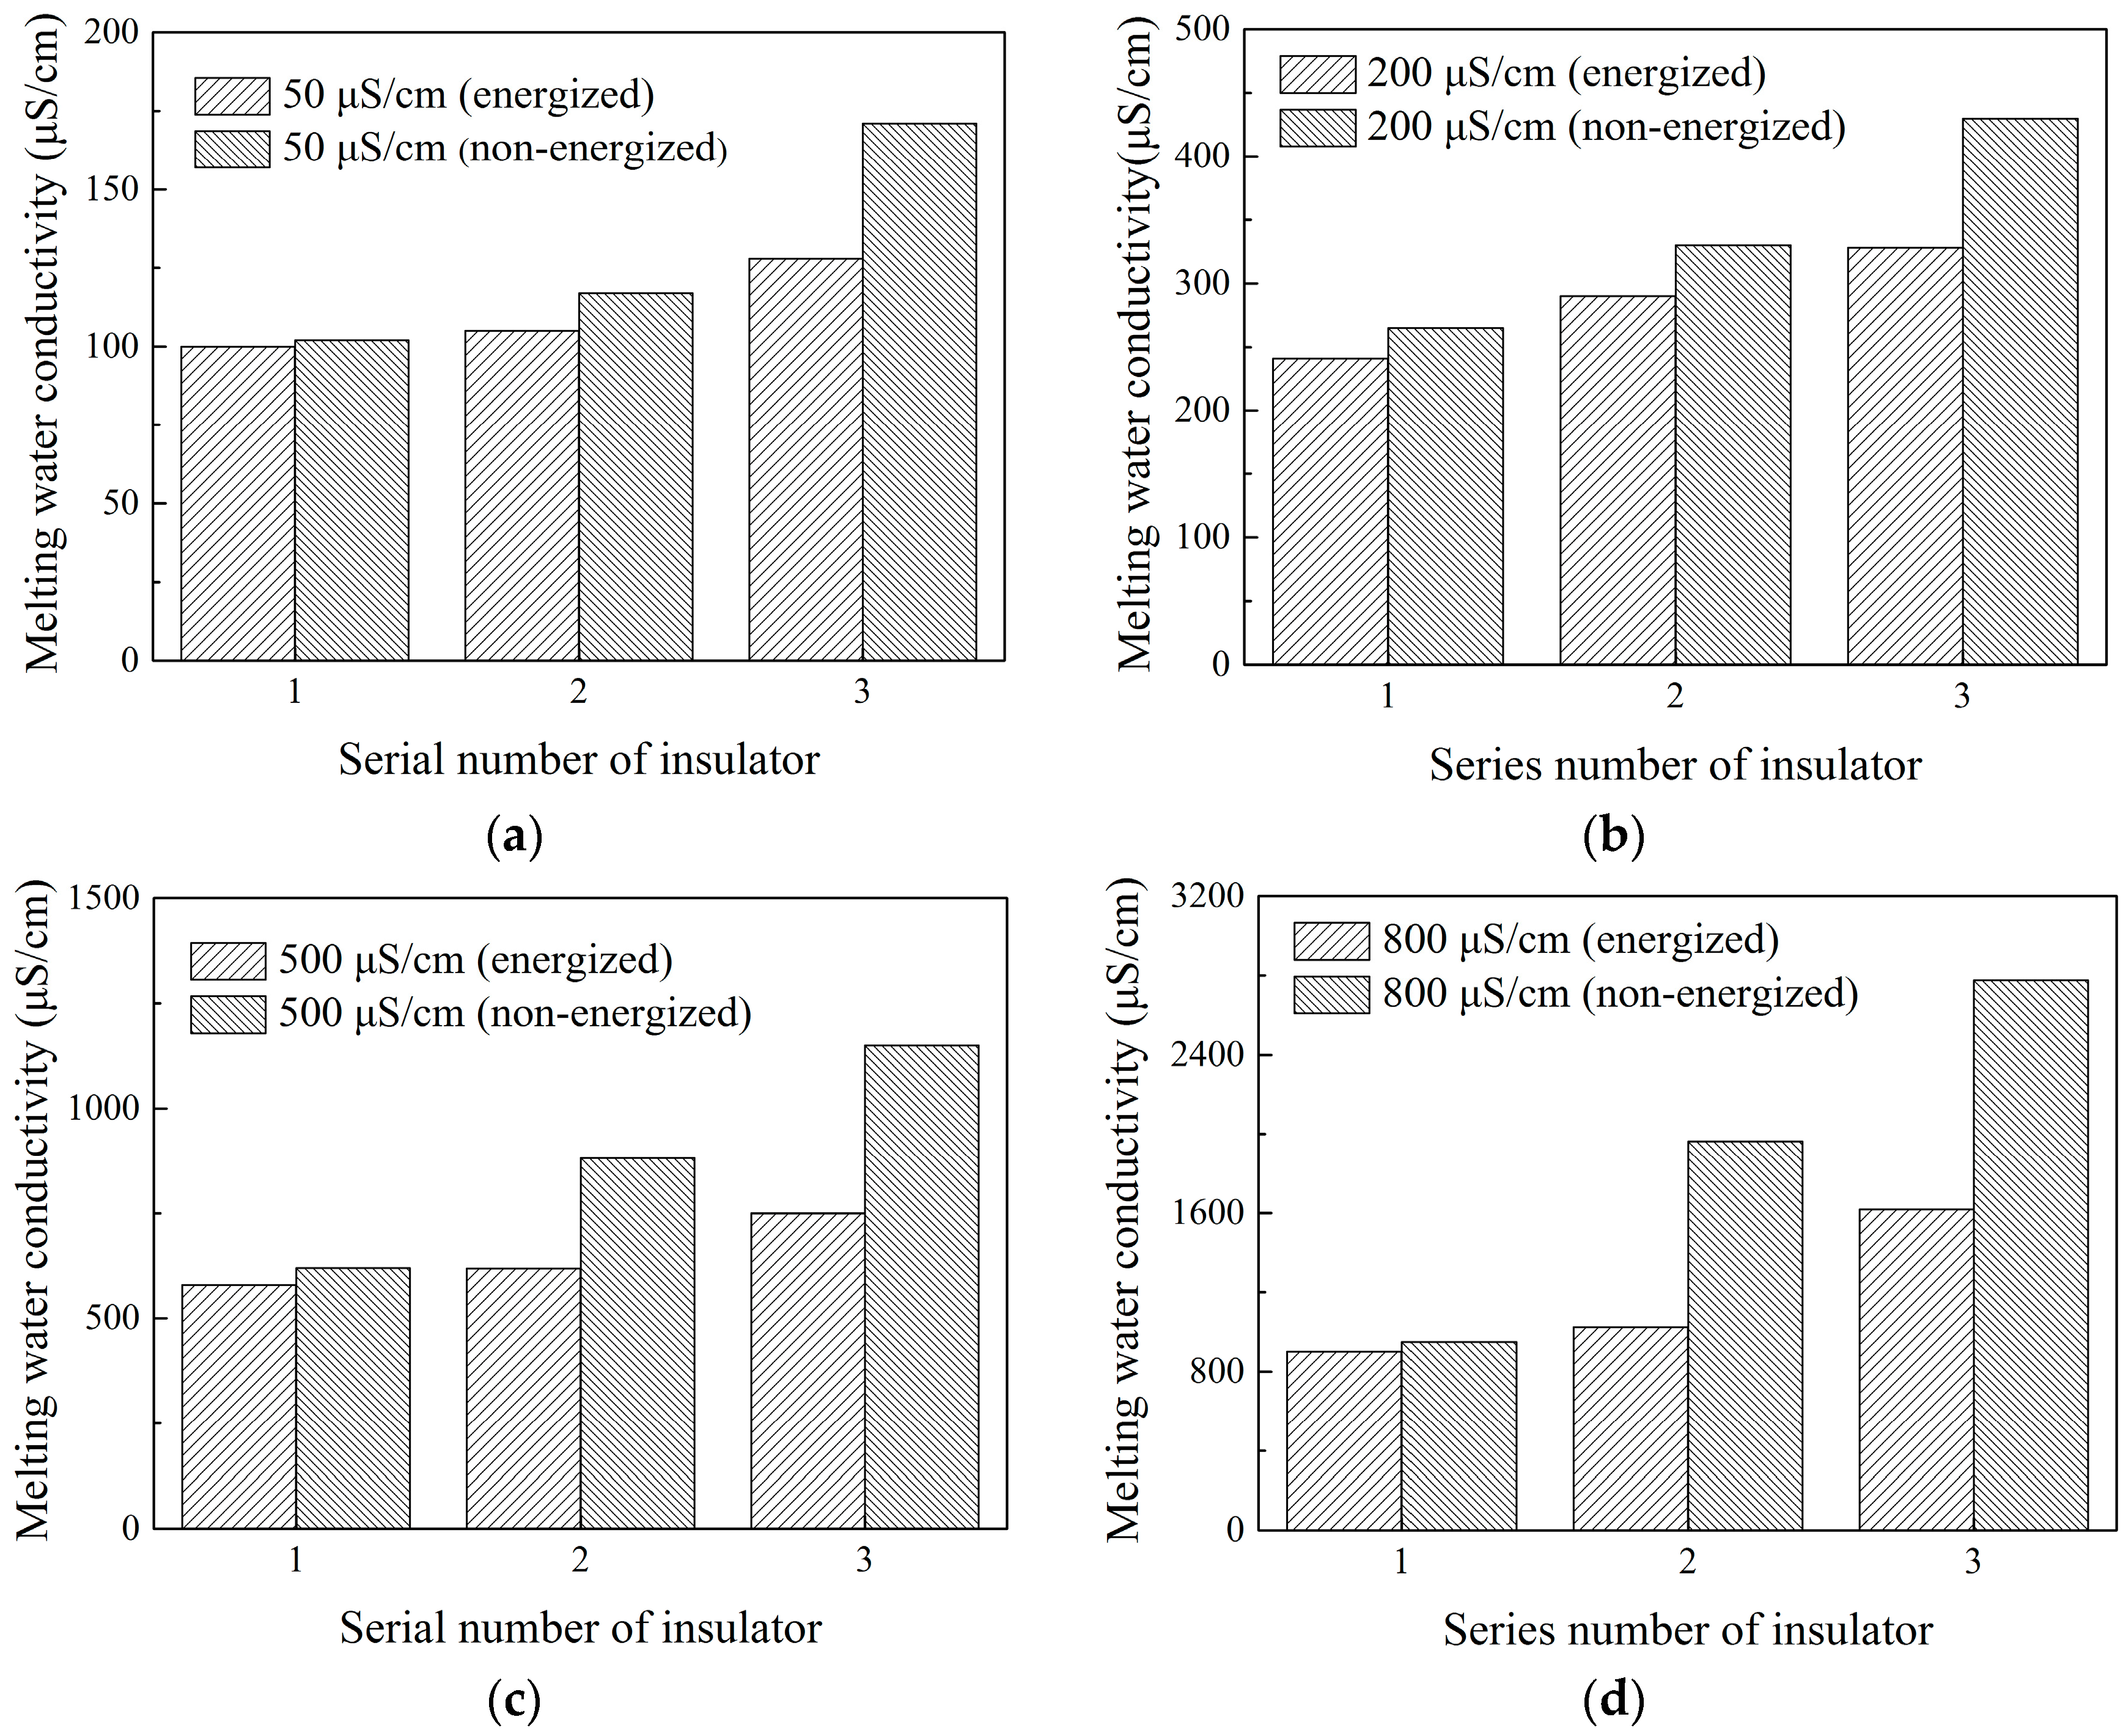
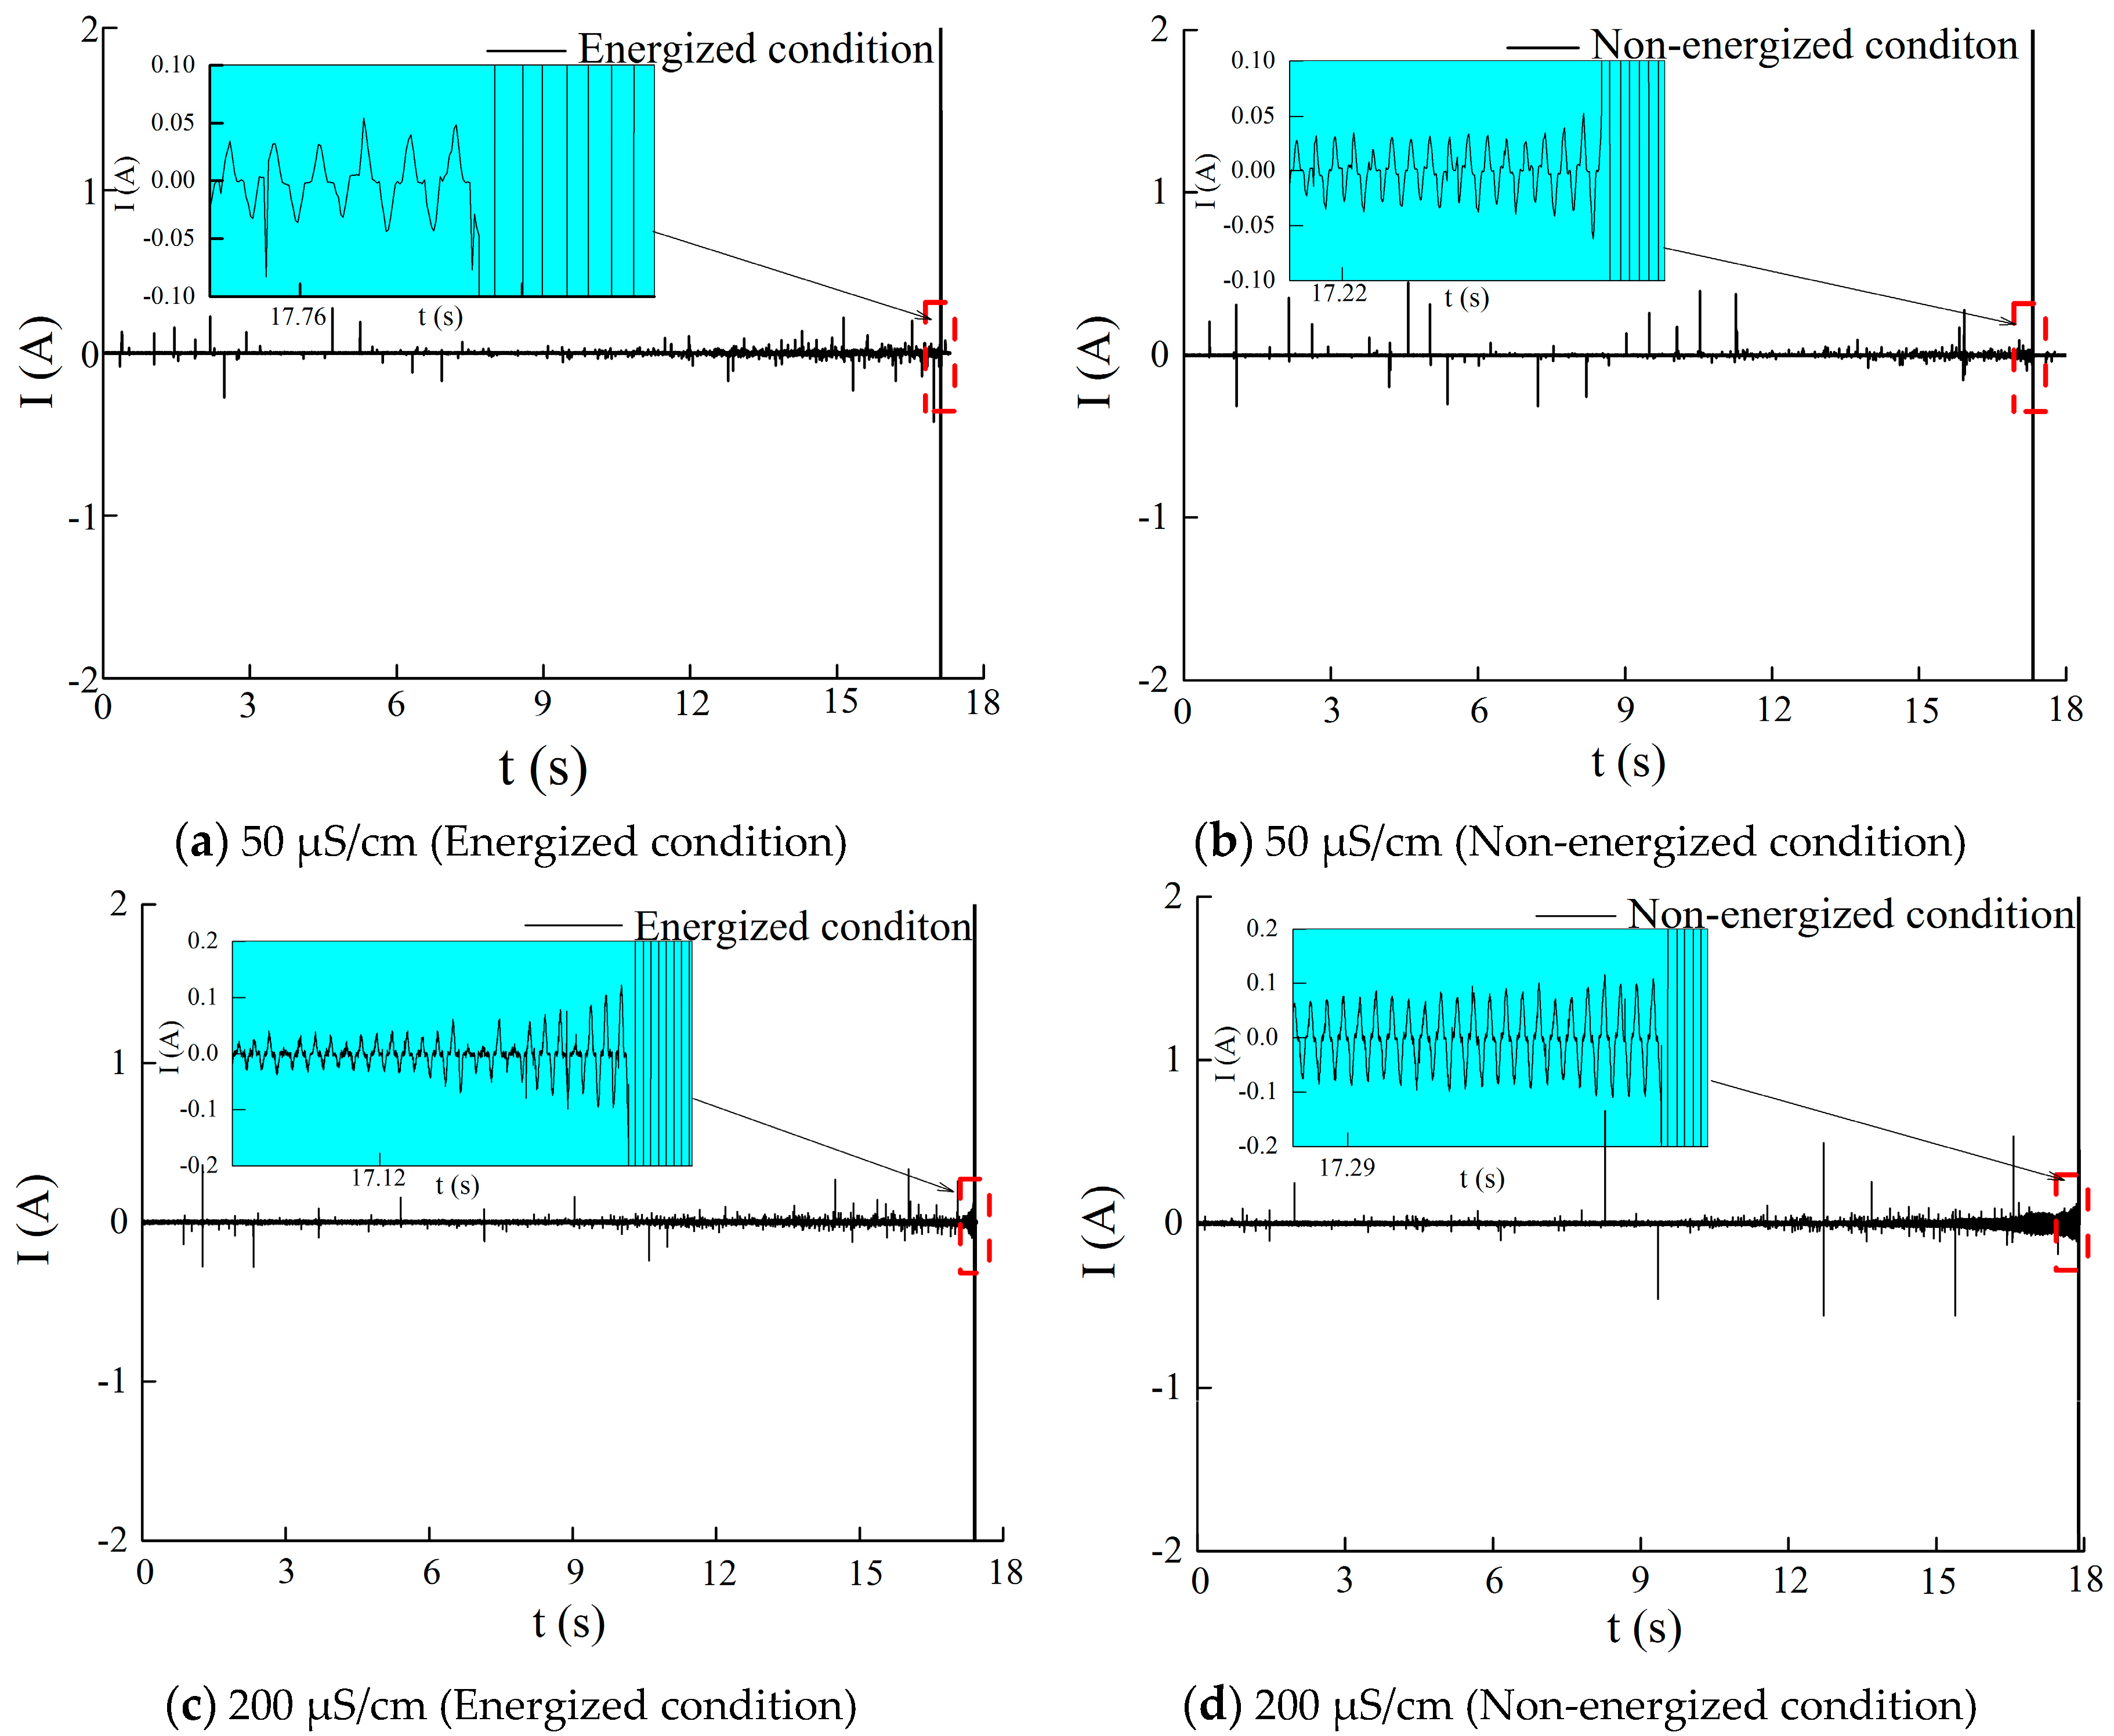
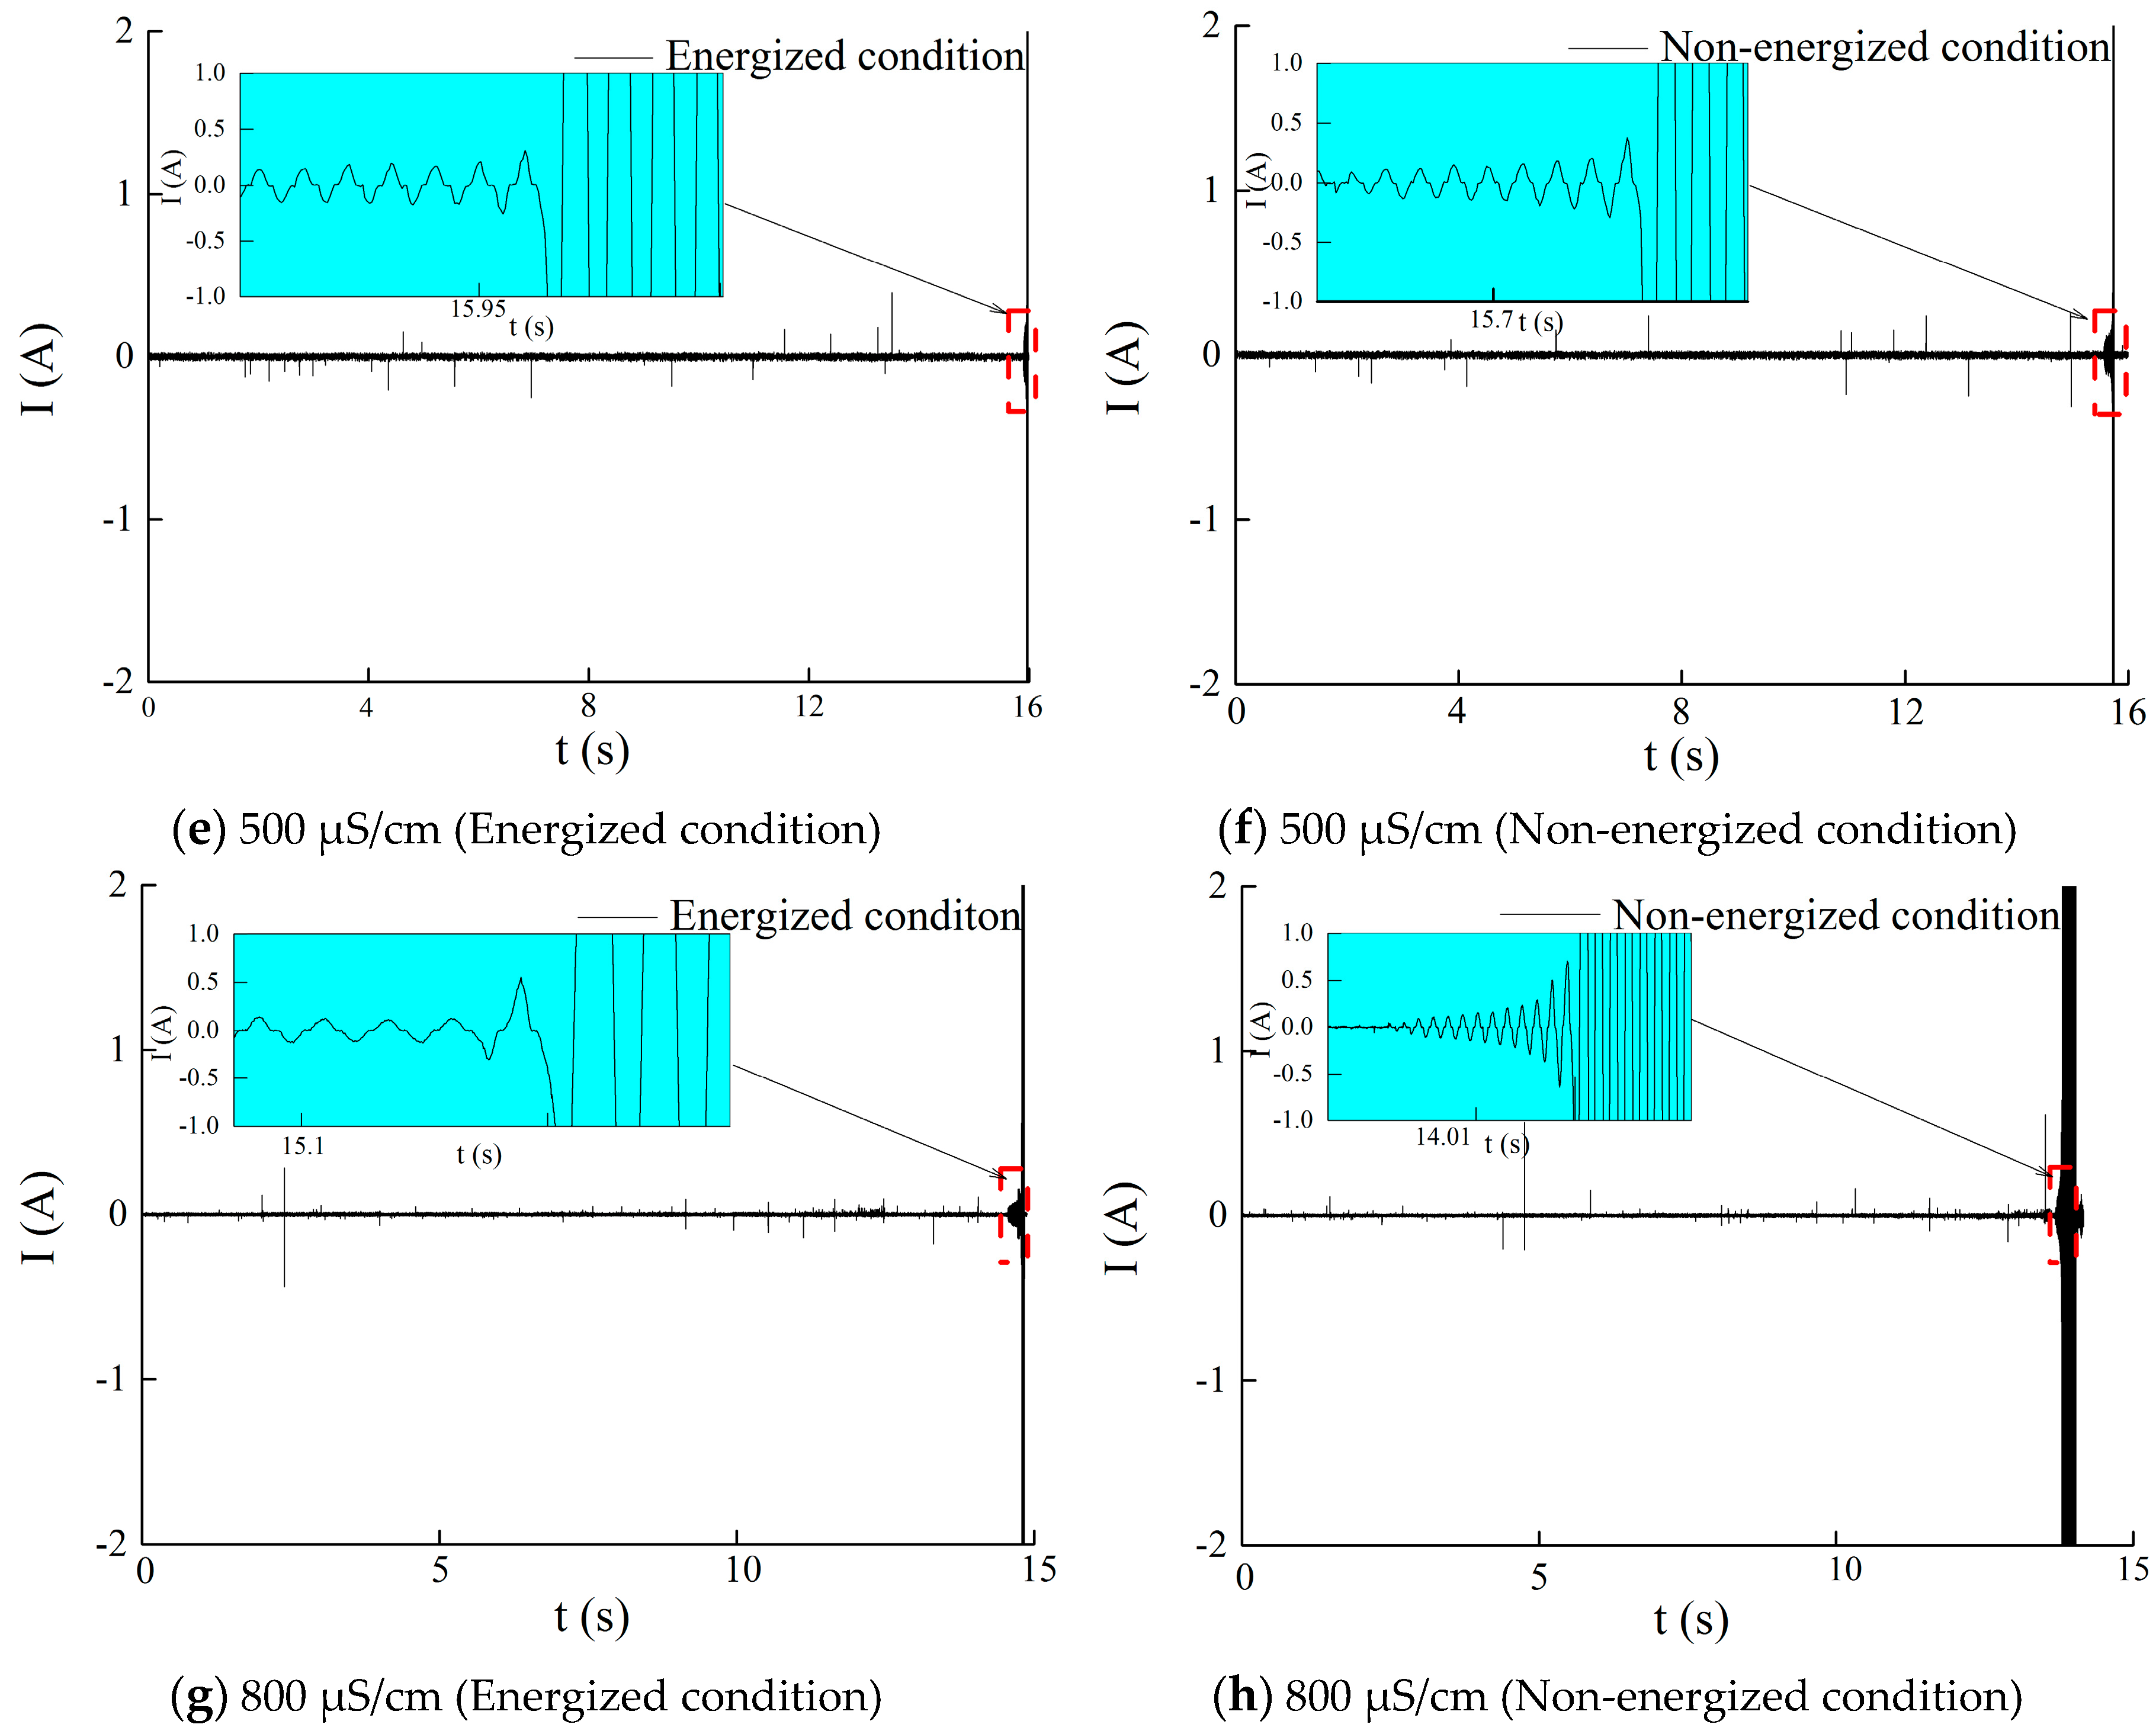
4.3.1. Effect of Freezing Water Conductivity on the Ion Distribution in the Ice Layer and Icicle of the Insulator
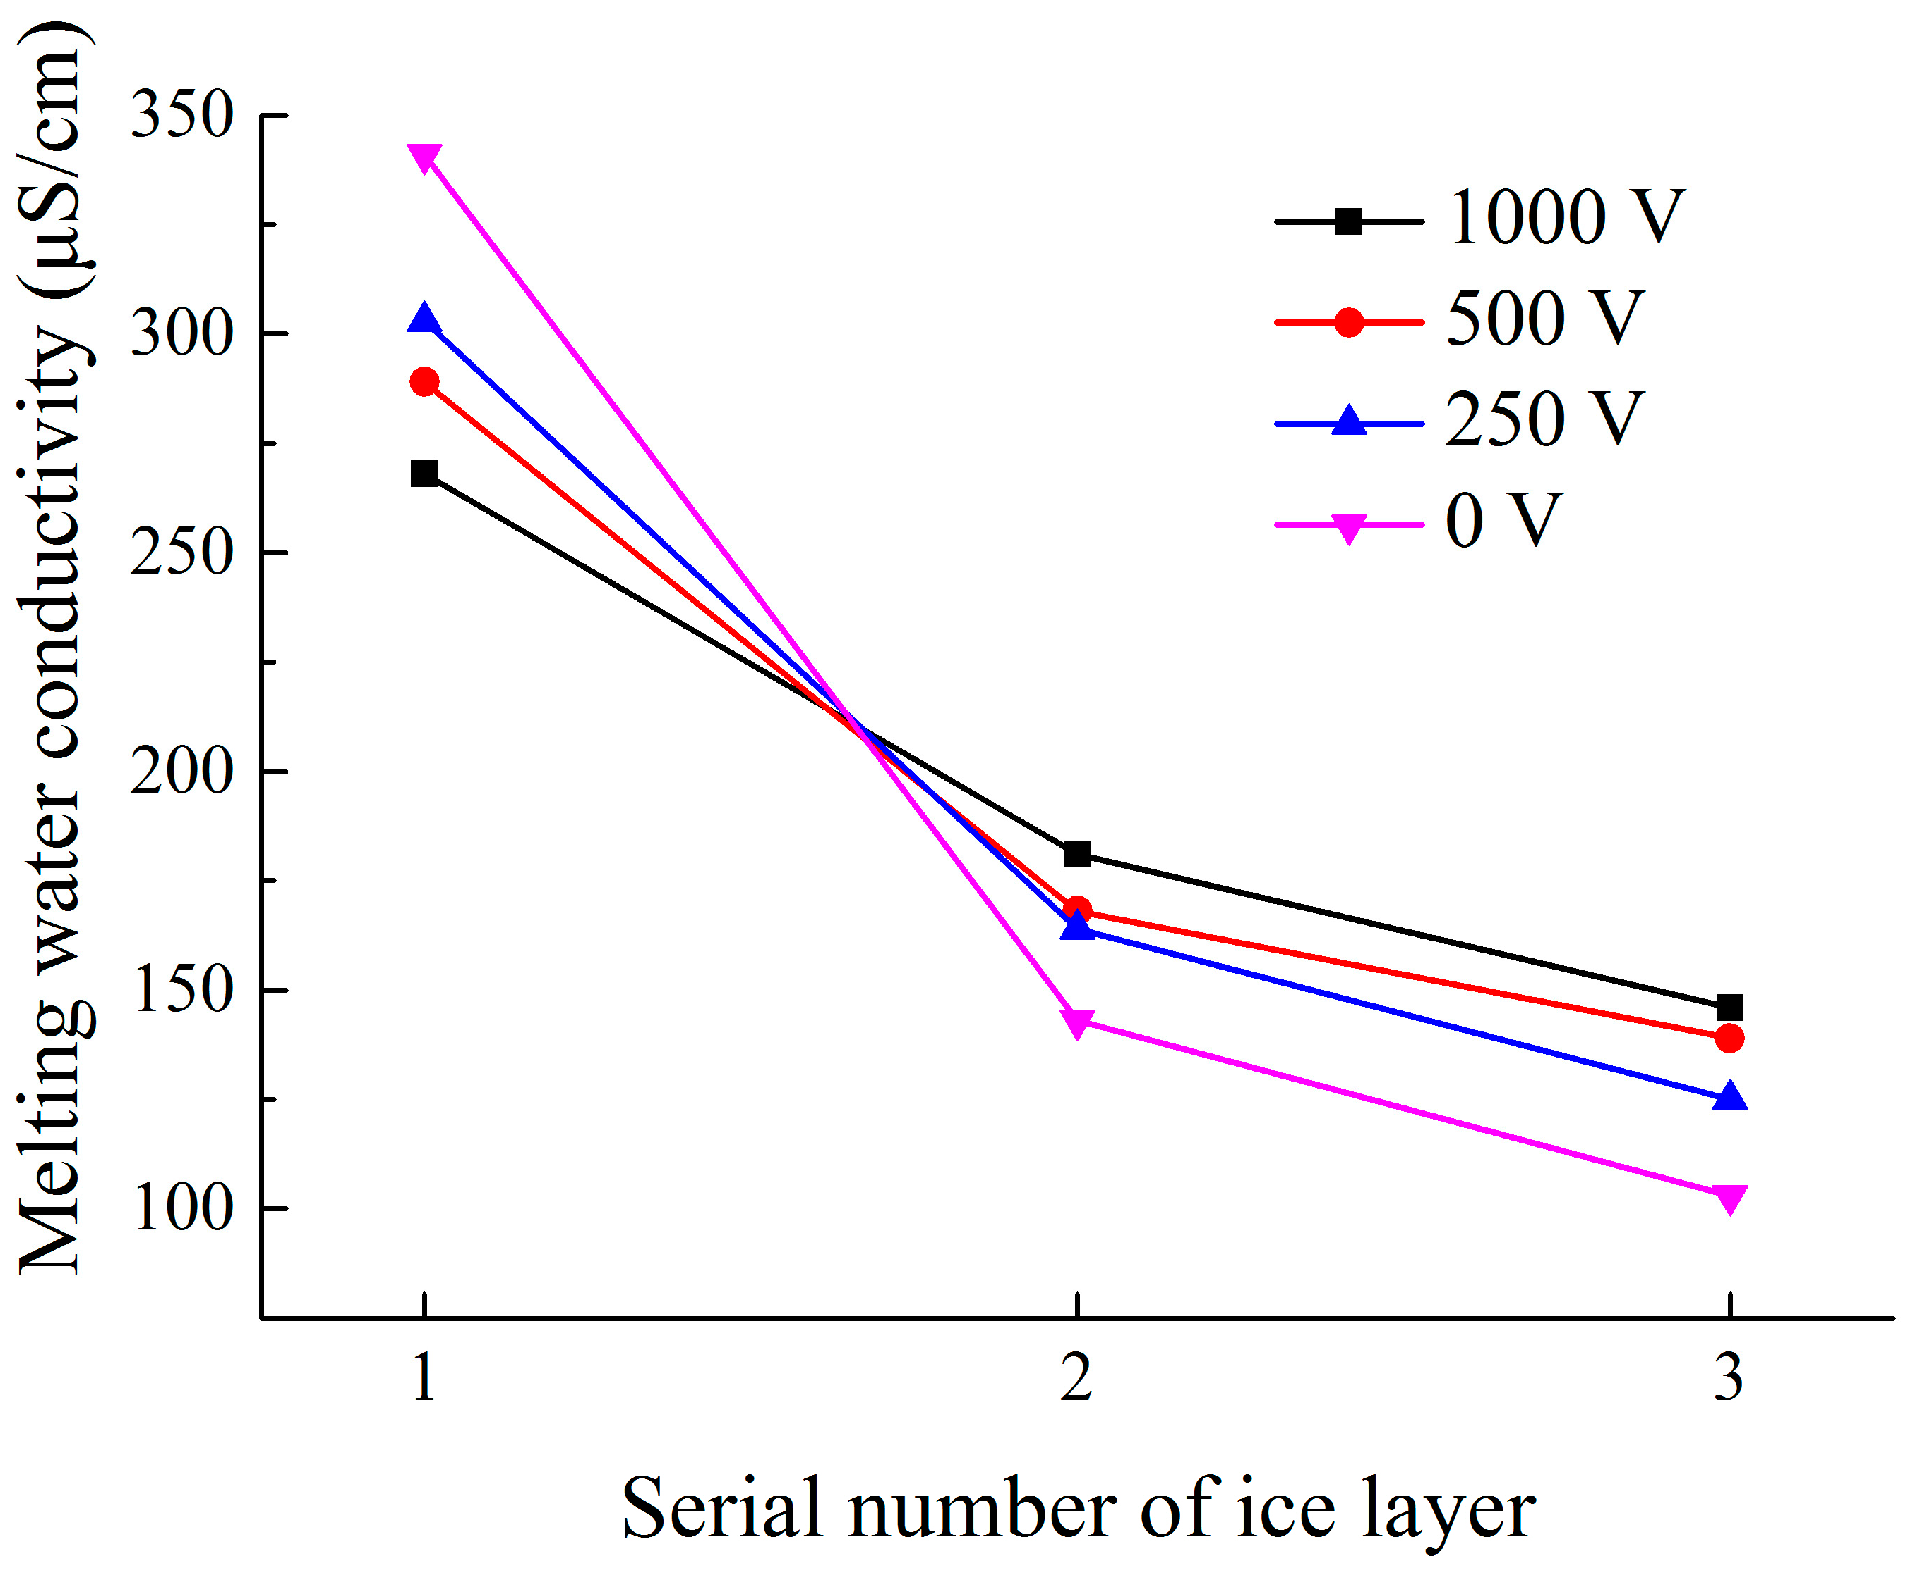
4.3.2. Effect of Insulator Suspension Position on the Ion Distribution in the Ice Layer
5. Effect of Ion Migration during Phase Transition under Alternating Electric Field on Insulator Flashover
6. Conclusions
- (1)
- The morphological change of water droplets during freezing had no obvious differences between having the amplitude of electric field (E0 = kV/m) and without electric field. The average freezing time of the water droplets with consideration of the error was almost unaffected when E0 was lower than kV/m. However, the inhibitive effects on drop freezing intensified with increasing electric field strength.
- (2)
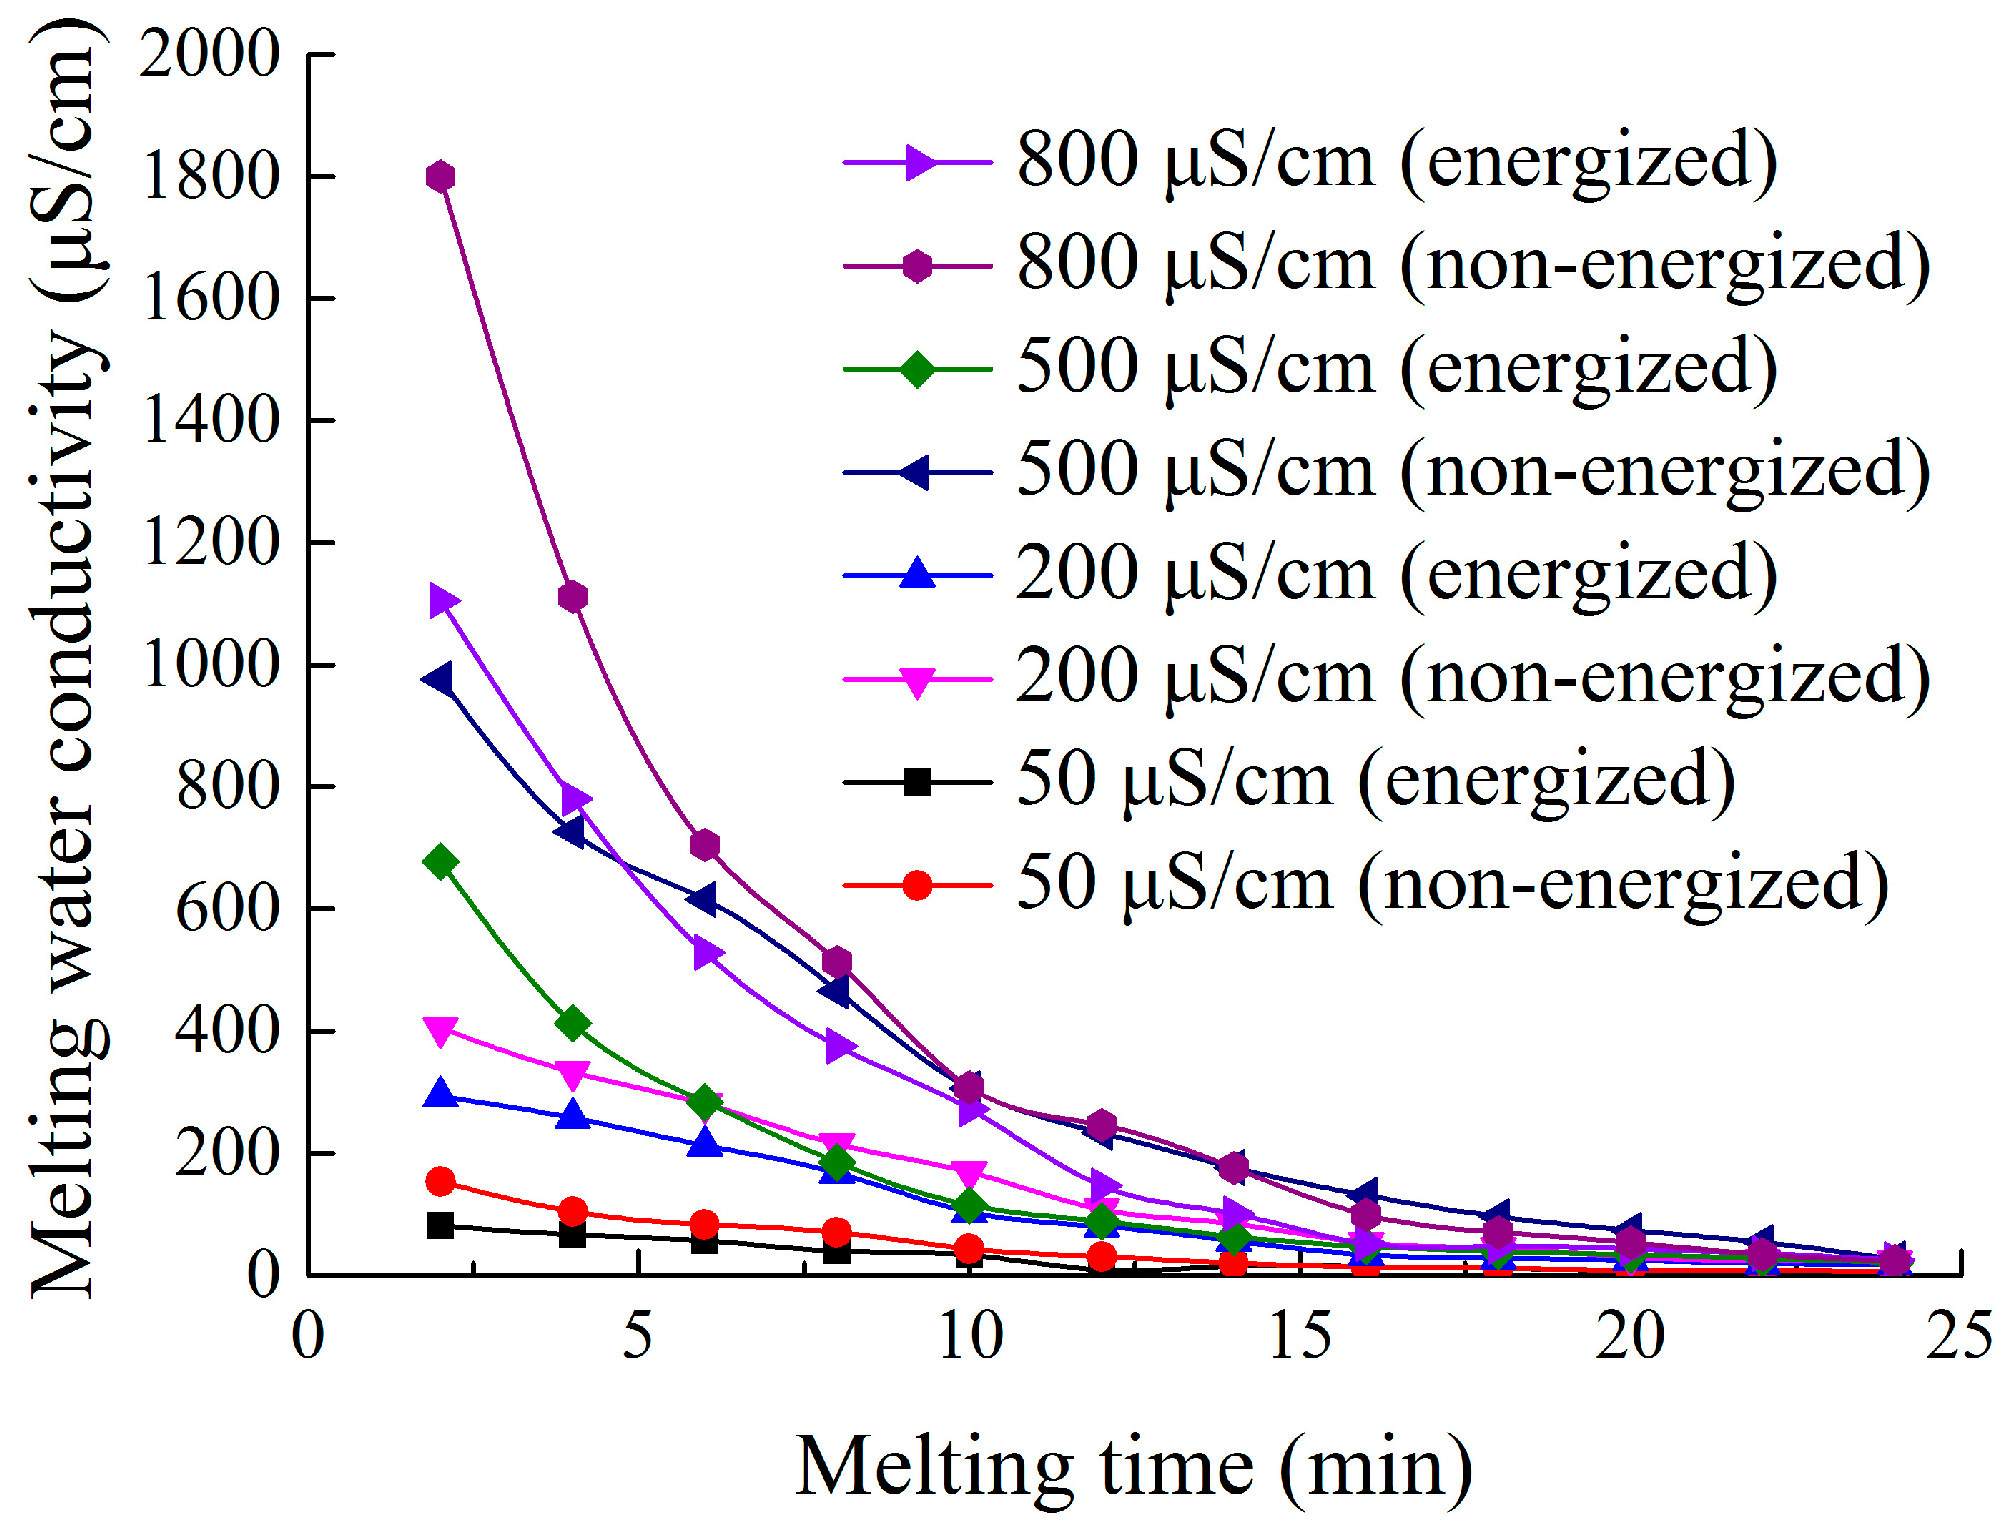
- After freezing the NaCl aqueous solution in a glass container with applied alternating voltage, the maximal melting water conductivity of the ice layer formed under the energized condition was lower than that under the non-energized condition. The extent of conductive ion migration decreased with the increasing of applied electric field strength, resulting in decreasing of the maximal melting water conductivity of ice layer.
- (3)
- The melting water conductivity of the ice layer formed under energized condition showed a non-linear decreasing relation with melting time. The maximal and minimal melting water conductivity of ice layer was higher and lower than freezing water conductivity, respectively. Icicles also had similar features. Besides, the melting water conductivity of the ice layer and icicles formed under the energized condition was lower than that under the non-energized condition.
- (4)
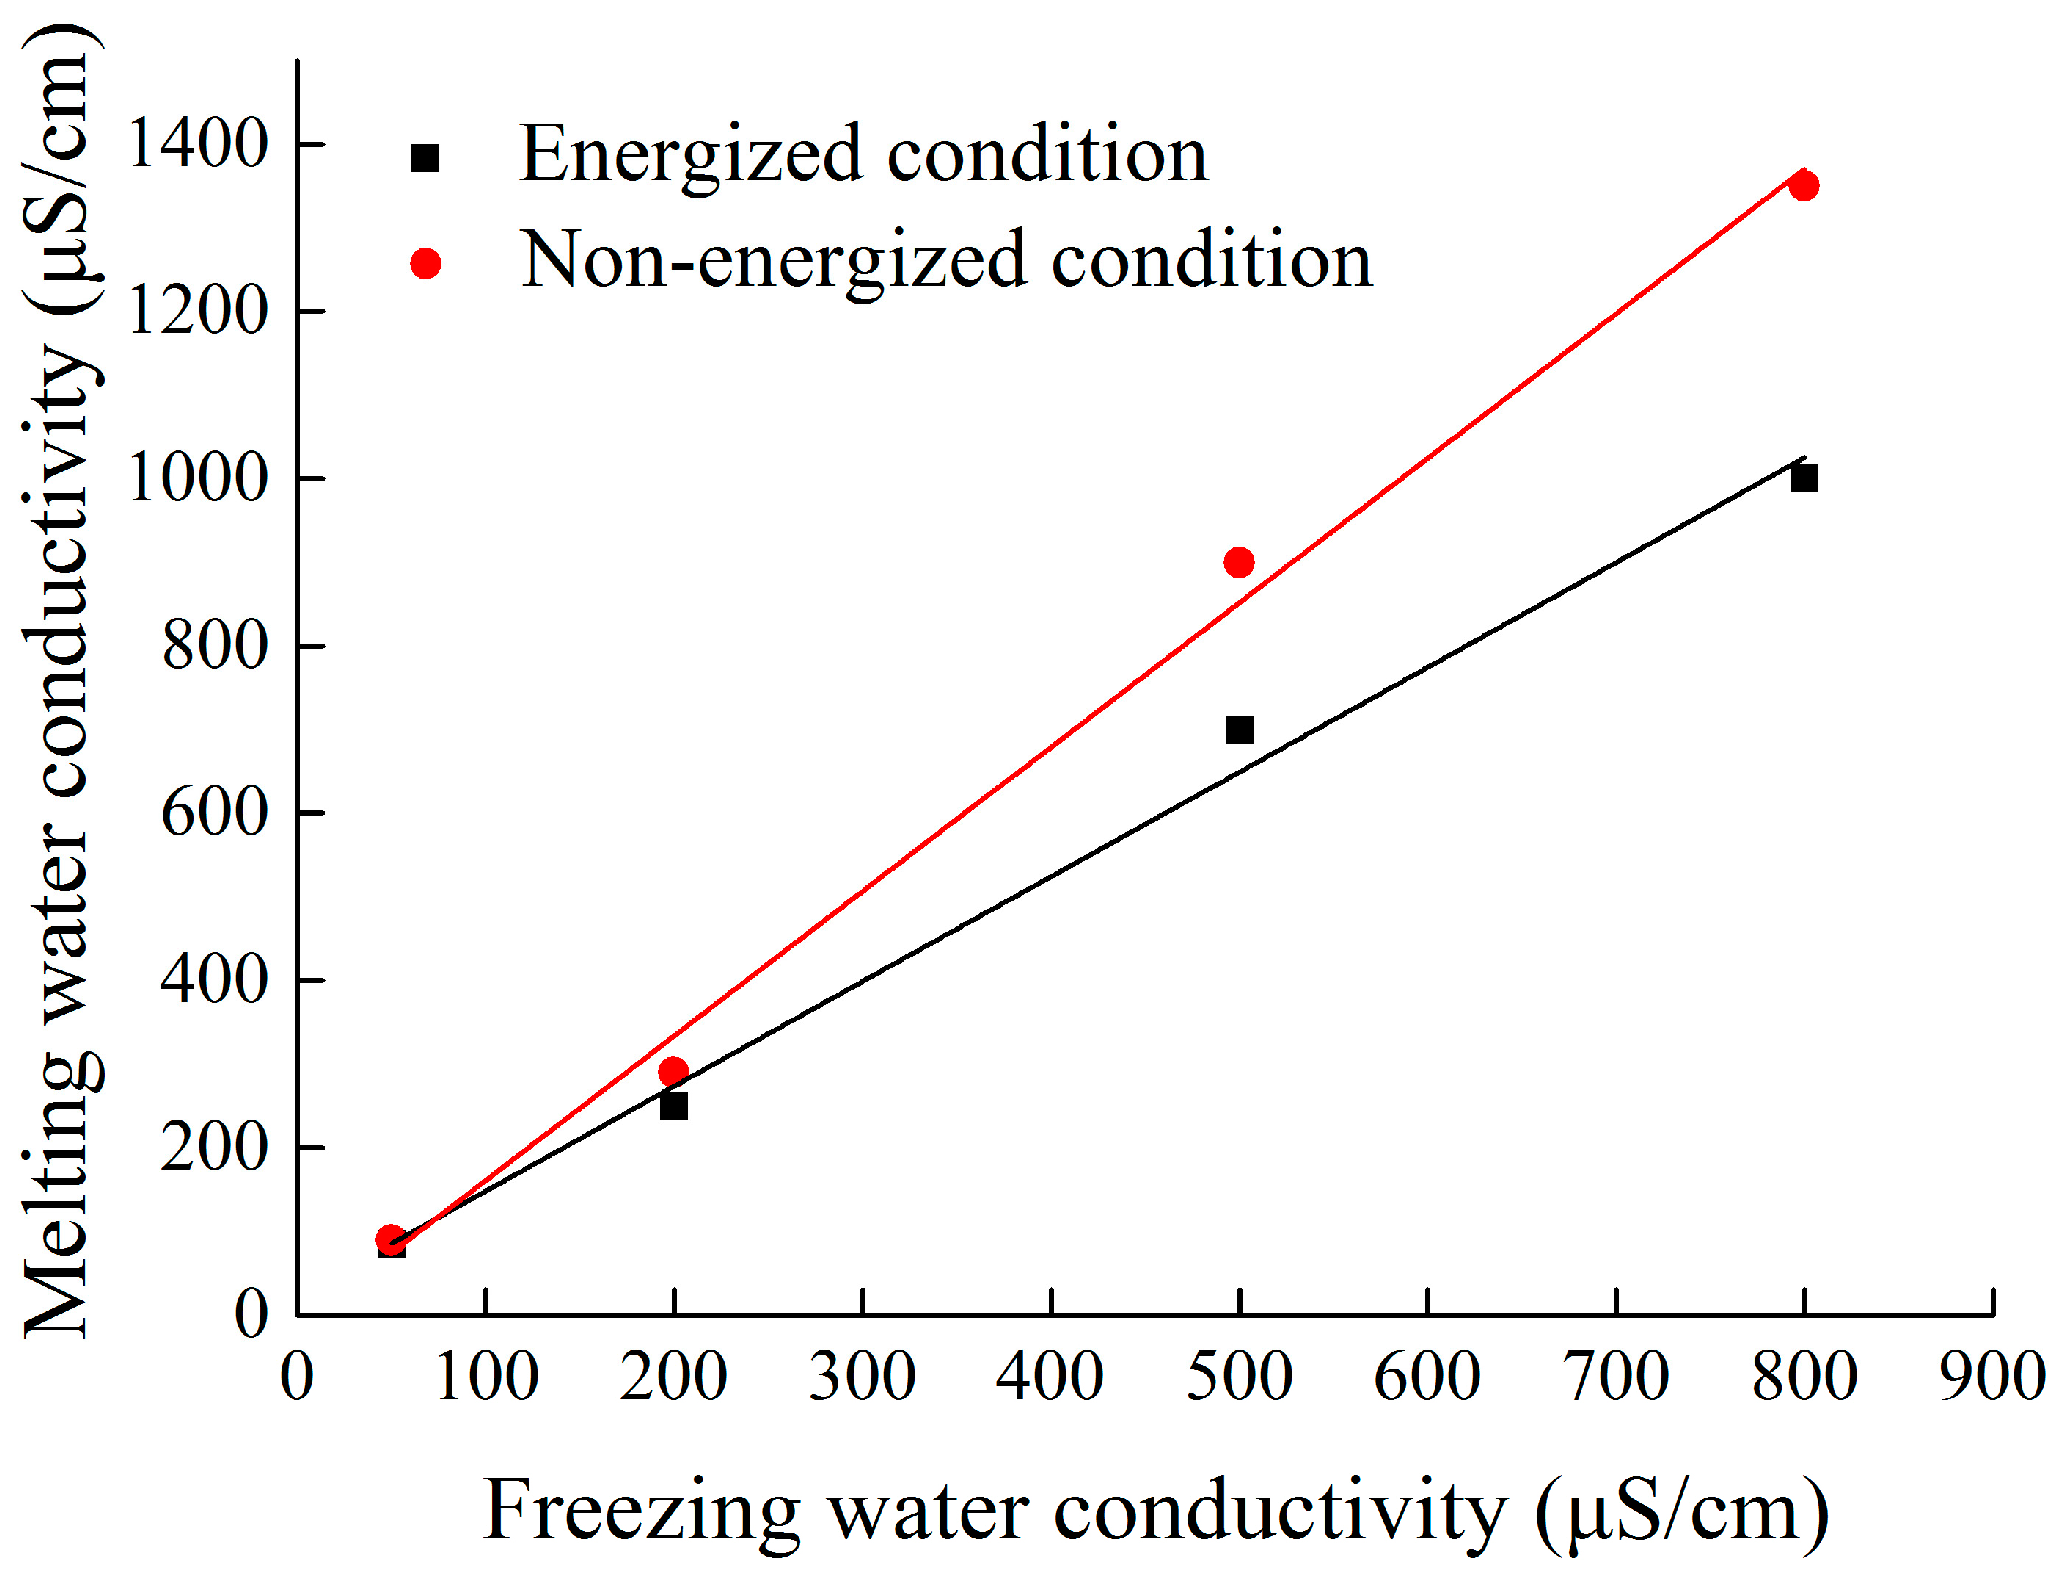
- The hanging location of each insulator obviously affected melting water conductivity. The maximal melting water conductivity of the ice layer on insulator surface gradually increased from No. 1 to No. 3 insulator (top to bottom). The melting water conductivity of ice-covered insulator string obtained during flashover had a good linear relation with freezing water conductivity, but the fitting coefficients have significant differences under energized and non-energized condition.
- (5)
- Accurately calculating the surface conductivity of ice layer formed in energized condition is an important factor to improve the predicting flashover model of ice-covered insulator. The alternating electric field affects the conductivity distribution in ice layer, which should be taken into consideration when calculating the surface conductivity of ice layer during the melting period.
Acknowledgments
Author Contributions
Conflicts of Interest
References
- Farzaneh, M. Atmospheric Icing of Power Networks; Springer: New York, NY, USA, 2008. [Google Scholar]
- Jiang, X.L.; Shu, L.C. Chinese transmission lines’ icing characteristics and analysis of severe ice accidents. Int. J. Offshore Polar Eng. 2004, 14, 196–201. [Google Scholar]
- Li, P.; Fan, J.; Li, W.; Su, Z.; Zhou, J. Flashover performance of HVDC iced insulator strings. IEEE Trans. Dielectr. Electr. Insul. 2007, 14, 1334–1338. [Google Scholar] [CrossRef]
- Farzaneh, M. Insulator Flashover under Icing Conditions. IEEE Trans. Dielectr. Electr. Insul. 2014, 21, 1997–2011. [Google Scholar] [CrossRef]
- Guan, Z.; Wang, X.; Bian, X.; Wang, L.; Jia, Z. Analysis of Causes of Outdoor Insulators Damages on HV and UHV Transmission Lines in China. In Proceedings of the Electrical Insulation Conference, Philadelphia, PA, USA, 8–11 June 2014.
- Liu, Y.; Gao, S.; Huang, D.; Yao, T.; Wu, X.; Hu, Y.; Cai, W. Icing Flashover Characteristics and Discharge Process of 500 kV AC Transmission Line Suspension Insulator Strings. IEEE Trans. Dielectr. Electr. Insul. 2010, 17, 434–442. [Google Scholar] [CrossRef]
- Shu, L.; Wang, S. Influences of Grading Ring Arrangement on AC Flashover Performance of 220 kV Ice-covered Composite Insulators. IEEE Trans. Dielectr. Electr. Insul. 2014, 21, 2652–2661. [Google Scholar] [CrossRef]
- Hu, Q.; Yuan, W. Effects of Electric Field Distribution on Icing and Flashover Performance of 220 kV Composite Insulators. IEEE Trans. Dielectr. Electr. Insul. 2014, 21, 2181–2189. [Google Scholar]
- International Electrotechnical Commission (IEC). Selection and Dimensioning of High-Voltage Insulators Intended for Use in Polluted Condition—Part 3: Polymer Insulators for AC System; IEC/TS 60815-3; International Electrotechnical Commission (IEC): Geneva, Switzerland, 2008. [Google Scholar]
- Jiang, X.; Sun, C.; Sima, W.; Tian, Y.; Shu, L. AC Flashover Performance and Voltage Correction of 27.5 and 110 kV Iced Composite Insulator at 4000–5500 m High Altitude Districts. In Proceedings of the IEEE International Conference on Power System Technology 2002, Kunming, China, 13–17 October 2002; Volume 3, pp. 1890–1894.
- Feuillebois, F.; Laesk, A. Freezing of a Subcooled Liquid Droplet. J. Colloid Interface Sci. 1995, 169, 90–102. [Google Scholar] [CrossRef]
- Strub, M.; Jbabour, O. Experimental Study and Modelling of the Crystallization of a water droplet. Int. J. Refrig. 2003, 26, 59–68. [Google Scholar] [CrossRef]
- Vanfieet, R.R.; Mohel, J.M. Thermodynamics of Melting and freezing in small particles. Surf. Sci. 1995, 341, 40–50. [Google Scholar] [CrossRef]
- Farzaneh, M.; Zhang, J. A Laboratory Study of Leakage Current and Surface Conductivity of Ice Samples. In Proceedings of the IEEE 1994 Annual Report Conference on Electrical Insulation and Dielectric Phenomena, Arlington, MA, USA, 23–26 October 1994; pp. 631–638.
- Zhang, J.; Farzaneh, M. Variation of Ice Surface Conductivity during Flashover. In Proceedings of the IEEE 1995 Annual Report Conference on Electrical Insulation and Dielectric Phenomena, Virginia Beach, VA, USA, 22–25 October 1995; pp. 479–483.
- Meghnefi, F.; Farzaneh, M. Measurement of the Evolution of Dripping Water Conductivity of an Ice-covered Insulator during a Melting Period. In Proceedings of the IEEE Conference on Electrical Insulation and Dielectric Phenomena, Quebec, QC, Canada, 26–29 October 2008; pp. 236–239.
- Deng, Y.; Jia, Z. Mechanism of Salt Migration in Icicles during Phase Transition and Its Impact on Ice Flashover. IEEE Trans. Dielectr. Electr. Insul. 2012, 19, 1700–1707. [Google Scholar] [CrossRef]
- Hoke, J.L. The Interaction between the Substrate and Frost through Condensate Distribution. Ph.D. Thesis, University of Illinois, Urbana Champaign, IL, USA, 2000. [Google Scholar]
- Sun, W.; Xu, X. Effects of dipole polarization of water molecules on ice formation under an electrostatic field. Cryobiology 2008, 56, 93–99. [Google Scholar]
- Chen, S.L.; Lee, T.S. A study of super-cooling phenomenon and freezing probablility of water inside horizontal cylinders. Int. J. Heat Mass Transf. 1998, 41, 769–783. [Google Scholar] [CrossRef]
- Svishchev, I.M.; Kusalik, P.G. Crystallization of liquid water in a molecular dynamics simulation. Phys. Rev. Lett. 1994, 73, 975–978. [Google Scholar] [CrossRef] [PubMed]
- Shichiri, T.; Araki, Y. Nucleation mechanism of ice crystals under electrical effect. J. Cryst. Growth 1986, 78, 502–508. [Google Scholar] [CrossRef]
- Donald, G.; Archer, L. The Dielectric Constant of Water and Debye-Hückel Limiting Law Slopes. J. Phys. Chem. Ref. Data 1990, 9, 371–411. [Google Scholar]
- Sugawara, N.; Ito, S. AC Surface Flashover Voltage of Ice Depending on Soluble Ions. In Proceedings of the 1998 International Symposium on Electrical Insulating Materials, Toyohashi, Japan, 30 September 1998; pp. 433–436.
- IEEE Guide for Test Methods and Procedures to Evaluate the Electrical Performance of Insulators in Freezing Conditions; IEEE Std. 1783-2009; The Institute of Electrical and Electronics Engineers, Inc.: New York, NY, USA, 2009.
- Jiang, X.; Chen, X. Equivalence of Influence of Pollution Simulating Methods on DC Flashover Stress of Ice-covered Insulators. IEEE Trans. Power Deliv. 2010, 25, 2113–2120. [Google Scholar] [CrossRef]
- Jiang, X.; Wang, S. Study on AC Flashover Performance and Discharge Process of Polluted and Iced IEC Standard Suspension Insulator String. IEEE Trans. Power Deliv. 2007, 22, 472–480. [Google Scholar] [CrossRef]
- Hu, J.; Sun, C. Model for Predicting DC Flashover Voltage of Pre-Contaminated and Ice-Covered Long Insulator Strings under Low Air Pressure. Energies 2011, 4, 628–643. [Google Scholar] [CrossRef]
- Deng, Y.; Jia, Z.; Guan, Z.; Zhou, J. Effects of electric field distribution and water drop ejection on flashover of icicles in plane-to-plane gaps. IEEE Trans. Dielectr. Electr. Insul. 2015, 22, 775–781. [Google Scholar] [CrossRef]
- Farzaneh, M.; Chen, X. The influence of applied voltage on the surface conductivity of atmospheric ice deposited on insulating surfaces. In Proceedings of the Conference Record of the 1996 IEEE International Symposium on Electrical Insulation, Montreal, QC, Canada, 16–19 June 1996; pp. 16–19.
- Fofana, I.; Farzaneh, M. Application of dynamic model to flashover of ice-covered insulators. IEEE Trans. Dielectr. Electr. Insul. 2007, 14, 1410–1417. [Google Scholar] [CrossRef]
- Zhang, Z.; Zhang, D. Effects of Pollution Materials on the AC Flashover Performance of Suspension Insulators. IEEE Trans. Dielectr. Electr. Insul. 2015, 22, 1000–1008. [Google Scholar] [CrossRef]
- Farzaneh, M.; Zhang, J. Modeling of the AC arc discharge on ice surfaces. IEEE Trans. Power Deliv. 1997, 12, 325–338. [Google Scholar] [CrossRef]
- Yang, Q.; Wang, R. Electrical Circuit Flashover Model of Polluted Insulators under AC Voltage Based on the Arc Root Voltage Gradient Criterion. Energies 2012, 5, 752–769. [Google Scholar] [CrossRef] [Green Version]


| E0 (kV/m) | 0 | |||||||
| Average Freezing Time (s) | 73.9 | 74.1 | 74.1 | 74.4 | 75.3 | 76.4 | 79.1 | 80.5 |
| Variance of Measuring Values | 0.00895 | 0.0064 | 0.0128 | 0.028878 | 0.0395 | 0.0253 | 0.01346 | 0.0338 |
| Parameters | Profile | |||||
|---|---|---|---|---|---|---|
| D (mm) | H (mm) | L (mm) | I (kV) | F (kV) | M (kV) | 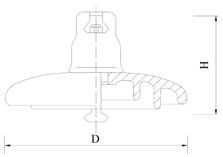 |
| 280 | 146 | 450 | 110 | 45 | 130 | |
| Product Models | Sony FDR-AX30 |
|---|---|
| Sensor pixel | About 18.90 mega pixels |
| Type of sensor | Exmor R CMOS |
| Image resolution | AVCHD model: 1920 × 1080/50p |
| Linear Fitting Expression: γmelting = Aσfreezing + B A,B: the Fitting Coefficients; R2: the Square of Correlation Coefficient | |||
|---|---|---|---|
| Condition | A | B | R2 |
| Energized | 1.28 | 22.8 | 0.973 |
| Non-energized | 1.69 | 0.97 | 0.988 |
| Freezing Water Conductivity (μS/cm) | 50 | 200 | 500 | 800 | |
|---|---|---|---|---|---|
| Umf (kV) | Energized condition | 97.4 | 74.0 | 59.2 | 49.4 |
| Non-energized condition | 96.9 | 69.5 | 52.7 | 39.1 | |
© 2017 by the authors; licensee MDPI, Basel, Switzerland. This article is an open access article distributed under the terms and conditions of the Creative Commons Attribution (CC-BY) license (http://creativecommons.org/licenses/by/4.0/).
Share and Cite
Jiang, X.; Wang, Q.; Zhang, Z.; Hu, J.; Hu, Q.; Zhu, C. Ion Migration in the Process of Water Freezing under Alternating Electric Field and Its Impact on Insulator Flashover. Energies 2017, 10, 61. https://doi.org/10.3390/en10010061
Jiang X, Wang Q, Zhang Z, Hu J, Hu Q, Zhu C. Ion Migration in the Process of Water Freezing under Alternating Electric Field and Its Impact on Insulator Flashover. Energies. 2017; 10(1):61. https://doi.org/10.3390/en10010061
Chicago/Turabian StyleJiang, Xingliang, Quanlin Wang, Zhijing Zhang, Jianlin Hu, Qin Hu, and Chengzhi Zhu. 2017. "Ion Migration in the Process of Water Freezing under Alternating Electric Field and Its Impact on Insulator Flashover" Energies 10, no. 1: 61. https://doi.org/10.3390/en10010061
APA StyleJiang, X., Wang, Q., Zhang, Z., Hu, J., Hu, Q., & Zhu, C. (2017). Ion Migration in the Process of Water Freezing under Alternating Electric Field and Its Impact on Insulator Flashover. Energies, 10(1), 61. https://doi.org/10.3390/en10010061