
Hybrid Off-Grid SPV/WTG Power System for Remote Cellular Base Stations Towards Green and Sustainable Cellular Networks in South Korea


Abstract
:1. Introduction
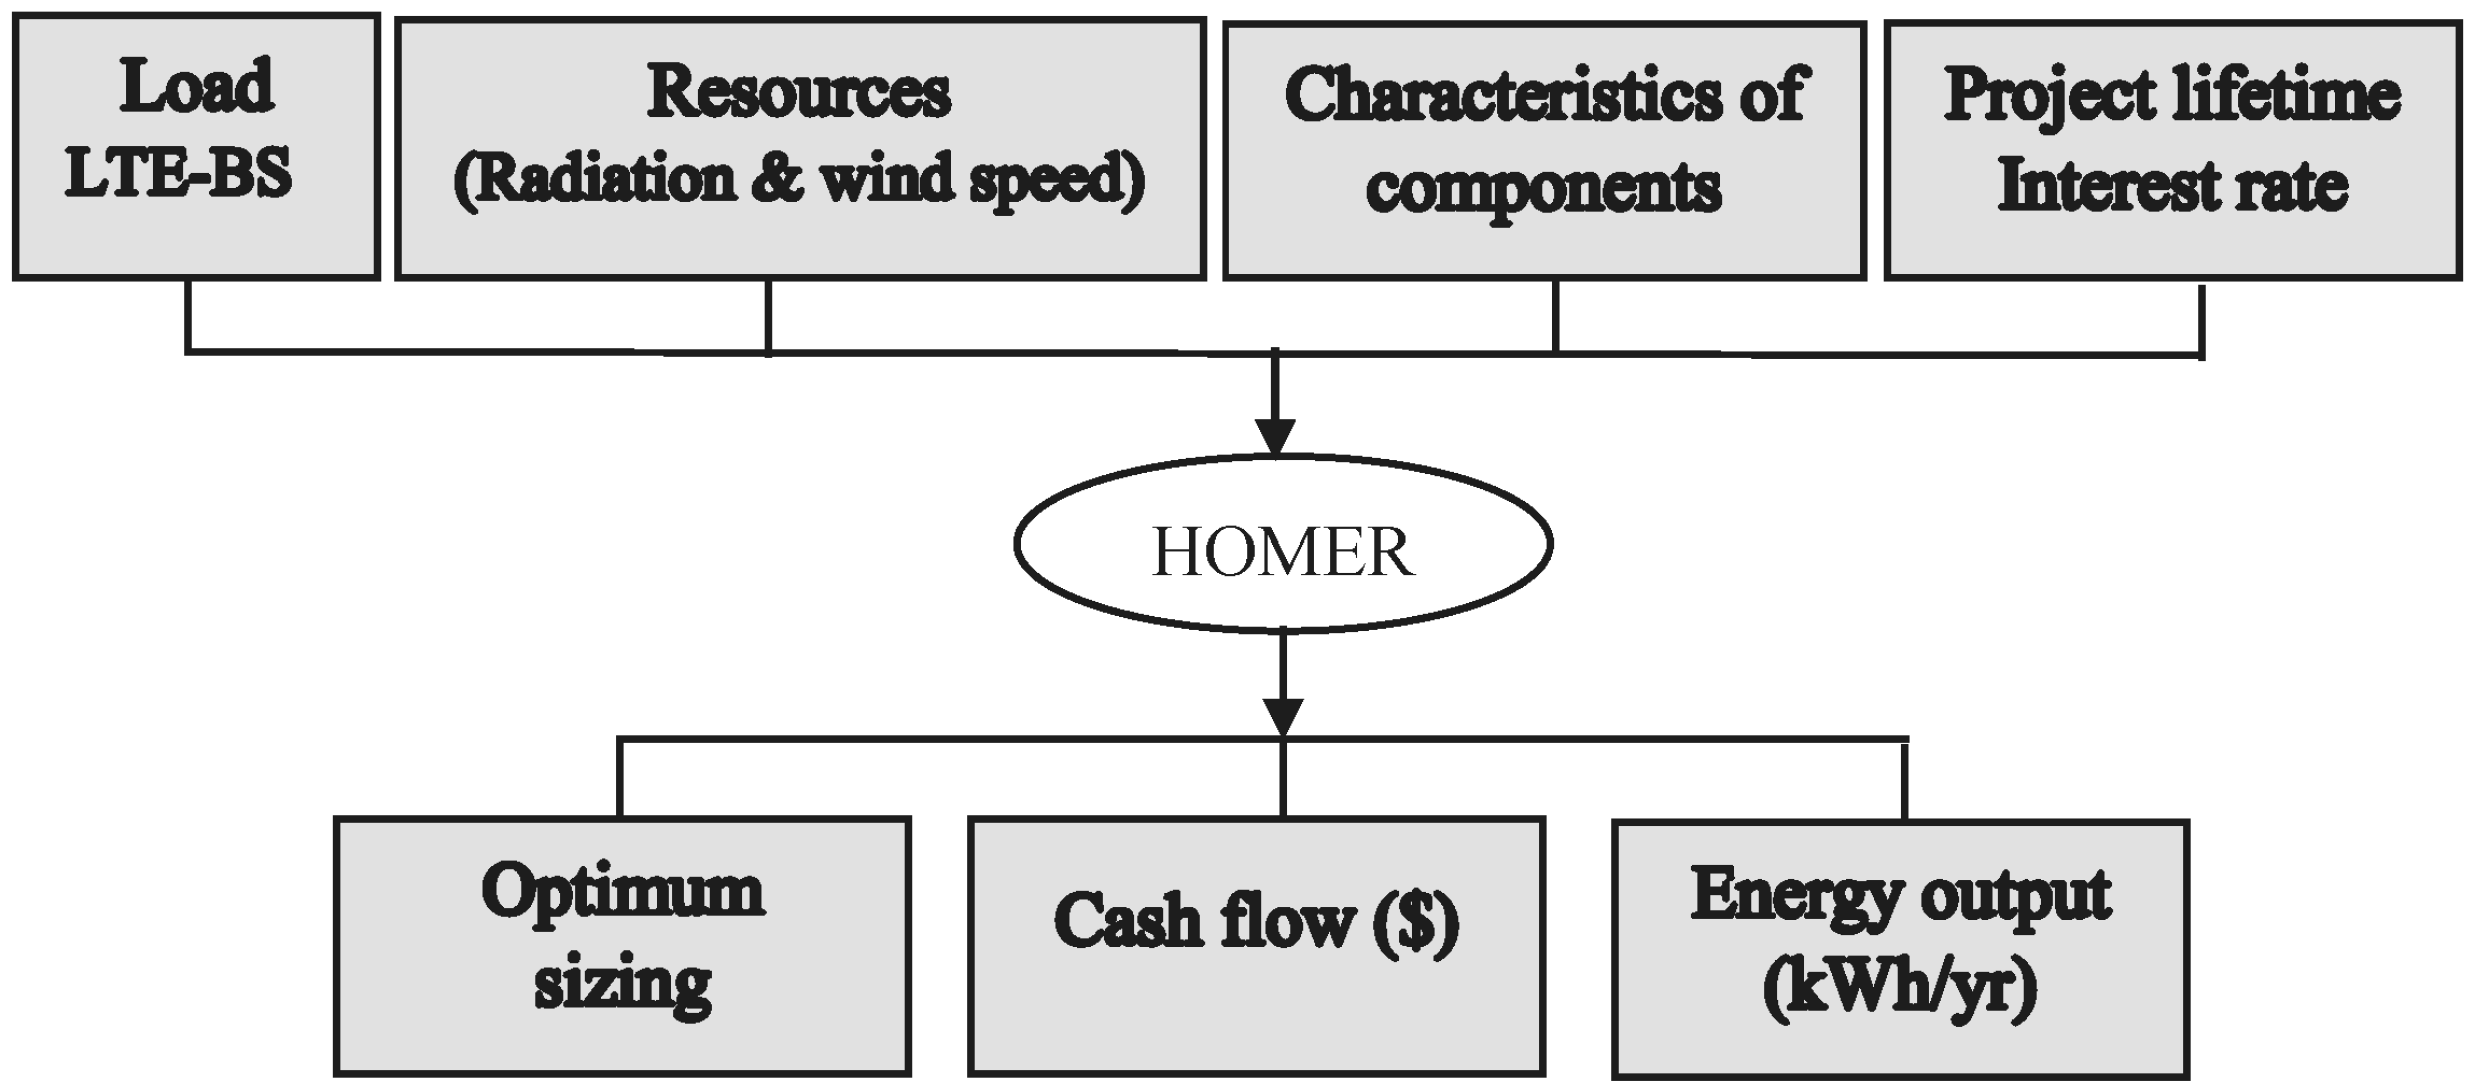
- To determine the optimal size and technical criteria of the hybrid SPV/WTG system to feed LTE-macro BS deployment at off-grid sites of South Korea. The optimum criteria, including economic, technical, and environmental feasibility parameters, were analysed by the Hybrid Optimisation Model for Electric Renewable (HOMER).
- To analyse and evaluate the feasibility of using a hybrid SPV/WTG system in terms of the energy yield and economic feasibility over the project lifetime.
- To analyse and compare the implications of choosing a hybrid SPV/WTG system with respect to a classical DG powered solution in terms of the (i) OPEX savings to maintain profitability for cellular network operators and (ii) GHG emissions that have a bad effect on the environment.
2. Power Supply and Energy Storage Solutions for Off-Grid Base Stations
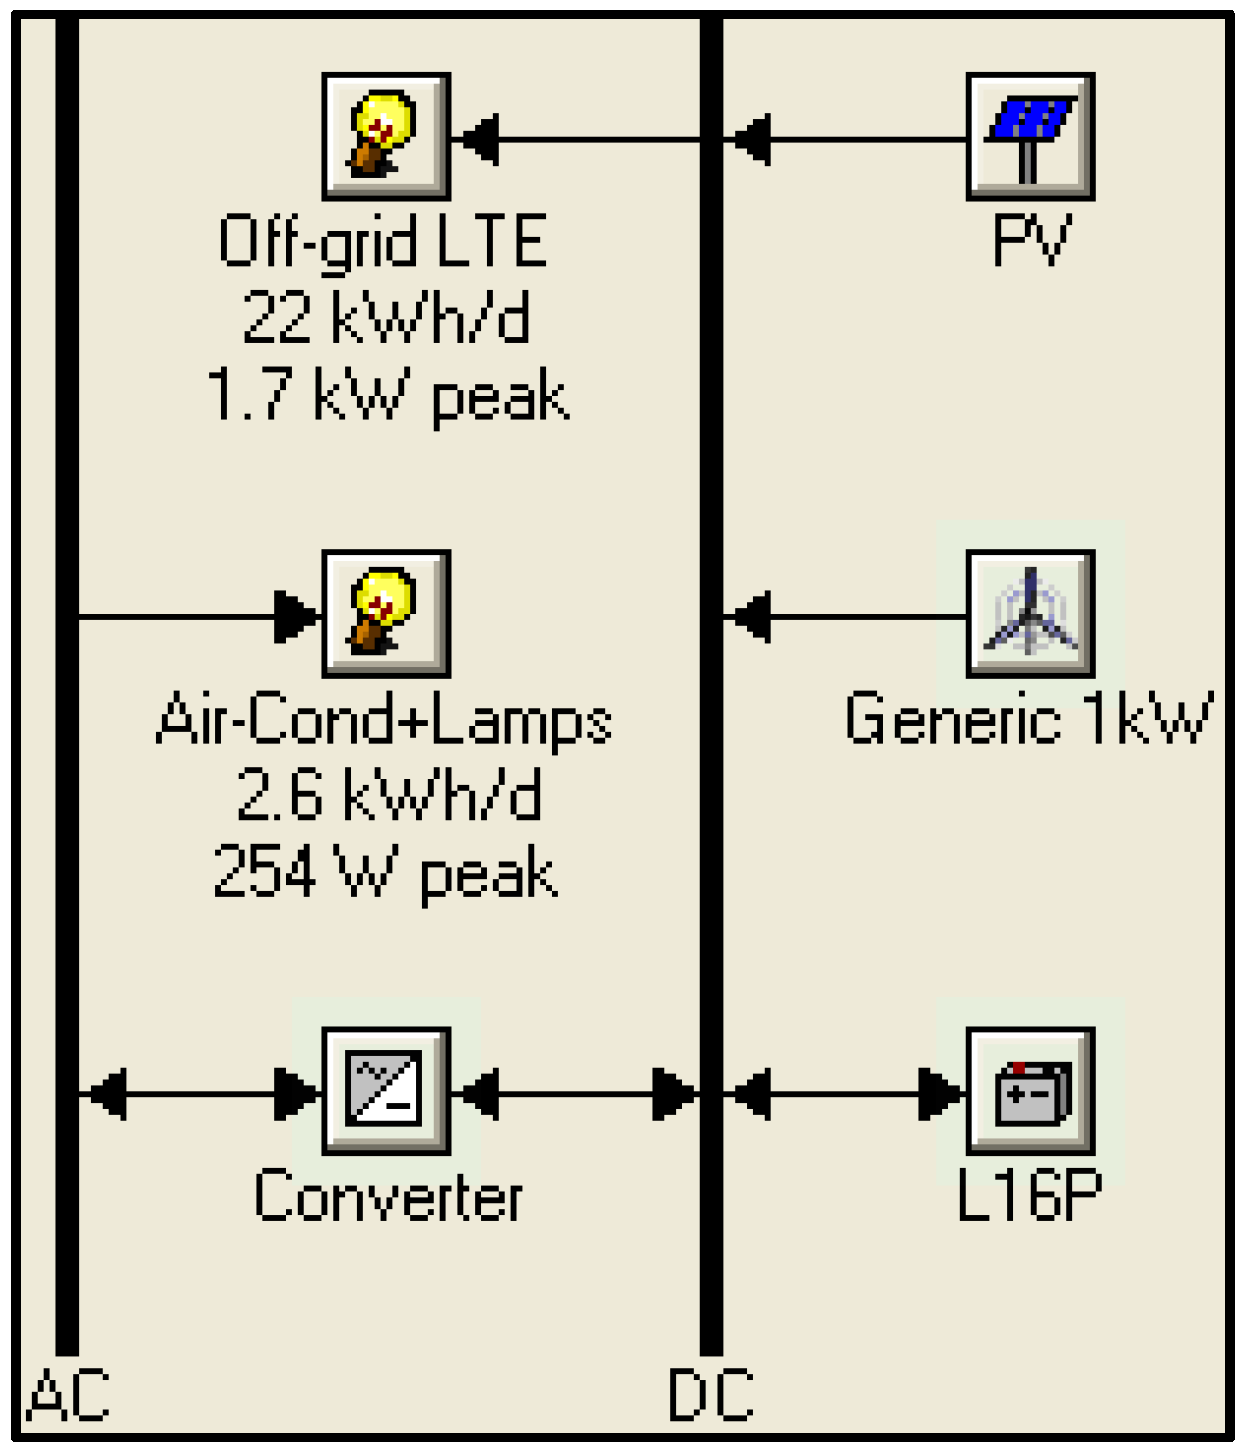
3. System Architecture
3.1. LTE Macro-BS Subsystem and Power Consumption Modeling
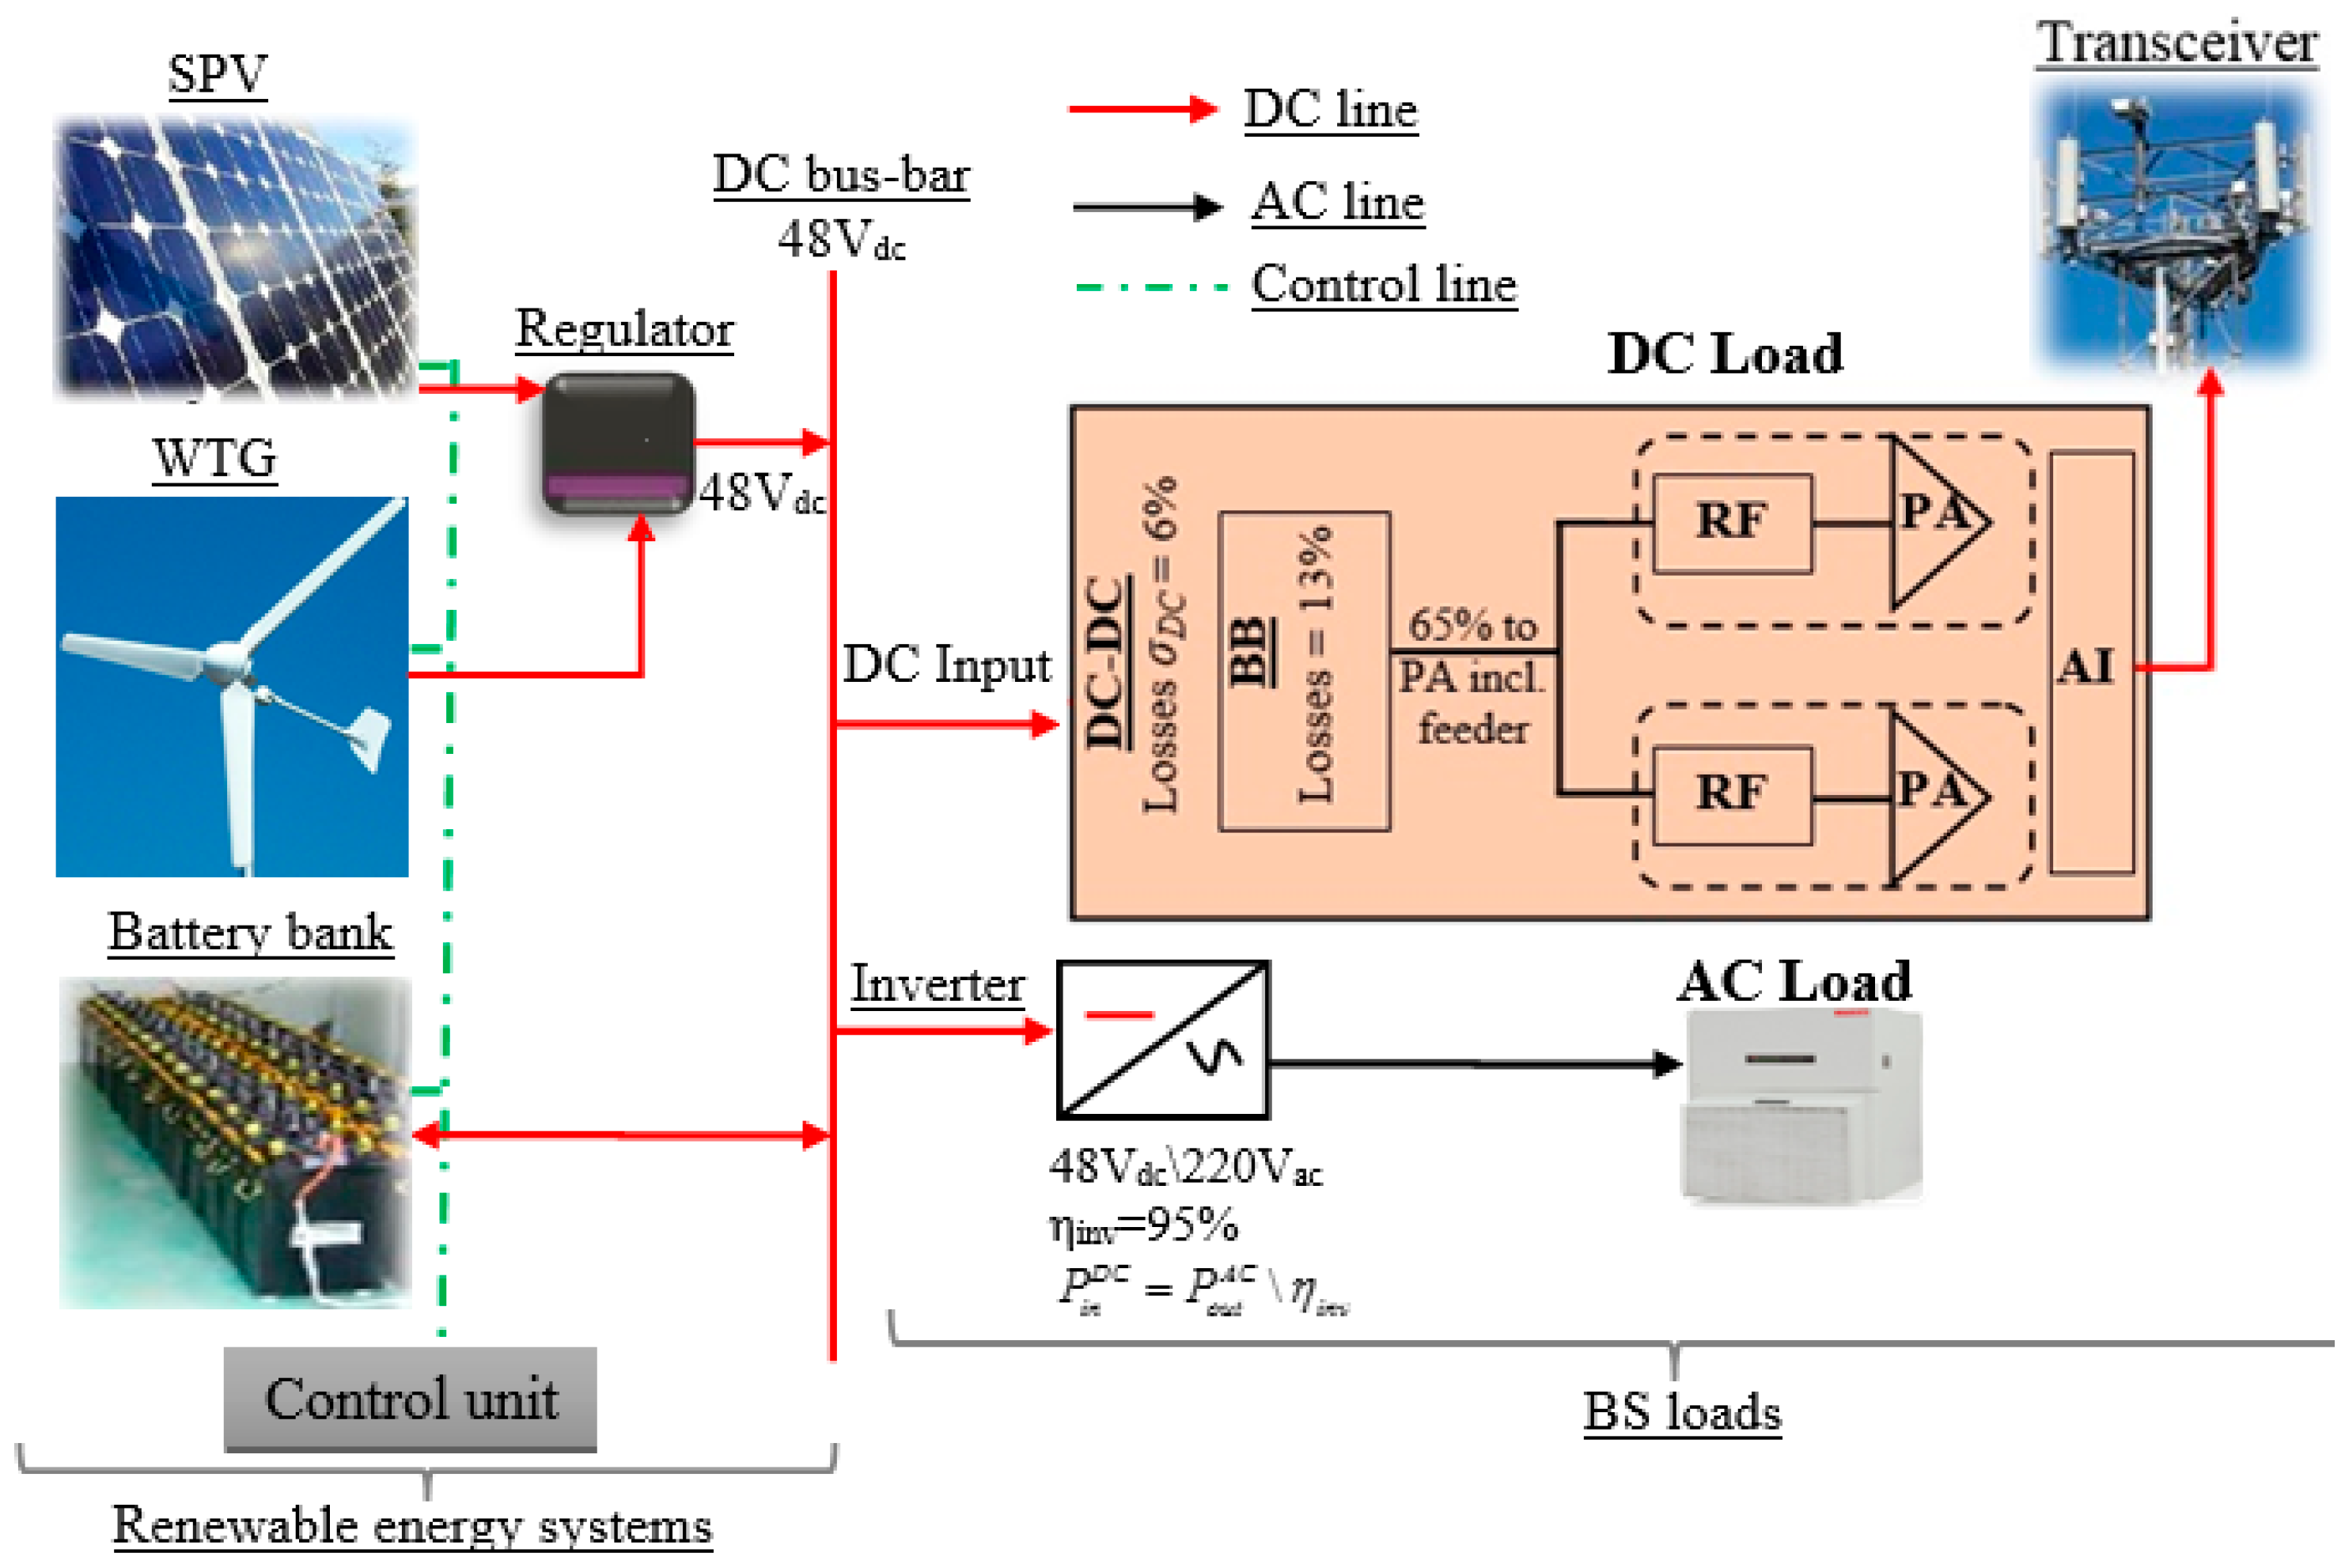
3.2. SPV/WTG Power Subsystem
- Solar panels: responsible for absorbing shortwave irradiance and converting light into direct current (DC) electricity [23].
- WTG: responsible for converting wind energy to a regulated power which can be connected to the DC-power bus. Generally, for a small power load, vertical style windmills show some special benefit [23].
- Regulator charger: the highest power demand in a typical BS is based on 48 Vdc voltage. Therefore, it is beneficial to use DC/DC solar regulator converters that can directly convert the unregulated DC output voltage and current from a solar panel to a regulated output voltage for the BS equipment to protect the battery bank.
- Battery bank: stores excess electricity for future consumption by the BS at night, during load-shedding hours or if the available solar energy is not sufficient to feed the BS load completely. To protect the battery, inclusion of a charge controller is recommended. A charge controller or battery regulator limits the rate at which the electric current is added to or drawn from electric batteries, preventing overcharging and potentially protecting against overvoltage that can reduce battery performance or lifespan and may pose a safety risk. A charge controller may also prevent complete battery draining (“deep discharging”) or perform controlled discharges, depending on the battery technology, to protect battery life [23].
- Inverter: An inverter is a device that changes a low DC-voltage into usable 220 V AC voltage. It is one of the system's main elements. Inverters differ by the output wave format, output power and installation type. It is also called a power conditioner because it changes the form of the electric power. There are two types of output wave format: modified sine-wave (MSW) and pure sine-wave. The MSW inverters are economical and efficient; the sine wave inverters are usually more sophisticated with high-end performance that can operate virtually any type of load [23].
- Control system: serves as the brains of a complex control, regulation, and communication system. The most common communication units in the remote interface are wireless modems or network solutions. In addition to the control functions, the data logger and alarm memory capabilities are of high importance. All power sources working in parallel are managed by a sophisticated control system and share the load with their capabilities to accommodate the fact that power shortages are not admissible in the cellular telephony sector.
4. Mathematical Model
4.1. Photovoltaic System
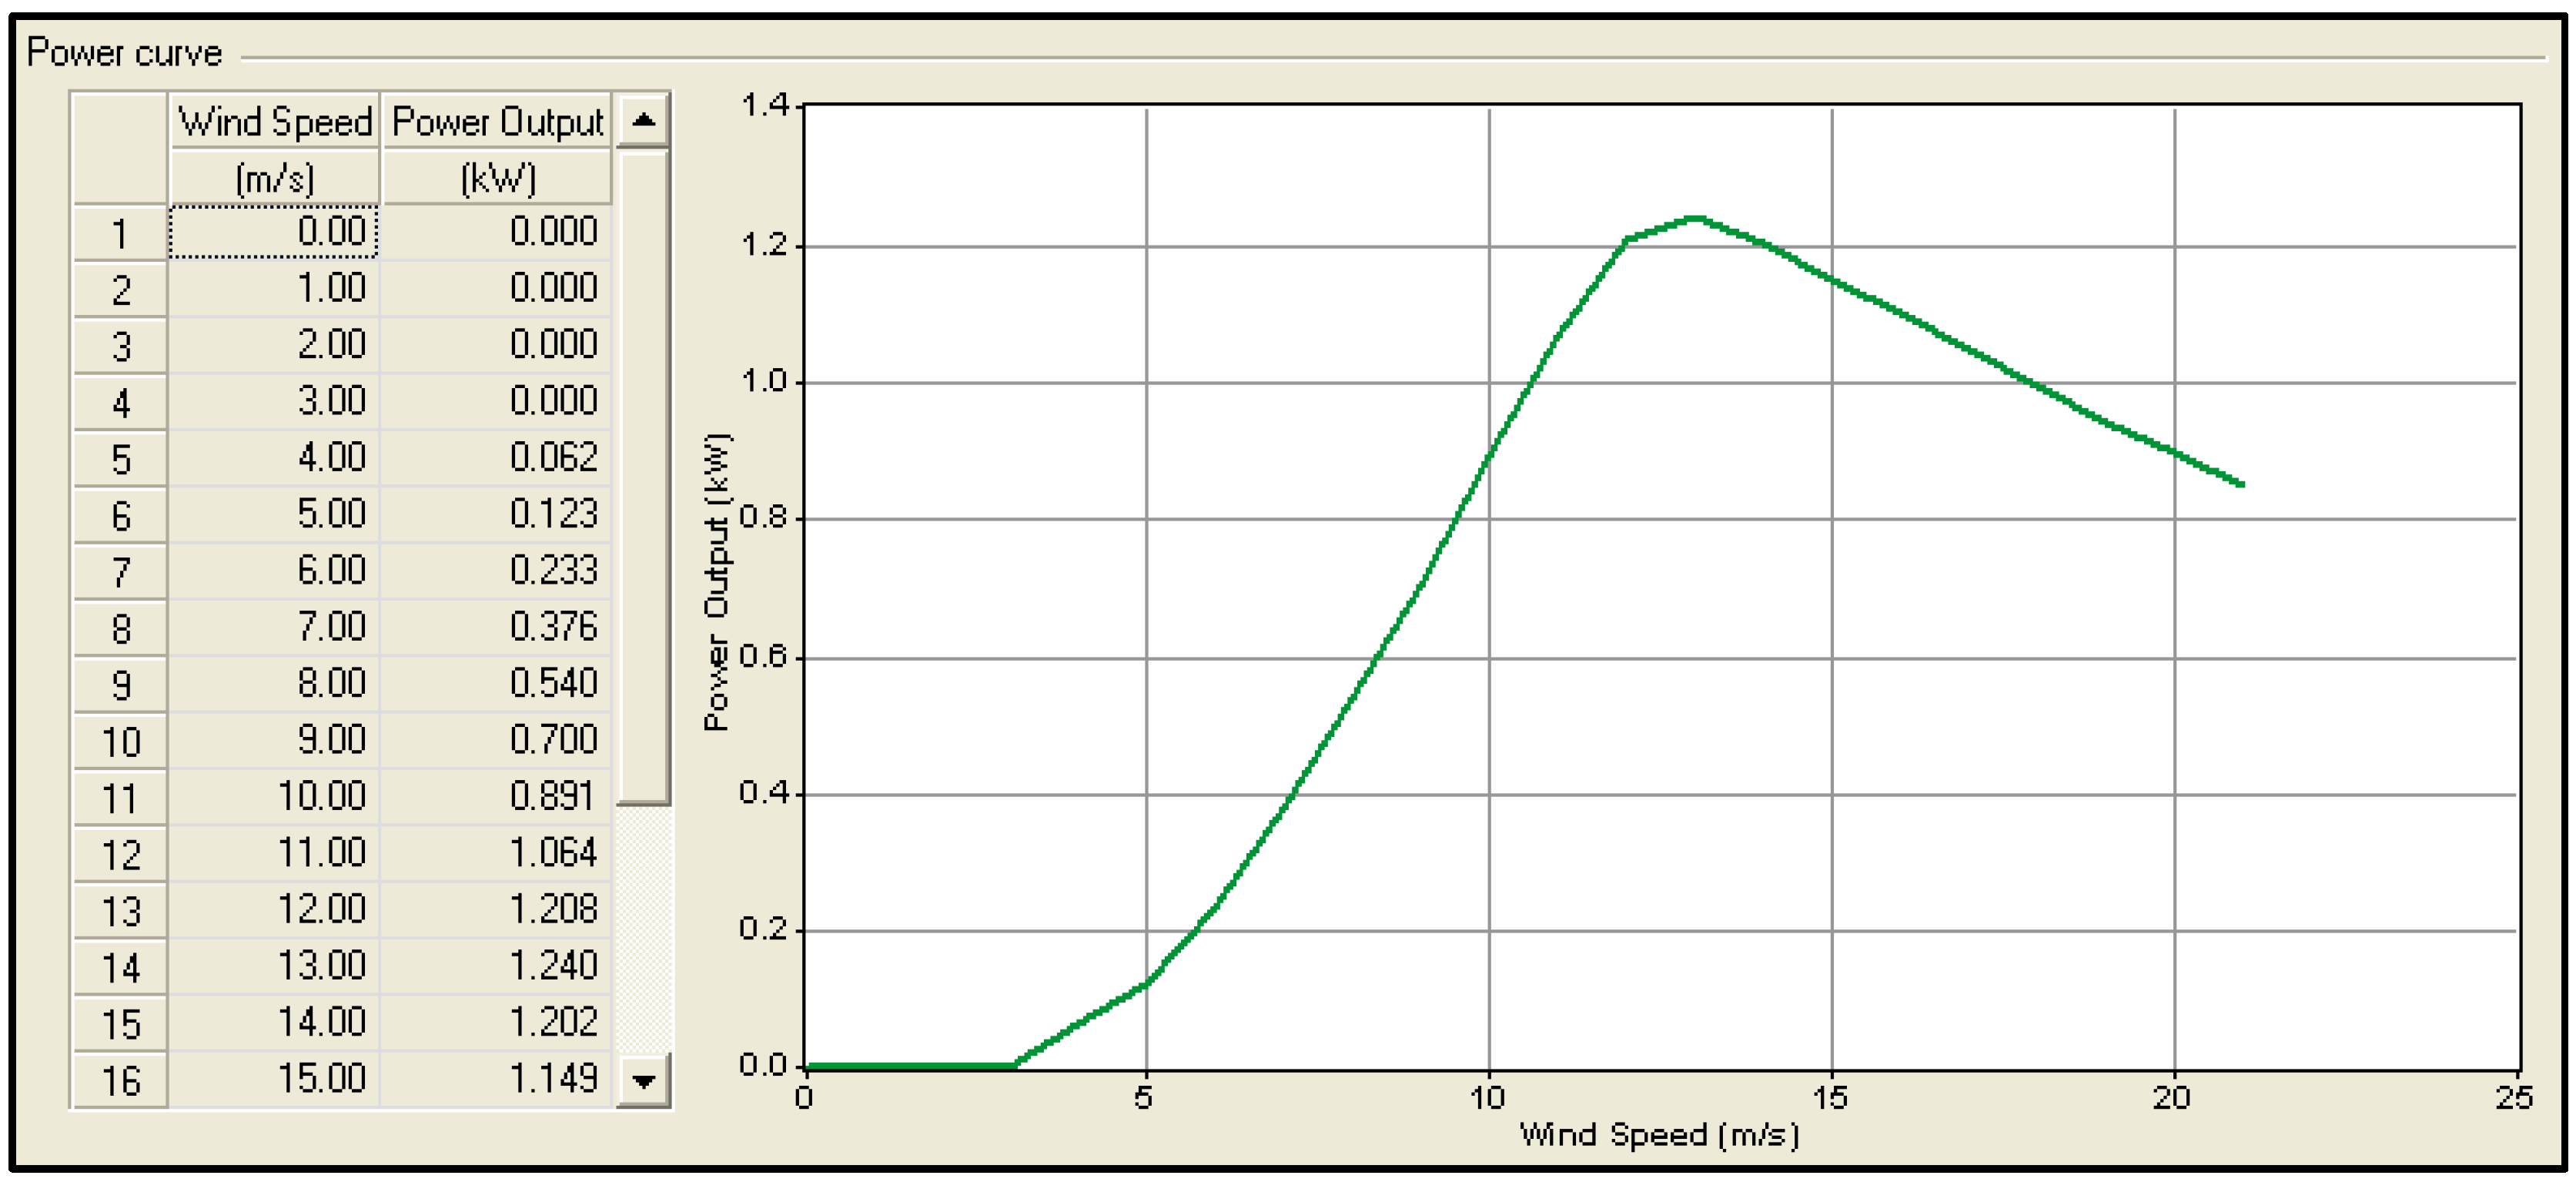
4.2. Wind Conversion System
4.3. Battery Model
4.4. Economic Mathematical Model
5. System Implementation and Configuration
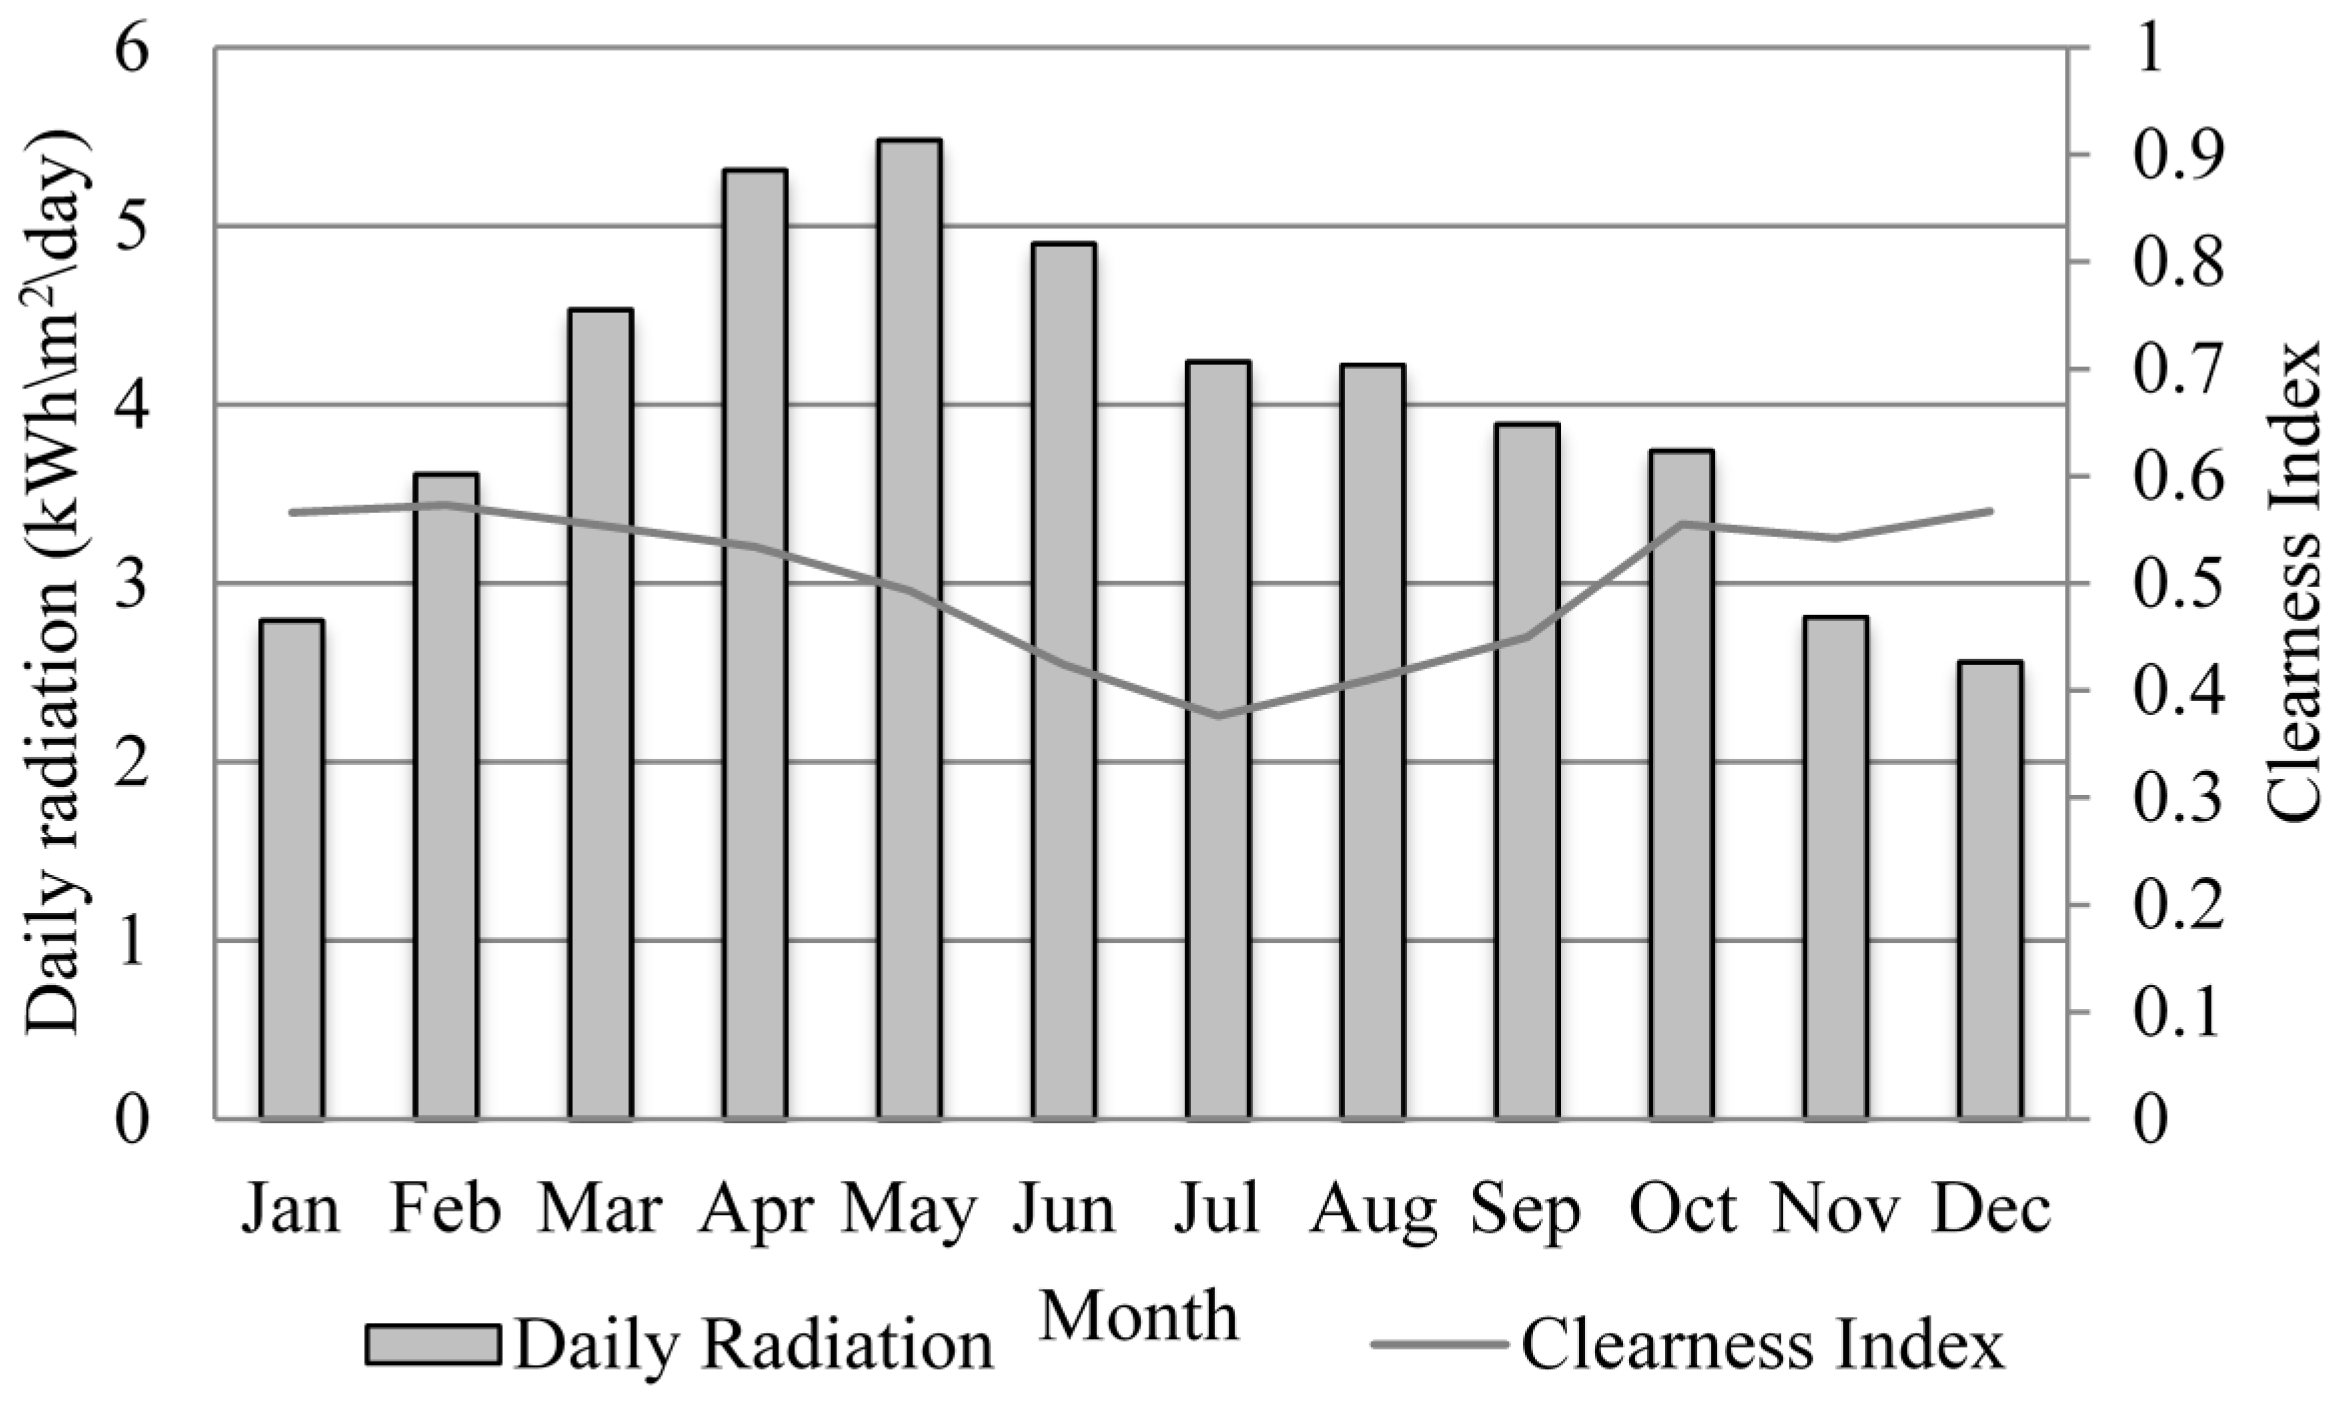
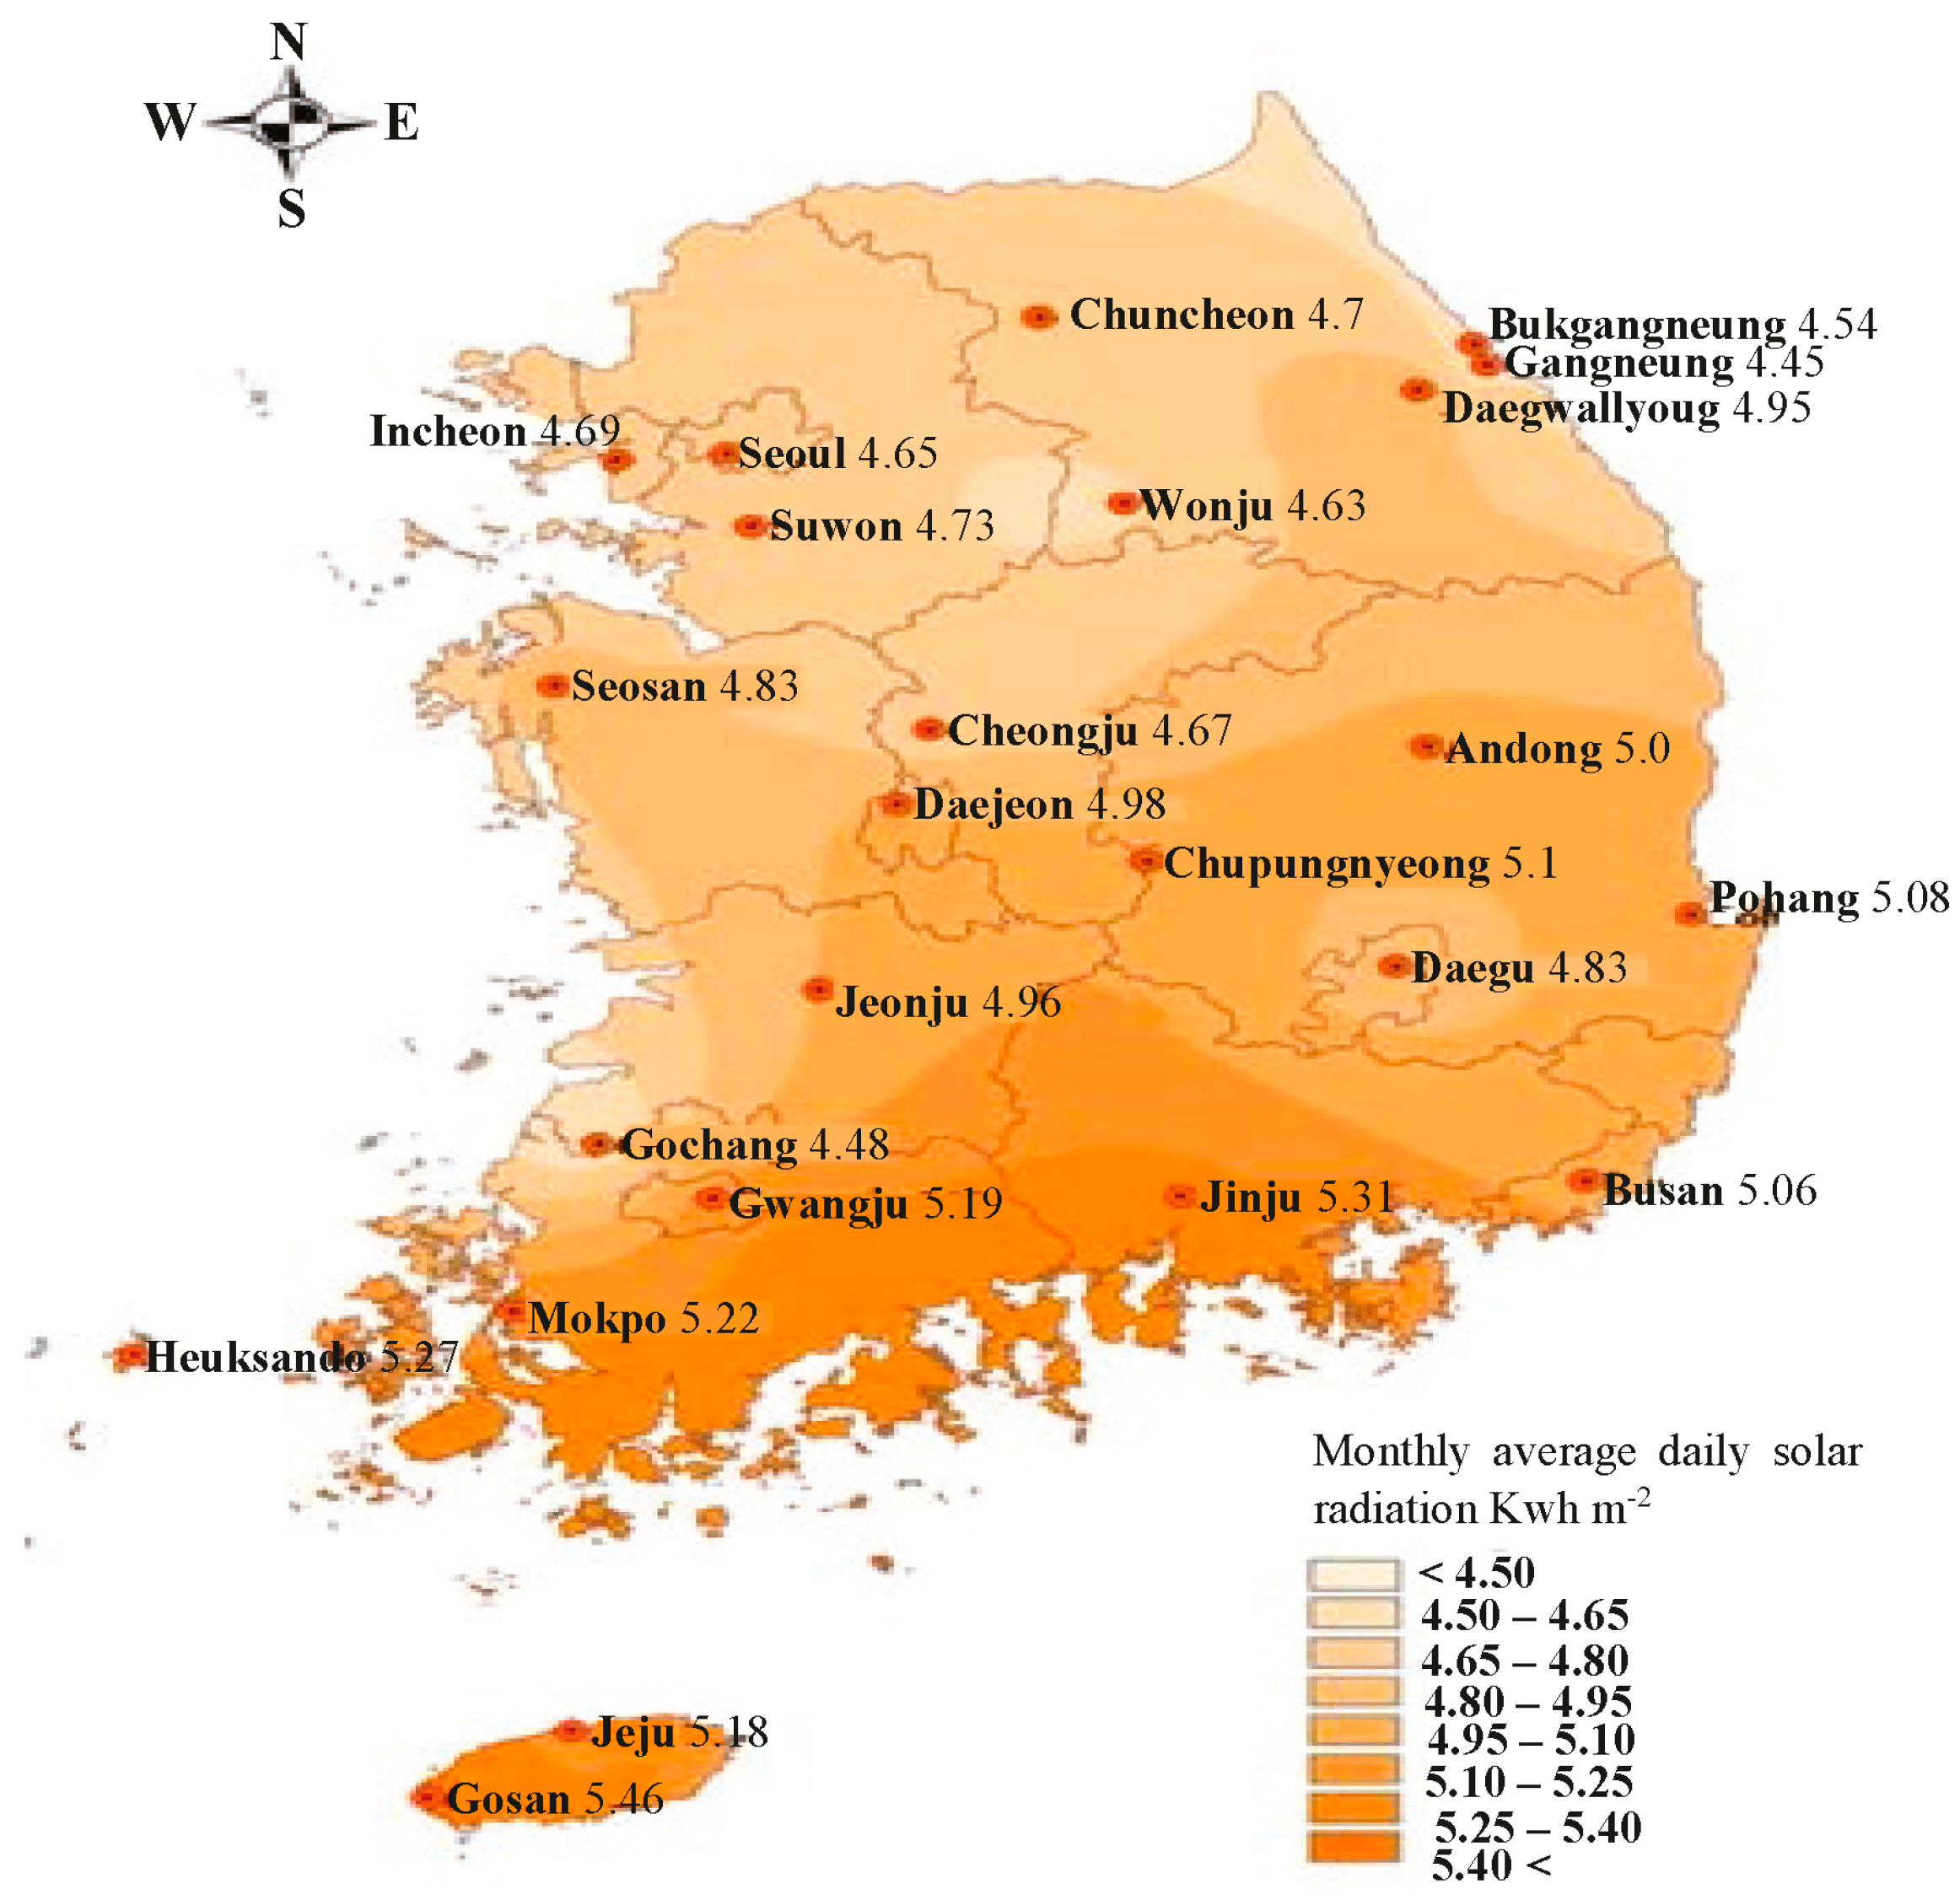
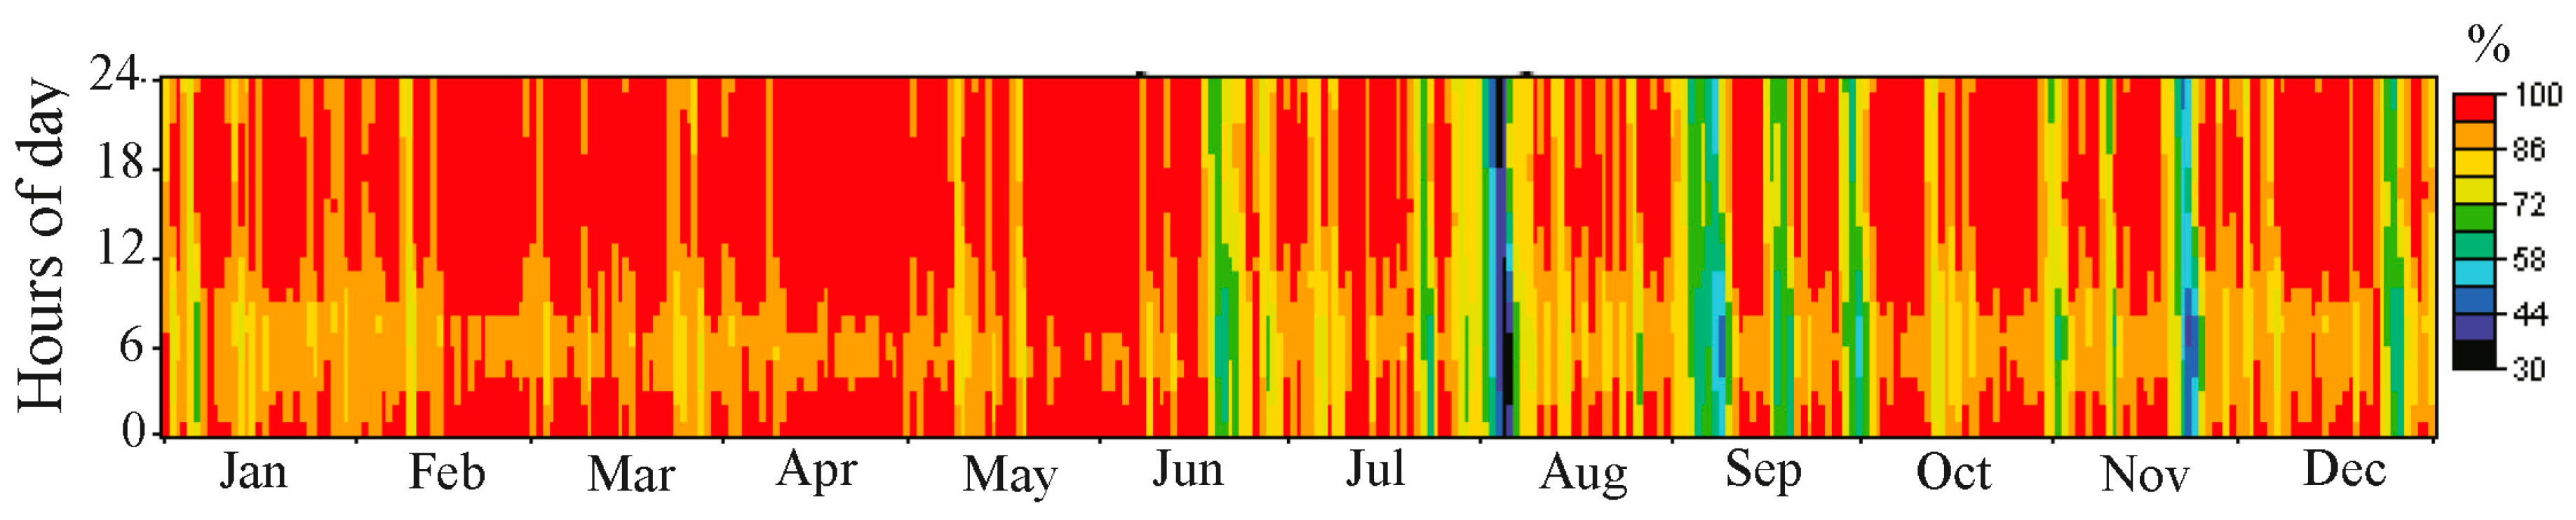
5.1. Solar Radiation
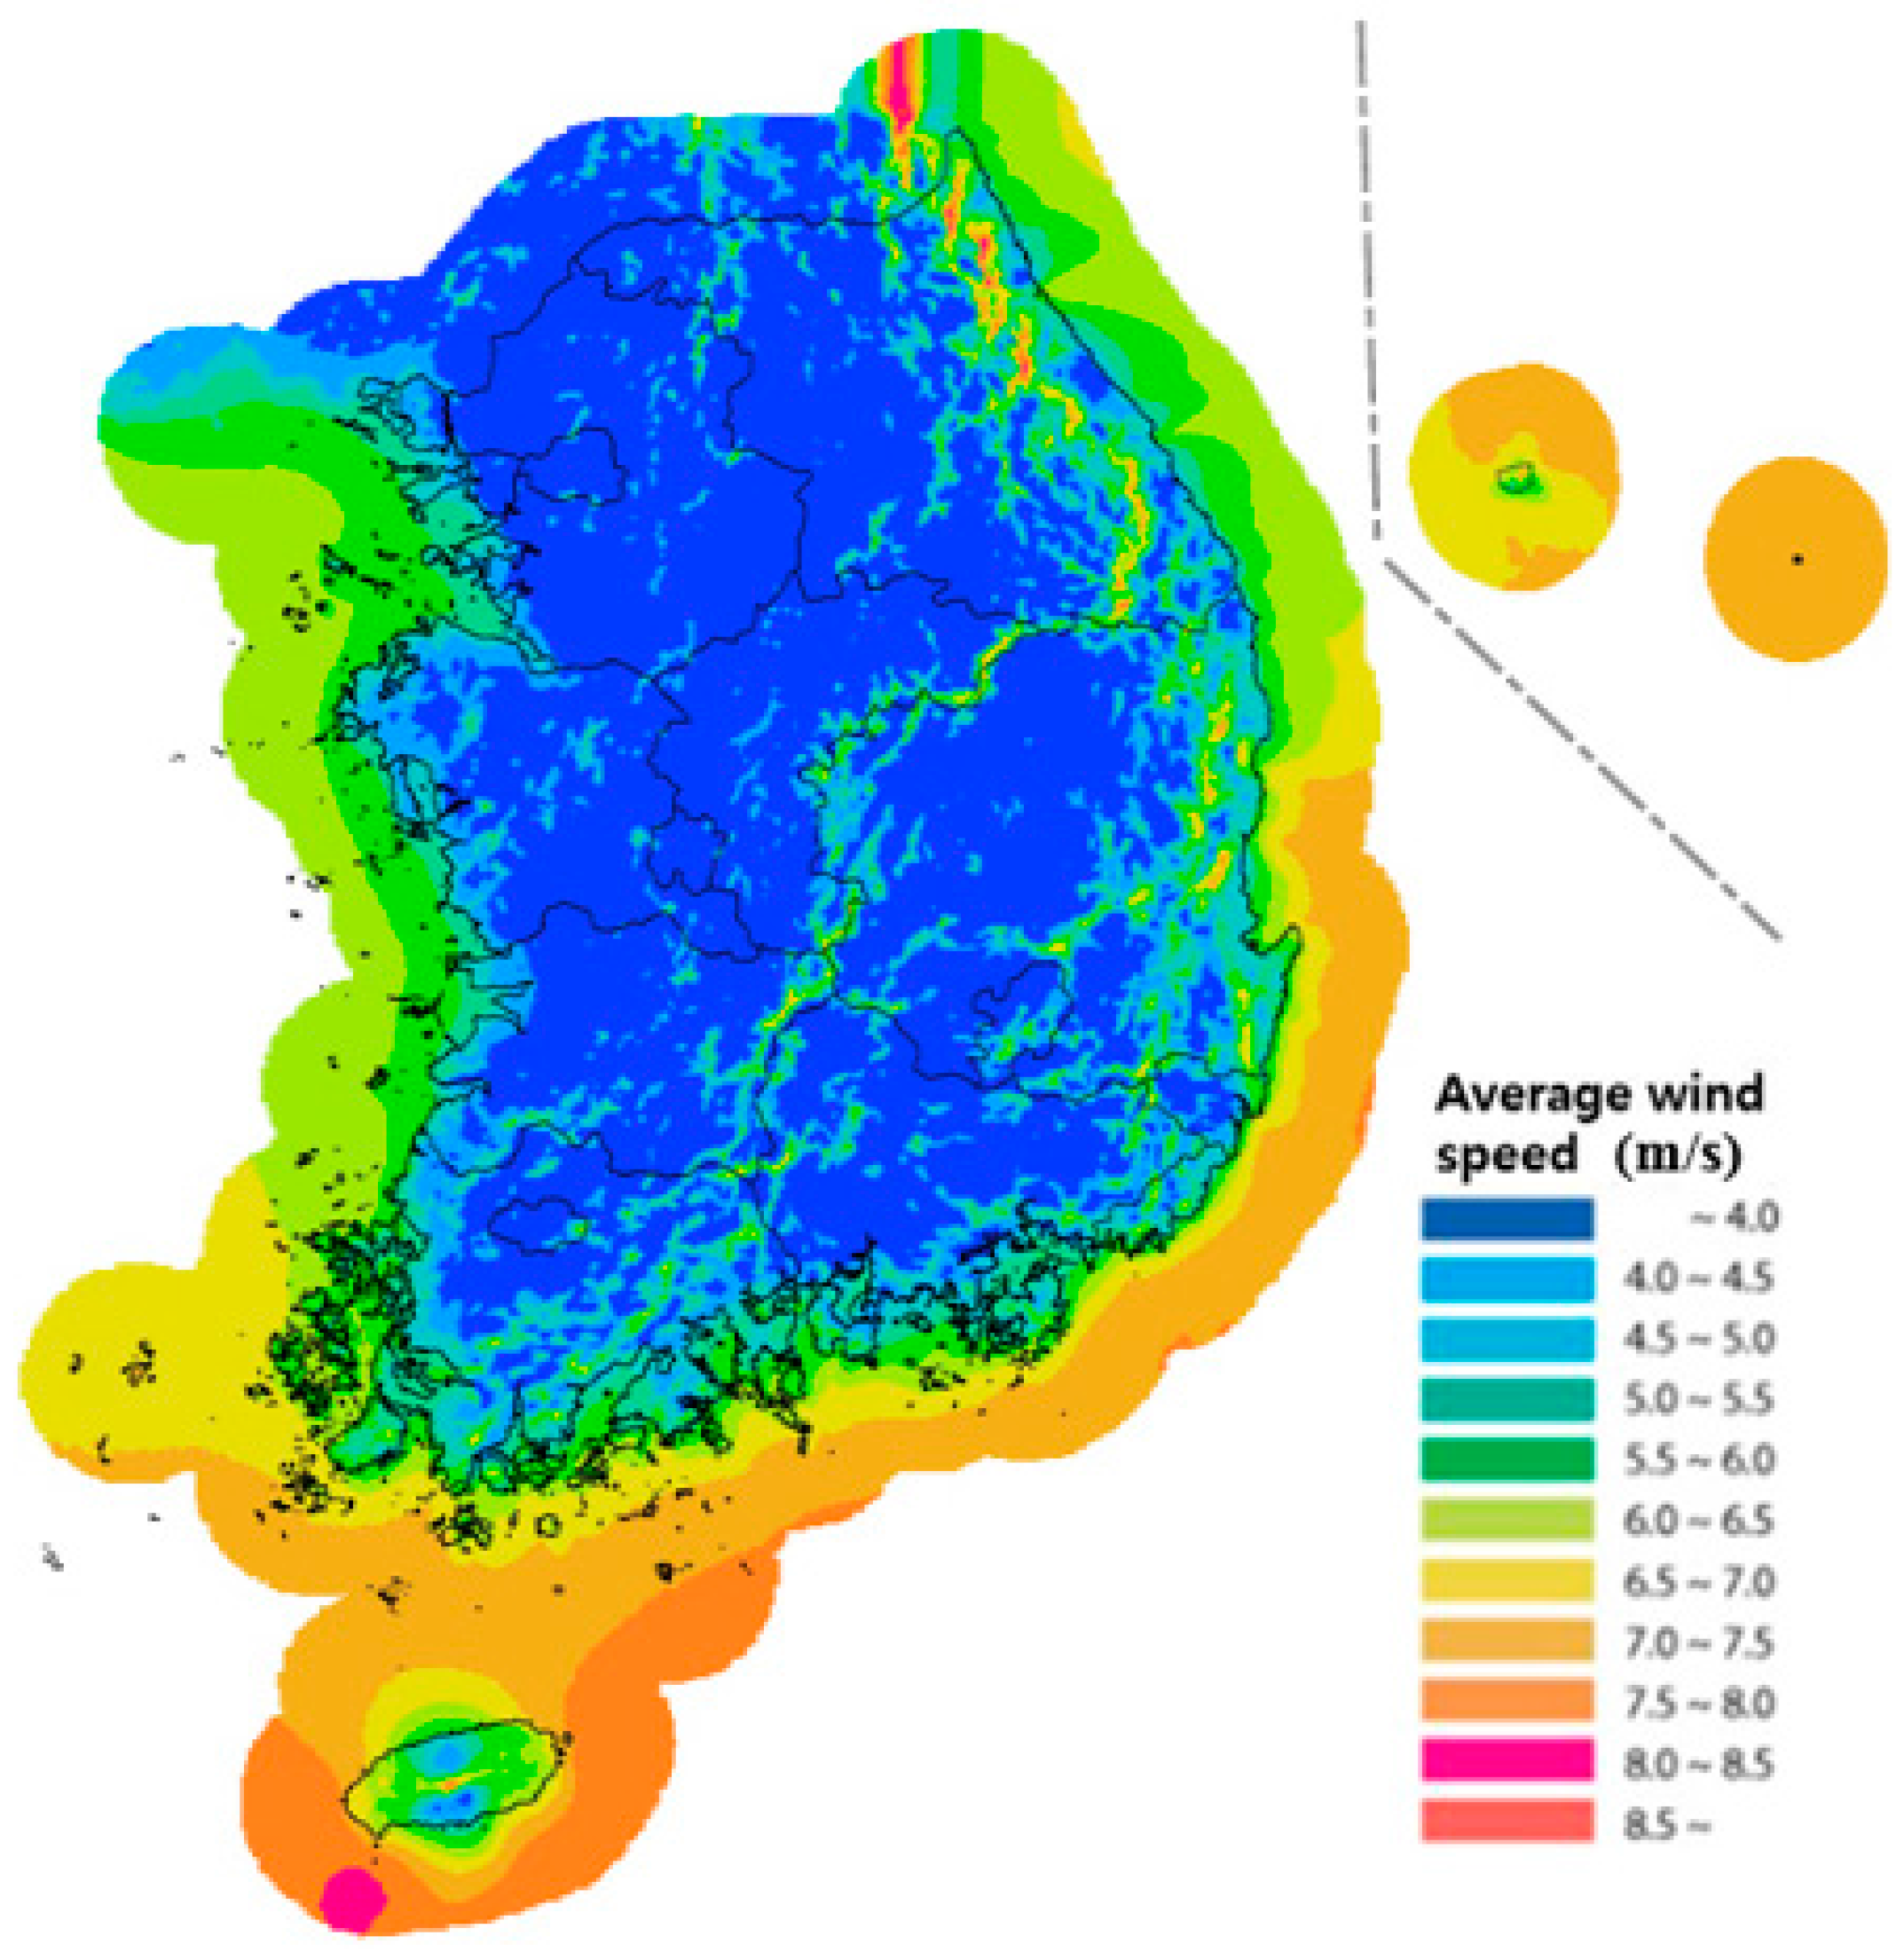
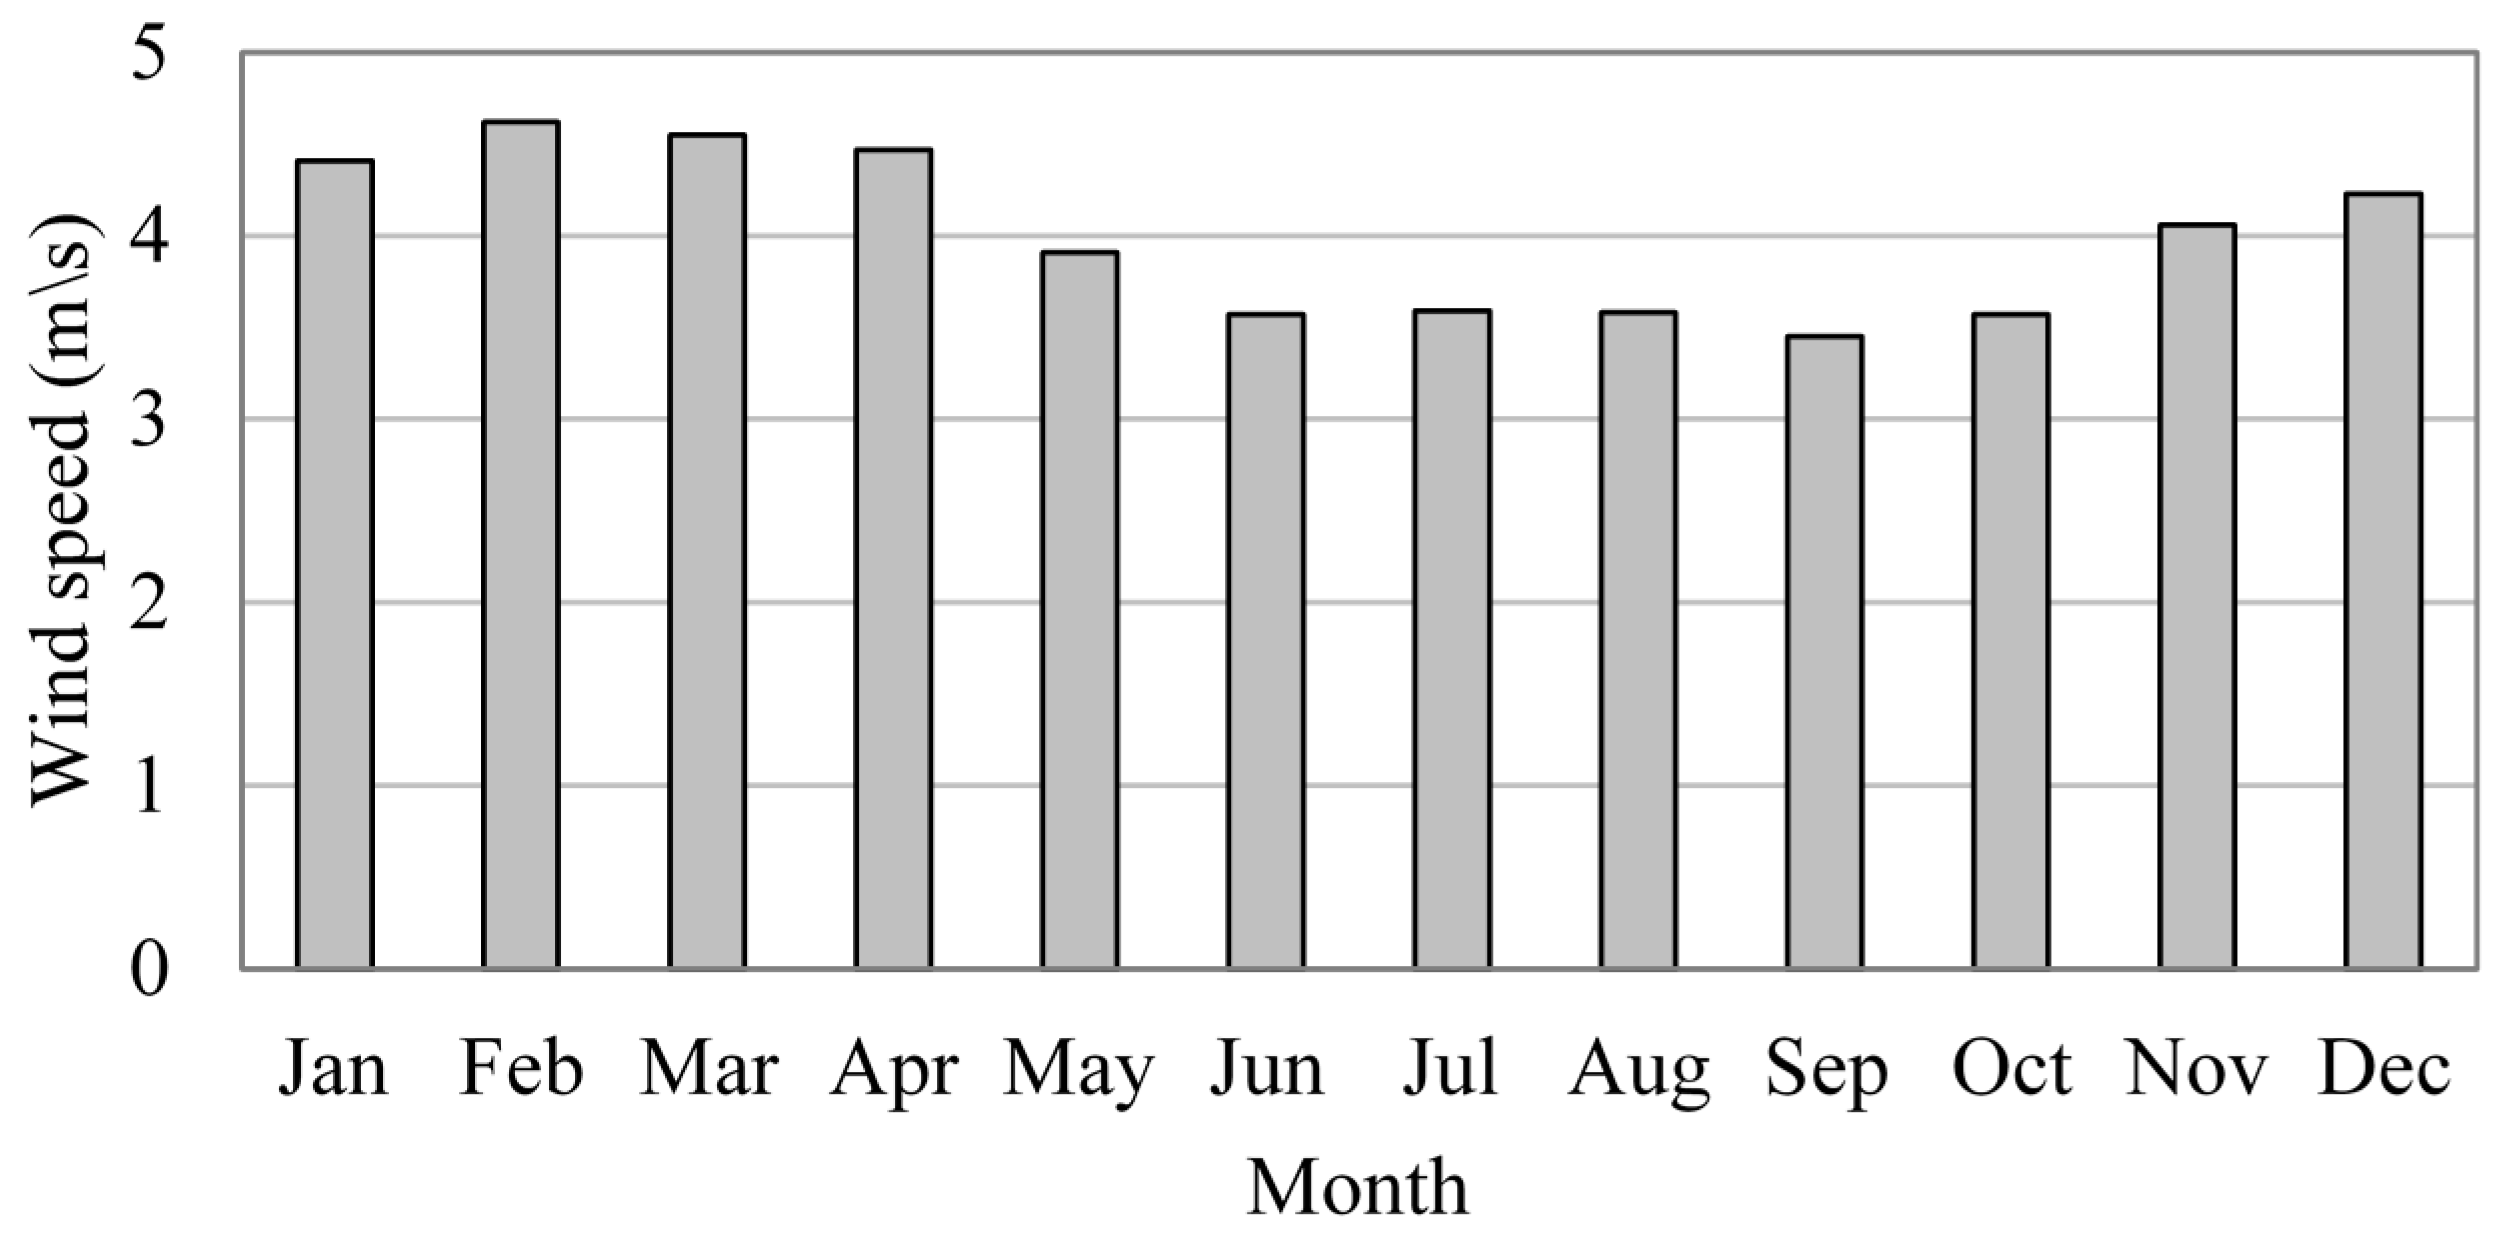
5.2. Wind Speed
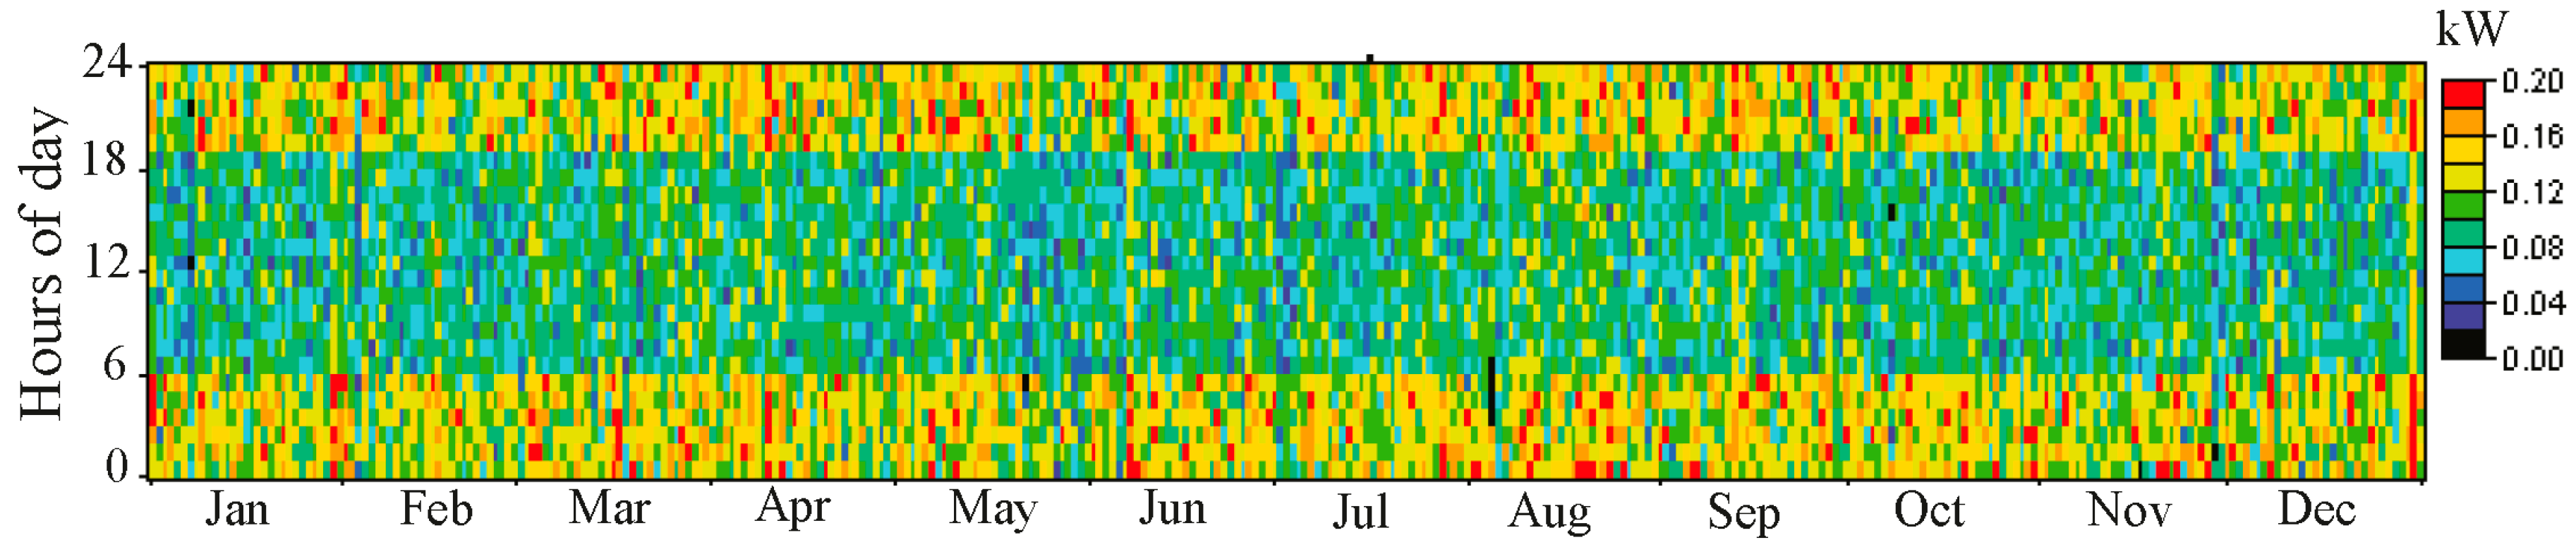
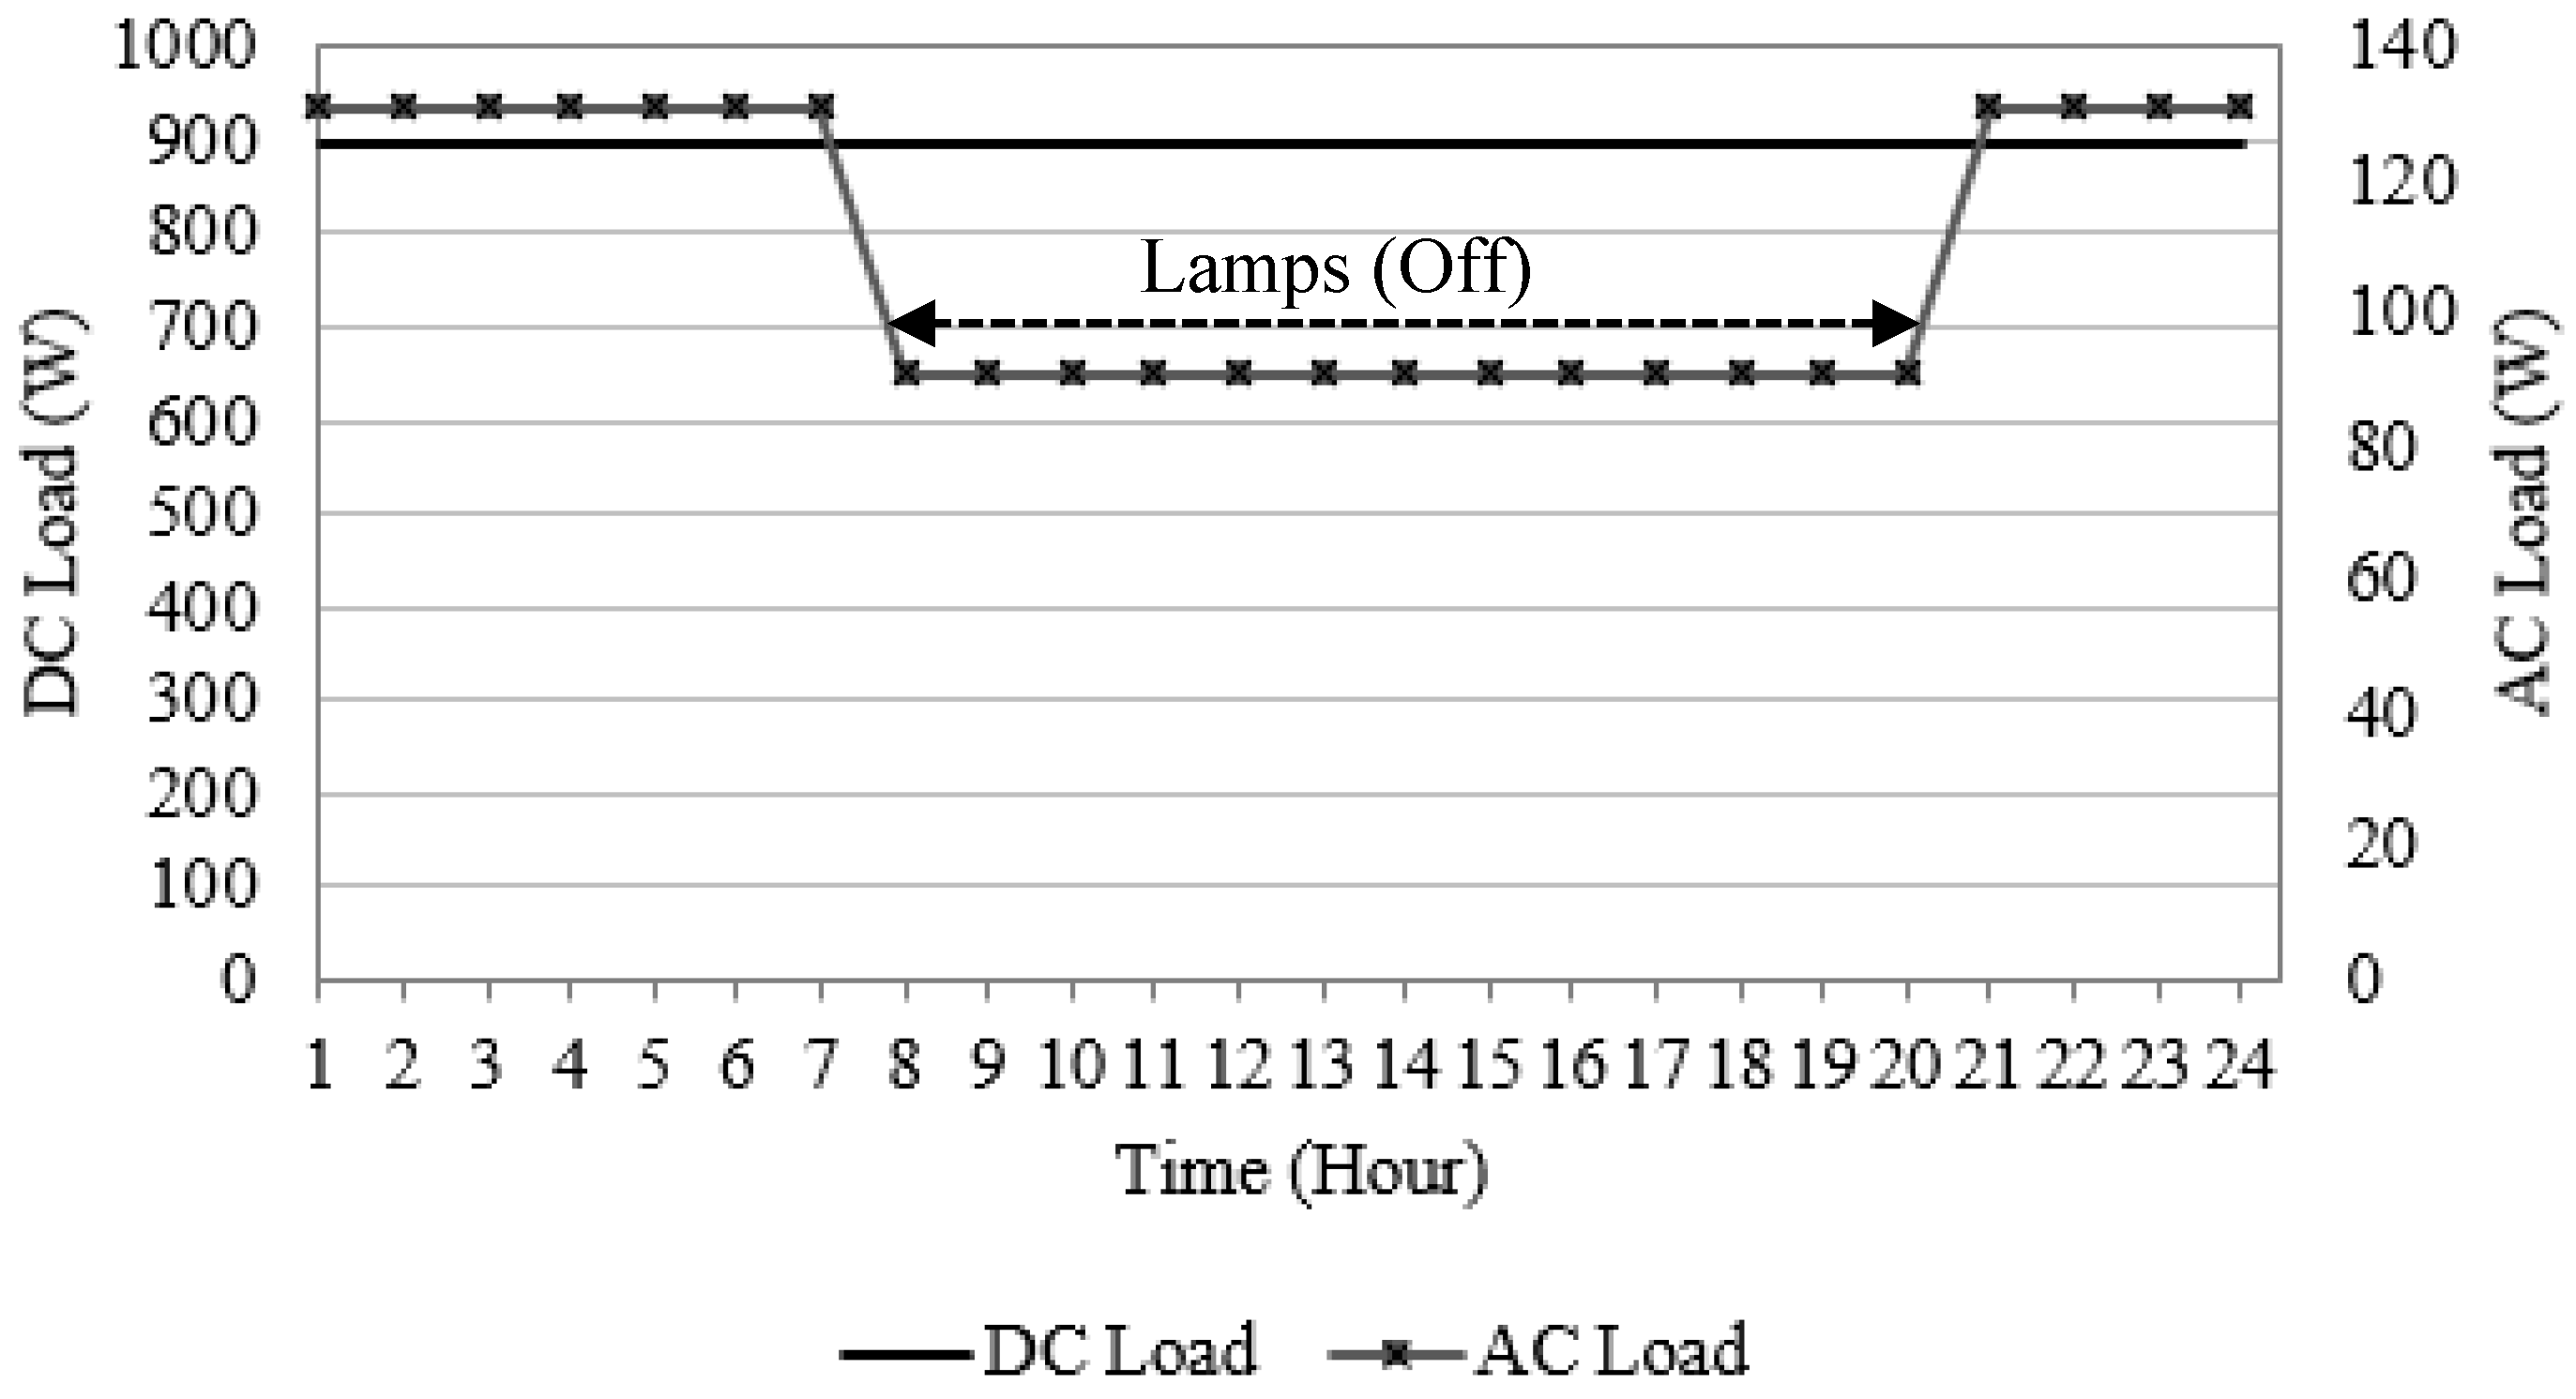
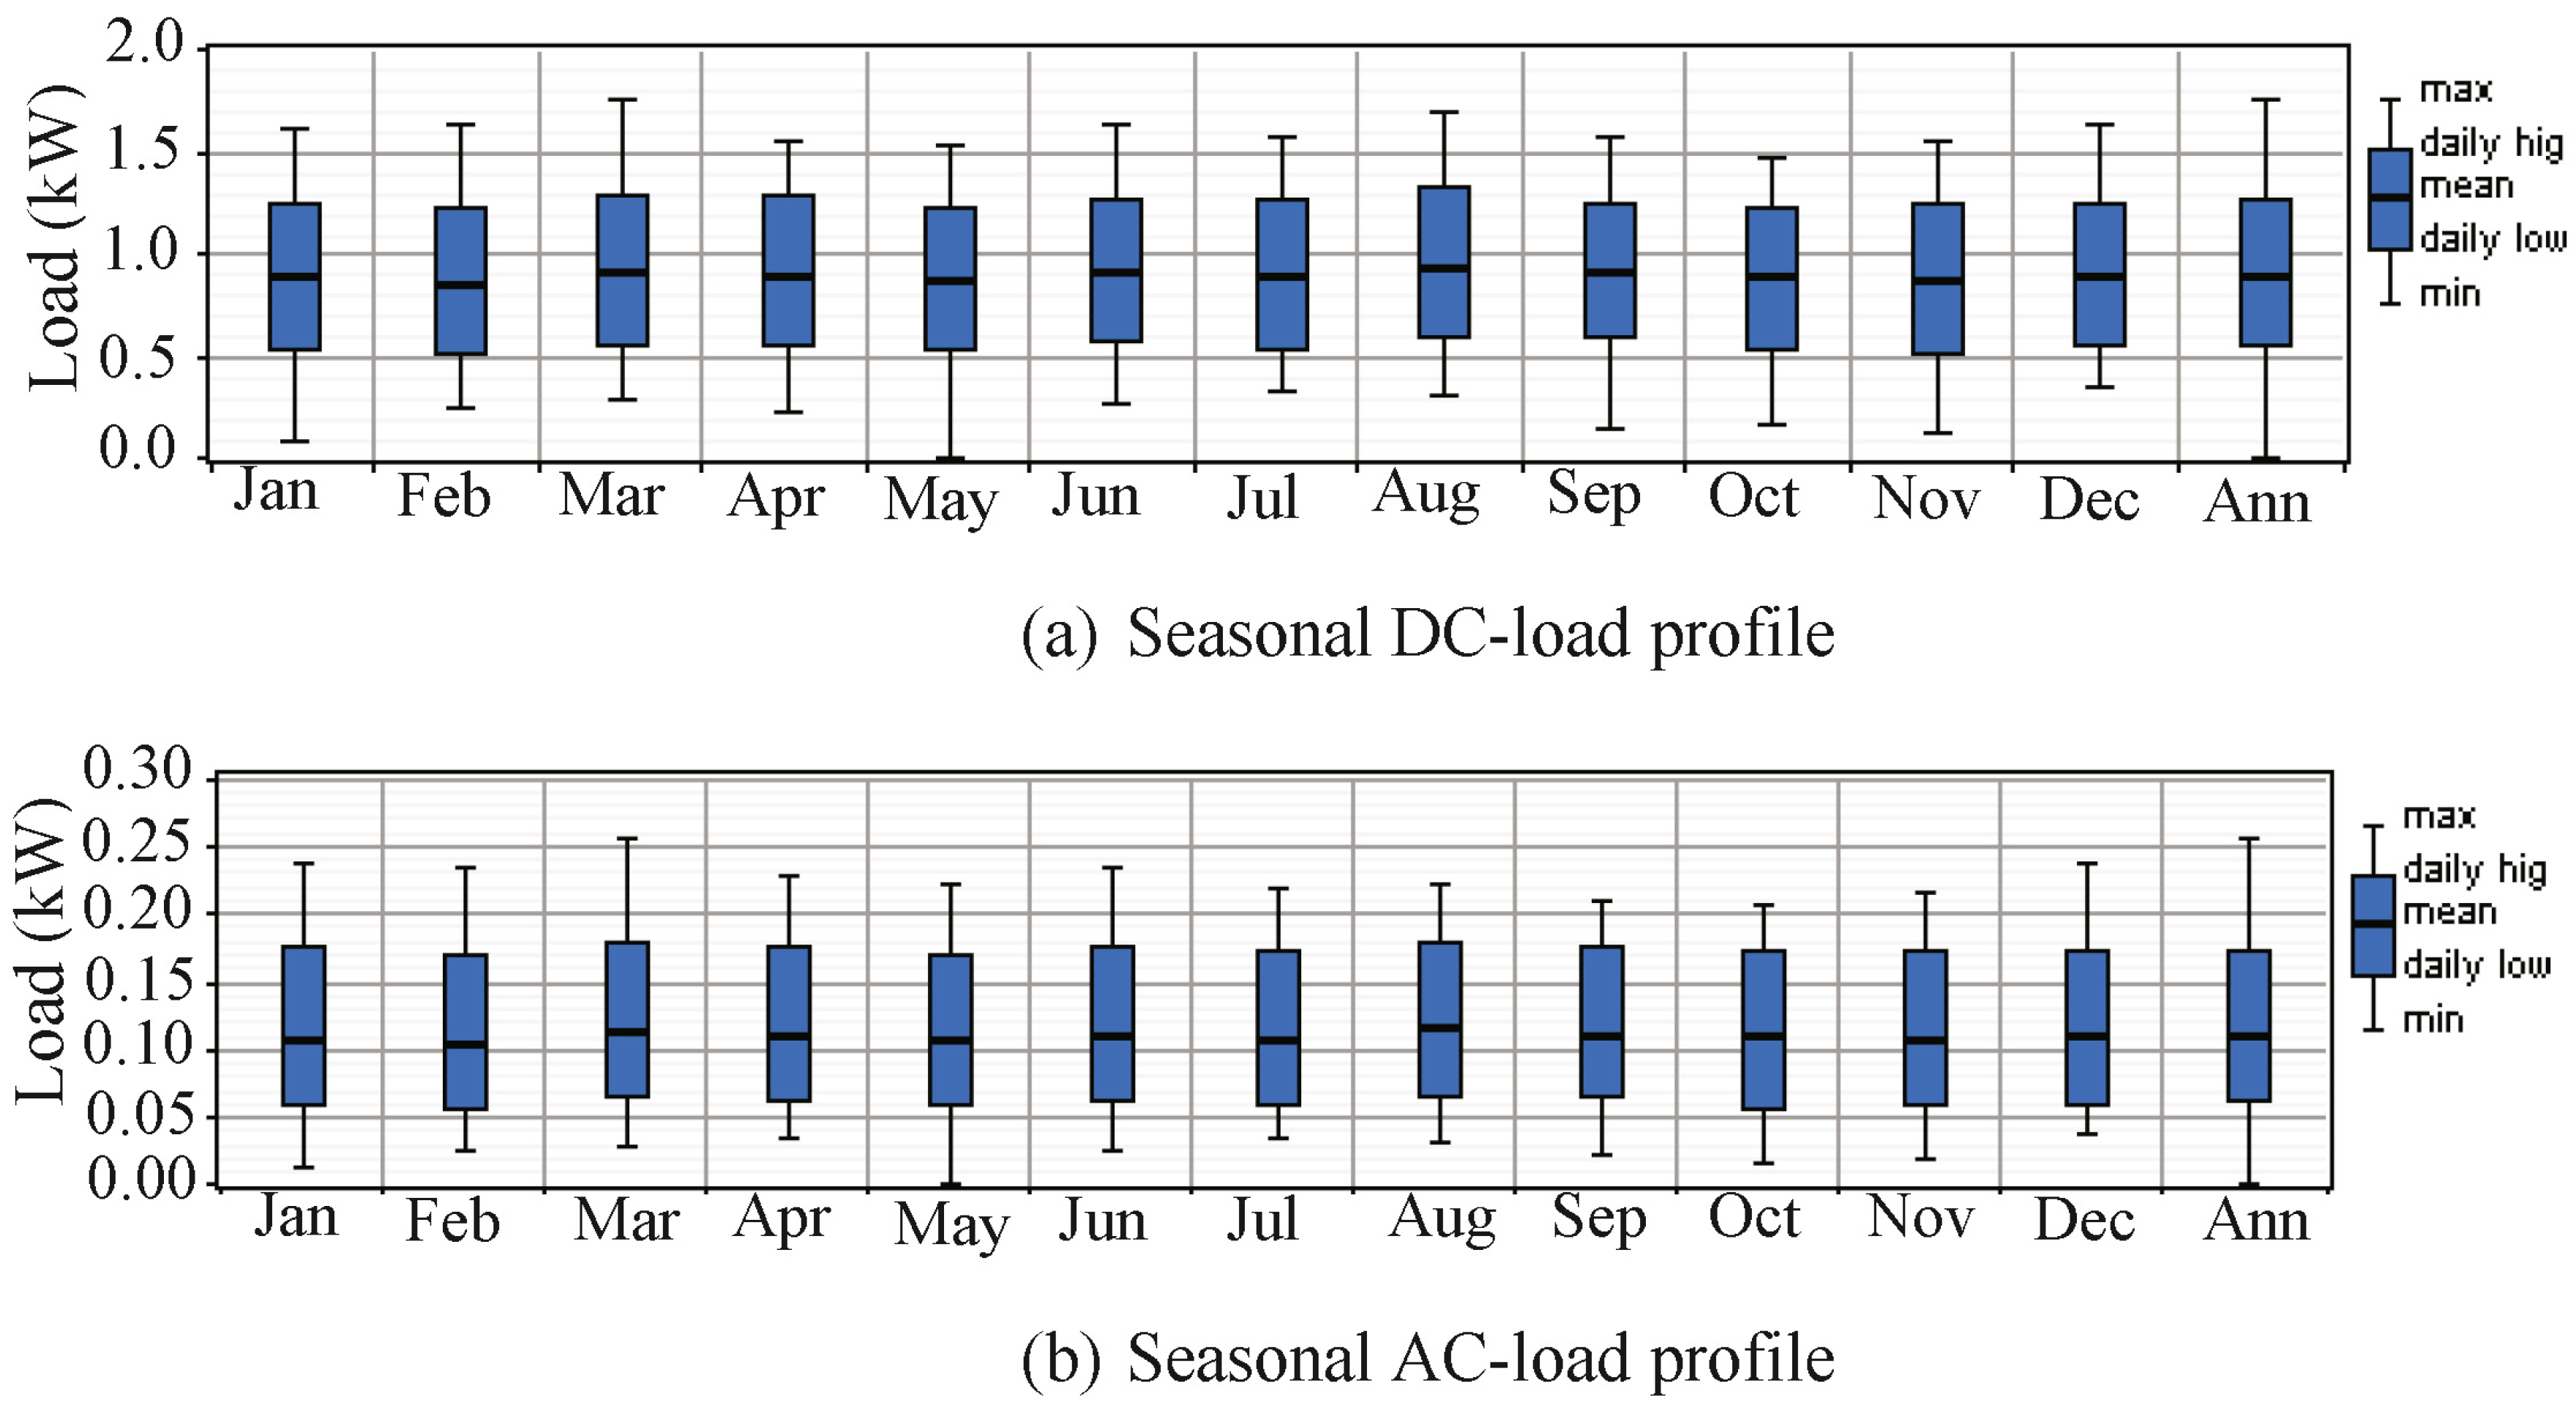
5.3. Load Profile
5.4. Technical and Economic Criteria of the SPV/WTG System
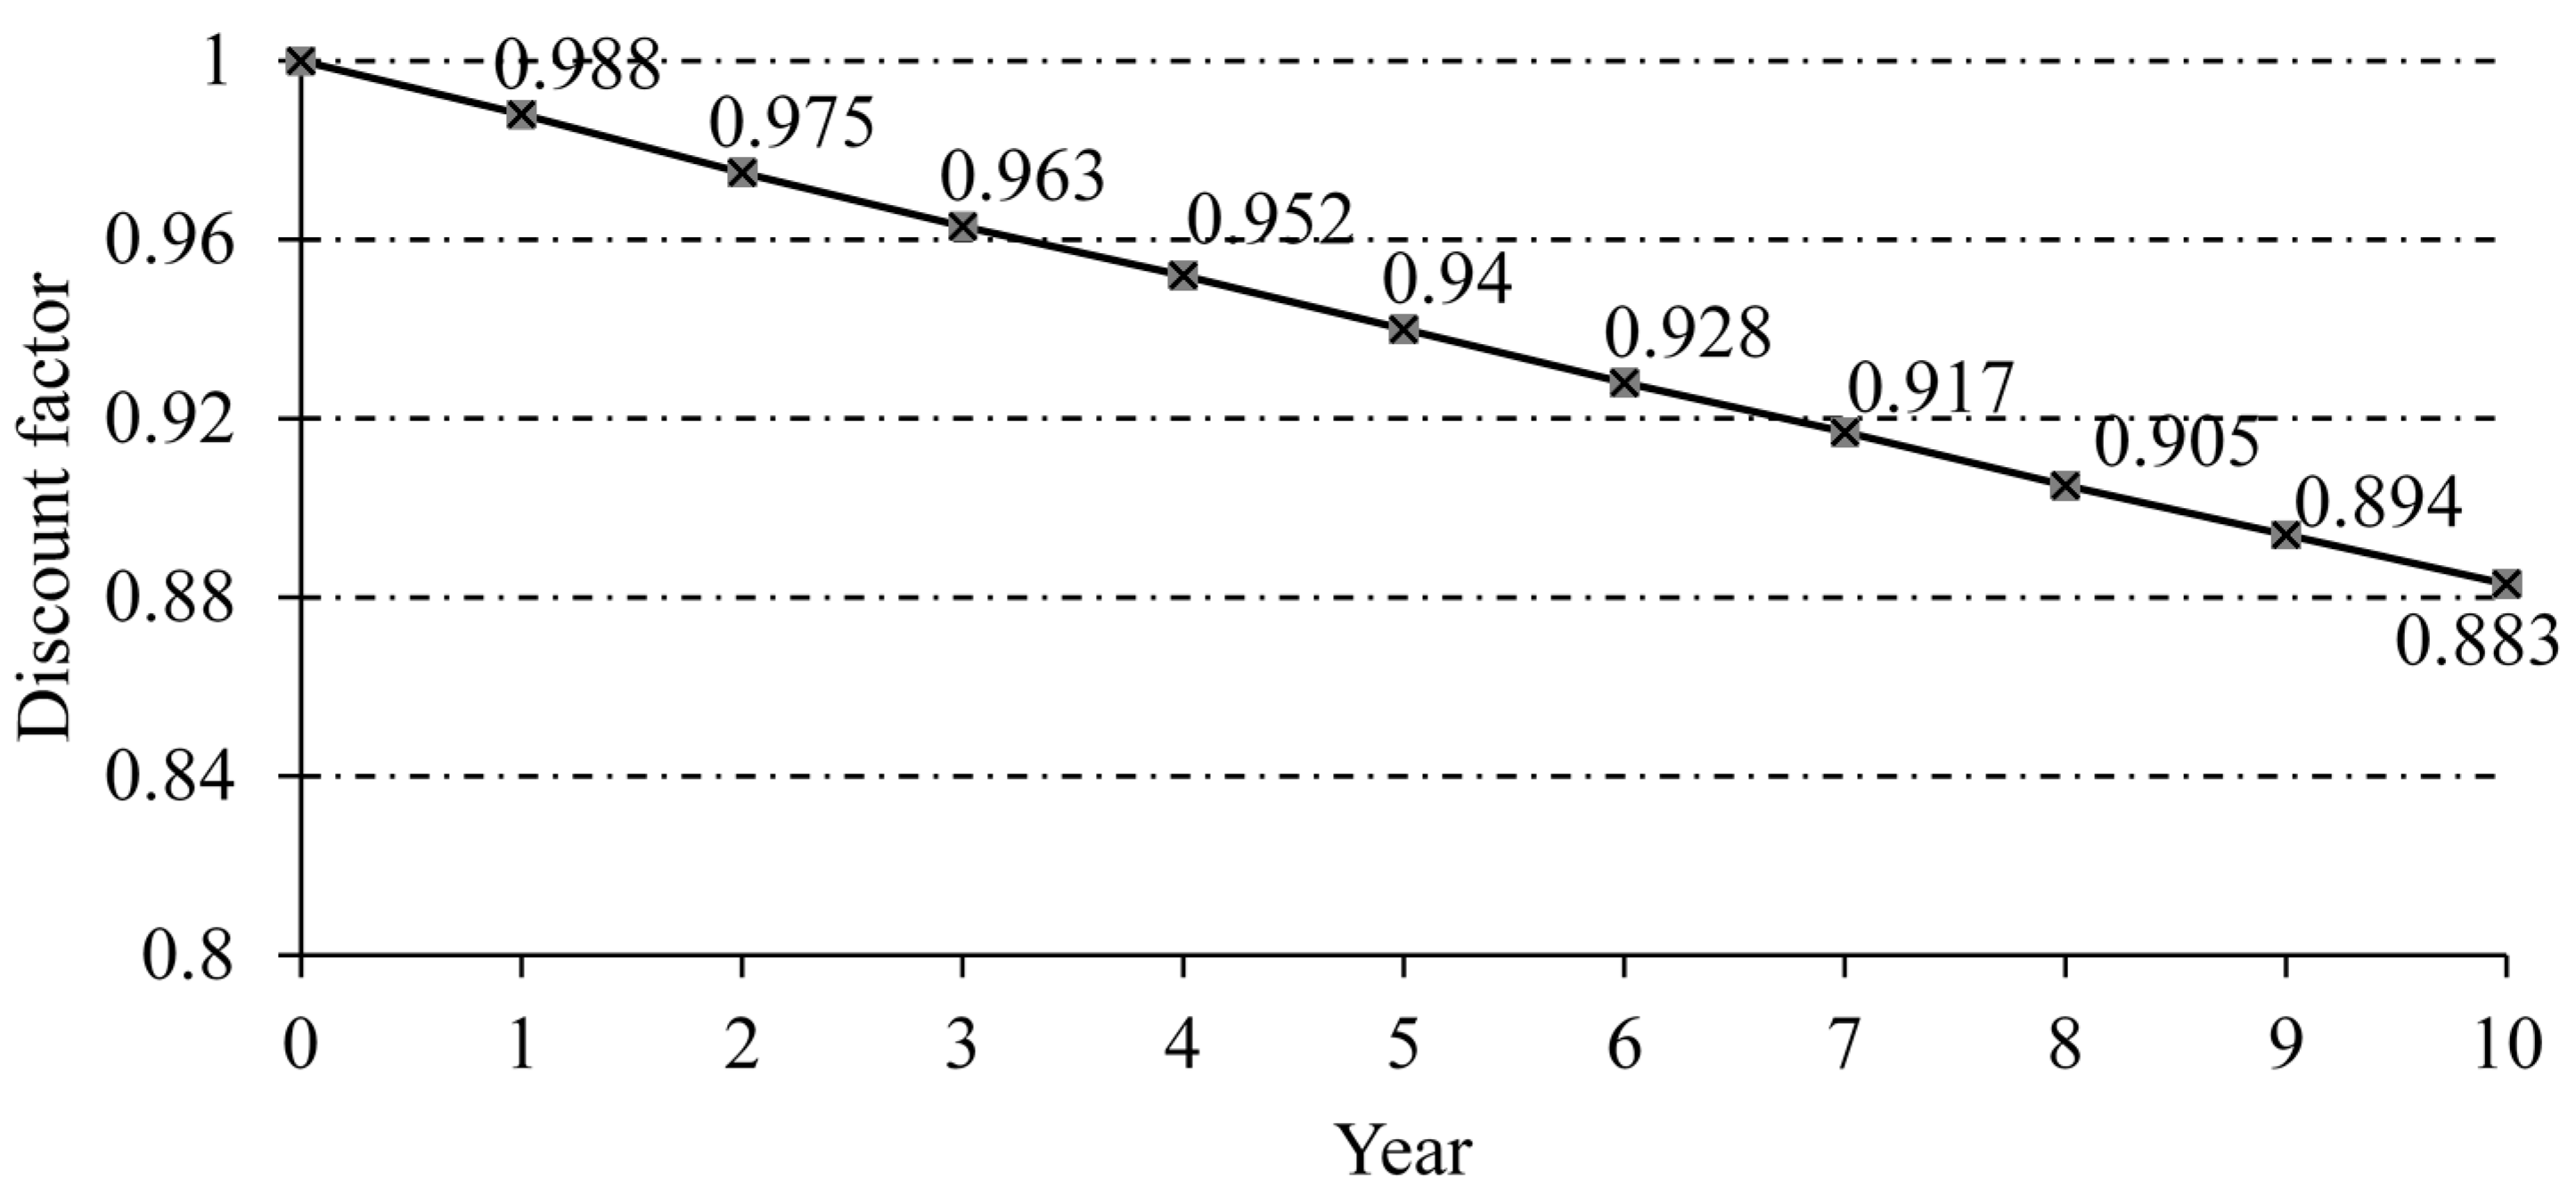
5.4.1. Annual Real Interest Rate and Project Lifetime
5.4.2. SPV
- Economic issues: the initial installation costs of SPV, the replacement costs, and the annual O&M costs per 1 kW are $1000, $1000, and $10, respectively.
- Technical issues: the lifetime of an SPV array is 25 years; a derating factor of 0.9, a reflectance of 20%, and a dual-axis tracking system for the SPV array are used in this paper.
- SPV size: the sizes of the simulation values of the applied SPV panels are 4, 4.5, 5, 5.5, 6, 6.5, and 7 kW.
5.4.3. WTG
- Economic issues: the initial installation costs of a WTG, the replacement costs, and the annual O&M costs per 1 kW are $600, $600, and $50, respectively.
- Technical issues: the lifetime of a WTG and the height of the hub are 15 years and 50 m, respectively.
- WTG size: the sizes of the simulation values of the applied WTG are 1, 2, and 3 kW.
5.4.4. Battery
- Economic issues: the initial installation costs of a battery, the replacement costs, and the annual O&M costs per unit are $300, $300, and $10, respectively.
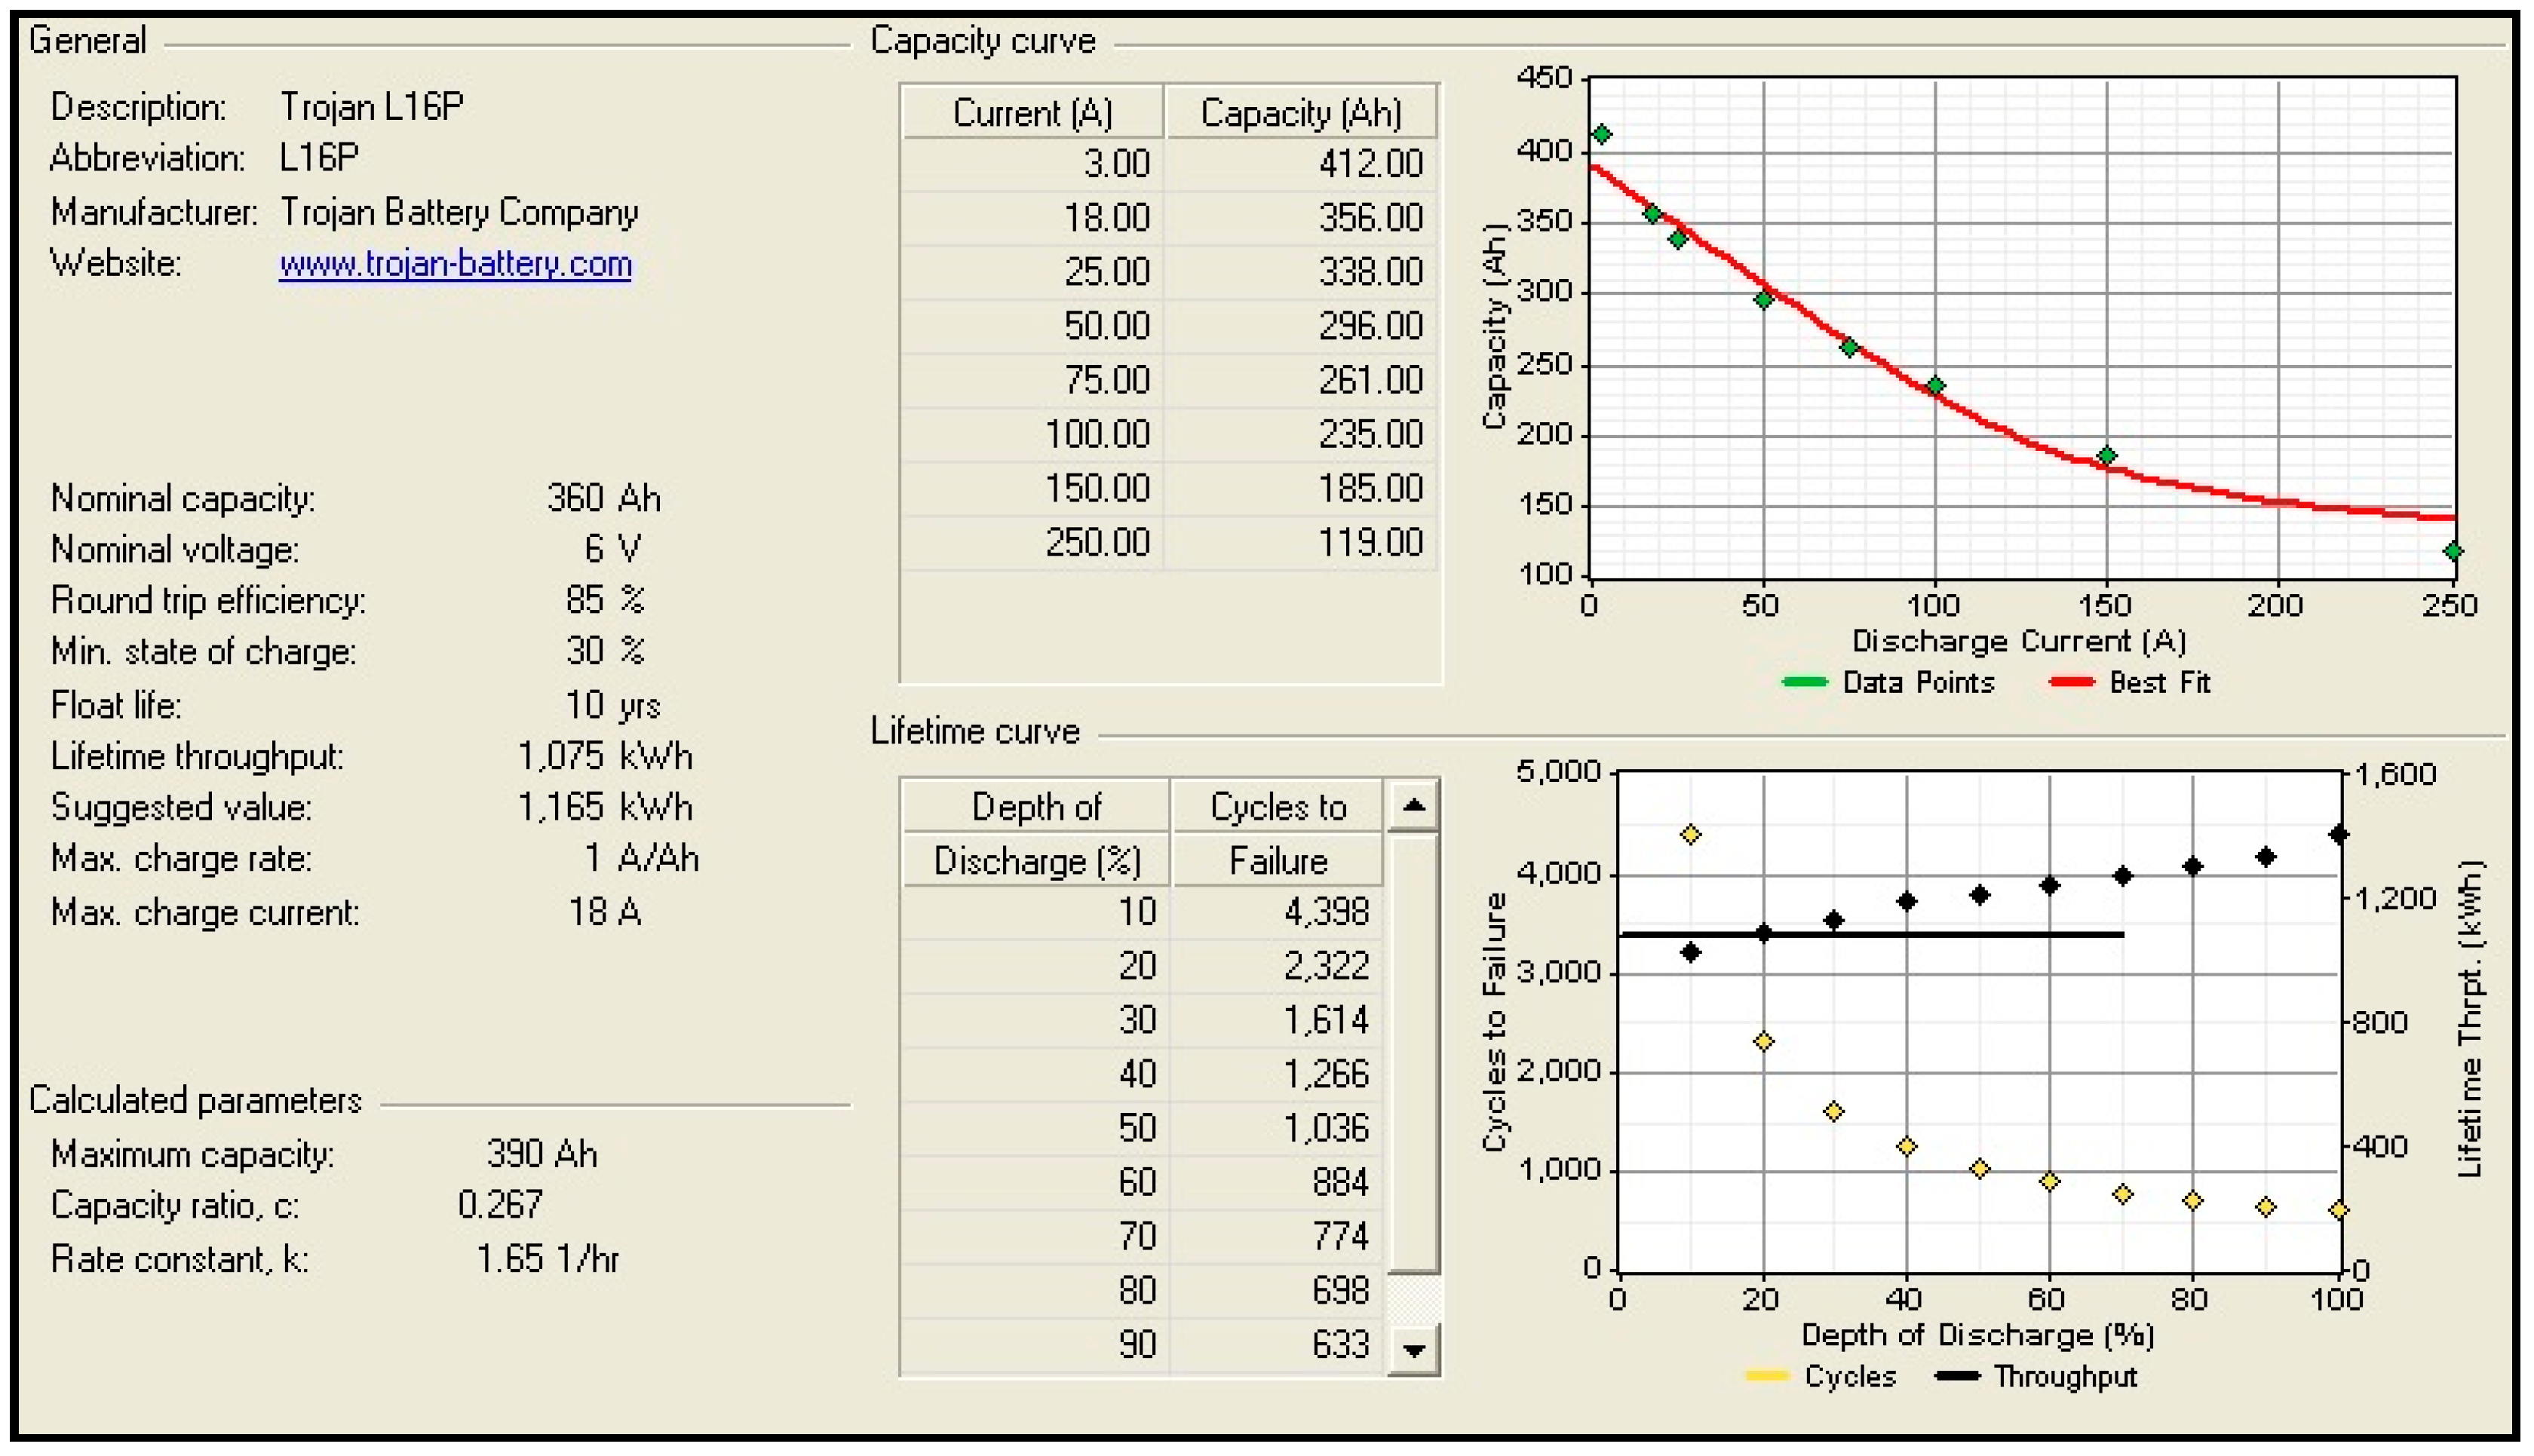
- Technical issues: the lifetime of the “Trojan L16P” battery and the efficiency are set as 5 years and 85%, respectively.
- Battery size: the sizes of the simulation-values of the applied inverter are 32, 40, 48, 56, 64 and 72 units.
5.4.5. Inverter
- Economic issues: the initial installation costs of an inverter, the replacement costs, and the annual O&M costs per 1 kW are $400, $400, and $10, respectively.
- Technical issues: the lifetime of the inverter, and the efficiency are set as 15 years, 95%, respectively.
- Inverter size: the sizes of the simulation-values of the applied inverter are 0.1, 0.15, 0.2, 0.25, and 0.3 kW.
6. Optimization and Simulation Results
6.1. Optimisation Criteria
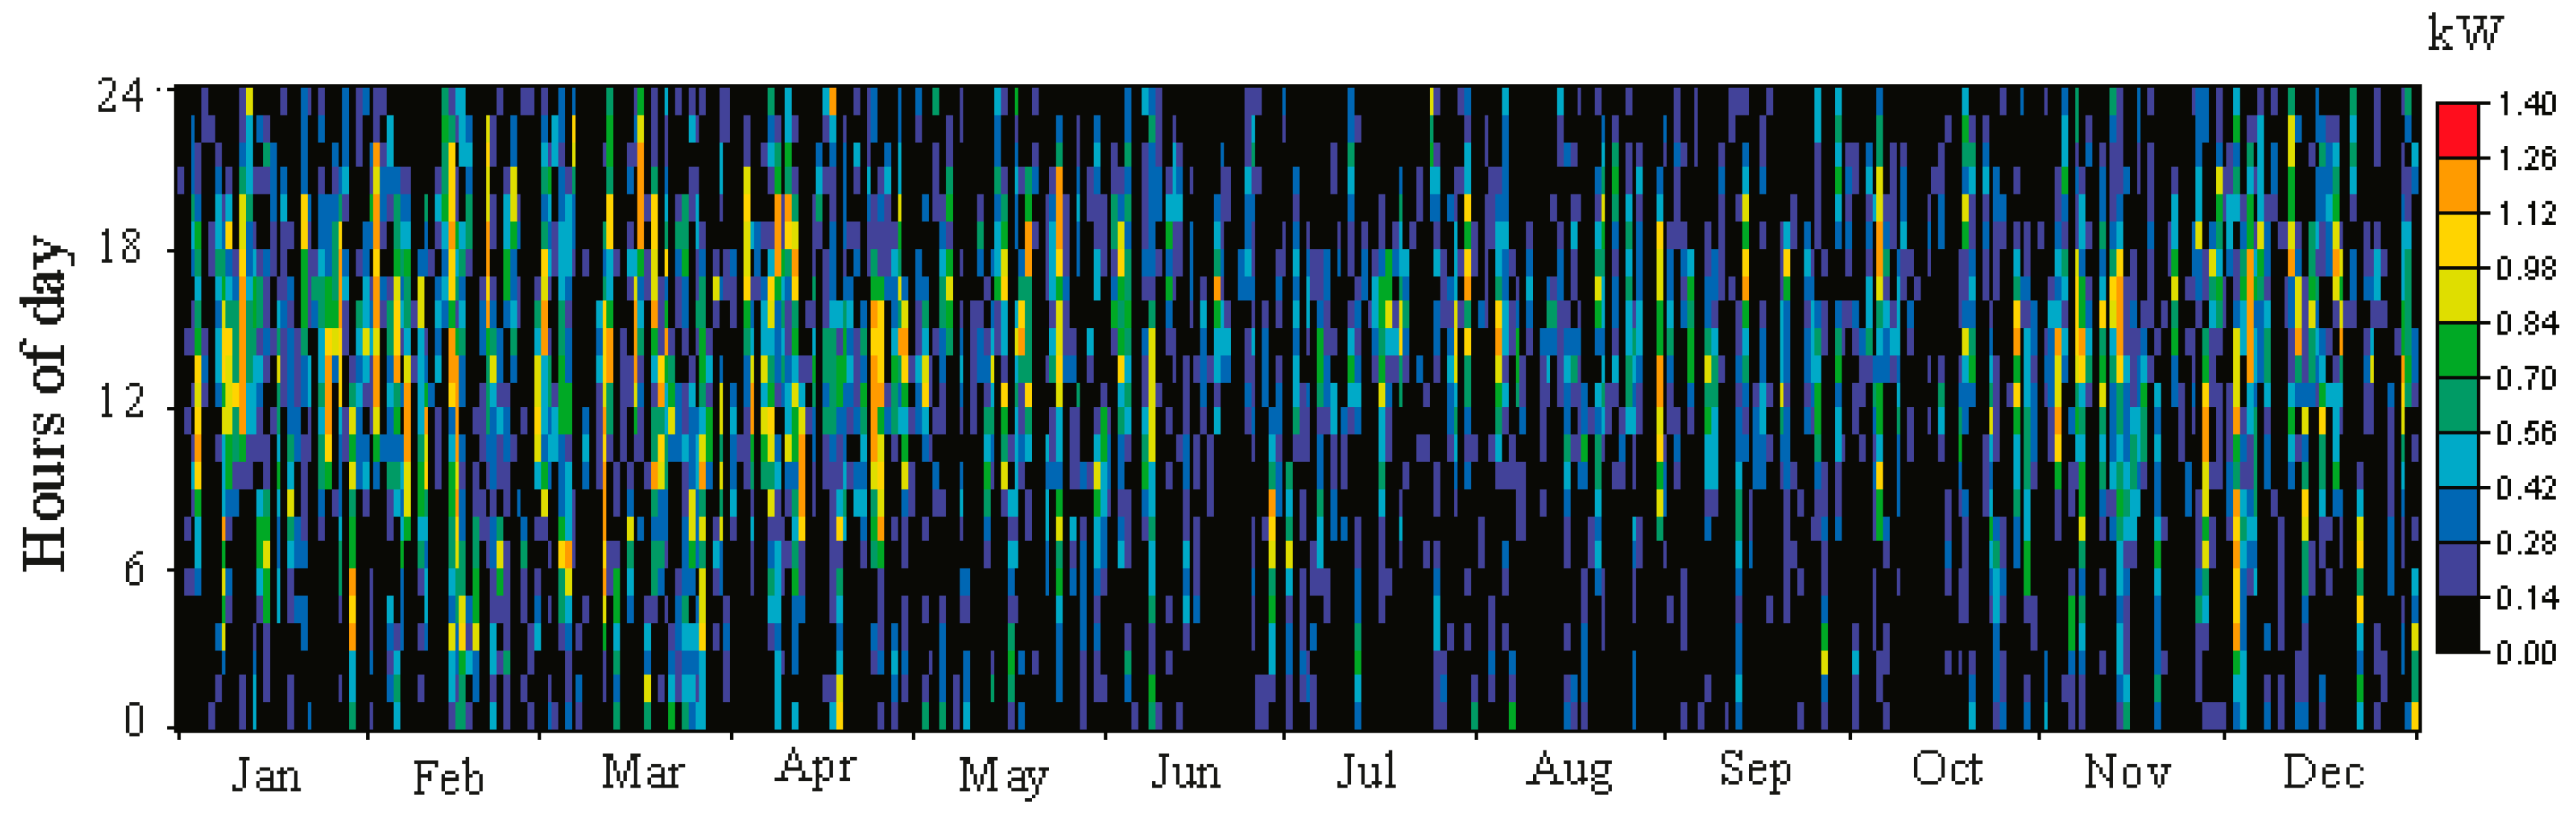
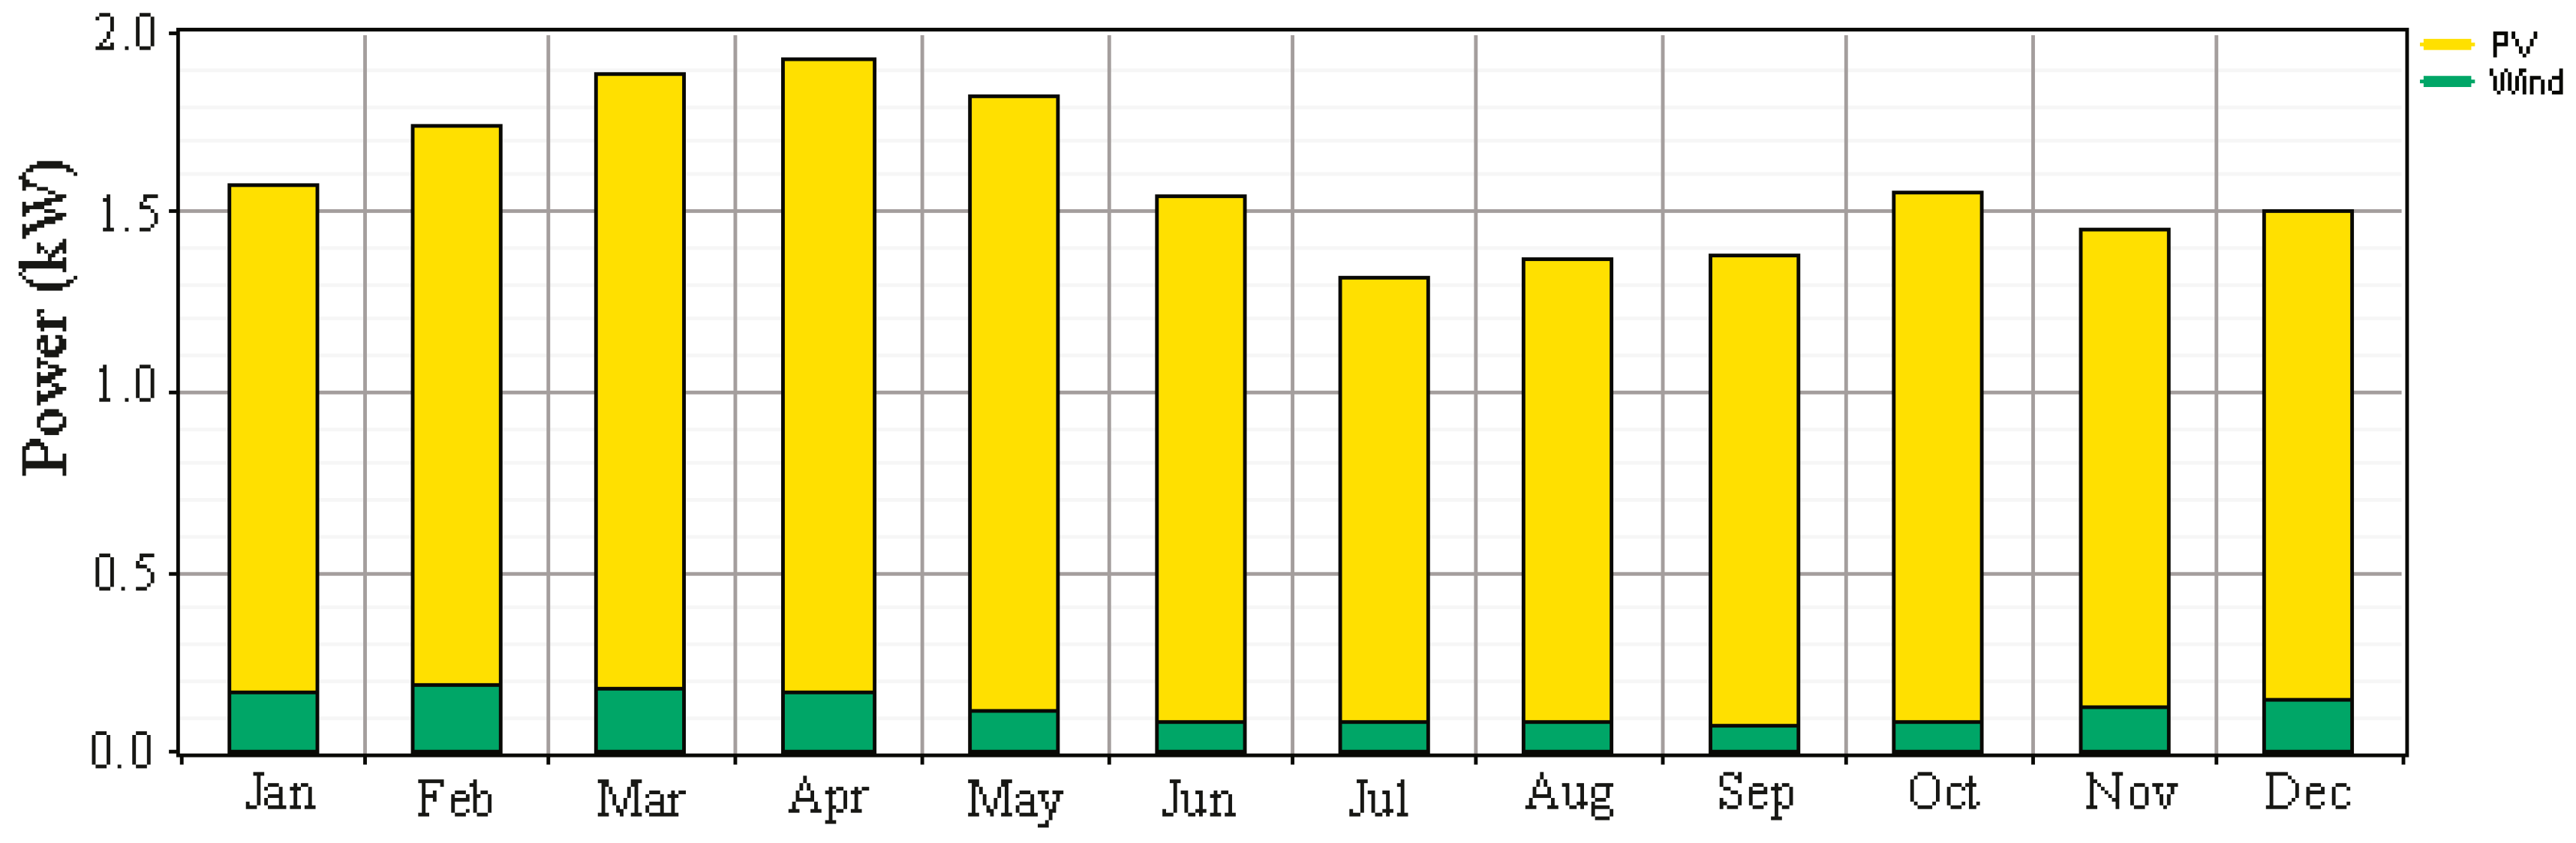
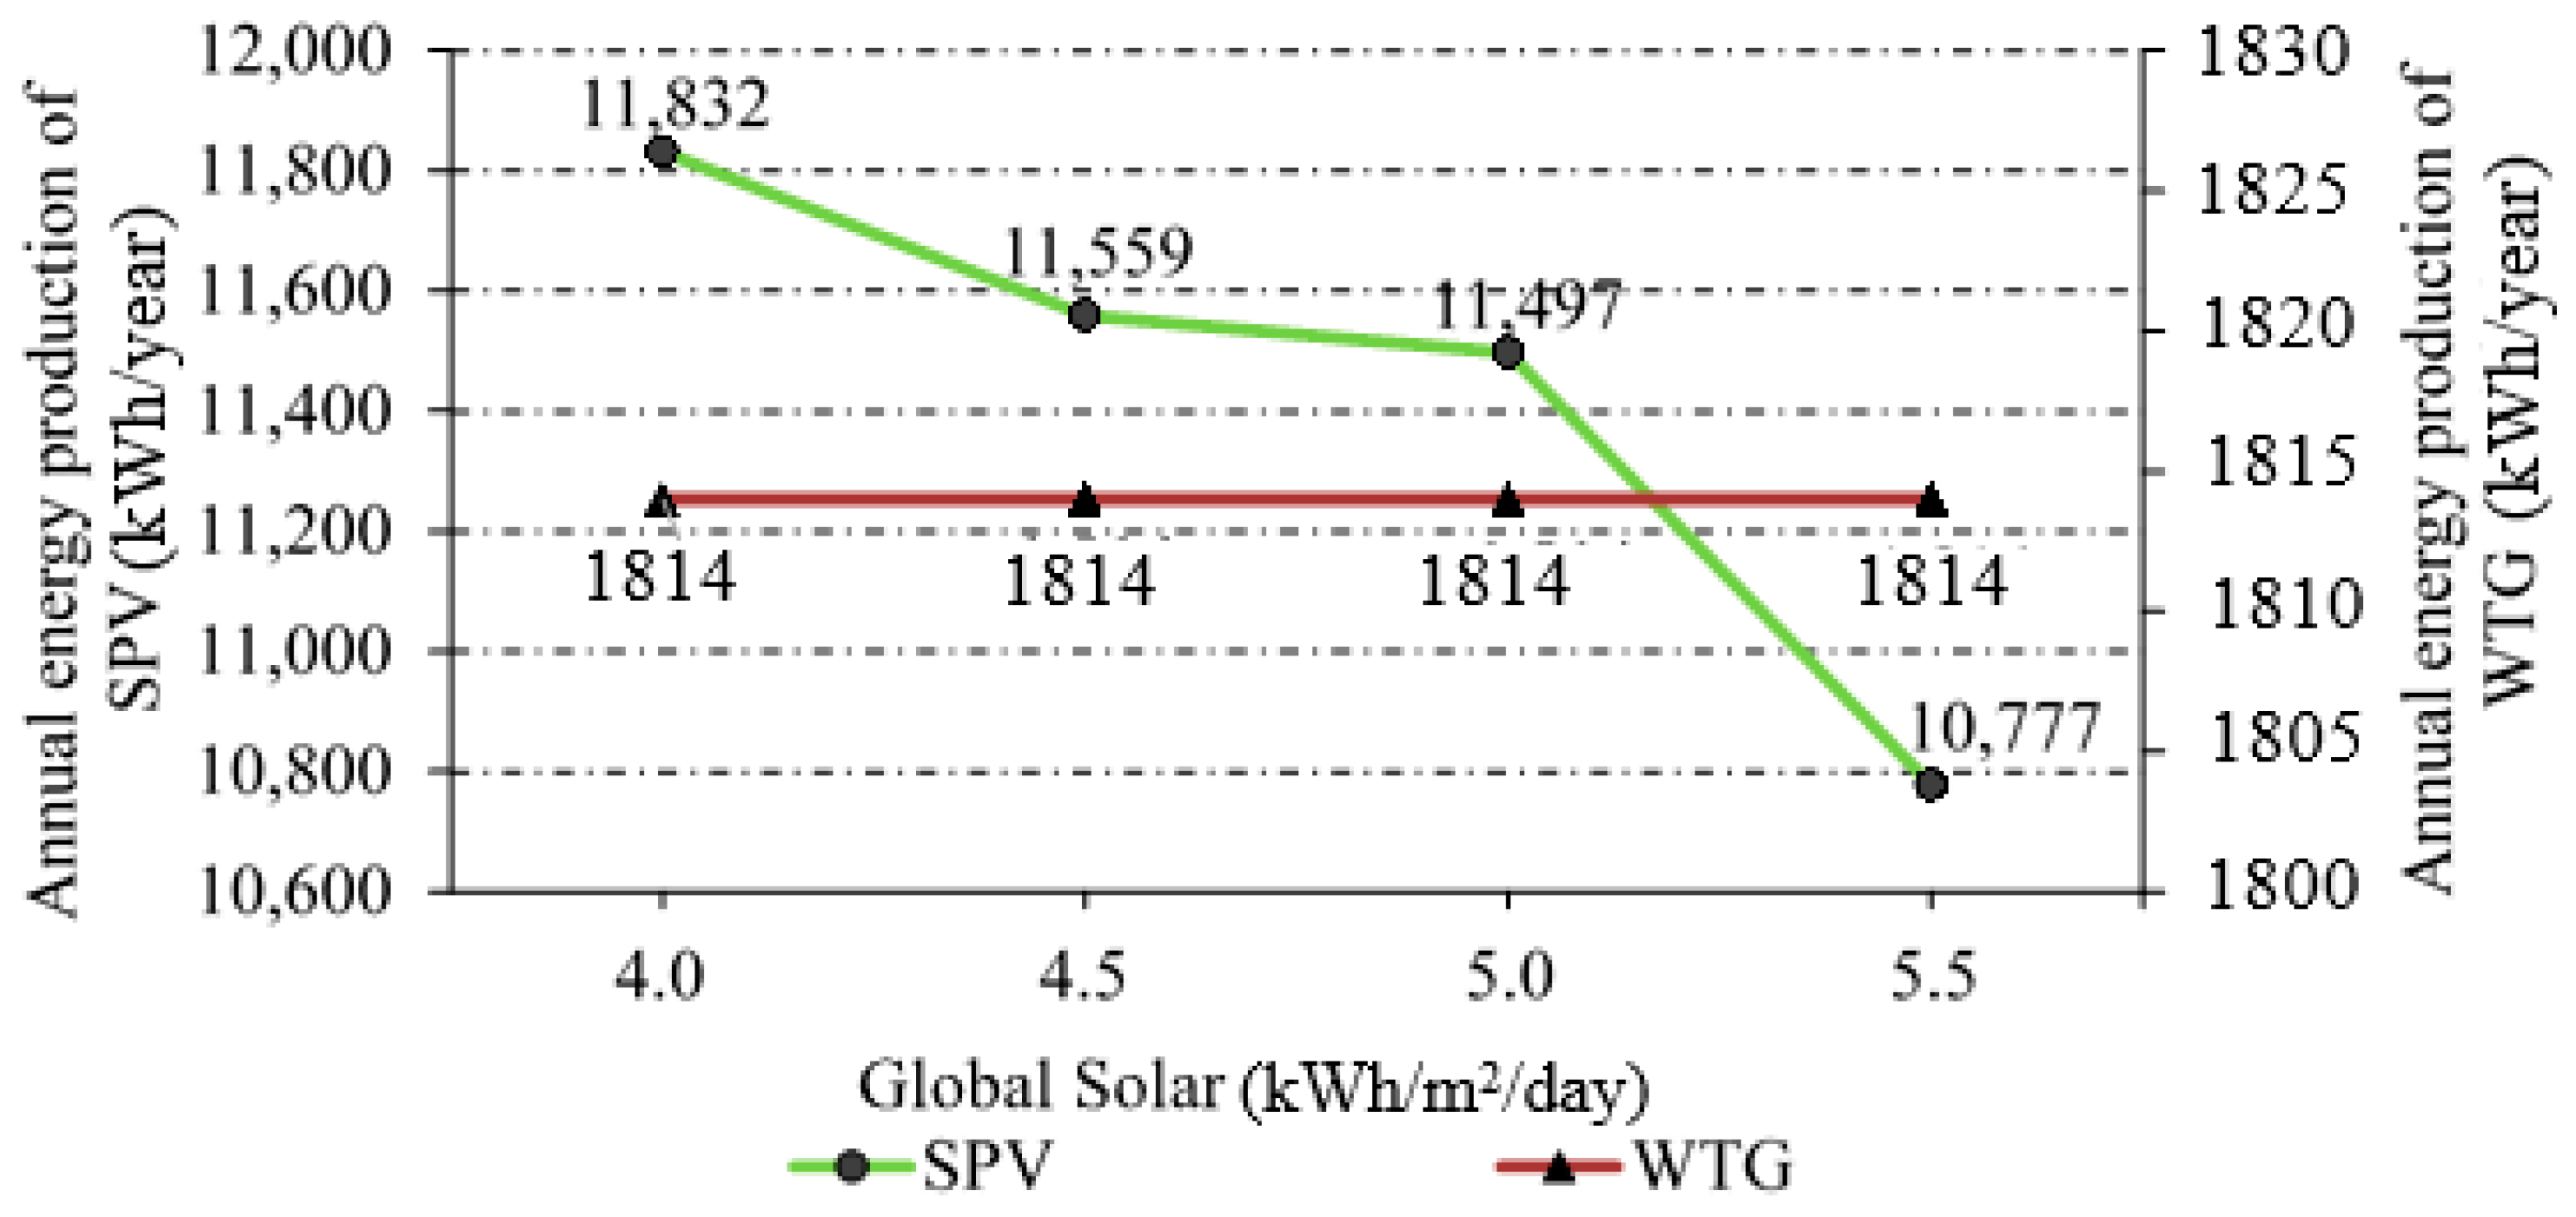
6.2. Energy Yield Analysis
6.3. Economic Analysis
7. Comparison of the Feasibility of Using a Hybrid SPV/WTG system vs. a Diesel Generator
7.1. Diesel Generator
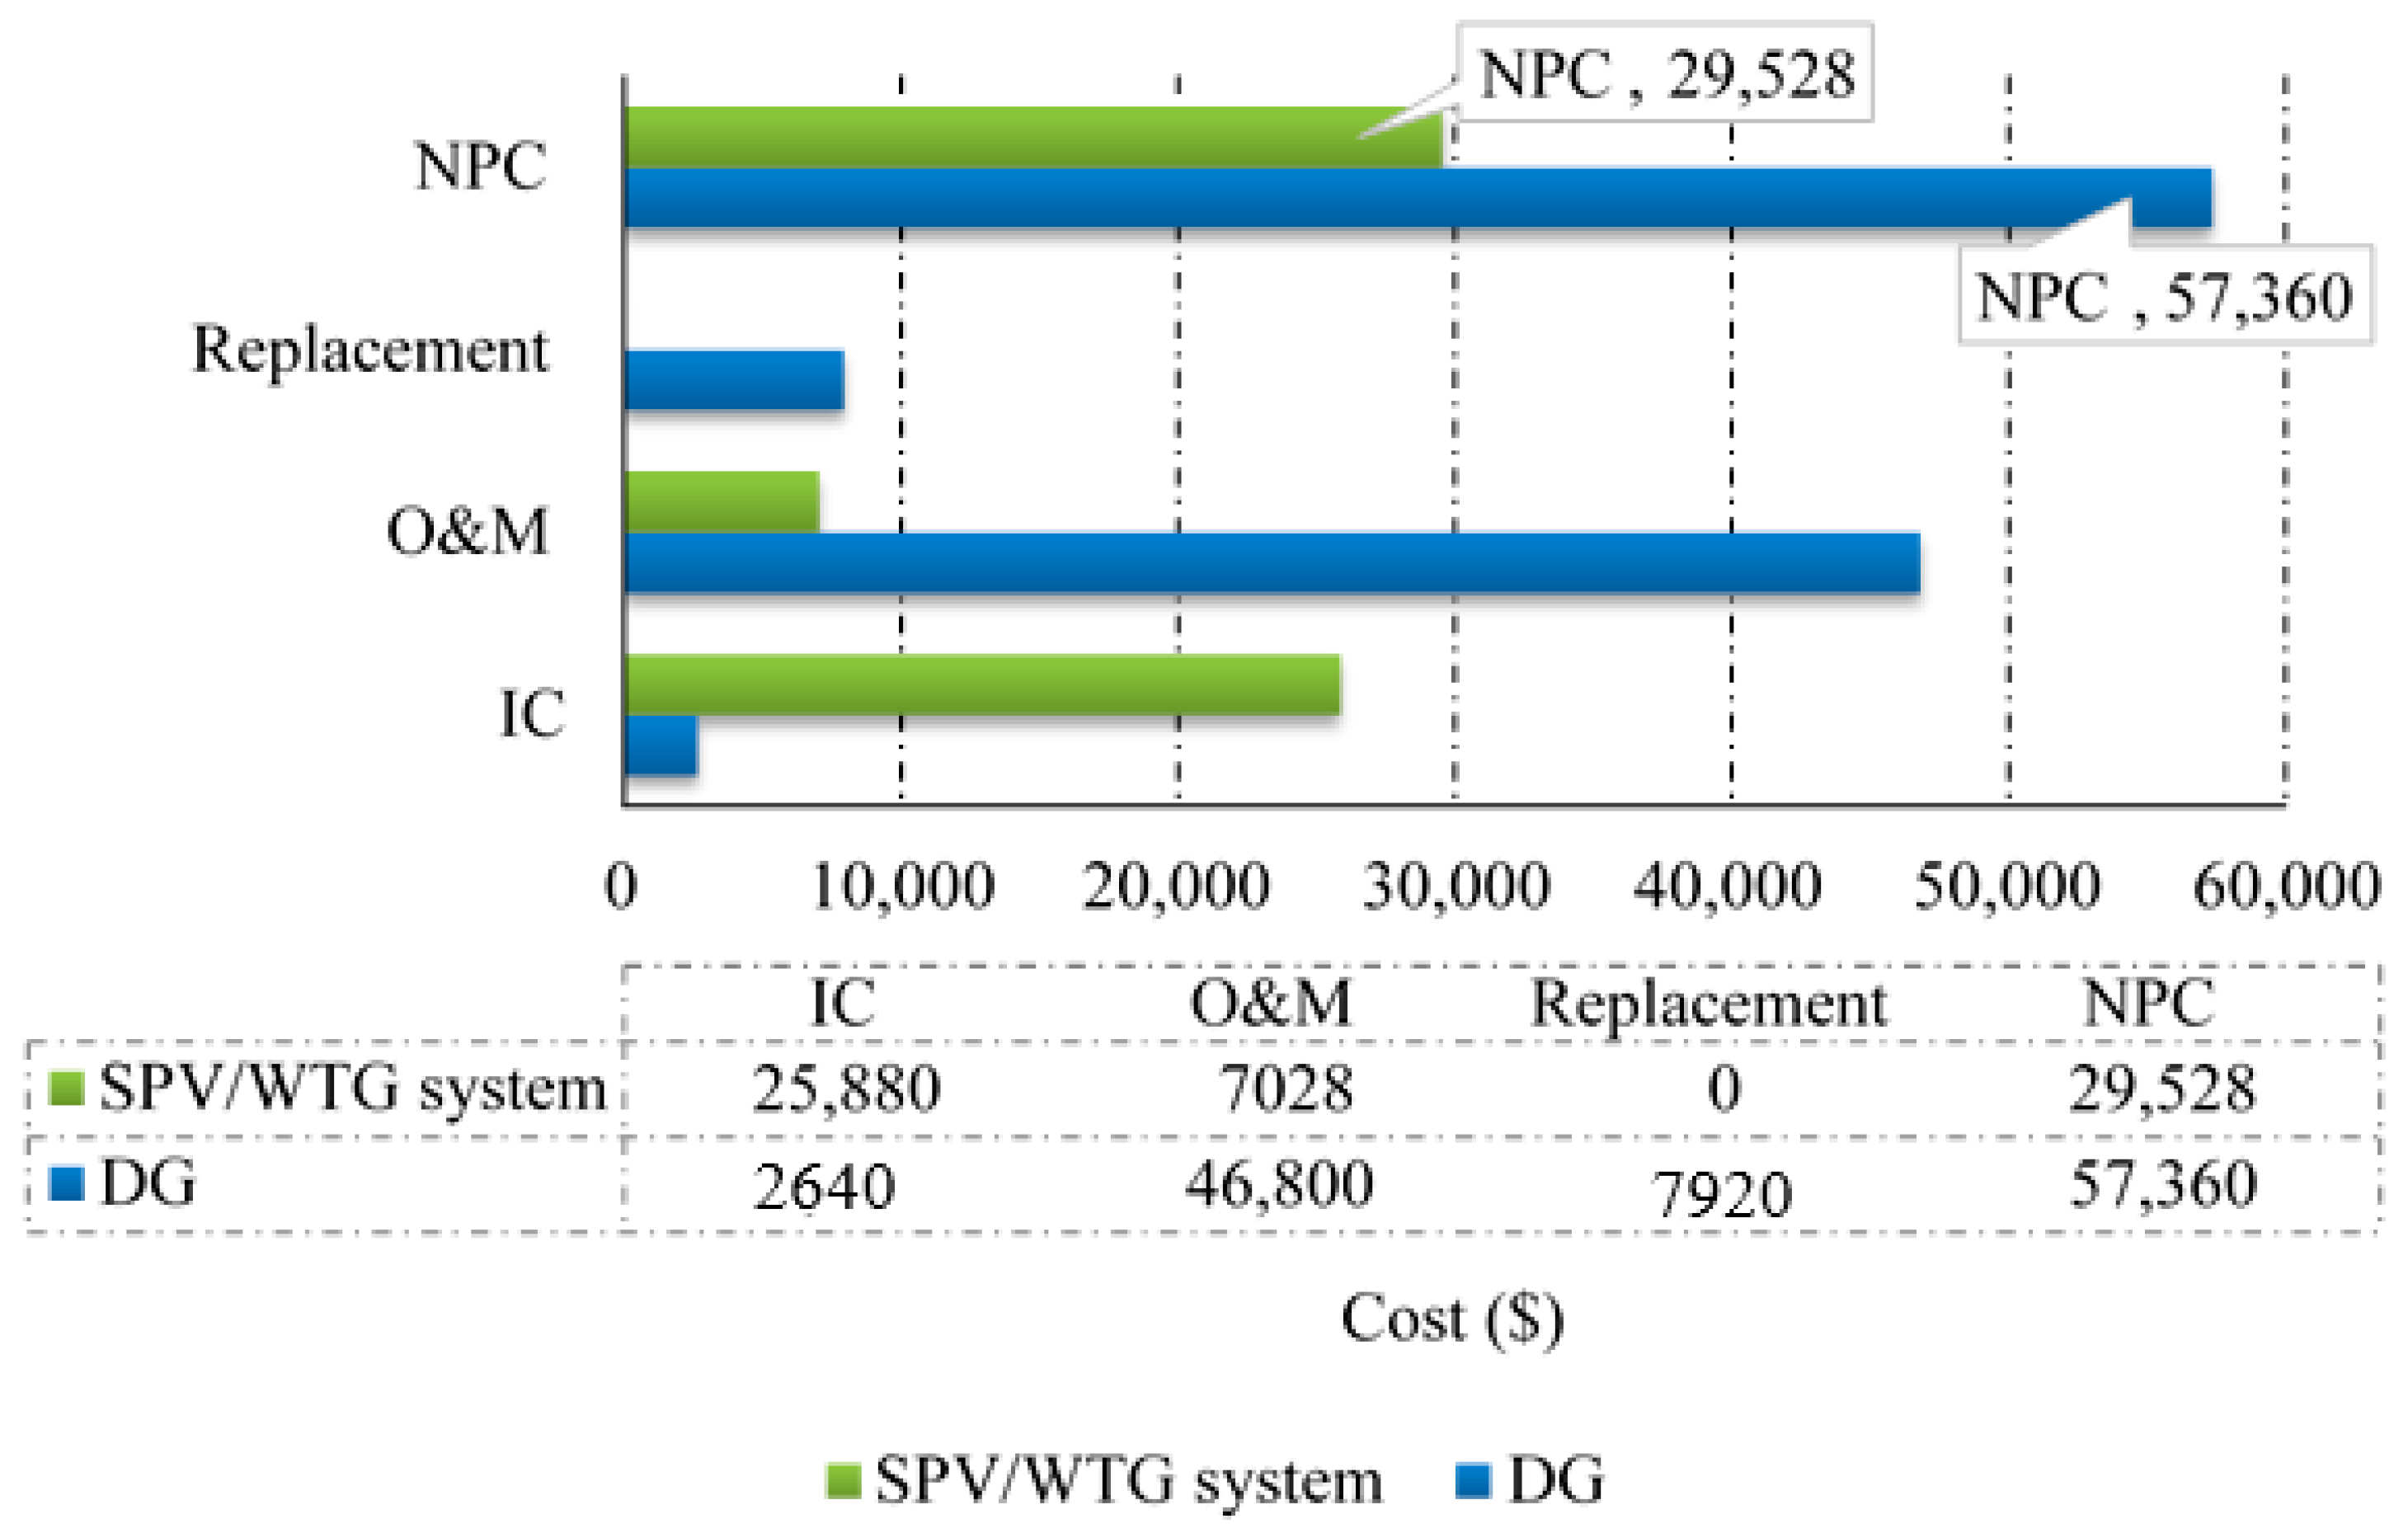
- IC cost: the DG IC cost is $2640 (size 4 kW × cost $660/1 kW). However, the fossil fuels not sustainable and expensive, and the price go up continuously.
- O&M cost: the annual cost for the maintenance and operation of the DG amounted to $4680 (without counting the cost of fuel transport). A breakdown of this cost, (i) $438 for DG maintenance per year based on a DG maintenance cost of $0.05/h × annual DG operating hours 8760 h; and (ii) a fuel cost of $4242, based on the diesel price of $1.04/L [36]) multiplied by the a total diesel consumption of 4079 L per year, which computed based on a specific fuel consumption of 0.388 L/kWh × annual electrical production of the DG of 10,512 kWh/year (DG capacity size 4 kW × DG efficiency 0.3 × 24 h × 365 days/year).
- Replacement cost: mobile operator may need to change the DG every 3 years, which means at least three times during the life of the project. Thus, the total DG replacement cost is 3 × (size 4 kW × cost $660/1 kW), equal $7920 at least.
- NPC cost: the total NPC include IC cost $2640 + O&M cost $46,800 + Replacement cost $7920, equal $57,360 over the project lifetime (10 years); without counting the cost of fuel transport, which adds further to this cost.
- GHG emissions: According to [37], the CO2 emissions of diesel fuel are 2.68 kg/L. Hence, the total annual CO2 emissions are 10,931 kg, computed based on the specific annual diesel consumption of 4079 L multiplied by 2.68 kg CO2/L.
7.2. Hybrid SPV/WTG System
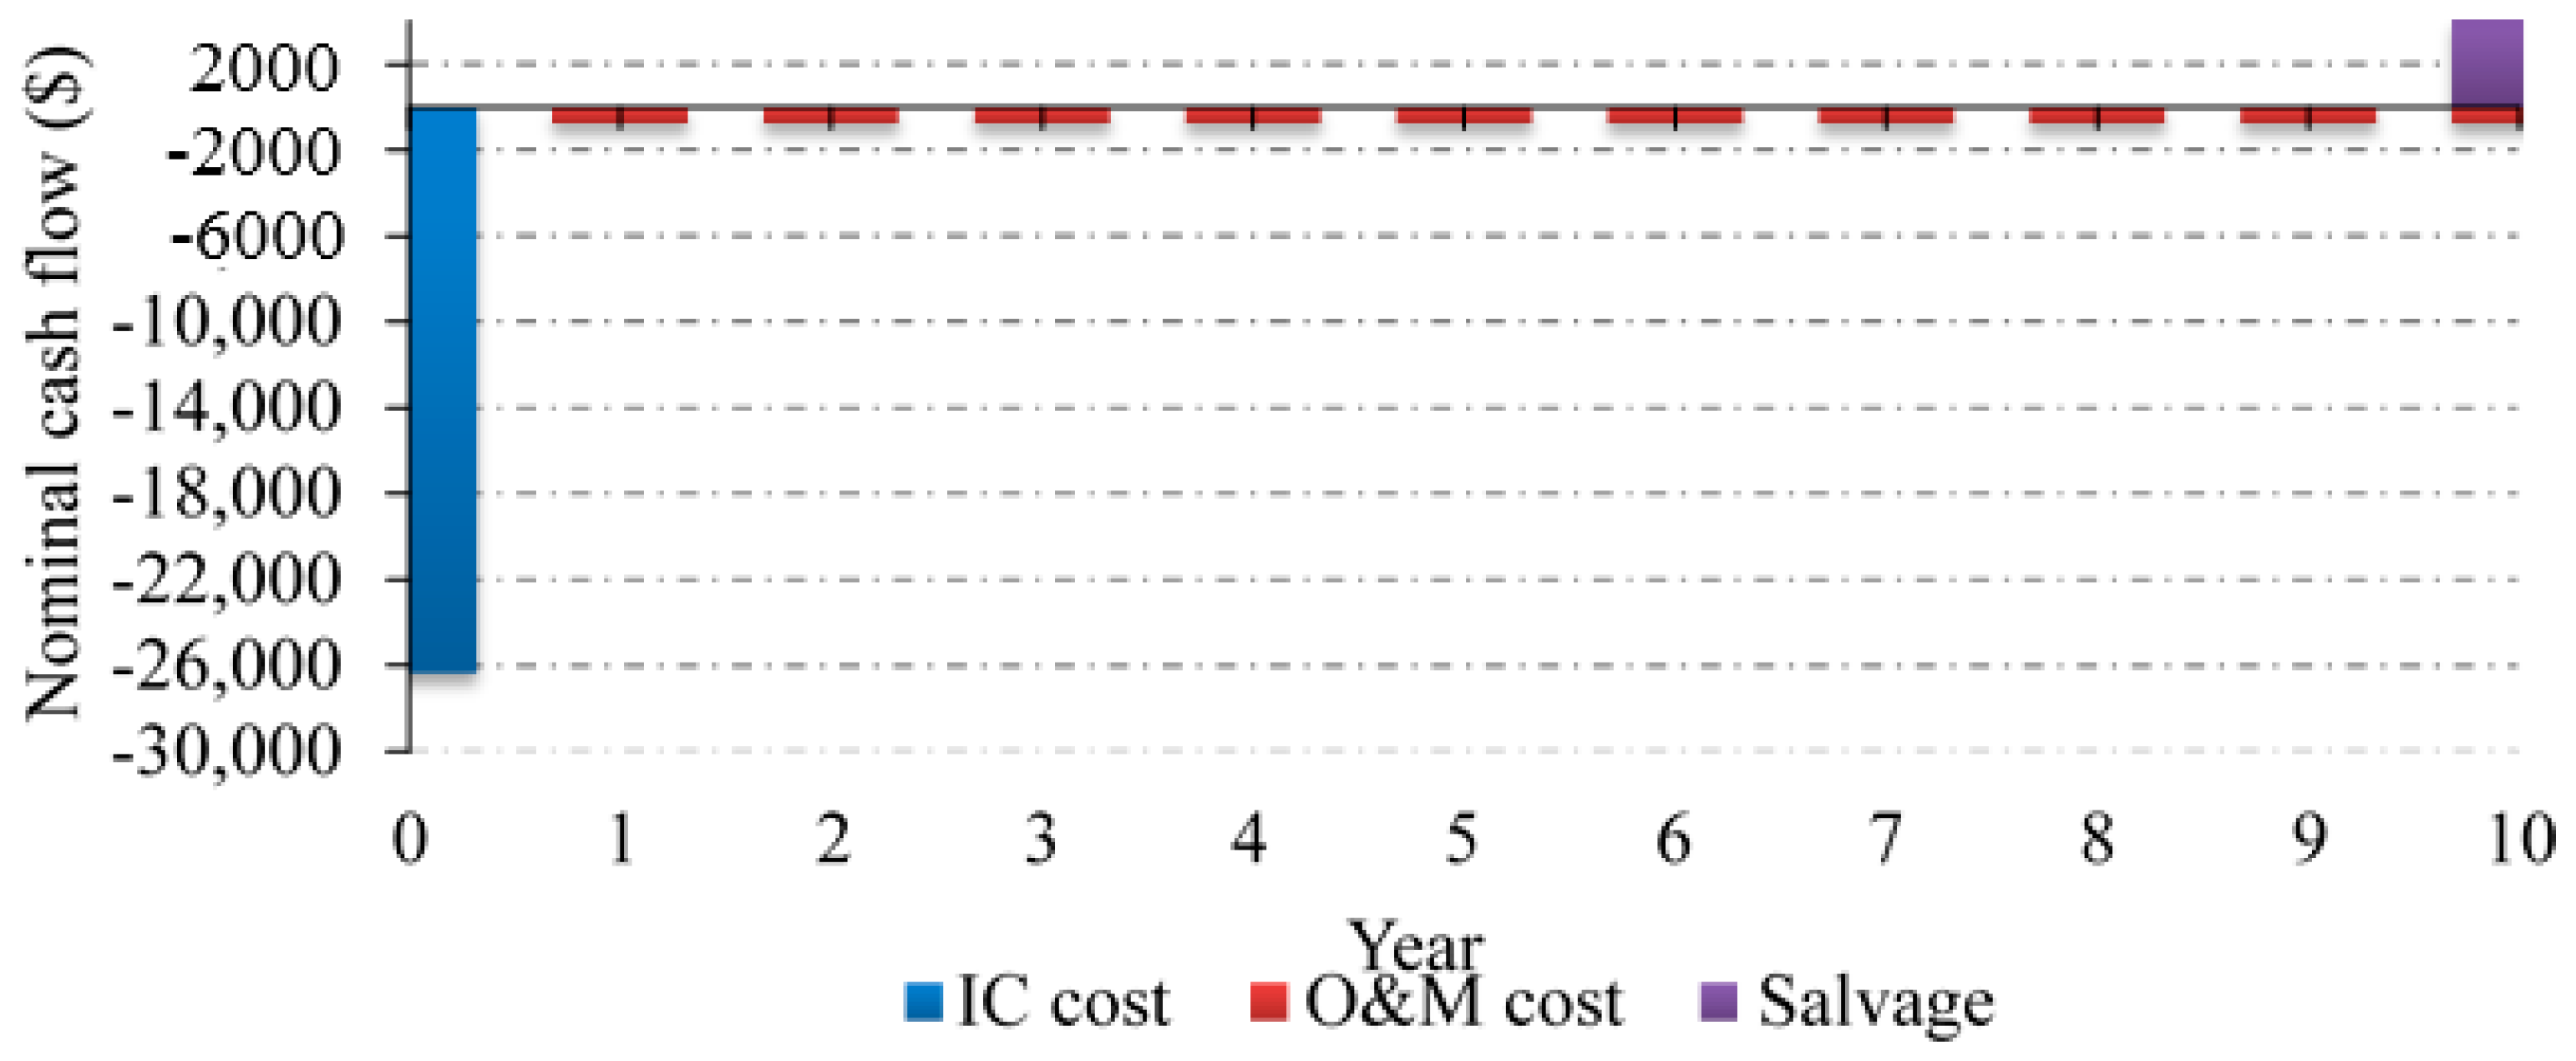
- IC cost: the hybrid SPV/WTG system IC cost is $25,880. The IC cost of the SPV/WTG system is high, due to that the components of the system are expensive comparing with DG. However, the global price of SPV/WTG system go down continuously.
- O&M cost: by applying the proposed SPV/WTG system; a large benefits for mobile operators can be achieved for long term. Since the annual O&M cost can be decreasing to $752, which mean saving amounted 83.83% comparing with O&M cost for DG. However, savings rate will increase more and more in the future, due to the continuing rise in fuel prices.
- Replacement cost: by applying the proposed SPV/WTG system, the batteries have a lifetime of 10 years, which is the same as the project lifetime, the SPV array has a lifetime of 25 years, and WTG and inverter have has a lifetime of 10 years, so neither requires replacement.
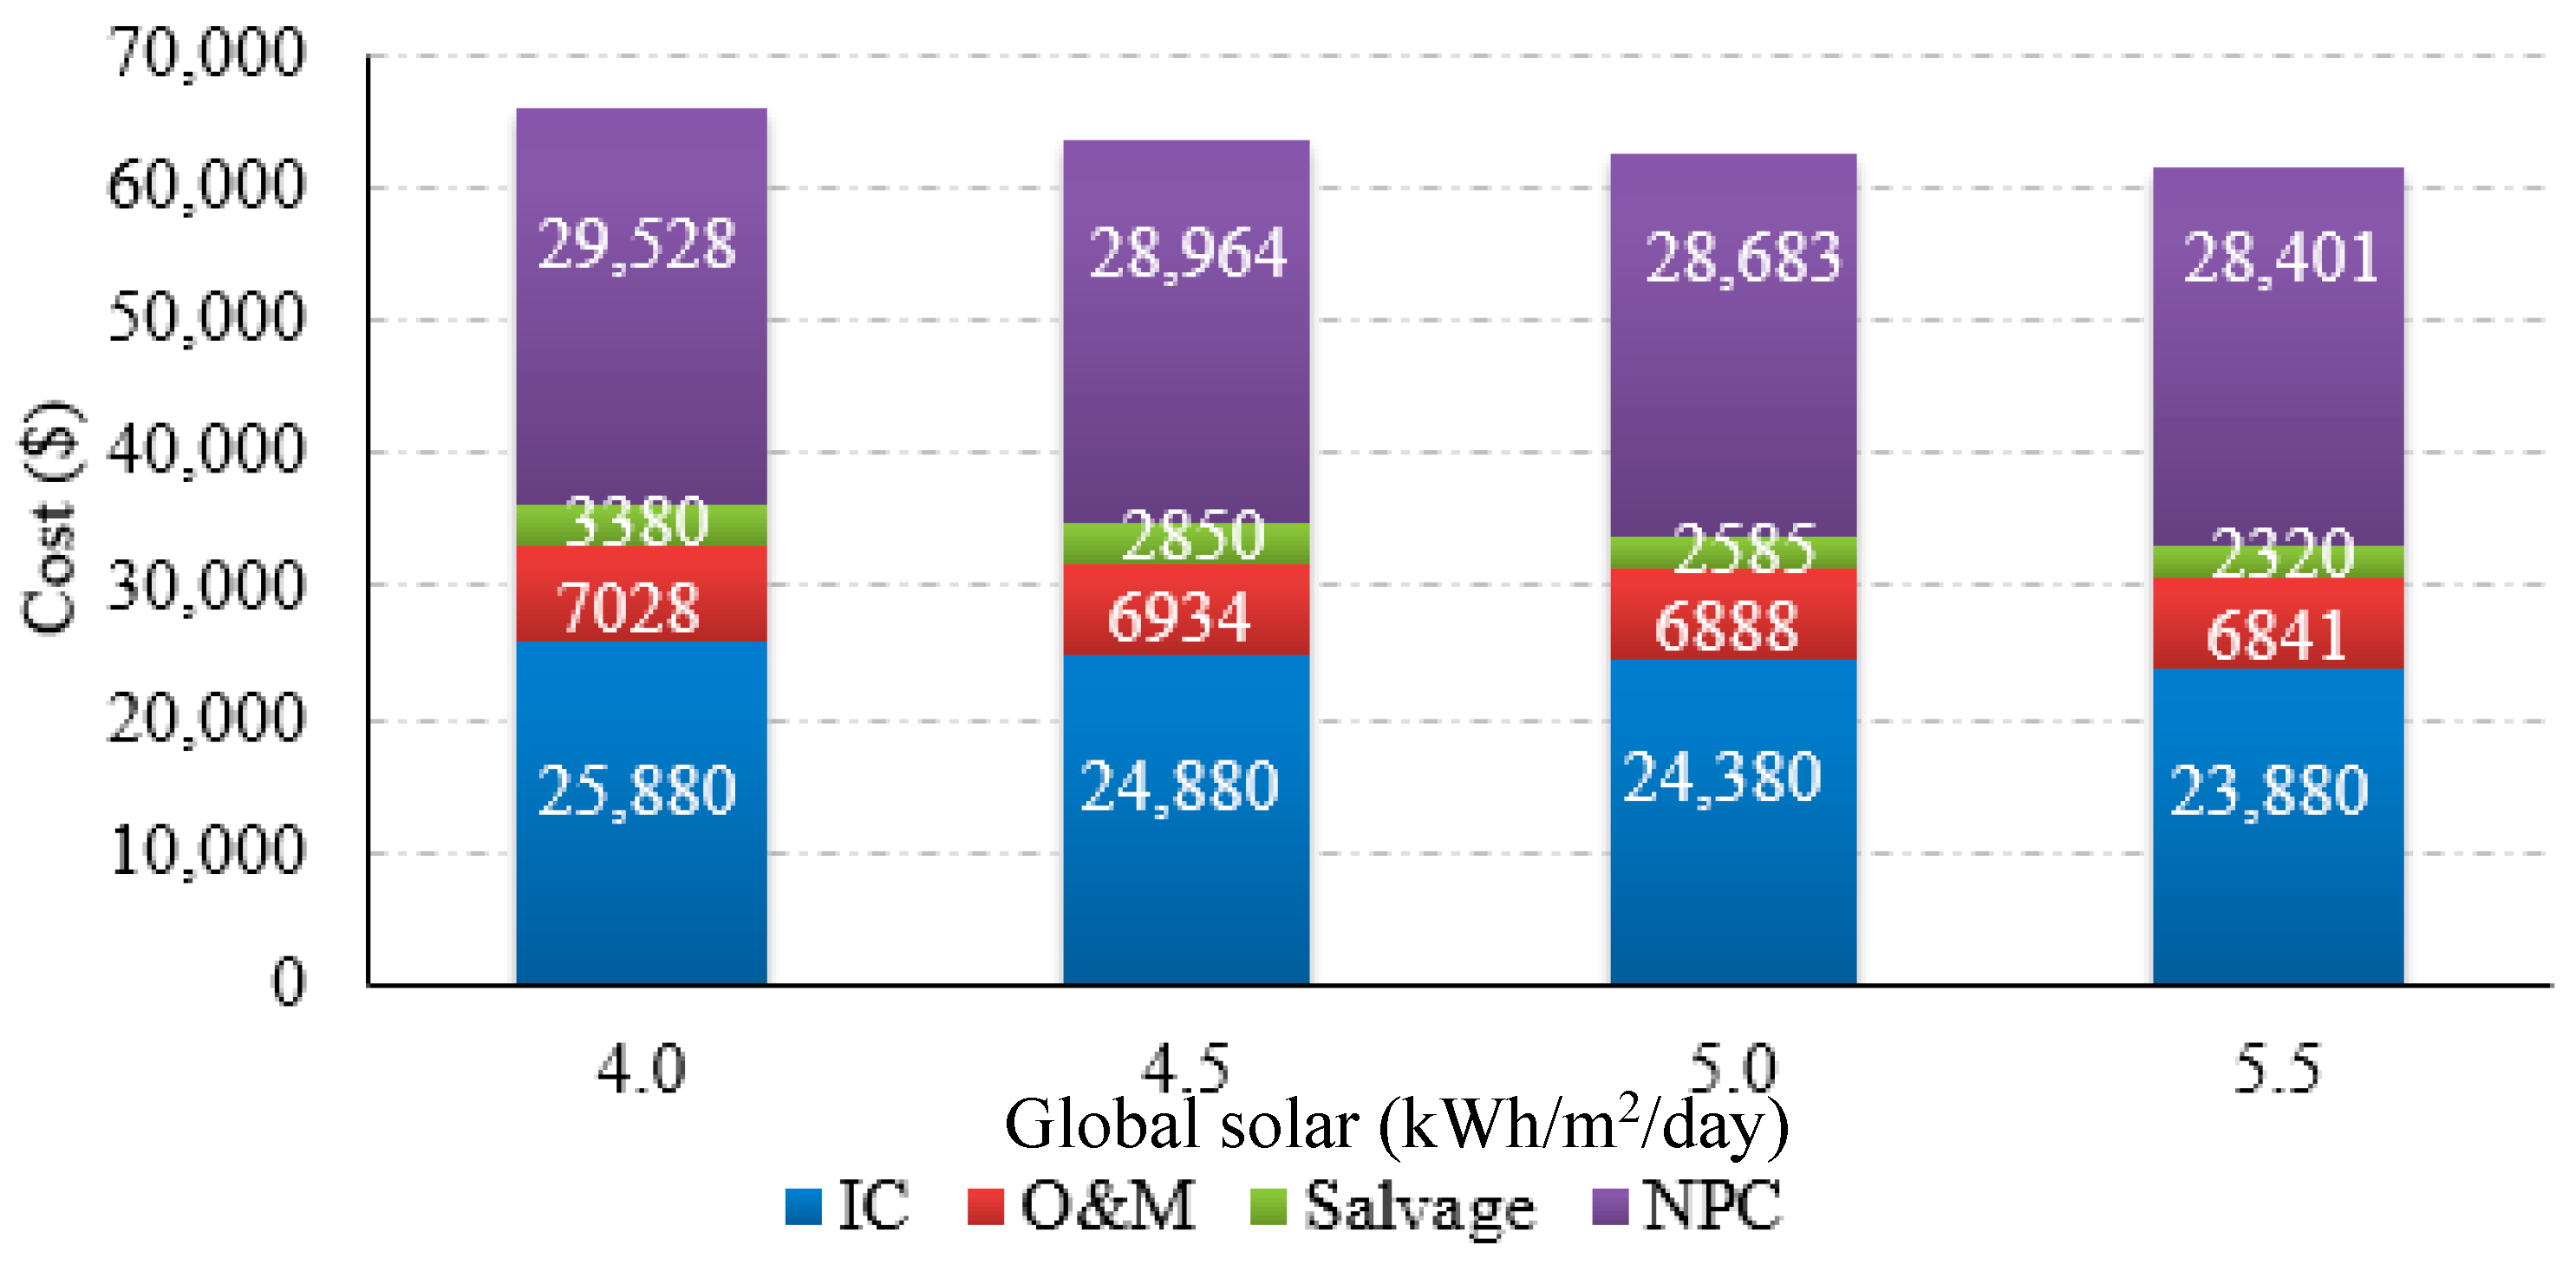
- NPC cost: the total NPC include capital costs $25,880 + O&M costs $7028 − salvage $3380, equal $29,528 over the project lifetime (10 years).
- GHG emissions: Renewable energy systems (RESs) are considered an icon of all that is green. Hence, the trend towards RESs is increasing all over the world to eliminate GHG emissions and minimise the effect on both the wallet and the environment.
8. Conclusions
Acknowledgments
Author Contributions
Conflicts of Interest
Abbreviations
| BB | BaseBand |
| BS | Base Station |
| CDMA | Code Division Multiple Access |
| CO2, NOx, SO2 | Carbon dioxide, Nitrogen oxides, Sulfur dioxide |
| CRF | Capital Recovery Factor |
| DG | Diesel Generator |
| DOD | Depth of Discharge |
| FC | Fuel Cell |
| GHG | GreenHouse Gas |
| GSM | Global System for Mobile Communication |
| HOMER | Hybrid Optimisation Model for Electric Renewables |
| IC | Initial Costs |
| KMA | Korea Meteorological Administration |
| LTE | Long Term Evolution |
| MIMO | Multiple-Input and Multiple-Output |
| MSW | Modified Sine-Wave |
| NPC | Net Present Cost |
| NREL | National Renewable Energy Laboratory |
| O&M | Operation and Maintenance Costs |
| OPEX | OPerational EXpenditure |
| PA | Power Amplifier |
| PSH | Peak Solar Hours |
| RF | Radio-Frequency |
| SCR | Solar Control Regulator |
| SOC | State of Charge |
| SPV | Solar Photovoltaic |
| STC | Standard Test Conditions |
| TAC | Total Annualised Cost |
| WTG | Wind Turbine Generator |
Symbols
| Pop | BS operating power |
| Power consumed by power amplifier | |
| Radio frequency power | |
| Baseband power | |
| BS transmission power | |
| Po | Normalized BS transmission power |
| PBS | Total Power Consumption for the BS |
| Pmc | Microwave backhaul power |
| Plm | Auxiliary equipment power |
| σDC | DC-DC power supply losses |
| σcool | Cooling losses |
| NTRX | Number of transceivers |
| ηPA | PA efficiency |
| α | Path loss coefficient |
| Ro | Coverage radius |
| EPV | Energy output of the PV array |
| YPV | Rated capacity of the PV array |
| fPV | PV derating factor |
| Abatt | Battery bank autonomy |
| Nbatt | Number of batteries |
| Vnom | Nominal voltage of a single battery |
| Qnom | Nominal capacity of a single battery |
| Lprim,ave | Average daily LTE-macro BS load |
| Rbatt | Battery bank lifetime |
| Qlifetime | Lifetime throughput of a single battery |
| Qthrpt | Annual battery throughput |
| Rbatt,f | Battery float life |
References
- 3GPP System Standards. Available online: http://www.3gpp.org/news-events/3gpp-news/1614-sa_5g (accessed on 30 July 2016).
- Netmanias Report, LTE in Korea. Available online: http://www.netmanias.com/en/post/reports/6060/kt-korea-lg-u-lte-lte-a-sk-telecom-wideband-lte/lte-in-korea-2013 (accessed on 30 July 2016).
- Open Signal. Available online: http://opensignal.com/reports/2016/02/state-of-lte-q4-2015/ (accessed on 30 July 2016).
- Alsharif, M.H.; Nordin, R.; Ismail, M. Survey of Green Radio Communications Networks: Techniques and Recent Advances. J. Comput. Netw. Commun. 2013, 2013, 453893. [Google Scholar] [CrossRef]
- Alsharif, M.H.; Nordin, R.; Ismail, M. Classification, recent advances and research challenges in energy efficient cellular networks. Wirel. Pers. Commun. 2014, 77, 1249–1269. [Google Scholar] [CrossRef]
- Aris, A.M.; Shabani, B. Sustainable power supply solutions for off-grid base stations. Energies 2015, 8, 10904–10941. [Google Scholar] [CrossRef]
- Kusakana, K.; Vermaak, H.J. Hybrid Renewable Power Systems for Mobile Telephony Base Stations in Developing Countries. Renew. Energy 2013, 51, 419–425. [Google Scholar] [CrossRef]
- Seoin, B.; Heetae, K.; Hyun, J.C. Optimal Hybrid Renewable Power System for an Emerging Island of South Korea: The Case of Yeongjong Island. Sustainability 2015, 7, 13985–14001. [Google Scholar]
- Ng, D.W.K.; Lo, E.S.; Schober, R. Energy-Efficient Resource Allocation in OFDMA Systems with Hybrid Energy Harvesting Base Station. IEEE Trans. Wirel. Commun. 2013, 12, 3412–3427. [Google Scholar] [CrossRef]
- Ahmed, I.; Ikhlef, A.; Ng, D.W.K.; Schober, R. Power Allocation for an Energy Harvesting Transmitter with Hybrid Energy Sources. IEEE Trans. Wirel. Commun. 2013, 12, 6255–6267. [Google Scholar] [CrossRef]
- Martínez-Díaz, M.; Villafáfila-Robles, R.; Montesinos-Miracle, D.; Sudrià-Andreu, A. Study of Optimization Design Criteria for Stand-Alone Hybrid Renewable Power Systems. In Proceedings of the International Conference on Renewable Energies and Power Quality (ICREPQ’13), Bilbao, Spain, 20–22 March 2013; pp. 1–5.
- Kaldellis, J. Optimum hybrid photovoltaic-based solution for remote telecommunication stations. Renew. Energy 2010, 35, 2307–2315. [Google Scholar] [CrossRef]
- Serincan, M.F. Reliability considerations of a fuel cell backup power system for telecom applications. J. Power Sources 2016, 309, 66–75. [Google Scholar] [CrossRef]
- Belkhiri, S.; Chaker, A. Optimization of Hybrid PV/Wind System for Remote Telecom Station, a Case Study of Different Sites in Algeria. In Proceedings of the Chemical, Biological and Environmental Engineering, Ho Chi Minh City, Vietnam, 23–25 March 2016; pp. 1–7.
- Hossam, K.; Mikhail, A.R.; Hafez, I.M.; Anis, W.R. Optimum Design of PV Systems for BTS in Remote and Urban Areas. Int. J. Sci. Technol. Res. 2016, 5, 1–9. [Google Scholar]
- Salih, T.; Wang, Y.; Adam, M.A.A. Renewable micro hybrid system of solar panel and wind turbine for telecommunication equipment in remote areas in Sudan. Energy Procedia 2014, 61, 80–83. [Google Scholar] [CrossRef]
- Imtiaz, A.W.; Hafeez, K. Stand Alone PV System for Remote Cell Site in Swat Valley. In Proceedings of the 1st International Conference on Technology and Business Management, Peshawar, Pakistan, 2–4 April 2013; pp. 1–5.
- Nema, P.; Nema, R.; Rangnekar, S. Minimization of Green House Gases Emission by Using Hybrid Energy System for Telephony Base Station Site Application. Renew. Sustain. Energy Rev. 2010, 14, 1635–1639. [Google Scholar] [CrossRef]
- Moury, S.; Khandoker, N.M.; Haider, M.S. Feasibility Study of Solar PV Arrays in Grid Connected Cellular BTS Sites. In Proceedings of the 2012 IEEE International Conference on Advances in Power Conversion and Energy Technologies (APCET), Mylavaram, India, 2–4 August 2012; pp. 1–5.
- Groupe Speciale Mobile Association. Green Power for Mobile bi Annual Report 2014; Groupe Speciale Mobile Association (GSMA): London, UK, 2014. [Google Scholar]
- Imran, M.; Katranaras, E.; Auer, G.; Blume, O.; Giannini, V.; Godor, I.; Jading, Y.; Olsson, M.; Sabella, D.; Skillermark, P. Energy Efficiency Analysis of the Reference Systems, Areas of Improvements and Target Breakdown; Technical Report, ICT-EARTH Deliverable D2.3; EC-IST Office: Brussels, Belgium, 2011. [Google Scholar]
- Auer, G.; Giannini, V.; Desset, C.; Godor, I.; Skillermark, P.; Olsson, M.; Imran, M.A.; Sabella, D.; Gonzalez, M.J.; Blume, O. How much energy is needed to run a wireless network? IEEE Wirel. Commun. 2011, 18, 40–49. [Google Scholar] [CrossRef]
- Schmitt, G. The Green Base Station. In Proceedings of the 4th International Conference on Telecommunication—Energy Special Conference (TELESCON), Frankfurt, Germany, 10–13 May 2009; pp. 1–6.
- Lambert, T.; Gilman, P.; Lilienthal, P. Micropower System Modeling with HOMER. 2006. Available online: http://homerenergy.com/documents/MicropowerSystemModelingWithHOMER.pdf (accessed on 30 July 2016).
- Alsharif, M.H.; Nordin, R.; Ismail, M. Energy optimisation of hybrid off-grid system for remote telecommunication base station deployment in Malaysia. EURASIP J. Wirel. Commun. Netw. 2015, 2015, 1–15. [Google Scholar] [CrossRef]
- KMA, Annual Climatological Report 2013, Korea Meteorological Administration. Available online: http://www.kma.go.kr/weather/observation/data_monthly.jsp (accessed on 30 July 2016).
- NASA. Available online: https://eosweb.larc.nasa.gov/cgi-bin/sse/homer.cgi?email=skip%40larc.nasa.gov&step=1&lat=37.499&lon=126.54958&submit=Submit&ms=1&ds=1&ys=1998&me=12&de=31&ye=1998&daily=swv_dwn (accessed on 30 July 2016).
- Alsharif, M.H.; Kim, J. Optimal Solar Power System for Remote Telecommunication Base Stations: A Case Study Based on the Characteristics of South Korea’s Solar Radiation Exposure. Sustainability 2016, 8, 942. [Google Scholar] [CrossRef]
- NIMS. Available online: http://www.greenmap.go.kr/02_data/data01.do#2#1#1 (accessed on 19 August 2016).
- The Bank of Korea Monetary Policy. Available online: http://www.bok.or.kr/baserate/baserateList.action?%20menuNaviId=33 (accessed on 30 July 2016).
- Ge, X.; Cheng, H.; Guizani, M.; Han, T. 5G wireless backhaul networks: Challenges and research advances. IEEE Netw. 2014, 28, 6–11. [Google Scholar] [CrossRef]
- Sharp Solar Electricity Incorporation. Available online: http://www.sharp-world.com/solar/en/solutions/index.html (accessed on 30 July 2016).
- FT-1000L Wind Turbine Generator Model. Available online: http://www.chinaseniorsupplier.com/Electrical_Equipment_Supplies/Generators/60423002878/Home_use_1000w_wind_turbine_generator_manufacturer.html (accessed on 30 July 2016).
- Trojan Battery Incorporation. Available online: http://www.trojanbattery.com/ (accessed on 30 July 2016).
- Leonics Incorporation, SolarCon SPT-Series. Available online: http://www.leonics.com/product/renewable/solar_charge_controller/dl/spt-074.pdf (accessed on 30 July 2016).
- Global Petrol Prices. Available online: http://www.globalpetrolprices.com/South-Korea/diesel_prices/ (accessed on 30 July 2016).
- Calculation of CO2 Emissions. Available online: http://people.exeter.ac.uk/TWDavies/energy_conversion/Calculation%20of%20CO2%20emissions%20from%20fuels.htm (accessed on 30 July 2016).


| Item | Notation | Unit | LTE Macro-BS |
|---|---|---|---|
| PA | Max transmit (rms) power, Pmax | W | 39.8 |
| Max transmit (rms) power | dBm | 46.0 | |
| Peak average power ratio (PAPR) | dB | 8.0 | |
| Peak output power | dBm | 54.0 | |
| PA efficiency, µ | % | 38.8 | |
| Total PA | W | 102.6 | |
| TRX | PTX | W | 5.7 |
| PRX | W | 5.2 | |
| Total RF | W | 10.9 | |
| BB | Radio (inner Rx/Tx) | W | 5.4 |
| Turbo code (outer Rx/Tx) | W | 4.4 | |
| Processor | W | 5.0 | |
| Total BB | W | 14.8 | |
| DC-DC loss, σDC | % | 6.0 | |
| Cooling loss, σcool | % | 10.0 | |
| Total per TRX = | W | 151.65 | |
| Number of sectors (NSect) | # | 3 | |
| Number of antennas (NAnt) | # | 2 | |
| Number of carriers (NCarr) | # | 1 | |
| Number of transceivers (NTRX = NSect × NAnt × NCarr) | # | 6 | |
| Total number of NTRX chains, Pop = NTRX × Total per TRX | W | 909.93 | |
| Microwave link (Pmc) | W | 80 | |
| Lamps | W | 40 | |
| System | Parameters | Value |
|---|---|---|
| Renewable energy resources | Solar radiation | 4.0, 4.5, 5.0, 5.5 kWh/m2/day |
| Wind speed | 4.0 m/s | |
| Control parameters | Annual real interest rate | 1.25% |
| Project lifetime | 10 years | |
| Dispatch strategy | cyclic charging | |
| Apply setpoint state of charge | 80% | |
| Operating reserve: as percent of load, hourly load | 10% | |
| SPV | Sizes considered | 4, 4.5, 5,5.5,6, 6.5, 7 kW |
| Operational lifetime | 25 years | |
| Efficiency | 90% | |
| System tracking | Two axis | |
| Capital cost | $1/W | |
| Replacement cost | $1/W | |
| O&M cost per year | $0.01/W | |
| WTG | Sizes considered | 1, 2, and 3 kW |
| Operational lifetime | 15 years | |
| Hub | 50 m | |
| Capital cost | $0.6/W | |
| Replacement cost | $0.6/W | |
| O&M cost per year | $0.05/W | |
| Inverter | Sizes considered | 0.1, 0.15, 0.2, 0.25, & 0.3 kW |
| Efficiency | 95% | |
| Operational lifetime | 15 years | |
| Capital cost | $0.4/W | |
| Replacement cost | $0.4/W | |
| O&M cost per year | $0.01/W | |
| Trojan L16P Battery | Number of batteries | 32, 40, 48, 56, 64, 72 |
| Round trip efficiency | 85% | |
| Minimum state of charge | 30% | |
| Nominal voltage | 6 V | |
| Nominal current | 360 Ah at 20 h | |
| Nominal capacity | 6 V × 360 Ah = 2.16 kWh | |
| Lifetime throughput | 1075 kWh | |
| Max. charge rate | 1 A/Ah | |
| Max. charge current | 18 A | |
| Self-discharge rate | 0.1% per hour | |
| Min. operational lifetime | 5 years | |
| Capital cost | $300 | |
| Replacement cost | $300 | |
| O&M cost per year | $10 |
| Resources | Optimum Sizing | Costs Factor | ||||||
|---|---|---|---|---|---|---|---|---|
| Wind Speed (m/s) | Radiation (kWh/m2/day) | SPV (kW) | WTG (kW) | Battery (unit) | Inverter (kW) | Initial Cost (IC) ($) | Annual O&M ($) | NPC ($) |
| 4.0 | 4.0 | 6.0 | 1 | 64 | 0.20 | 25,880 | 752 | 29,528 |
| 4.5 | 5.0 | 1 | 64 | 0.20 | 24,880 | 742 | 28,965 | |
| 5.0 | 4.5 | 1 | 64 | 0.20 | 24,380 | 737 | 28,683 | |
| 5.5 | 4.0 | 1 | 64 | 0.20 | 23,880 | 732 | 28,401 | |
© 2016 by the authors; licensee MDPI, Basel, Switzerland. This article is an open access article distributed under the terms and conditions of the Creative Commons Attribution (CC-BY) license (http://creativecommons.org/licenses/by/4.0/).
Share and Cite
Alsharif, M.H.; Kim, J. Hybrid Off-Grid SPV/WTG Power System for Remote Cellular Base Stations Towards Green and Sustainable Cellular Networks in South Korea. Energies 2017, 10, 9. https://doi.org/10.3390/en10010009
Alsharif MH, Kim J. Hybrid Off-Grid SPV/WTG Power System for Remote Cellular Base Stations Towards Green and Sustainable Cellular Networks in South Korea. Energies. 2017; 10(1):9. https://doi.org/10.3390/en10010009
Chicago/Turabian StyleAlsharif, Mohammed H., and Jeong Kim. 2017. "Hybrid Off-Grid SPV/WTG Power System for Remote Cellular Base Stations Towards Green and Sustainable Cellular Networks in South Korea" Energies 10, no. 1: 9. https://doi.org/10.3390/en10010009
APA StyleAlsharif, M. H., & Kim, J. (2017). Hybrid Off-Grid SPV/WTG Power System for Remote Cellular Base Stations Towards Green and Sustainable Cellular Networks in South Korea. Energies, 10(1), 9. https://doi.org/10.3390/en10010009