
Forecasting of Chinese Primary Energy Consumption in 2021 with GRU Artificial Neural Network

Abstract
:1. Introduction
2. Literature Review
2.1. Energy Consumption Forecast
2.2. Multiple Linear Regression
2.3. Support Vector Machine
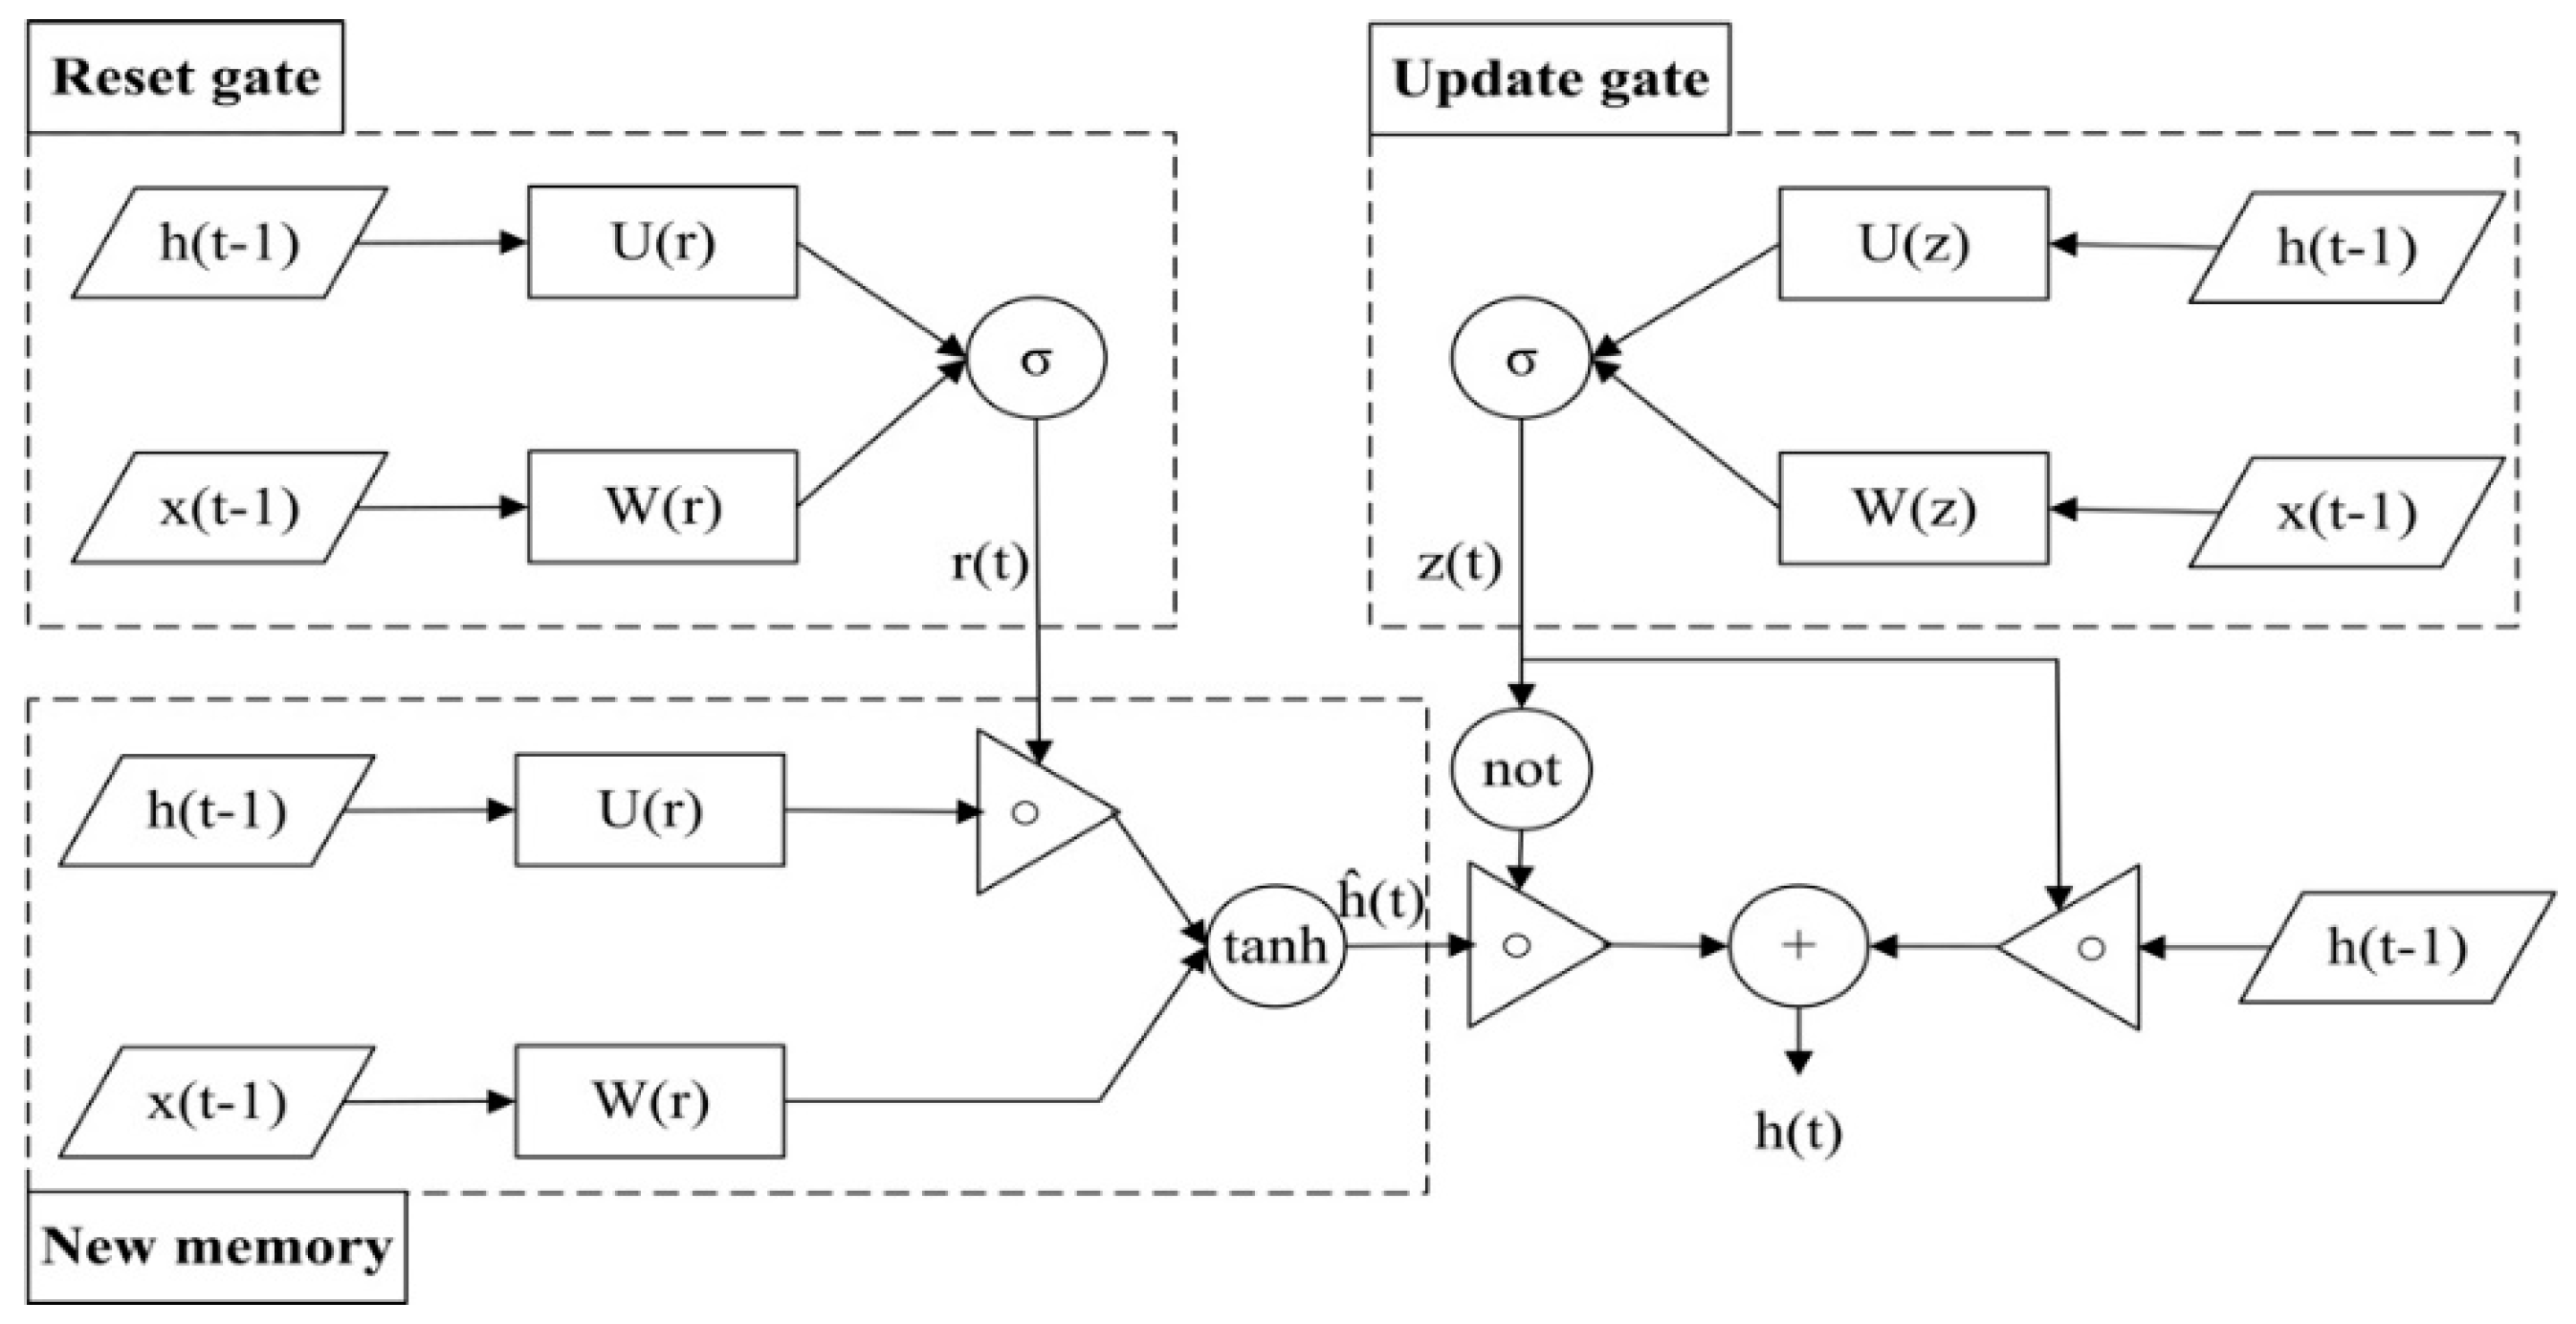
2.4. Gated Recurrent Unit
3. Research Methods
3.1. Multiple Linear Regression Model
3.2. Support Vector Regression Model
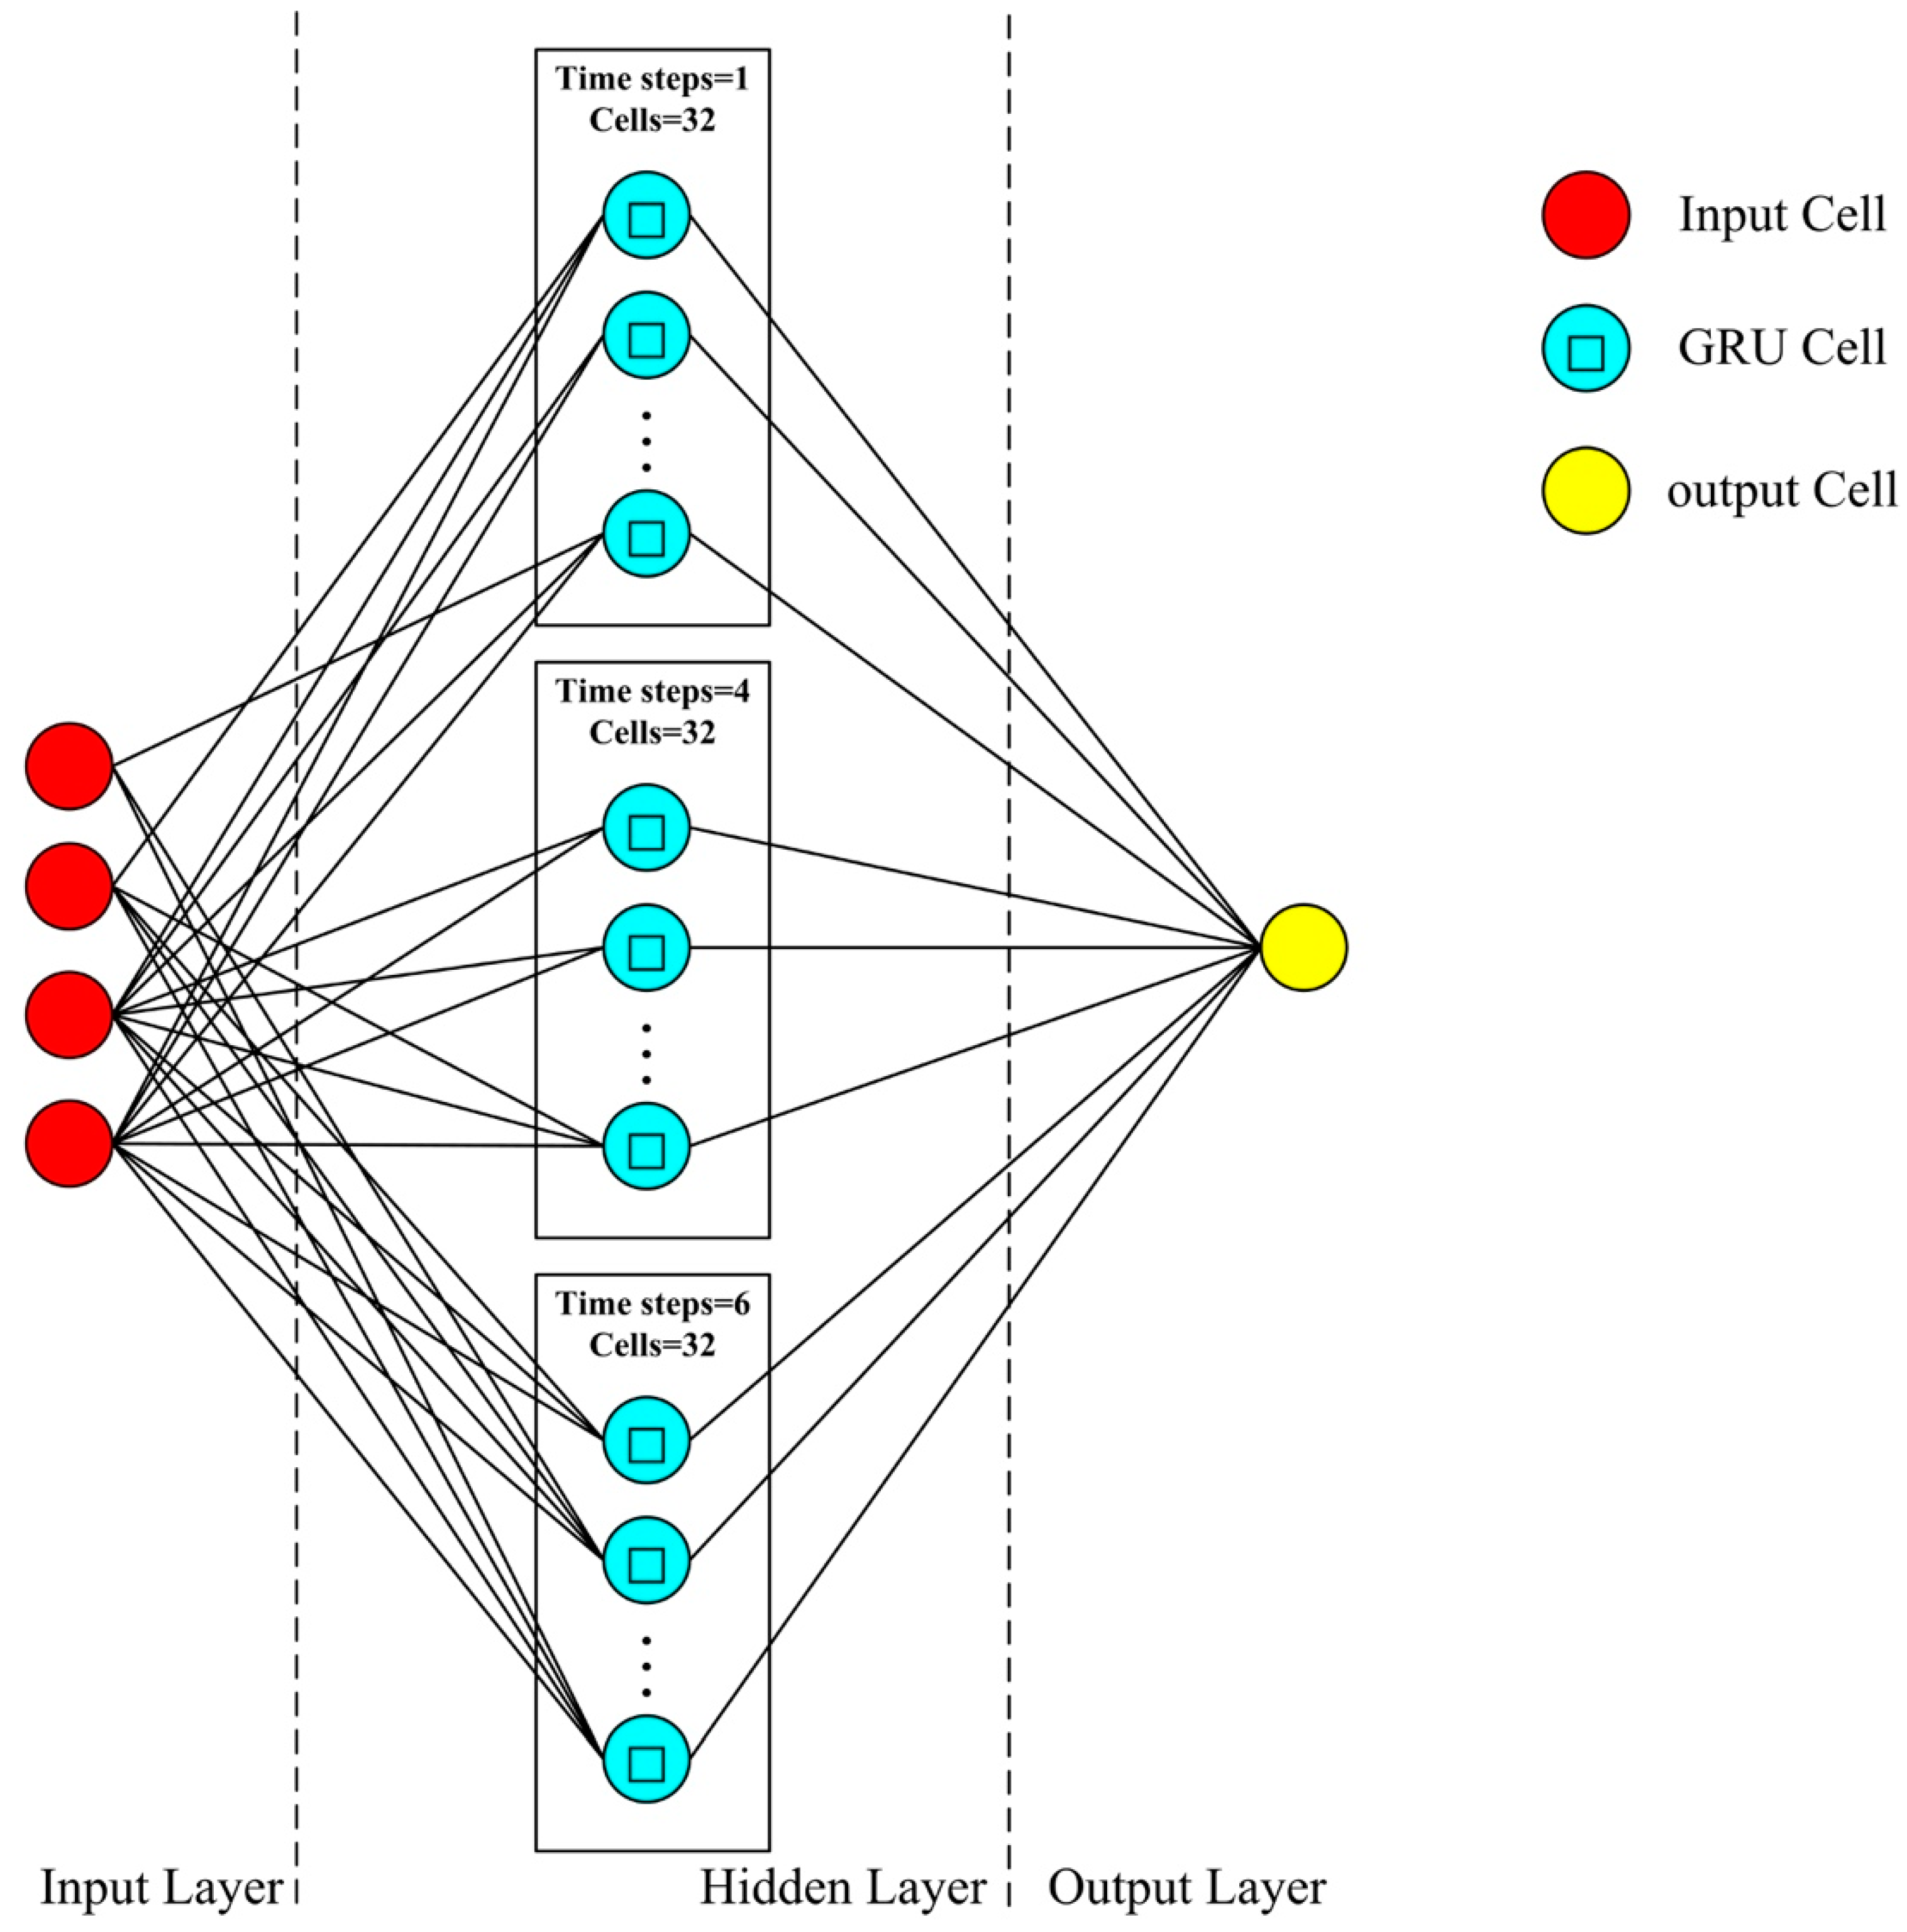
3.3. Gated Recurrent Unit Neural Network Model
4. Data and Results Analysis
4.1. Data Sources
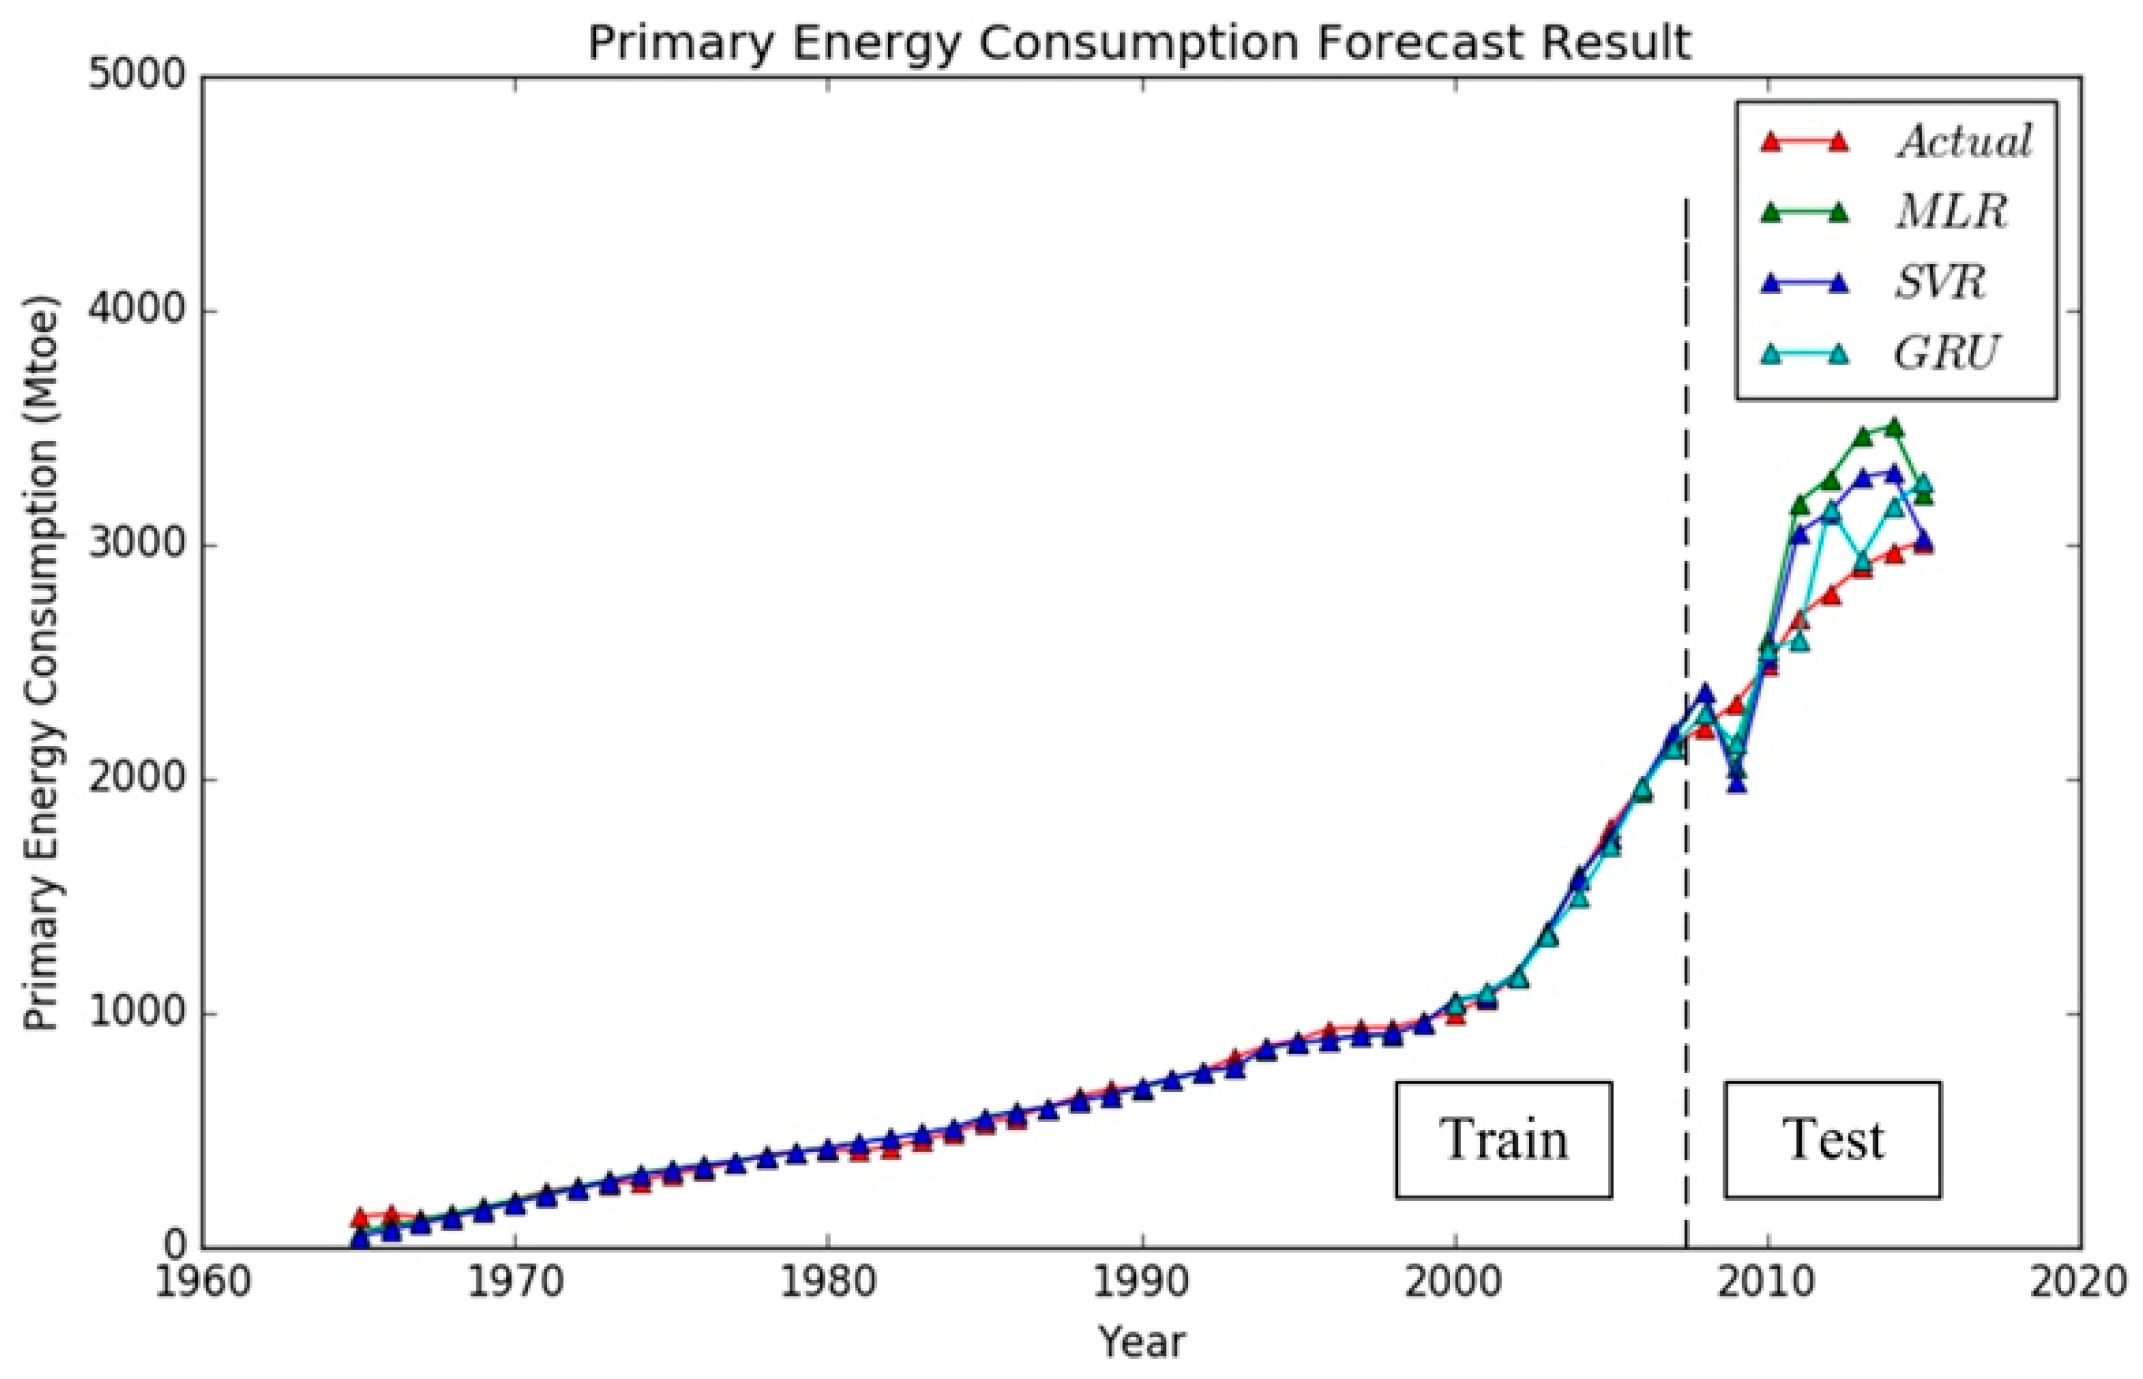
4.2. Analysis of Results
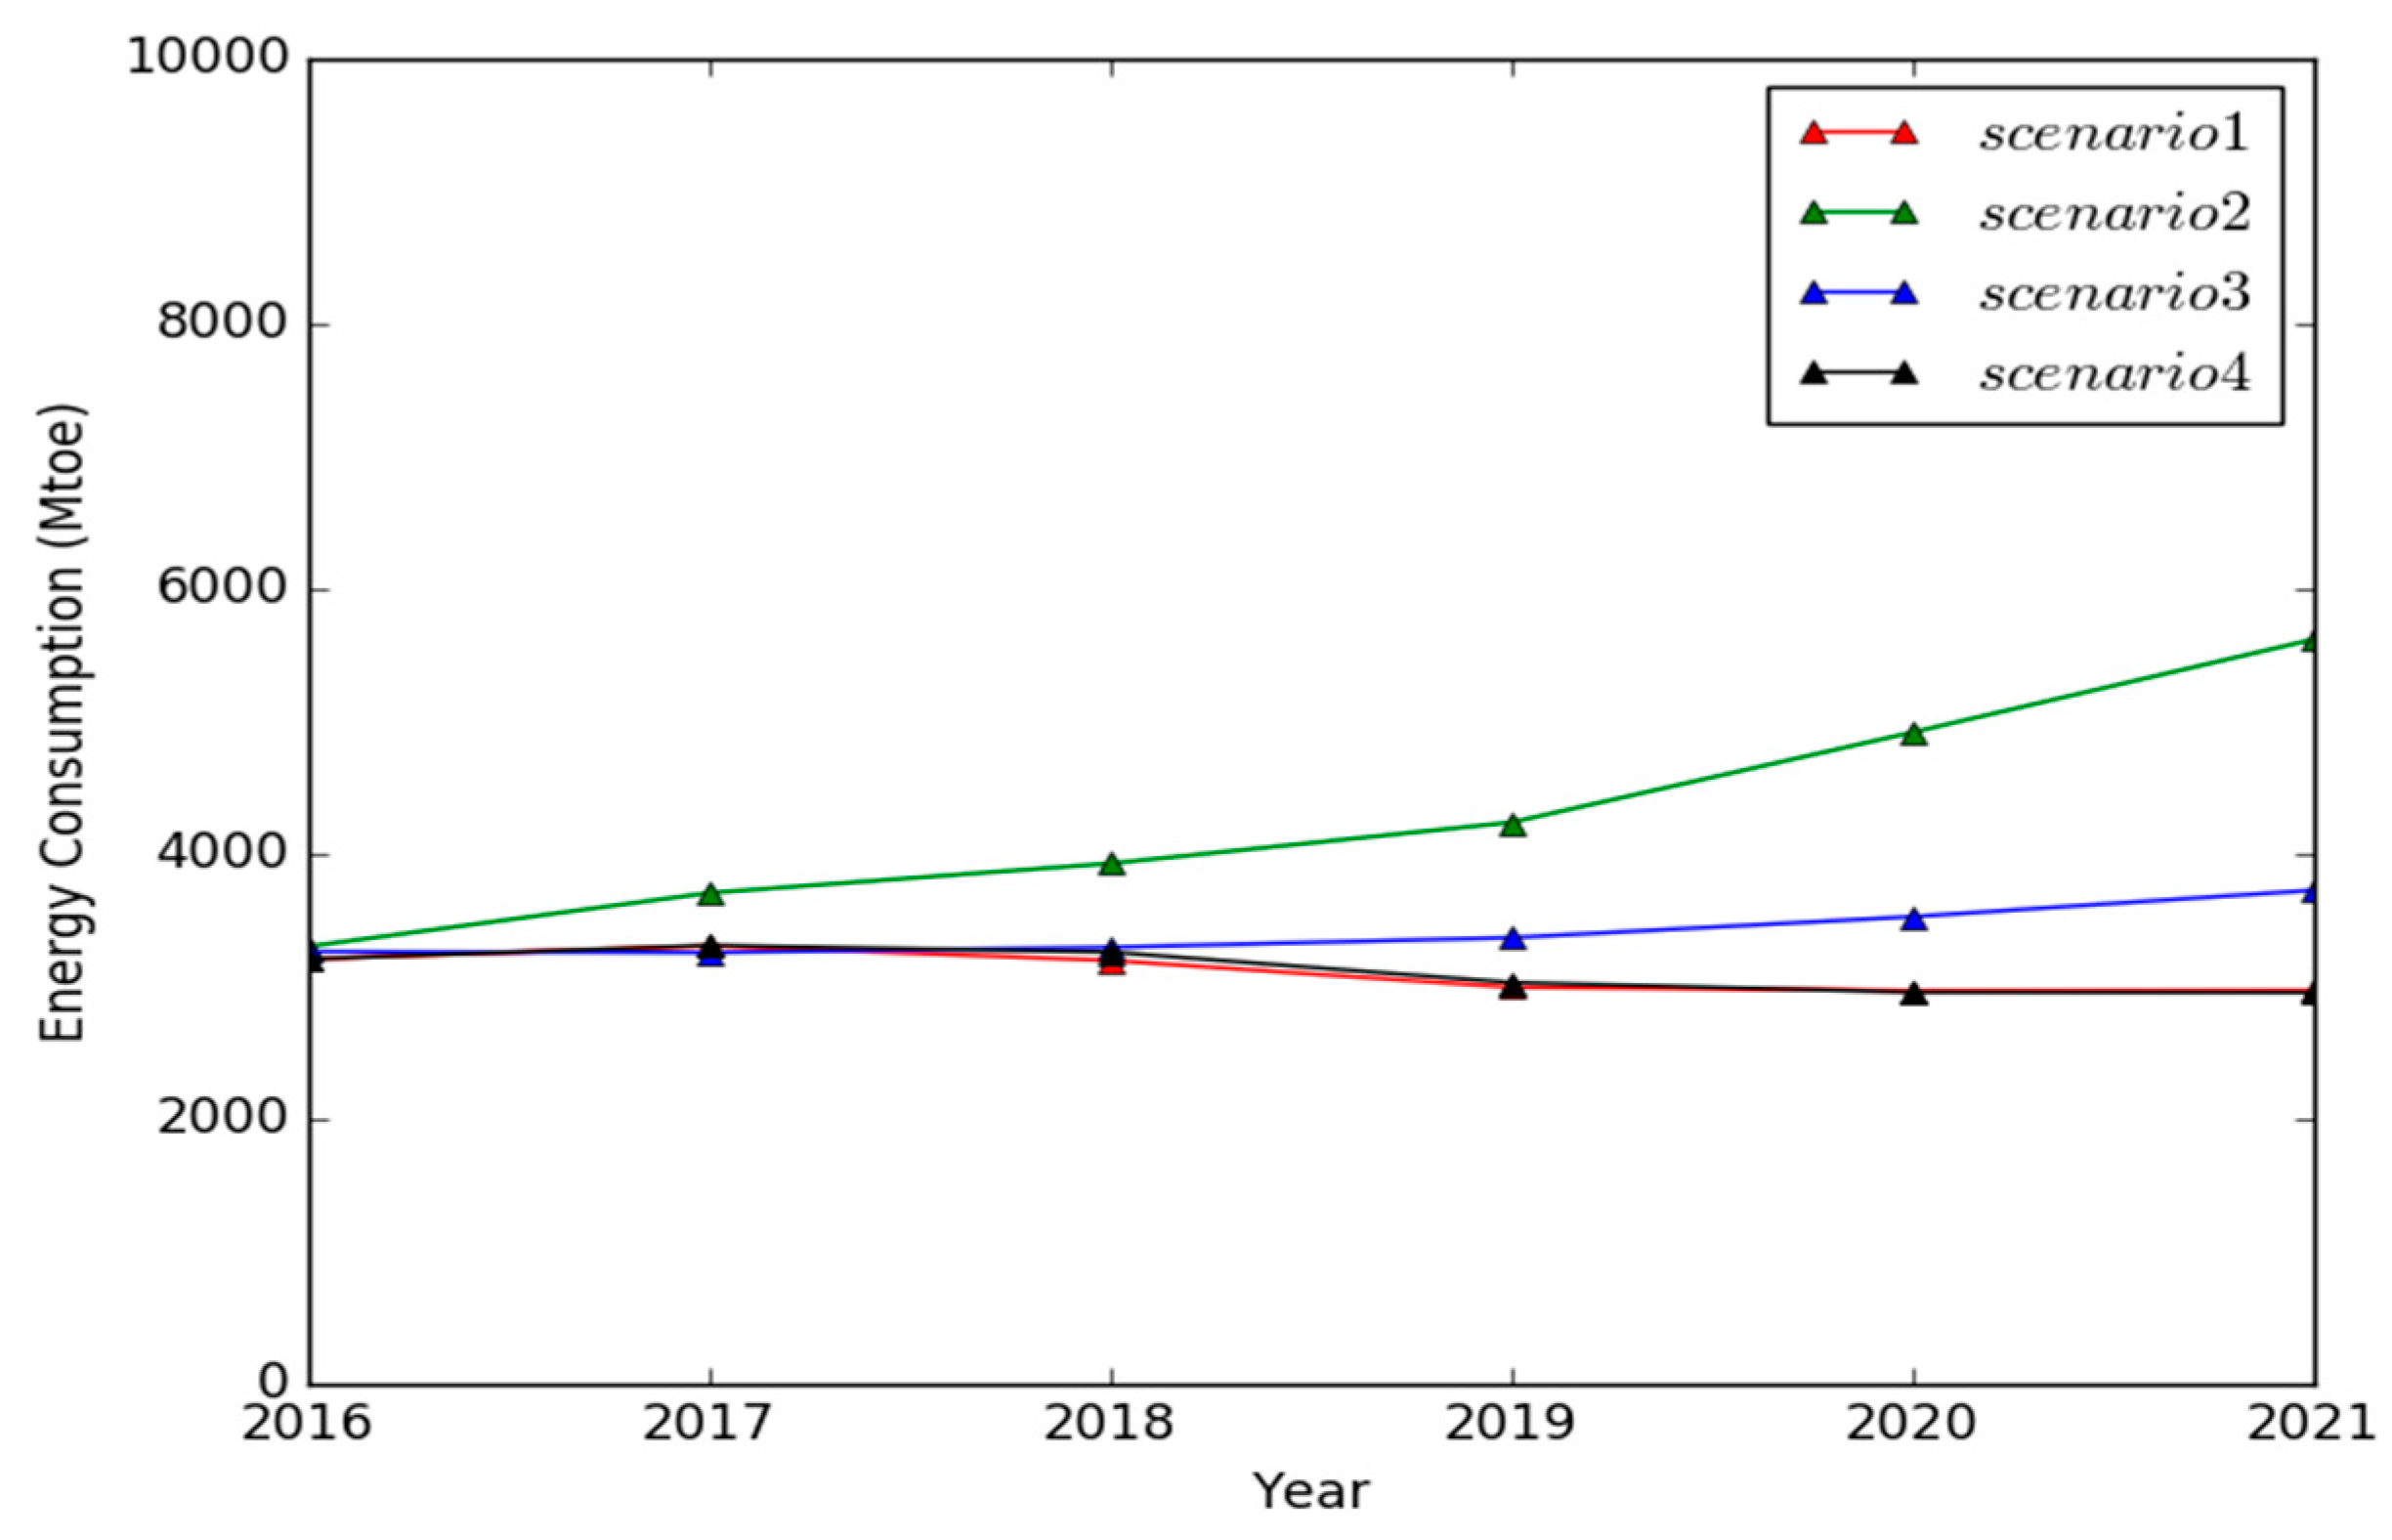
5. Chinese Primary Energy Consumption Forecasts Based on Different Scenarios
6. Conclusions
- Deep learning is the hotspot of current research, and in the GRU there are internal relations between the four economic variables (gross domestic product (GDP), population, import trade volume, export trade volume) and energy consumption. The four economic variables can be used to forecast the primary energy consumption in China;
- The GRU model is a model based on long and short memory for learning time series data. Compared with the MLR model and the SVR model, the GRU model is superior for the processing of time series data, and the average absolute percentage error of the predicted result can be as low as 5.63. However, when applying this model, the choice of the amount of training data is a key factor in accurate prediction. In particular, for the prediction of macroeconomic variables, recent data is more important to the final forecast result, due to uncertainties in socio-economic change; and
- The GRU model is used to forecast energy consumption in China from 2016 to 2021, with a finding that Chinese energy consumption in 2021 will fluctuate between 2954.04 Mtoe and 5618.67 Mtoe.
Acknowledgments
Author Contributions
Conflicts of Interest
References
- Azadeh, A.; Saberi, M.; Ghaderi, S.F.; Gitiforouz, A.; Ebrahimipour, V. Improved estimation of electricity demand function by integration of fuzzy system and data mining approach. Energy Convers. Manag. 2008, 49, 2165–2177. [Google Scholar] [CrossRef]
- Delmastro, C.; Lavagno, E.; Mutani, G. Chinese residential energy demand: Scenarios to 2030 and policies implication. Energy Build. 2015, 89, 49–60. [Google Scholar] [CrossRef]
- Murat, K.; Adem, A.; Talat, S. Modeling and forecasting of Turkey’s energy consumption using socio-economic and demographic variables. Appl. Energy 2011, 88, 1927–1939. [Google Scholar]
- Egelioglu, F.; Mohamad, A.A.; Guwen, H. Economic variables and electricity consumption in Northern Cyprus. Energy 2001, 26, 355–362. [Google Scholar] [CrossRef]
- O’Neill, B.C.; Desai, M. Accuracy of past projections of US energy consumption. Energy Policy 2005, 33, 979–993. [Google Scholar] [CrossRef]
- Hao, Y.; Zhang, Z.Y.; Liao, H.; Wei, Y.M. China’s farewell to coal: A forecast of coal consumption through 2020. Energy Policy 2015, 86, 444–455. [Google Scholar] [CrossRef]
- Iniyan, S.; Suganthi, L.; Samuel, A.A. Energy models for commercial energy prediction and substitution of renewable energy sources. Energy Policy 2006, 34, 2640–2653. [Google Scholar] [CrossRef]
- Bakhat, M.; RossellÓ, J. Estimation of tourism-induced electricity consumption: The case study of Balearics Islands, Spain. Energy Econ. 2011, 33, 437–444. [Google Scholar] [CrossRef]
- Ekonomou, L. Greek long-term energy consumption prediction using artificial neural network. Energy 2010, 35, 512–517. [Google Scholar] [CrossRef]
- Toksari, M.D. Estimating the net electricity energy generation and demand using the ant colony optimization approach: Case of Turkey. Energy Policy 2009, 37, 1181–1187. [Google Scholar] [CrossRef]
- AlRashidi, M.R.; EL-Naggar, K.M. Long term electric load forecasting based on particle swarm optimization. Appl. Energy 2010, 87, 320–326. [Google Scholar] [CrossRef]
- Pezeshki, M. Sequence Modeling using Gated Recurrent Neural Networks. arXiv 2015. Available online: https://arxiv.org/abs/1501.00299 (accessed on 1 January 2015).
- Tang, D.; Qin, B.; Liu, T. Document Modeling with Gated Recurrent Neural Network for Sentiment Classification. In Proceedings of the 2015 Conference on Empirical Methods in Natural Language Processing, Lisbon, Portugal, 17–21 September 2015; pp. 1422–1432. [Google Scholar]
- Ahmad, A.S.; Hassan, M.Y.; Abdulan, M.P.; Rahman, H.A.; Hussin, F.; Abdullah, H.; Saidur, R. A review on applications of ANN and SVM for building electrical energy consumption forecasting. Renew. Sustain. Energy Rev. 2014, 33, 102–109. [Google Scholar] [CrossRef]
- Sözen, A.; Akçayol, M.A.; Arcaklioğlu, E. Forecasting Net Energy Consumption Using Artificial Neural Network. Energy Sources Part B Econ. Plan. Policy 2006, 1, 147–155. [Google Scholar] [CrossRef]
- Deka, A.; Hamta, N.; Esmaeilian, B.; Behdad, S. Predictive Modeling Techniques to Forecast Energy Demand in the United States: A Focus on Economic and Demographic Factors. In Proceedings of the ASME 2015 International Design Engineering Technical Conferences & Computers and Information in Engineering Conference, Boston, MA, USA, 2–5 August 2015. [Google Scholar]
- Torrini, F.C.; Souza, R.C.; Oliveira, F.L.C.; Pessanha, J.F.M. Long term electricity consumption forecast in Brazil: A fuzzy logic approach. Socio-Econ. Plan. Sci. 2016, 54, 18–27. [Google Scholar] [CrossRef]
- Philip, K.A.; William, B. Conditional dynamic forecast of electrical energy consumption requirement in Ghana by 2020: A comparison of ARDL and PAM. Energy 2012, 44, 367–380. [Google Scholar]
- Gokhan, A. Modeling of energy consumption based on economic and demographic factors: The case of Turkey with projections. Renew. Sustain. Energy Rev. 2015, 35, 382–389. [Google Scholar]
- Pao, H.T.; Fu, H.C.; Tseng, C.L. Forecasting of CO2 emissions, energy consumption and economic growth in China using an improved grey model. Energy 2012, 40, 400–409. [Google Scholar] [CrossRef]
- Pani, R.; Mukhopadhyay, U. Identifying the major players behind increasing global carbon dioxide emissions: A decomposition analysis. Environmentalist 2010, 30, 183–205. [Google Scholar] [CrossRef]
- Chen, W.; Yin, X.; Ma, D. A bottom-up analysis of China’s iron and steel industrial energy consumption and CO2 emissions. Appl. Energy 2015, 136, 1174–1183. [Google Scholar] [CrossRef]
- Jain, R.K.; Smith, K.M.; Culligan, P.J.; Taylor, J.E. Forecasting energy consumption of multi-family residential buildings using support vector regression: Investigating the impact of temporal and spatial monitoring granularity on performance accuracy. Appl. Energy 2014, 123, 168–178. [Google Scholar] [CrossRef]
- Wang, Y.; Gu, A.; Zhang, A. Recent development of energy supply and demand in China, and energy sector prospects through 2030. Energy Policy 2011, 39, 6745–6759. [Google Scholar] [CrossRef]
- Liu, X.; Moreno, B.; García, A.S. A grey neural network and input-output combined forecasting model. Primary energy consumption forecasts in Spanish economic sectors. Energy 2016, 115, 1042–1054. [Google Scholar] [CrossRef]
- Xie, N.M.; Yuan, C.Q.; Yang, Y.J. Forecasting China’s energy demand and self-sufficiency rate by grey forecasting model and Markov model. Int. J. Electr. Power Energy Syst. 2015, 66, 1–8. [Google Scholar] [CrossRef]
- Prakasvudhisarn, C. Electricity consumption forecasting in Thailand using an artificial neural network and multiple linear regression. Energy Sources Part B Econ. Plan. Policy 2105, 10, 427–434. [Google Scholar]
- Abuella, M.; Chowdhury, B. Solar power probabilistic forecasting by using multiple linear regression analysis. In Proceedings of the SoutheastCon, Fort Lauderdale, FL, USA, 9–12 April 2015; pp. 1–5. [Google Scholar]
- Cleland, A.C.; Earle, M.D.; Boag, I.F. Application of multiple linear regression to analysis of data from factory energy surveys. Int. J. Food Sci. Technol. 2010, 16, 481–492. [Google Scholar] [CrossRef]
- Amral, N.; Ozveren, C.S.; King, D. Short term load forecasting using Multiple Linear Regression. In Proceedings of the 2007 42nd International Universities Power Engineering Conference, Brighton, UK, 4–6 September 2007; pp. 1192–1198. [Google Scholar]
- Tuaimah, F.M.; Abass, H.M.A. Short-term electrical load forecasting for iraqi power system based on multiple linear regression method. Int. J. Comput. Appl. 2014, 100, 41–45. [Google Scholar]
- Torkzadeh, R.; Mirzaei, A.; Mirjalili, M.M.; Anaraki, A.S.; Sehhati, M.R.; Behdad, F. Medium term load forecasting in distribution systems based on multi linear regression & principal component analysis: A novel approach. In Proceedings of the 19th Electrical Power Distribution Networks (EPDC), Tehran, Iran, 6–7 May 2014; pp. 66–70. [Google Scholar]
- Rahman, A.U. Assessment of seasonal and polluting effects on the quality of river indus water by using multiple linear regression analysis. Int. J. Curr. Res. 2014, 6, 5005–5008. [Google Scholar]
- Mata, J. Interpretation of concrete dam behaviour with artificial neural network and multiple linear regression models. Eng. Struct. 2011, 33, 903–910. [Google Scholar] [CrossRef]
- Abushikhah, N.; Elkarmi, F.; Aloquili, O.M. Medium-term electric load forecasting using multivariable linear and non-linear regression. Smart Grid Renew. Energy 2011, 2, 126–135. [Google Scholar] [CrossRef]
- Wu, X.; Kumar, V. The Top Ten Algorithms in Data Mining; Taylor & Francis Group: New York, NK, USA, 2009. [Google Scholar]
- Li, Q.; Meng, Q.; Cai, J.; Youshino, H. Applying support vector machine to predict hourly cooling load in the building. Appl. Energy 2009, 86, 2249–2256. [Google Scholar] [CrossRef]
- Hou, Z.; Lian, Z. An Application of Support Vector Machines in Cooling Load Prediction. In Proceedings of the International Workshop on Intelligent Systems and Applications, Wuhan, China, 23–24 May 2009; Volume 26, pp. 1–4. [Google Scholar]
- Wang, X.; Liu, X.; Matwin, S.; Japkowicz, N. Applying instance-weighted support vector machines to class imbalanced datasets. In Proceedings of the IEEE International Conference on Big Data, Washington, DC, USA, 27–30 October 2015; pp. 112–118. [Google Scholar]
- Zhang, B.; Qiao, H. Face recognition with support vector machine. In Proceedings of the IEEE International Conference on Robotics, Intelligent Systems and Signal Processing, Changsha, China, 8–13 October 2003; pp. 726–730. [Google Scholar]
- Le, T.T.H.; Kim, J.; Kim, H. Classification performance using gated recurrent unit recurrent neural network on energy disaggregation. In Proceedings of the International Conference on Machine Learning and Cybernetics, Jeju, South Korea, 10–13 July 2016; pp. 105–110. [Google Scholar]
- Chung, J.; Gulcehre, C.; Cho, K.H.; Bengio, Y. Empirical evaluation of gated recurrent neural networks on sequence modeling. arXiv 2014. Available online: https://arxiv.org/abs/1412.3555 (accessed on 11 December 2014).
- Jozefowicz, R.; Zaremba, W.; Sutskever, I. An empirical exploration of recurrent network architectures. In Proceedings of the 32nd International Conference on Machine Learning (ICML-15), Lille, France, 6–11 July 2015; pp. 2342–2350. [Google Scholar]
- Zhou, G.B.; Wu, J.; Zhang, C.L.; Zhou, Z.H. Minimal gated unit for recurrent neural networks. Int. J. Autom. Comput. 2016, 13, 226–234. [Google Scholar] [CrossRef]
- Tang, Y.; Huang, Y.; Wu, Z.; Meng, H.; Xu, M.; Cai, L. Question detection from acoustic features using recurrent neural network with gated recurrent unit. In Proceedings of the IEEE International Conference on Acoustics, Speech and Signal Processing, Shanghai, China, 20–25 March 2016; pp. 6125–6129. [Google Scholar]
- Rana, R. Gated recurrent unit (GRU) for emotion classification from noisy speech. arXiv 2016. Available online: https://arxiv.org/abs/1612.07778 (accessed on 13 December 2016).
- Huang, Q.; Wang, W.; Zhou, K.; You, S.; Neumann, U. Scene labeling using gated recurrent units with explicit long range conditioning. arXiv 2017. Available online: https://arxiv.org/abs/1611.07485 (accessed on 28 March 2017).
- Armstrong, J.S. Illusions in regression analysis. Soc. Sci. Electron. Publ. 2012, 28, 689–694. [Google Scholar] [CrossRef]
- Müller, K.R.; Smola, A.J.; Rätsch, G.; Schölkopf, B.; Kohlmorgen, J.; Vapnik, V. Predicting time series with support vector machines. Lect. Notes Comput. Sci. 1997, 20, 999–1004. [Google Scholar]
- Zong, W.G.; Roper, W.E. Energy demand estimation of South Korea using artificial neural network. Energy Policy 2009, 37, 4049–4054. [Google Scholar]
- World Development Indicators. Available online: http://data.worldbank.org/data-catalog/world-development-indicators (accessed on 6 September 2017).
- Statistical Review of World Energy. Available online: http://www.bp.com/en/global/corporate/energy-economics/statistical-review-of-world-energy.html (accessed on 6 September 2017).
- Available online: http://www.imf.org (accessed on 6 September 2017).
- Available online: https://esa.un.org/unpd/wpp/publications/ (accessed on 6 September 2017).


| Year | GDP (1010 Current US$) | Population (Million) | Import (109 Current US$) | Export (109 Current US$) | Primary Energy Demand (Mtoe) |
|---|---|---|---|---|---|
| 1965 | 6.97 | 715.19 | 2.25 | 2.56 | 131.40 |
| 1966 | 7.59 | 735.40 | 2.48 | 2.68 | 142.81 |
| 1967 | 7.21 | 754.55 | 2.17 | 2.39 | 128.44 |
| 1968 | 7.00 | 774.51 | 2.07 | 2.34 | 129.67 |
| 1969 | 7.87 | 796.03 | 1.92 | 2.43 | 157.87 |
| 1965 | 9.15 | 818.32 | 2.28 | 2.31 | 202.22 |
| 1971 | 9.86 | 841.11 | 2.13 | 2.78 | 239.79 |
| 1972 | 11.22 | 862.03 | 2.85 | 3.69 | 258.45 |
| 1973 | 13.68 | 881.94 | 5.21 | 5.88 | 272.69 |
| 1974 | 14.23 | 900.35 | 7.79 | 7.11 | 281.12 |
| 1975 | 16.12 | 916.40 | 7.93 | 7.69 | 314.91 |
| 1976 | 15.16 | 930.69 | 6.66 | 6.94 | 331.57 |
| 1977 | 17.23 | 943.46 | 7.15 | 7.52 | 361.68 |
| 1978 | 14.84 | 956.17 | 7.62 | 6.81 | 396.62 |
| 1979 | 17.69 | 969.01 | 10.56 | 9.20 | 408.16 |
| 1980 | 18.96 | 981.24 | 12.45 | 11.30 | 417.40 |
| 1981 | 19.44 | 993.89 | 14.59 | 14.59 | 411.58 |
| 1982 | 20.35 | 1008.63 | 13.65 | 15.79 | 429.53 |
| 1983 | 22.90 | 1023.31 | 16.16 | 16.79 | 456.86 |
| 1984 | 25.81 | 1036.83 | 22.16 | 20.73 | 490.18 |
| 1985 | 30.75 | 1051.04 | 42.78 | 27.51 | 529.92 |
| 1986 | 29.88 | 1066.79 | 43.43 | 31.37 | 555.31 |
| 1987 | 27.13 | 1084.04 | 36.19 | 32.96 | 598.77 |
| 1988 | 31.07 | 1101.63 | 42.29 | 36.35 | 643.12 |
| 1989 | 34.60 | 1118.65 | 44.53 | 39.60 | 674.60 |
| 1990 | 35.90 | 1135.19 | 49.22 | 57.09 | 681.41 |
| 1991 | 38.15 | 1150.78 | 59.21 | 66.67 | 716.17 |
| 1992 | 42.49 | 1164.97 | 69.75 | 73.41 | 753.24 |
| 1993 | 44.29 | 1178.44 | 74.63 | 65.88 | 810.25 |
| 1994 | 56.23 | 1191.84 | 115.56 | 120.92 | 858.79 |
| 1995 | 73.20 | 1204.86 | 132.30 | 149.11 | 884.98 |
| 1996 | 86.08 | 1217.55 | 139.01 | 151.26 | 932.17 |
| 1997 | 95.82 | 1230.08 | 142.42 | 182.88 | 936.95 |
| 1998 | 102.53 | 1241.94 | 140.43 | 183.88 | 938.18 |
| 1999 | 108.94 | 1252.74 | 165.93 | 195.21 | 969.67 |
| 2000 | 120.53 | 1262.65 | 225.15 | 249.26 | 1003.11 |
| 2001 | 133.22 | 1271.85 | 243.55 | 266.09 | 1059.63 |
| 2002 | 146.19 | 1280.40 | 295.16 | 325.58 | 1156.00 |
| 2003 | 164.99 | 1288.40 | 413.14 | 438.42 | 1347.98 |
| 2004 | 194.17 | 1296.08 | 561.04 | 593.26 | 1576.92 |
| 2005 | 226.86 | 1303.72 | 662.33 | 764.53 | 1793.70 |
| 2006 | 272.98 | 1311.02 | 794.86 | 973.21 | 1967.98 |
| 2007 | 352.31 | 1317.89 | 963.48 | 1230.72 | 2140.07 |
| 2008 | 455.84 | 1324.66 | 1144.48 | 1444.80 | 2222.28 |
| 2009 | 505.94 | 1331.26 | 1004.46 | 1200.77 | 2322.12 |
| 2010 | 603.97 | 1337.71 | 1380.08 | 1602.48 | 2487.36 |
| 2011 | 749.24 | 1344.13 | 1825.40 | 2006.30 | 2687.90 |
| 2012 | 846.16 | 1350.70 | 1943.22 | 2175.08 | 2795.26 |
| 2013 | 949.06 | 1357.38 | 2119.38 | 2354.25 | 2903.95 |
| 2014 | 1035.11 | 1364.27 | 2191.44 | 2475.70 | 2970.31 |
| 2015 | 1086.64 | 1371.22 | 2045.76 | 2431.26 | 3013.96 |
| Model | MAPE | RMSE | ||
|---|---|---|---|---|
| Train | Test | Train | Test | |
| MLR | 5.55 | 12.8 | 26.39 | 392.84 |
| SVR | 5.91 | 9.17 | 27.95 | 284.08 |
| GRU | 2.11 | 5.63 | 5.45 | 12.4 |
| Scenarios | GDP | Population | Import | Export |
|---|---|---|---|---|
| Scenario 1 | IMF’s forecast for Chinese GDP | The average population growth rate of China from the World Population Outlook (2015) (0.25%) | Initial growth rate (−6.65%) | Initial growth rate (−1.8%) |
| Scenario 2 | IMF’s forecast for Chinese GDP | The average population growth rate of China from the World Population Outlook (2015) (0.25%) | Average growth rate (16.49%) | Average growth rate (16.05%) |
| Scenario 3 | IMF’s forecast for Chinese GDP | The average population growth rate of China from the World Population Outlook (2015) (0.25%) | Minimum growth rate (1.52%) | Minimum growth rate (0.55%) |
| Scenario 4 | Chinese initial GDP growth rate (4.98%) | Initial population growth rate in China (0.5%) | Initial growth rate (−6.65%) | Initial growth rate (−1.8%) |
| Year | GDP (1010 Current US$) IMF Forecast Data | GDP (1010 Current US$) Initial Growth Rate 4.98% | Population (Million) Average Growth Rate 0.25% | Population (Million) Initial Growth Rate 0.5% |
|---|---|---|---|---|
| 2016 | 1158.36 | 1140.75 | 1374.65 | 1378.08 |
| 2017 | 1230.18 | 1197.56 | 1378.08 | 1384.97 |
| 2018 | 1303.99 | 1257.20 | 1381.53 | 1391.89 |
| 2019 | 1382.23 | 1319.81 | 1384.98 | 1398.85 |
| 2020 | 1463.78 | 1385.54 | 1388.45 | 1405.85 |
| 2021 | 1548.68 | 1454.54 | 1391.92 | 1412.87 |
| Year | Import Trade Volume (109 Current US$) | Export Trade Volume (109 Current US$) | ||||
|---|---|---|---|---|---|---|
| Initial Growth Rate −6.55% | Average Growth Rate 16.49% | Minimum Growth Rate 1.52% | Initial Growth Rate −1.8% | Average Growth Rate 16.05% | Minimum Growth Rate 0.55% | |
| 2016 | 1911.76 | 2383.11 | 2076.86 | 2387.50 | 2821.48 | 2444.63 |
| 2017 | 1786.54 | 2776.08 | 2108.42 | 2344.52 | 3274.32 | 2458.08 |
| 2018 | 1669.52 | 3233.86 | 2140.47 | 2302.32 | 3799.85 | 2471.60 |
| 2019 | 1560.17 | 3767.12 | 2173.01 | 2260.88 | 4409.73 | 2485.19 |
| 2020 | 1457.98 | 4388.32 | 2206.04 | 2220.18 | 5117.49 | 2498.86 |
| 2021 | 1362.48 | 5111.95 | 2239.57 | 2180.22 | 5938.85 | 2512.60 |
© 2017 by the authors. Licensee MDPI, Basel, Switzerland. This article is an open access article distributed under the terms and conditions of the Creative Commons Attribution (CC BY) license (http://creativecommons.org/licenses/by/4.0/).
Share and Cite
Liu, B.; Fu, C.; Bielefield, A.; Liu, Y.Q. Forecasting of Chinese Primary Energy Consumption in 2021 with GRU Artificial Neural Network. Energies 2017, 10, 1453. https://doi.org/10.3390/en10101453
Liu B, Fu C, Bielefield A, Liu YQ. Forecasting of Chinese Primary Energy Consumption in 2021 with GRU Artificial Neural Network. Energies. 2017; 10(10):1453. https://doi.org/10.3390/en10101453
Chicago/Turabian StyleLiu, Bingchun, Chuanchuan Fu, Arlene Bielefield, and Yan Quan Liu. 2017. "Forecasting of Chinese Primary Energy Consumption in 2021 with GRU Artificial Neural Network" Energies 10, no. 10: 1453. https://doi.org/10.3390/en10101453
APA StyleLiu, B., Fu, C., Bielefield, A., & Liu, Y. Q. (2017). Forecasting of Chinese Primary Energy Consumption in 2021 with GRU Artificial Neural Network. Energies, 10(10), 1453. https://doi.org/10.3390/en10101453