Optimal Cold-Start Control of a Gasoline Engine

Institute for Dynamic Systems and Control, ETH Zurich, Sonneggstrasse 3, 8092 Zurich, Switzerland
*
Author to whom correspondence should be addressed.
Energies 2017, 10(10), 1548; https://doi.org/10.3390/en10101548
Submission received: 12 September 2017
/
Revised: 28 September 2017
/
Accepted: 1 October 2017
/
Published: 9 October 2017
Abstract
:This article analyzes the influence of the ignition retardation on the fuel consumption, the cumulative tailpipe hydrocarbon emissions, and the temperature inside the three-way catalytic converter in a gasoline direct injection engine operated under idling conditions. A dedicated cylinder-individual, model-based, multivariable controller was used in experiments in order to isolate the effect of the ignition retardation on the hydrocarbon emissions as much as possible. An optimal control problem for a gasoline engine at a cold-start is formulated, which is used to interpret the experimental data obtained. The corresponding goal is to minimize the fuel consumption during an initial idling phase of a fixed duration while guaranteeing that the three-way catalytic converter reaches a sufficiently high final temperature and at the same time making sure that the cumulative hydrocarbon emissions stay below a given limit. The experimental data indicates that the engine should be operated with maximum ignition retardation in order to reach any temperature inside the three-way catalytic converter as quickly as possible concurrently with minimum tailpipe emissions and with the minimum possible fuel consumption.
1. Introduction
Gasoline engines can be used with a three-way catalytic converter (TWC) as the sole exhaust gas aftertreatment system when operated at a stoichiometric air-to-fuel ratio. TWCs have proven to successfully cope with the ever more stringent emission limits, being able to convert more than 95% of the relevant raw engine-out emissions under nominal operating conditions [1]. However, as long as the temperature of the TWC is below the “light-off temperature” of around 250 C, its conversion rate is significantly reduced. As a consequence, a large portion of the raw engine-out emissions are emitted into the atmosphere untreated.
These unfavorable conditions occur during the first 40 to 100 s after the cold-start of an engine, that is, during the phase in which the temperature of the TWC is below light-off. Studies show that among all relevant emissions, namely carbon monoxide, nitric oxides and hydrocarbons, the total hydrocarbon emissions during a complete test procedure are affected most by this first phase of an engine start. Specifically, the hydrocarbon emissions during this first phase make up 60–80% of the total hydrocarbon emissions on a regulatory test procedure [2,3,4]. These findings motivate the investigation of the cold-start hydrocarbon emissions of a gasoline engine.
Most emission test procedures include an engine idling phase of a fixed duration before the drive cycle is started, which can be used by car manufacturers to heat up the TWC. The complete initial idling phase can be divided into two phases with distinctly different engineering goals. The first phase, the crank and run-up phase, has to ensure a reliable start of the engine from stand-still to a stable operation at idle speed. The complete first phase takes a couple of seconds to finish. The subsequent second phase is the catalyst heating phase. The duration for the TWC to reach a temperature that results in a significant conversion rate is in the order of several tens of seconds.
Strategies for the catalyst heating phase can be categorized as follows:
- Strategies without any additional hardware components that generate hot exhaust gas using dedicated combustion control techniques.
In terms of costs, strategies without any additional components are clearly the preferred choice. Generally, these strategies rely on the retardation of the ignition angle from its optimal setting to after top dead center, which leads to a late combustion process that can even extend into the exhaust manifold. This results in a high exhaust gas enthalpy and therefore heats up the TWC quickly.
A highly retarded ignition is particularly suited for use in gasoline direct injection (GDI) engines. Injecting a small amount of fuel shortly before the ignition generates a rich and ignitable mixture around the spark plug, which enables a stable combustion process even at very late ignition angles. This is the state-of-the-art injection strategy during the catalyst heating phase that is often referred to as homogeneous split mode [10,11,12,13].
There is a consensus in literature that a high ignition retardation in combination with a homogeneous split mode injection strategy can be used to lower the hydrocarbon emissions during the catalyst heating phase [14,15,16,17]. An open question at this point, however, is how exactly the ignition angle should be controlled during the initial idling phase. Depending on the preferences of the car manufacturer or the specific boundary conditions of the test procedure, such as the duration of the idling phase, either more or less ignition retardation could be the optimal control strategy. A larger ignition retardation leads to a lower engine efficiency and, as a result, to a higher fuel consumption on the one hand, but to a faster catalyst heat-up process on the other hand.
The contribution of this article is an investigation based on experimental data of the trade-off between fuel consumption, TWC temperature increase, and cumulative hydrocarbon emissions for various degrees of ignition retardation during the initial engine idling phase of a gasoline engine cold-start. Other emission species such as carbon monoxide and nitric oxides are not discussed within the scope of this article. An optimal control problem formulation for the catalyst heating phase is discussed. This discussion is relevant insofar, as otherwise the interpretation of the experimental data is not intuitively possible. The practical implementation of the engine cold-start is described and illustrated, including the design of a model-based, multivariable controller designed specifically for these experiments. The practical implementation presented allows for an analysis of the effect of varying degrees of ignition retardation during the idling phase, independently of any distortions introduced by a varying engine speed or by cylinder imbalances in the air-to-fuel ratio.
The content of this article is structured as follows: In Section 2.1, the formulation of the optimal control problem during the idling phase at a cold-start of a gasoline engine is given. Section 2.2 describes how the engine is controlled during the idling phase. In Section 3, the setup used to acquire the experimental data presented and the corresponding post-processing steps are described. In Section 4, the effects of varying degrees of ignition retardation on the fuel consumption, the tailpipe hydrocarbon emissions and the evolution of the TWC temperature are presented and discussed. In Section 5, the contributions and conclusions are summarized and an outlook on possible future work is given.
2. Optimum Engine Control
2.1. Optimal Control Problem at Cold-Start
The initial idling phase at a cold-start lasts 20 s on the FTP-75, while on the NEDC it is 11 s. On the WLTP, which will replace the NEDC in the near future, the initial idling phase is expected to stay at 11 s, while on a future RDE test procedure it can be arbitrarily short. Optimally, at the end of the relatively brief idling phase, the TWC is sufficiently hot such that it is able to convert most of the unavoidable engine-out emissions during the drive cycle that follows. Therefore, the goal during the idling phase is often understood as simply heating up the TWC as fast as possible. However, the goal of a car manufacturer is to keep the emissions below a certain defined limit while using as little fuel as possible throughout the complete test cycle. Therefore, the problem of optimally designing the initial idling phase should be solved considering the complete test procedure, that is, including the idling phase together with the following drive cycle. This problem, however, is difficult to analyze, especially from an experimental point of view, due to many factors that can significantly affect the total cumulative emissions during the drive cycle period. Therefore, in the current study, an engineering-approach simplification is applied that allows us to reduce the optimal control problem of the complete test procedure to the idling phase only. The definition of the control problem can then be used to interpret the experimental data obtained.
The simplified optimal control problem during the fixed duration idling phase at a cold-start of a gasoline engine is defined as follows:
The time interval from to constitutes only the initial idling phase of the test procedure, while the actual drive cycle starts at time .
The goal up until time T is to heat up the catalyst to a predefined temperature level that results in a sufficient conversion efficiency of the TWC during the subsequent drive cycle. A sufficently high temperature will lead to low tailpipe emissions during the subsequent drive cycle phase of the test, . The relationship can be identified experimentally. It is a monotonically decreasing function; that is, the hotter the catalyst is at the beginning of the drive cycle, the lower the resulting hydrocarbon emissions are during the subsequent drive cycle.
The cumulative emissions during the idling phase must not exceed the value . Therefore, subtracting from the total allowed tailpipe emissions of the complete test procedure, , yields the maximum allowed cumulative tailpipe emissions during the idling phase, :
Finally, the objective of the control problem is to minimize the total amount of fuel used during the idling phase, as any fuel spent unnecessarily increases the resulting rating of the vehicle.
The structure of the problem described in Equation (1) inherently couples the total fuel consumption, the final temperature, the cumulative hydrocarbon emissions, and T, the duration of the initial idling phase. All the variables depend on the test procedure, and all but the duration T are also directly influenced by the specific emission limits that must not be exceeded. More interesting than finding one particular optimal solution is therefore understanding exactly how those variables change over time as well as with respect to each other when one specific control strategy is applied during the initial idling phase. Various control strategies can then be selectively evaluated by comparing the evolution of the resulting quantities, such as the TWC temperature or the cumulative emissions, with respect to each other.
The insight gained from Equation (1) is used in Section 4.2, where experimental data is illustrated in a way that allows for a graphical evaluation of an optimal ignition retardation strategy for any given boundary conditions.
2.2. Engine Control
The ignition angle is not the only variable that has an influence on both the thermal behavior of the TWC and the hydrocarbon emissions during the idling phase. A different set point for the air-to-fuel ratio or the engine speed can significantly change the overall system behavior. Furthermore, maldistributions in the air-to-fuel ratio among the cylinders can strongly distort the sensitivity analysis of the ignition retardation. In order to isolate the effect of the ignition retardation as much as possible, a multivariable (MIMO) feedback control scheme is implemented, which enables a cylinder-individual engine control. The control scheme, the choice of the corresponding control set points, and the resulting final implementation of the complete idling phase are discussed in the following paragraphs.
2.2.1. Model-Based Controller Design
In order to apply model-based control theory, a physically motivated mathematical model of the engine is developed. The relative gain array (RGA) of the system modeled is used to analyze the cross-couplings between its individual inputs and outputs. The results reveal that a multivariable control structure is appropriate for the idle speed control problem given.
Engine Modeling and Model Validation
The engine behavior is modeled using a mean-value approach. The average behavior of the three cylinders is described using one single cylinder model. Details of the modeling process of internal combustion engines can be found in [18,19] and are not discussed further here.
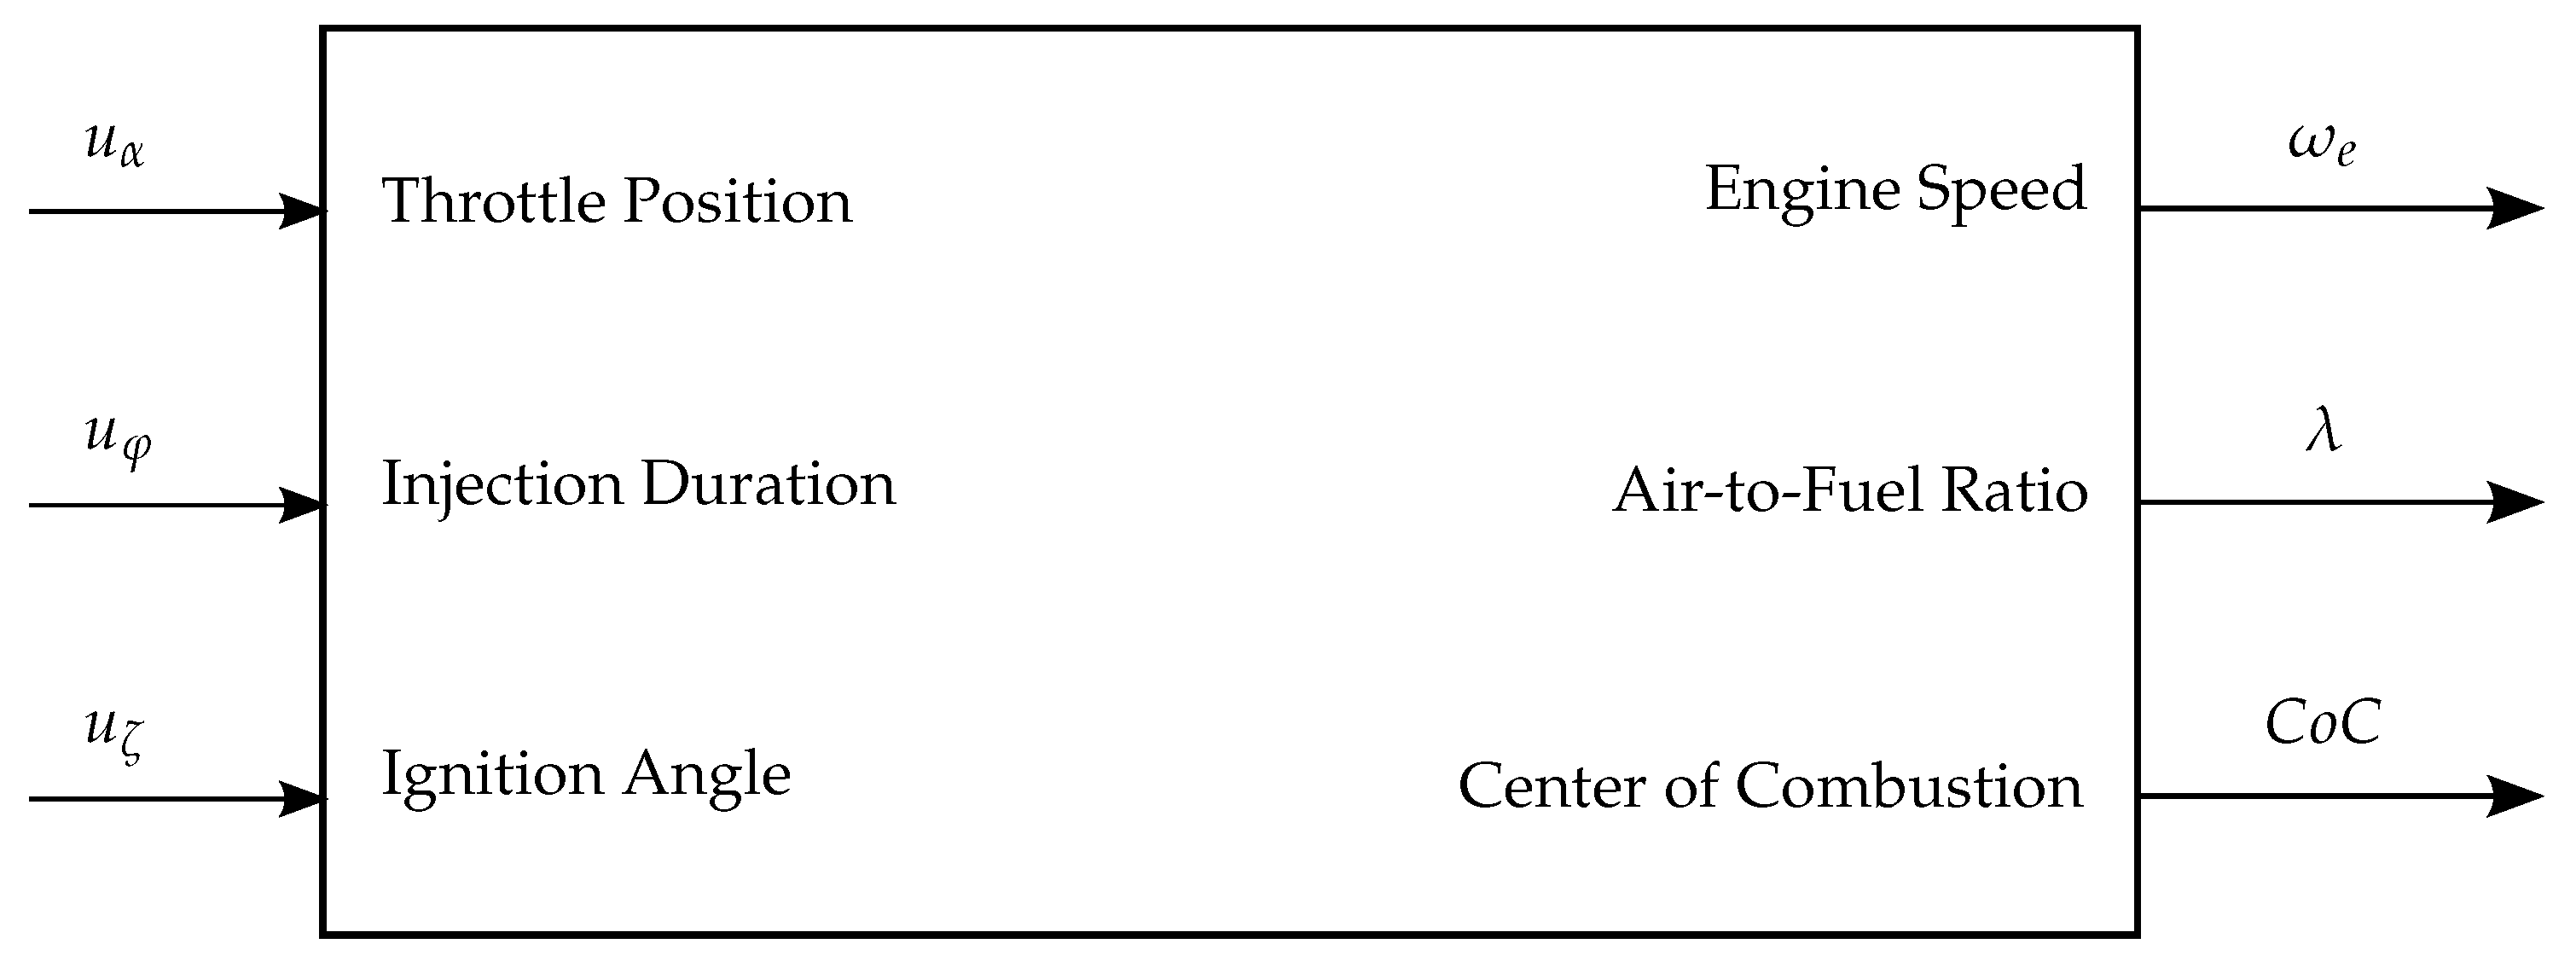
An overview of the inputs and outputs of the complete mean-value model is shown in Figure 1.
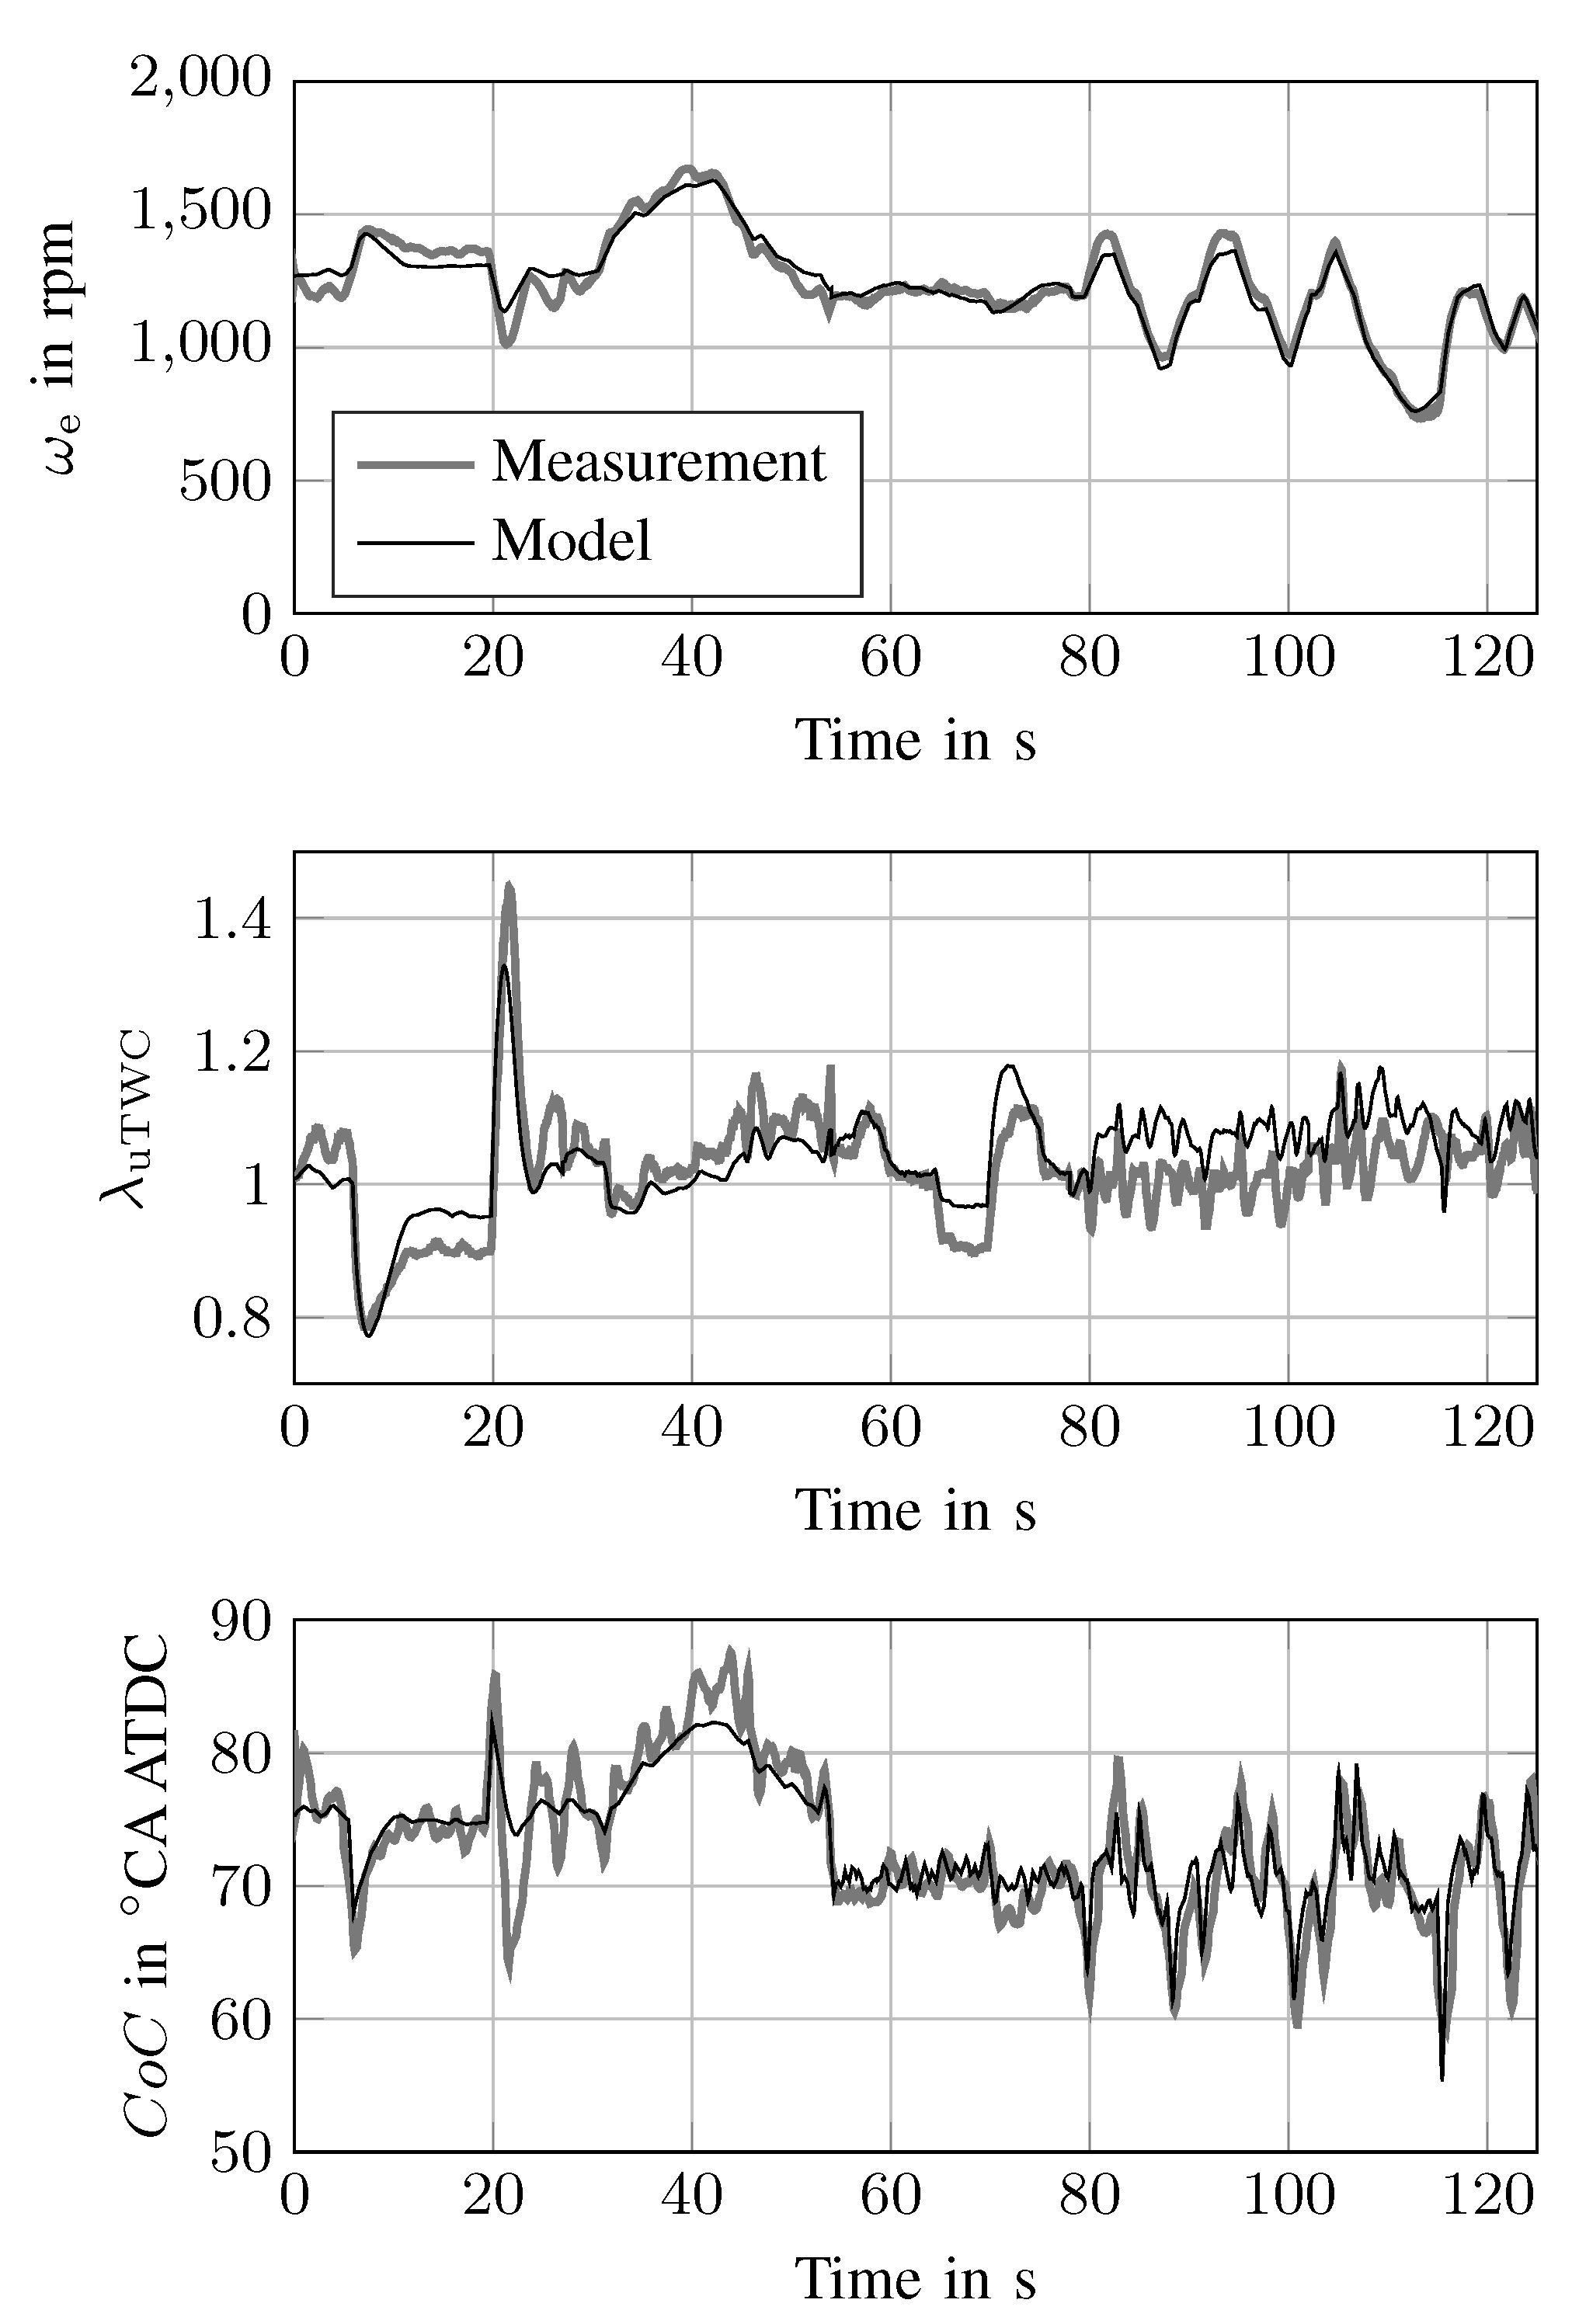
In Figure 2, the validation of the engine model is illustrated. The data used for validation was not used in the identification process. The model is shown to predict all of the relevant trends in the outputs when any of the inputs are changed.
Relative Gain Array
The RGA matrix of the system is used to determine whether a MIMO controller design is suitable. It is a useful measure of the interactions between the inputs and outputs of the system. It was first introduced in [20] and is comprehensibly discussed in many textbooks, such as in [21]. Briefly stated, a significant deviation of any of the entries in the RGA matrix from the value 1 or 0 indicates that the corresponding output variable is influenced by multiple inputs. In such a case, a MIMO control approach is often more promising than multiple independent control channels.
The RGA at the crossover frequency of the system depicted in Figure 1 at an operating point of , and (degree crank angle after top dead center) is shown in Table 1. The numerical entries illustrate that the engine speed as well as the air-to-fuel ratio are significantly influenced by both the throttle position and injection duration, suggesting that it may prove difficult to control these two system outputs independently using two individual single-input single-output controllers. As a consequence, a MIMO controller was designed as described in the following paragraphs.
Controller Design
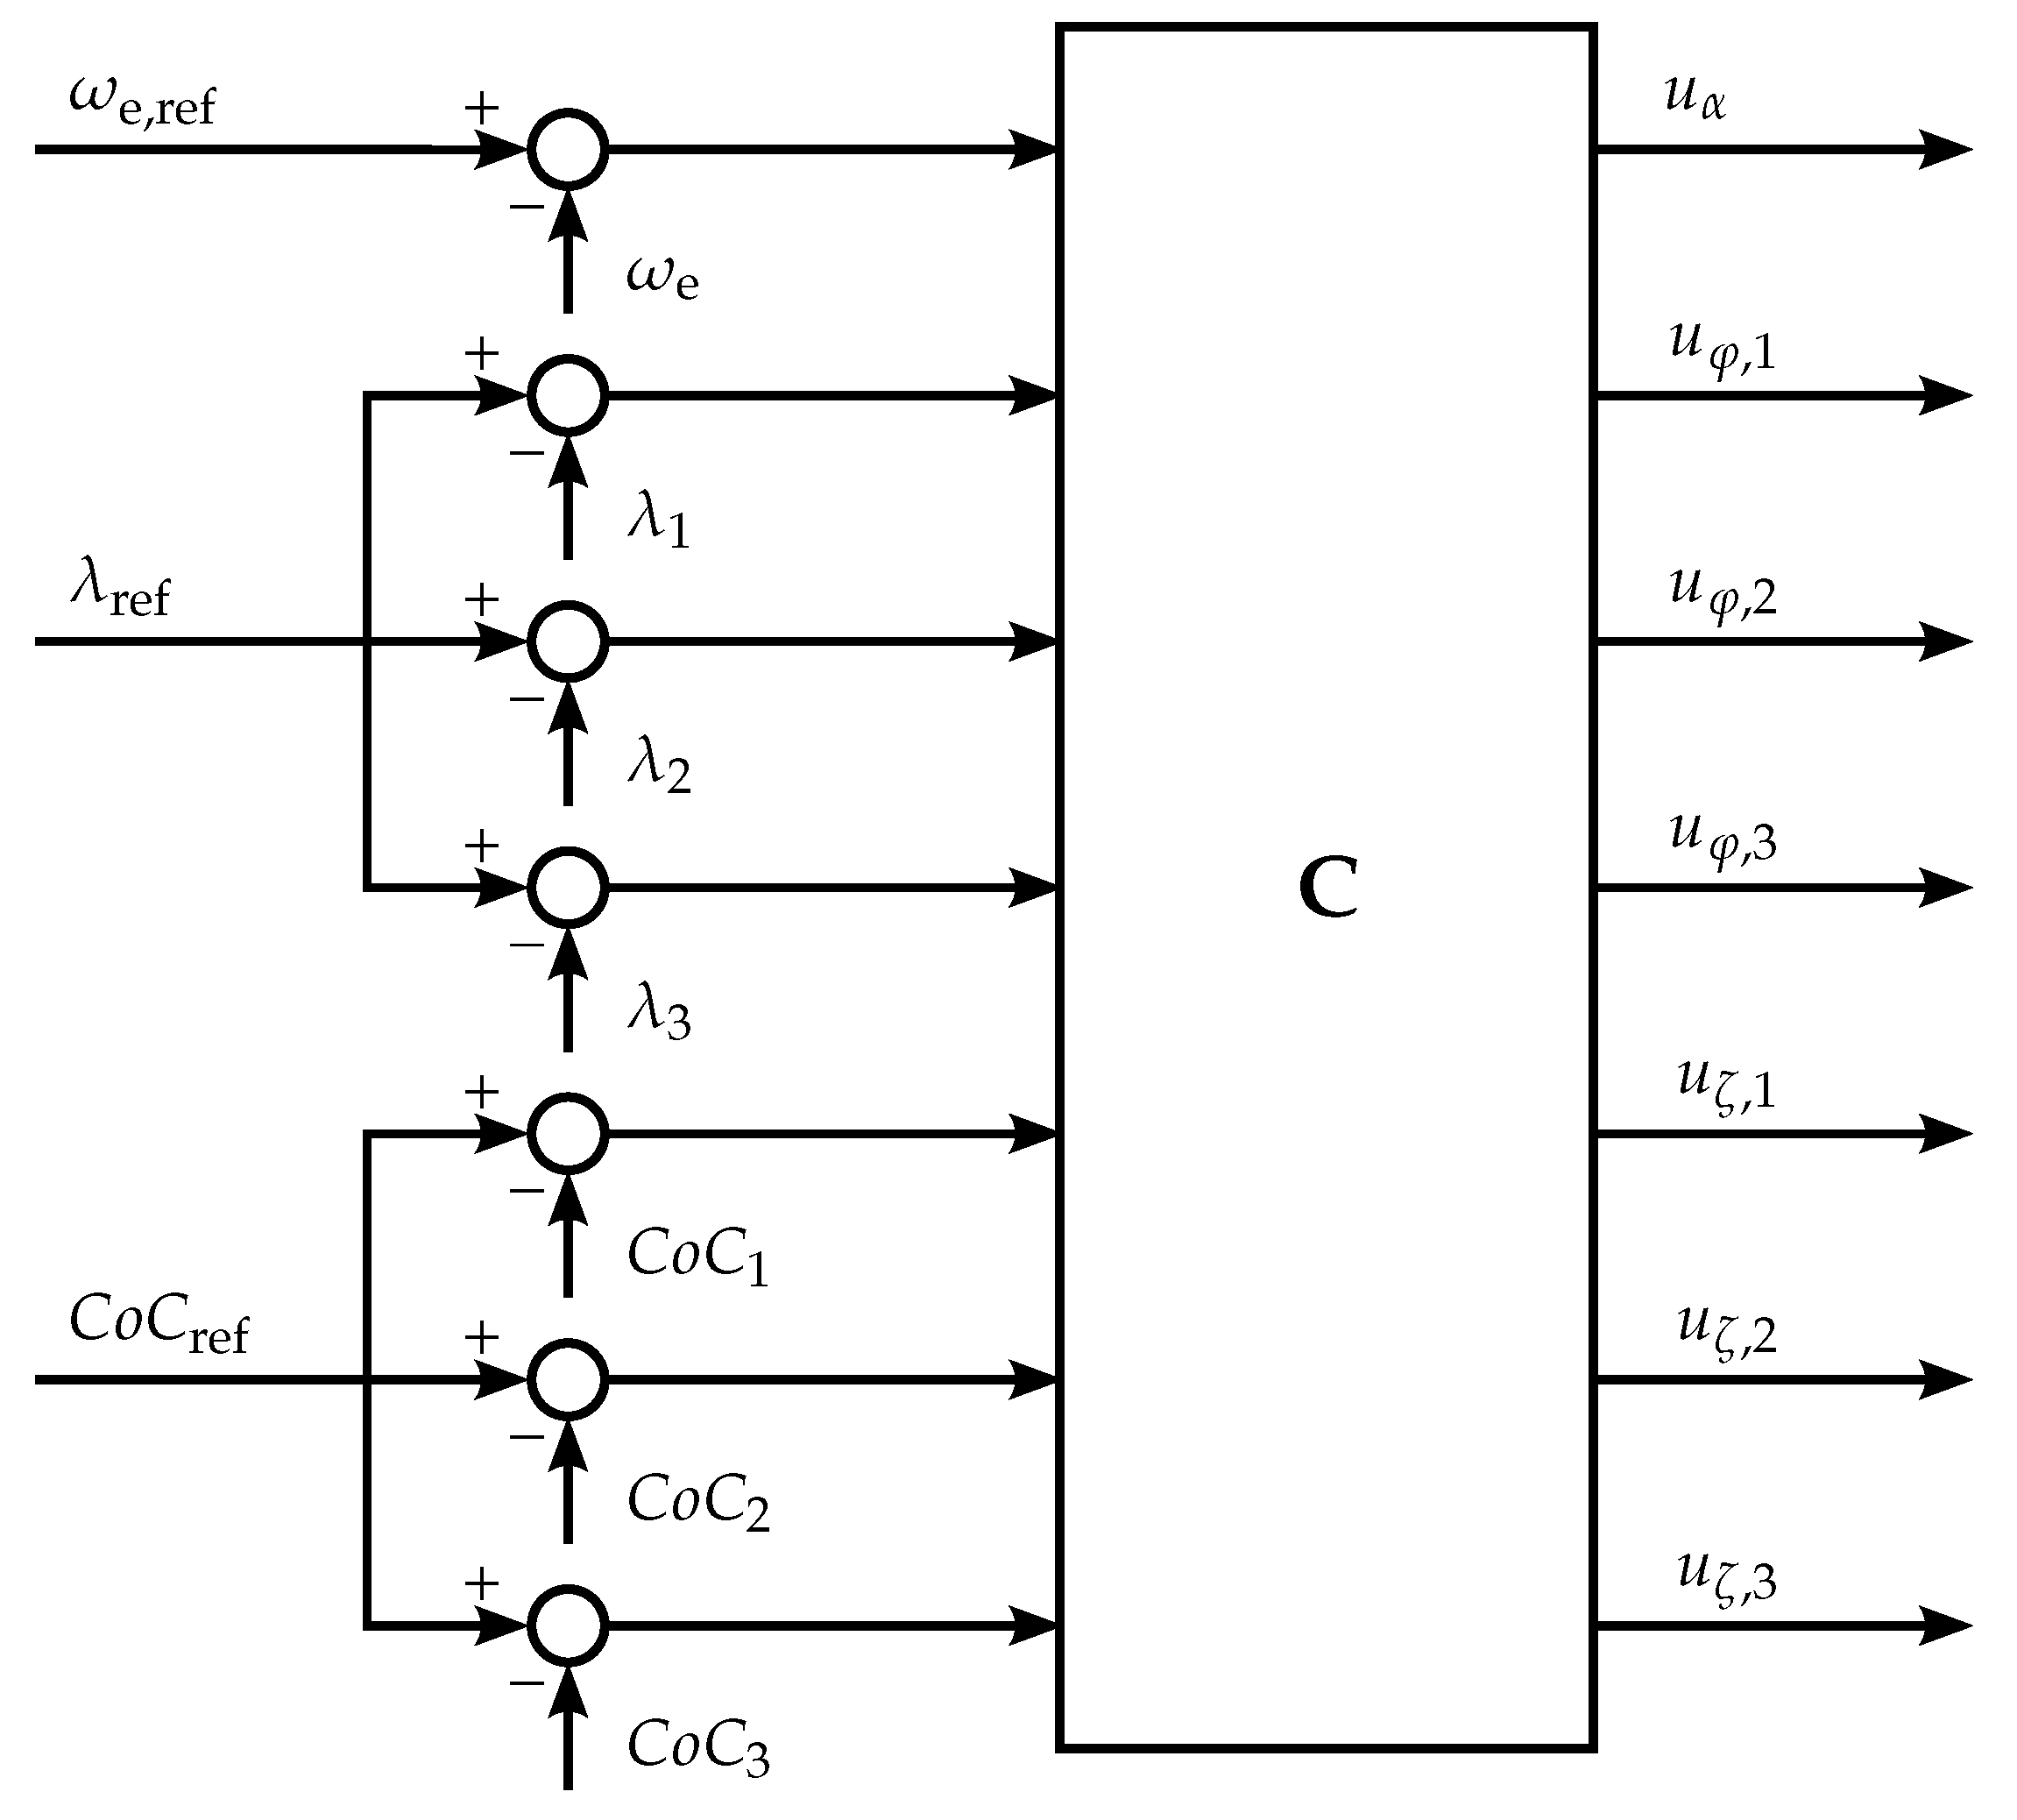
The basic structure of the MIMO feedback controller used in the experimental part of the work is shown in Figure 3.
The main control variable is , the rotational speed of the engine. The air-to-fuel ratios of the cylinders are controlled individually using dedicated sensors. The individual in-cylinder pressure sensors are used to calculate the center of combustion, which is an indicator of the ignition retardation.
Experiments show that when the engine is operated at a large ignition retardation, which corresponds to a certain engine air mass flow, if all the cylinders are set to the same center of combustion, a more stable engine operation results than when all the cylinders are set to the same ignition angle. Therefore, the cylinder-individual center of the combustion feedback control loop was found to increase the engine operating range towards larger ignition retardation values. Although the controller structure allows the center of combustion in each cylinder to be controlled individually, within the scope of this study, the cylinders were always set at the same reference value. Experiments with varying degrees of ignition retardation were conducted by varying the center of combustion set point . Figure 4 illustrates the correlation between the ignition angle and the center of combustion in the individual cylinders and clearly shows that a later center of combustion always corresponds to a larger ignition retardation.
The control actuators are the throttle plate angle and the cylinder-individual values for the injection duration and the ignition angle .
An infinite-horizon linear quadratic regulator design is used for the feedback controller, as described in detail in [22].
In order to apply the state feedback, a state observer is added. The combination of an observer-based state estimation and a linear state feedback control law results in a feasible output feedback control system referred to as linear–quadratic–Gaussian (LQG).
The LQG controller structure is extended as follows: Every controller output is augmented by integrative behavior, which is required for reference tracking. This approach is discussed in detail in [22]. A model-based feedforward part is included, which was found to significantly increase the controller performance in transient operating conditions. The controller is discretized on an engine segment-time basis.
The performance of the controller is discussed in Section 2.2.3.
2.2.2. Control Set Points
The engine idle speed set point was throughout all the experiments. This value represents a typical state-of-the-art elevated idle speed used during the catalyst heating phase.
In order to identify a reasonable set point for the air-to-fuel ratio, a preliminary analysis was performed using the MIMO controller described in the previous section. The engine was operated under idling conditions at 1200 rpm, at various fixed centers of combustion, and at various air-to-fuel ratios. Figure 5 illustrates the resulting hydrocarbon concentrations upstream of the TWC as a function of the air-to-fuel ratio upstream of the catalyst, .
The experimental data indicates that an air-to-fuel ratio of around leads to comparatively low hydrocarbon emissions regardless of the center of combustion. The set point used in the following idling phase experiments was therefore chosen to be . This value leads to the hydrocarbon emissions not being very sensitive to control undershoots or overshoots while at the same time being very close to the lowest achievable emissions in terms of a fixed air-to-fuel ratio set point.
2.2.3. Practical Implementation
One of the main goals of the practical implementation of the idling phase is to ensure reproducible and comparable measurements. On the other hand, the hydrocarbon emissions and the temperature evolution inside the TWC should not be significantly influenced by the fluctuation or change of any variable other than the center of combustion.
Initial experiments using the starter motor to crank up the engine indicated that it is very difficult to repeat the crank and run-up phase with consistent results in hydrocarbon emissions because of the highly transient engine behavior in the first few combustion cycles. The influence of the fluctuations in the air-to-fuel ratio and engine speed in this first phase was so high that it was nearly impossible to make any clear statements about which ignition angle is best in the subsequent catalyst heating phase. Therefore, in the final practical implementation, the test bench brake is used to speed up the engine to the desired idle speed and the clutch is disengaged only when a stable feedback control is possible. The result is a reproducible implementation of the crank and run-up phase in terms of emissions.
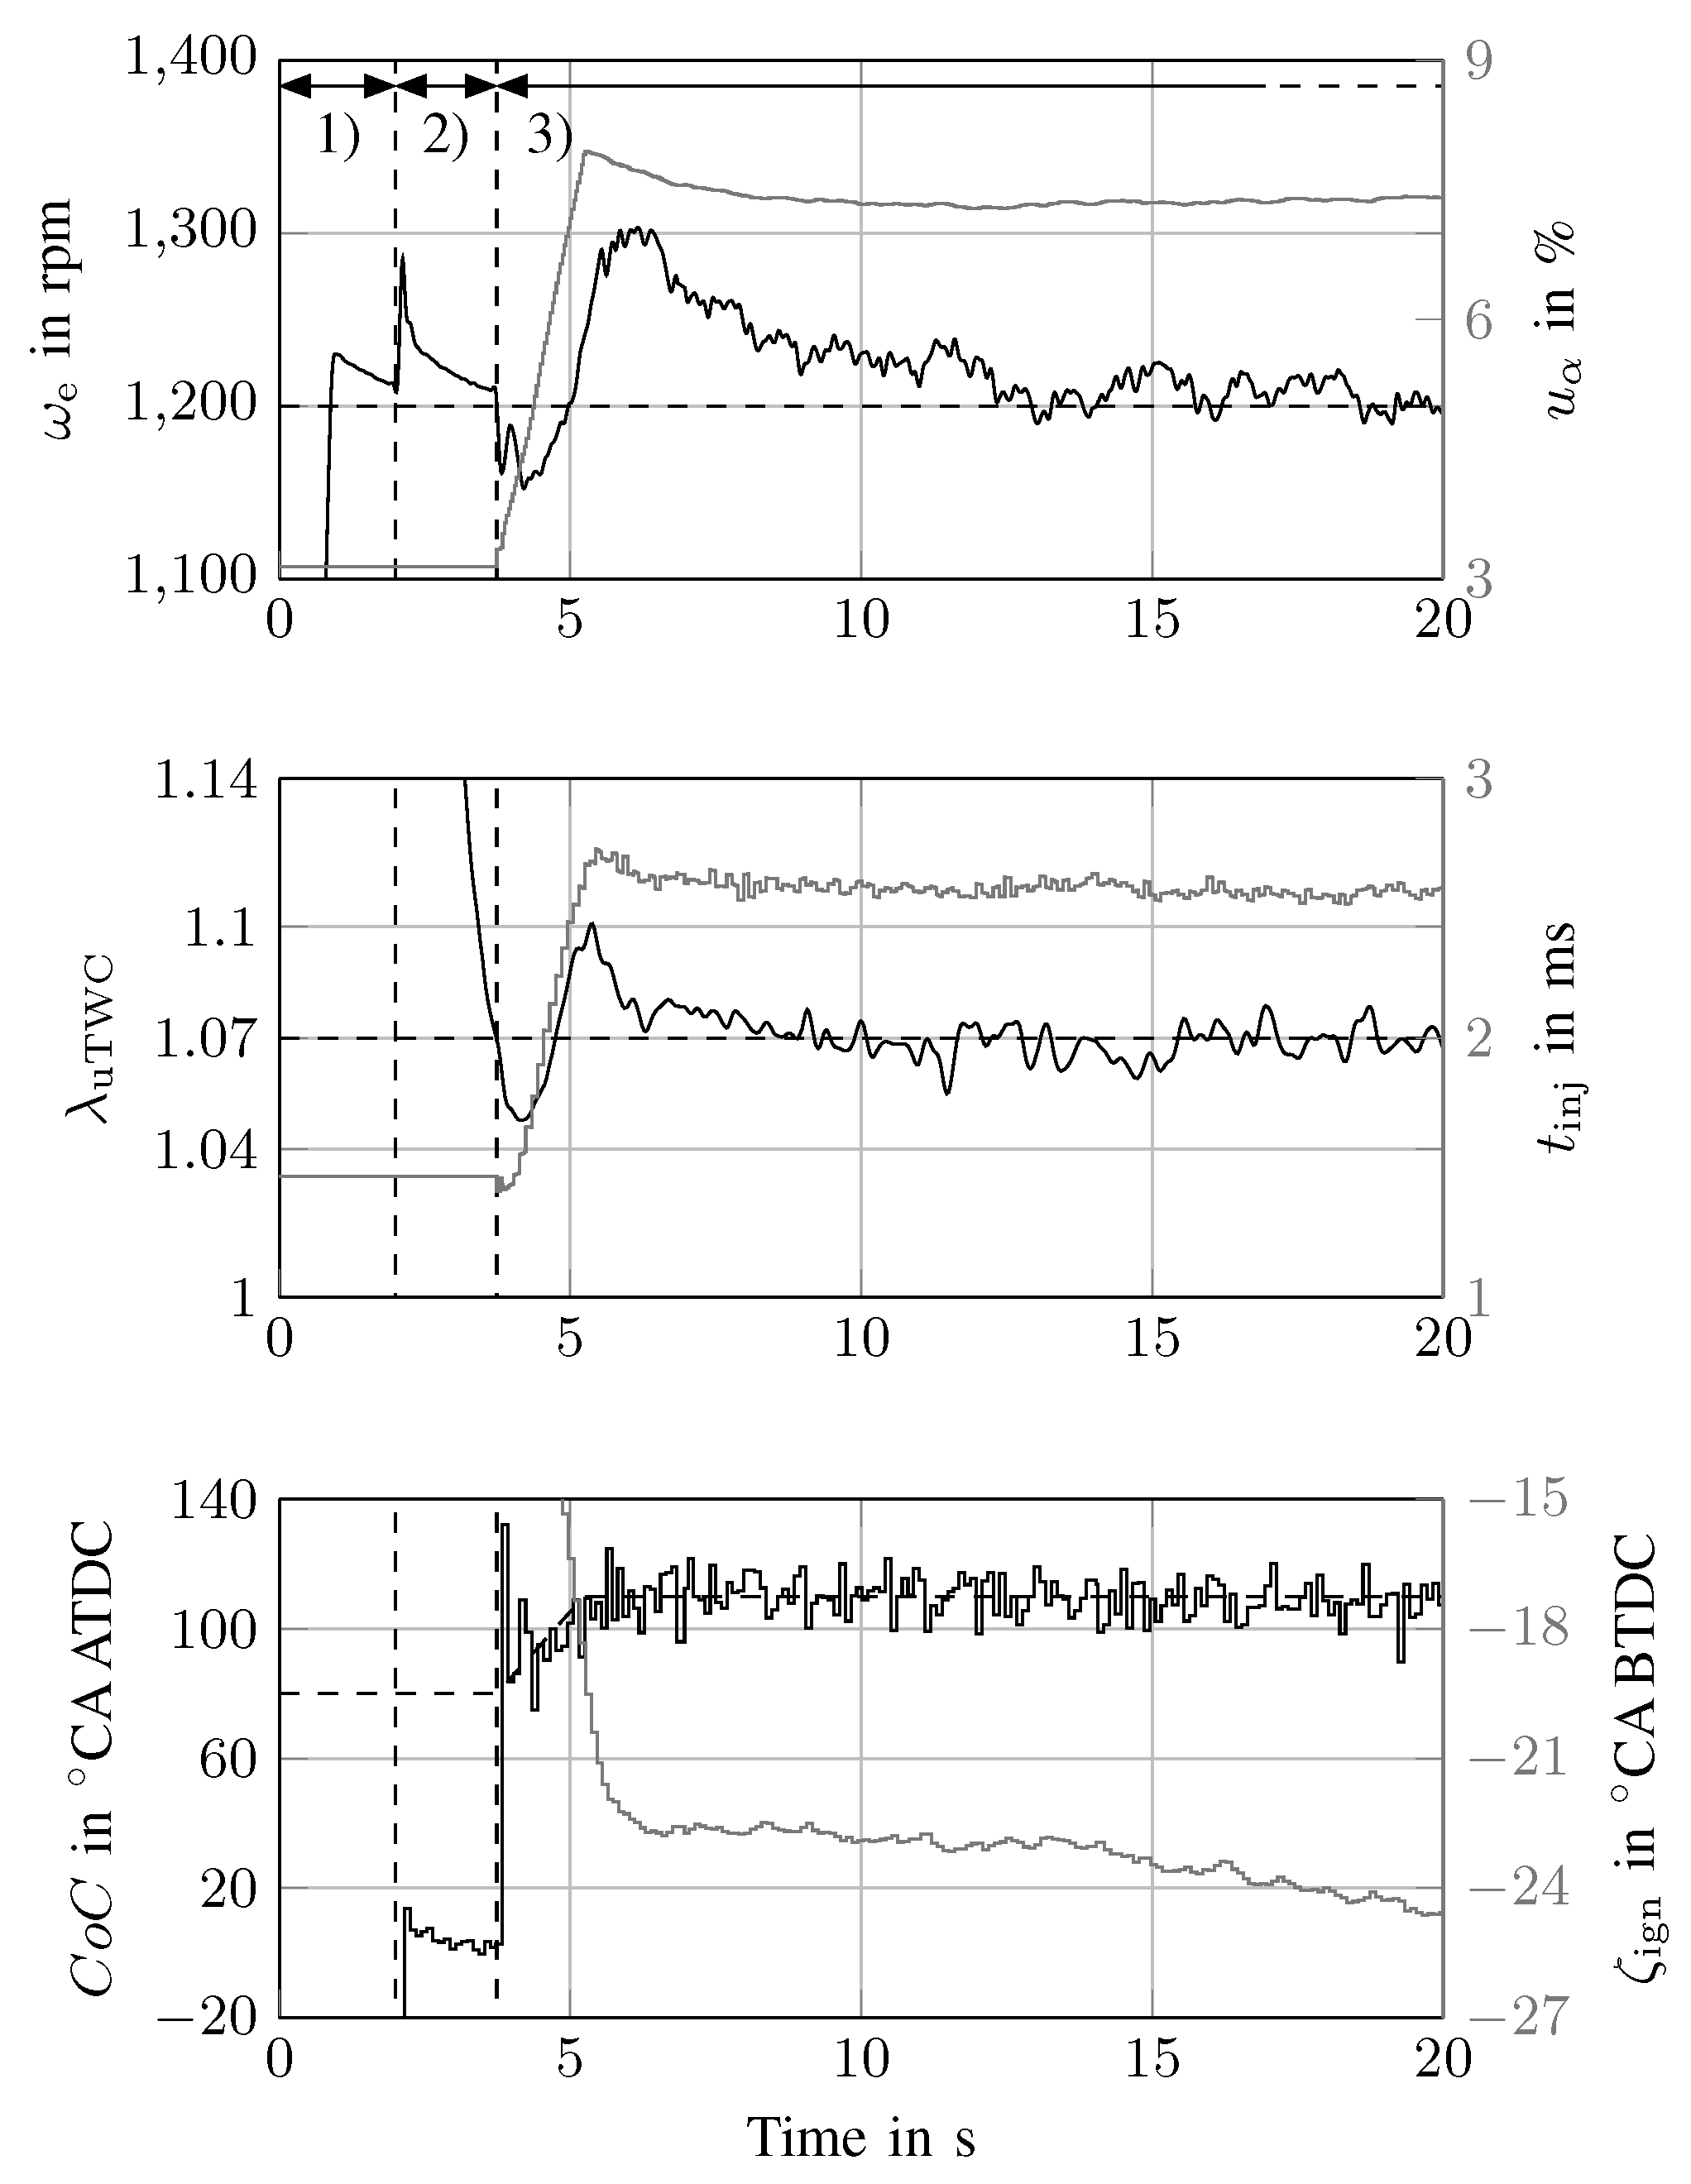
A description of the exact procedure follows, but Figure 6 also shows an illustration of the relevant control and actuator signals over time. The stages described by (1) and (2) make up the crank and run-up phase, while stage (3) is the catalyst heating phase.
- (1)
- The engine is dragged up to using the test bench brake. No fuel is injected during the first two seconds. During that time, the throttle is kept at a constant position. After two seconds, the gas flow dynamics in the engine have reached steady-state conditions.
- (2)
- After two seconds of dragging the engine, the combustion process is initiated while the clutch to the test bench is still engaged. The following actions are performed: The values for the actuators are kept constant and are identical for the cylinder-individual actuators. An injection duration is chosen, which would lead to an air-to-fuel ratio of in steady-state conditions. This slight fuel enrichment guarantees a combustion without any misfires. One single injection during the air intake stroke is applied. A fixed ignition angle of is used.
- (3)
- All the actuators are set to constant and always identical values during steps (1) and (2), regardless of the center of combustion set point for the corresponding experiment. This is to ensure that all measurements are based on the same starting phase of the engine. During steps (1) and (2), no air-to-fuel ratio signal is available. As soon as the air-to-fuel ratio sensor in front of the catalyst indicates , the catalyst heating phase is initiated and the feedback control is activated: The clutch connecting the engine to the test bench is disengaged, initiating a state of engine idling. The injection strategy is switched to a homogeneous split mode; that is, most of the fuel is injected during the intake stroke while a fixed small amount is injected shortly before the ignition. The feedforward ignition angle is retarded to a value resulting in a late center of combustion of . The feedback controller is activated; the fixed set points are for the cylinder-individual air-to-fuel ratio and for the engine speed. The center of combustion set point is changed from to the desired final set point with a ramp. This results in a coordinated transient behavior in all the feedforward controller outputs.
In summary, the catalyst heating phase is initiated as soon as the lambda sensors are operational.
It was found that the three measures, a slight fuel enrichment, early ignition, and a single injection pulse in step (2), lead to a reproducible starting phase without any misfires.
The performance of the aforementioned implementation in an experiment is illustrated in Figure 6. The diagrams show that all controlled variables can be kept within narrow bands around their set points. Specifically, the air-to-fuel ratio does not leave a narrow band around , which leads to low hydrocarbon emissions caused by air-to-fuel ratio variations even in the transient phase when the clutch is opened.
3. Experimental Setup and Procedures
The engine used in the experiments was a three-cylinder GDI engine with a central injector position. A dSPACE real time system was used to control the actuators and to record the measurement data. The sensor setup is schematically shown in Figure 7. The engine speed was measured using the default engine speed sensor, which is not shown in Figure 7.
The air mass flow was measured using the standard air mass flow meter (Type 0280218266, Robert Bosch GmbH, Stuttgart, DE) shipped with the engine.
Each combustion chamber was equipped with a water-cooled pressure sensor (6041A, Kistler Group, Winterthur, CH). The center of combustion () was calculated online using an approximation of the net heat release in the combustion chamber proposed by Hohenberg [23].
In order to measure the air-to-fuel ratio of the individual cylinders independently, extension pipes with a length of roughly 15 cm were mounted between the engine block and the exhaust manifold. Each of the pipes accommodated an oxygen concentration sensor (LSU ADV, Robert Bosch GmbH, Stuttgart, DE) built specifically for high temperatures. The extension pipes eliminated any cross-sensitivities of the cylinder-individual air-to-fuel ratio signals measured by reducing the mixing of the exhaust gas flows of the individual cylinders. An additional oxygen concentration sensor (LSU 4.9, Robert Bosch GmbH, Stuttgart, DE) was placed upstream of the TWC.
The temperature inside the TWC was measured 1 and 5 cm downstream of the front face of the brick. In both places, a small hole was drilled parallel to the front face, extending from the outer diameter all the way down to the centerline of the TWC, into which a K-type thermocouple (MTE 201, SAB Bröckskes GmbH & Co. KG, Viersen, DE) was inserted. In the location 1 cm downstream of the front face, the temperature-dependent conversion is most effective during the catalyst heating phase. The location 5 cm downstream of the front face is interesting because it can be used to analyze the temperature gradient inside the TWC.
The total hydrocarbon emissions were measured using a fast HC analyzer (HFR400, Cambustion Ltd, Cambridge, UK) incorporating two measurement channels with one measurement probe each. One probe was placed upstream and the other one downstream of the TWC. The HFR400 device measures hydrocarbon concentrations only. The corresponding hydrocarbon mass flow signals were calculated using additional information obtained from the air mass flow meter located on the intake side of the engine and the air-to-fuel ratio sensor , as follows. For a lean gasoline mixture in air, the following combustion equation is assumed to hold:
from which the number of parts n and the specific weights M of the fresh () and exhaust () gas are calculated as
The hydrocarbon mass flow is finally calculated as
where is the stoichiometric air-to-fuel ratio and is the hydrocarbon concentration measured. The specific weight corresponding to one hydrocarbon molecule detected, , was taken as 14 g/mole due to the approximate gasoline C–H ratio of 1:2.
The instantaneous hydrocarbon conversion efficiency of the TWC is calculated as
When represented in illustrations, the signal was always filtered with an acausal, phase-neutral low-pass filter at an appropriate bandwidth. The fluctuations of hydrocarbon concentration data upstream of the catalyst made it impossible to calculate a reasonable conversion efficiency characteristic otherwise.
The TWC was state-of-the-art zirconium dioxide washcoat-based and had been used in operation for roughly 600 h.
4. Results and Discussion
These paragraphs contain the analysis of the engine and TWC behavior during the warm-up phase when a constant center of combustion strategy is applied. The analysis illustrates some of the effects caused by varying the fixed ignition retardation used in the catalyst heating phase.
All the experiments used for the following analyses were conducted using a center of combustion set point in the range between and , as it was found that in this operating range no misfires occur. An ignition retardation resulting in a center of combustion any later than can lead to misfires in the given engine configuration. The occurrence of misfires was found to display a rather unpredictable stochastic behavior and made it impossible to make any clear statements regarding how much ignition retardation is best in terms of emissions.
All cumulative emissions shown in the following illustrations include the emissions of both the engine crank and run-up phase as well as the catalyst heating phase.
At least three measurements were taken at each center of combustion set point. The experiments exhibited a high reproducibility and therefore only one representative experiment at each center of combustion set-point is shown in the following illustrations for better visibility of the individual signals.
4.1. Time-Based Analysis
The top plot in Figure 8 illustrates one important aspect of a varying ignition retardation. At a constant air-to-fuel ratio, a later combustion requires a higher air and corresponding fuel mass flow for the engine to run at the same idle speed. This effect is due to the resulting lower efficiency of the engine. In addition to the higher mass flow, the exhaust gas temperature is higher as well.
The consequence of these effects in combination is shown in the second plot from the top. Two pairs of temperature profiles are shown, each corresponding to a different fixed center of combustion set point. A later center of combustion results in a faster increase of the TWC temperature. The temperature at 5 cm downstream of its front face exhibits a plateau at about 55 C regardless of the center of combustion set point. This plateau is due to the condensation and evaporation of water vapor contained in the exhaust gas. The vapor condensates whenever its absolute concentration exceeds relative humidity in the exhaust gas. (The exhaust gas of an engine operated at consists of water vapor.) A discussion and an appropriate first-principle model of these effects can be found in [24]. The data in Figure 8 shows that at high exhaust mass flows, the catalyst starts converting hydrocarbons even if it still contains liquid water at 5 cm downstream of its front face.
The third plot from the top illustrates the fact that the catalyst is driven towards its maximum conversion efficiency independently from the severity of the ignition retardation. Clearly, however, later ignition angles lead to a faster onset of the hydrocarbon conversion and to a faster increase in the conversion efficiency over time.
Two main conclusions can be drawn from the bottom plot, which represents the cumulative tailpipe hydrocarbon emissions over time. On the one hand, the cumulative emission curves clearly indicate that later values of the center of combustion lead to a faster onset of the conversion inside the TWC, which is the cause for the earlier stagnation of the cumulative emissions at a lower value. On the other hand one, a later center of combustion leads to higher cumulative tailpipe hydrocarbon emissions at the very beginning of the experiment. Flames inside the cold exhaust system are extinguished, and the unburnt fuel constitutes hydrocarbon emissions. Earlier centers of combustion do not suffer as much from this effect because more of the combustion takes place inside the hotter cylinders.
4.2. Temperature-Based Analysis
The illustration of experimental data with the time on the abscissa as shown in Figure 8 helps us to understand the physics that distinguish the individual center of combustion strategies. However, a time-based representation is not helpful for deciding which control strategy is best in terms of an optimal catalyst heat-up with respect to Equation (1). The different heat-up strategies result in different TWC temperatures and different cumulative hydrocarbon emissions when they are compared at the same point in time and therefore render a direct comparison impossible. A rather more intuitive choice is to show the temperature inside the catalyst on the abscissa. The result is a time-implicit representation of the experimental data with a focus on the relevant question, namely how signals such as the cumulative tailpipe hydrocarbon emissions evolve as the temperature inside the catalyst increases.
In Figure 9, data from the same experiments as in Figure 8 is used. However, as stated above, the abscissa represents the temperature inside the catalyst, .
The data in Figure 9 illustrates the result that a high value of ignition retardation is advantageous both in terms of minimal emissions and minimal fuel consumption. Any temperature inside the TWC can be reached with a lower fuel consumption (top plot) and lower tailpipe hydrocarbon emissions (middle plot) when a later center of combustion is used during the catalyst heating phase. There is no phase for which an earlier center of combustion has any advantage over a later center of combustion. Therefore, if the main goal is to increase the TWC temperature to a certain level higher than ambient, there is no need to ever choose an earlier center of combustion over a later center of combustion at the start of the catalyst heating phase in terms of emissions or fuel consumption.
The fact that less fuel is required to heat up the TWC at a later center of combustion is intuitively understandable. The enthalpy flow entering the TWC is proportional to both the exhaust mass flow and exhaust gas temperature. As illustrated in the two top plots in Figure 8, a later center of combustion, although requiring a higher fuel consumption, leads to an additional increase in the exhaust gas temperature. Therefore, the enthalpy flow is increased twofold (mass flow and temperature), whereas only the mass flow increase requires an increase in the instantaneous fuel consumption.
The cumulative tailpipe hydrocarbon emissions at later center of combustion set points also are strictly lower when shown with the temperature inside the catalyst on the abscissa. This observation is not surprising when the evolution of the cumulative hydrocarbon emissions upstream of the catalyst is compared to the temperature inside the catalyst (bottom plot in Figure 9). The corresponding emissions entering the catalyst are lower for later centers of combustion. The surplus of enthalpy resulting from a later center of combustion, which heats up the catalyst, appears to overcompensate for the corresponding surplus of absolute emissions in time, the very beginning of which is evident in the bottom plot of Figure 8. In steady state, a larger ignition retardation is found to lead to lower engine-out hydrocarbon emission mass flows. The same effect was observed and analyzed in detail in [25]. The authors found that at large ignition retardations, unburned fuel in the crevices re-enters the combustion chamber while the combustion is not yet over. The flame thus consumes those remains, which decreases the amount of hydrocarbons exhausted.
In order to illustrate more clearly the advantage of using a later center of combustion, various experiments at fixed centers of combustion during the warm-up were conducted. In Figure 10, the hydrocarbon emissions produced and the time required in order to reach a defined temperature level inside the catalyst are plotted against the corresponding fuel consumption.
The conclusion of the illustrations presented in Figure 10 is that any temperature level inside the TWC can be reached with a lower fuel consumption and with lower cumulative tailpipe hydrocarbon emissions, and reached faster when a larger ignition retardation is used in the catalyst heating phase. This implies that when a fixed ignition retardation strategy is used, applying the largest possible ignition retardation value is the optimal choice during the initial idling phase. The corresponding optimal control problem is described in Equation (1).
5. Conclusions
The RGA of a mean-value mathematical model of a gasoline engine in idling conditions is used to illustrate that there are strong cross-couplings between the actuators available and the control variables. A model-based multivariable reference-tracking controller has been designed that allows reproducible measurements to be taken at varying degrees of ignition retardation while the engine is idling, which represents the initial idling phase of an emission test procedure. The experimental data is used to illustrate the correlation between fuel consumption, cumulative tailpipe hydrocarbon emissions, and the time required until the TWC has reached a certain temperature. An optimal control problem is stated for the initial idling phase of an emission test procedure of gasoline engines. The insight gained from the optimal control problem has been used to interpret the experimental data.
The influence of the severity of ignition retardation on the hydrocarbon emissions and the temperature dynamics inside the TWC can be summarized as follows: Any temperature inside the catalytic converter can be reached with a lower fuel consumption and lower cumulative tailpipe hydrocarbon emissions, and can be reached even faster in time when a larger ignition retardation is applied during the initial idling phase of an emission test procedure. In terms of an optimal catalyst heating phase ignition angle strategy, this observation implies that the engine should be operated for as long as necessary at the latest possible ignition angle in order to reach the desired final temperature inside the catalytic converter. If the duration of the catalyst heating phase is very short, and thus the desired final catalytic converter temperature cannot be reached, a maximum ignition retardation is still the best strategy to come as close to the desired temperature as possible while using as little fuel as possible, and while at the same time emitting the lowest possible amount of hydrocarbons.
In all the experiments described in this article, the engine was operated in an ignition retardation range in which no misfires take place. It would be interesting to find the extent to which the cold-start behavior of the engine is affected by a relatively small misfire rate. Possibly at very late ignition angles, a significant proportion of the unburnt fuel from a misfire process would still post-oxidize in the exhaust manifold when it comes in contact with the flames exiting the other cylinders. This part of the fuel would release heat very close to the TWC and thereby heat it up very quickly. A small misfire rate could thus even be helpful at very high values of ignition retardation.
It would furthermore be interesting to find the extent to which the total cumulative hydrocarbon emissions on a complete test procedure are affected by varying degrees of ignition retardation in the initial idling phase. Such an analysis would require the complete drive cycle to be implemented in a reproducible fashion, which is beyond the scope of the current article.
Acknowledgments
This study is supported by Robert Bosch GmbH.
Author Contributions
Raffael Hedinger designed performed and evaluated the experimental work, and wrote the article. Philipp Elbert was involved in exchanging ideas on the development of the theoretical framework and its practical application. Christopher Onder was the technical supervisor and played a key role in establishing the research goal. Philipp Elbert and Christopher Onder participated in the internal review of the article draft.
Conflicts of Interest
The authors declare no conflict of interest.
Abbreviations
The following abbreviations are used in this manuscript:
| Center of combustion | |
| FTP-75 | Federal Test Procedure |
| GDI | Gasoline direct injection |
| HC | Hydrocarbon |
| MIMO | Multiple-input multiple-output |
| NEDC | New European Driving Cycle |
| RDE | Real Driving Emissions |
| TWC | Three-way catalytic converter |
| WLTP | Worldwide harmonized Light vehicles Test Procedure |
References
- Shelef, M.; McCabe, R.W. Twenty-Five Years After Introduction of Automotive Catalysts: What Next? Catal. Today 2000, 62, 35–50. [Google Scholar] [CrossRef]
- Heck, R.M.; Farrauto, R.J.; Gulati, S.T. Catalytic Air Pollution Control: Commercial Technology; John Wiley & Sons, Inc.: Hoboken, NJ, USA, 2009; ISBN 978-0-470-27503-0. [Google Scholar]
- Shaw, B.; Hedrick, J.K. Coldstart engine combustion modelling to control hydrocarbon emissions. In Proceedings of the 15th Triennial World Congress of the International Federation of Automatic Control, Barcelona, Spain, 21–26 July 2002; Volume 35, pp. 295–300. [Google Scholar]
- Regulated emissions of a Euro 5 passenger car measured over different driving cycles. In Informal Working Group on Worldwide Harmonized Light Vehicles Test Procedure (WLTP), Sub-Group on the Development of the Harmonized Driving Cycle (DHC); European Commission Joint Research Centre: Geneva, Switzerland, 2010.
- Lee, D. Effects of Secondary Air Injection During Cold Start of SI Engines. Ph.D. Thesis, Massachusetts Institute of Technology, Cambridge, MA, USA, 2010. [Google Scholar]
- Hallgren, B.E. Impact of Retarded Spark Timing on Engine Combustion, Hydrocarbon Emissions, and Fast Catalyst Light-Off. Ph.D. Thesis, Massachusetts Institute of Technology, Cambridge, MA, USA, 2005. [Google Scholar]
- Koehlen, C.; Holder, E.; Vent, G. Investigation of Post Oxidation and Its Dependency on Engine Combustion and Exhaust Manifold Design. SAE Tech. Pap. 2002, 7, 1–14. [Google Scholar]
- Schatz, A.; Knorr, T.; Ellmer, D. Elektrischer Heizkatalysator zur Optimierung der Emissionen von Mildhybridsystemen. MTZ-Motortech. Z. 2016, 77, 146–153. [Google Scholar] [CrossRef]
- Pfahl, U.; Schatz, A.; Konieczny, R. Advanced Exhaust Gas Thermal Management for Lowest Tailpipe Emissions-Combining Low Emission Engine and Electrically Heated Catalyst. SAE Tech. Pap. 2012, 24, 2924–2931. [Google Scholar]
- Reif, K. Gasoline Engine Management: Systems and Components; Springer: Wiesbaden, Germany, 2015. [Google Scholar]
- Gerhardt, D.I.J. Die neue Emissionsstrategie der Benzin-Direkteinspritzung. MTZ-Motortech. Z. 2003, 64, 916–923. [Google Scholar]
- Lückert, P.; Doll, G.; Merdes, N.; Waltner, A.; Eder, T. Die Schwerpunkte der Otto-Motoren-Entwicklung von Mercedes-Benz, 19; Aachener Kolloquium Fahrzeug-und Motorentechnik: Aachen, Germany, 2010. [Google Scholar]
- Van Basshuysen, R. Ottomotor mit Direkteinspritzung: Verfahren, Systeme, Entwicklung, Potenzial; Springer: Wiesbaden, Germany, 2013. [Google Scholar]
- Wiemer, S.; Kubach, H.; Spicher, U. Investigations on the Start-Up Process of a DISI Engine. SAE Tech. Pap. 2007, 8, 4012–4014. [Google Scholar]
- Rodriguez, J.F.; Cheng, W.K. Effect of Operation Strategy on First Cycle CO, HC, and PM/PN Emissions in a GDI Engine. SAE Int. J. Eng. 2015, 8, 1098–1106. [Google Scholar] [CrossRef]
- Peckham, M.S.; Finch, A.; Campbell, B. Analysis of Transient HC, CO, NOx and CO2 Emissions From a GDI engine Using Fast Response Gas Analyzers. SAE Int. J. Eng. 2011, 4, 1513–1522. [Google Scholar] [CrossRef]
- Lohfink, C.; Baecker, H.; Tichy, M. Experimental Investigation on Catalyst-Heating Strategies and Potential of GDI Combustion Systems. SAE Tech. Pap. 2008. [Google Scholar] [CrossRef]
- Guzzella, L.; Onder, C.H. Introduction to Modeling and Control of Internal Combustion Engine Systems; Springer-Verlag: Berlin, Germany, 2010. [Google Scholar]
- Eriksson, L.; Nielsen, L. Modeling and Control of Engines and Drivelines; John Wiley & Sons Ltd: Chichester, UK, 2014. [Google Scholar]
- Bristol, E. On a New Measure of Interaction for Multivariable Process Control. IEEE Trans. Autom. Control 1966, 11, 133–134. [Google Scholar] [CrossRef]
- Skogestad, S.; Postlethwaite, I. Multivariable Feedback Control: Analysis and Design; Wiley: New York, NY, USA, 2007. [Google Scholar]
- Geering, H.P. Regelungstechnik: Mathematische Grundlagen, Entwurfsmethoden, Beispiele; Springer-Verlag: Berlin/Heidelberg, Germany, 2004. [Google Scholar]
- Hohenberg, G. Der Verbrennungsverlauf—Ein Weg zur Beurteilung des Motorischen Prozesses. In Wiener Motorensymposium; VDI: Düsseldorf, Germany, 1982. [Google Scholar]
- Frauhammer, J.; Klein, H.; Eigenberger, G.; Nowak, U. Solving Moving Boundary Problems With an Adaptive Moving Grid Method: Rotary Heat Exchangers With Condensation and Evaporation. Chem. Eng. Sci. 1998, 53, 3393–3411. [Google Scholar] [CrossRef]
- Eng, J. The Effect of Spark Retard on Engine-out Hydrocarbon Emissions. SAE Tech. Pap. 2005, 114, 1727–1741. [Google Scholar]
Figure 1.
Inputs and outputs of the mean-value engine model.

Figure 2.
Validation of the mean-value engine model.

Figure 3.
Basic structure of the multivariable controller.

Figure 4.
Correlation between center of combustion () and ignition angle () in all three cylinders.

Figure 5.
Hydrocarbon emission concentration measured upstream of the catalyst when the air-to-fuel ratio in steady-state operating conditions is varied. The fixed set point for all cold-start measurements is defined as , indicated in gray.
Figure 5.
Hydrocarbon emission concentration measured upstream of the catalyst when the air-to-fuel ratio in steady-state operating conditions is varied. The fixed set point for all cold-start measurements is defined as , indicated in gray.

Figure 6.
Actuator and control signals during the warm-up phase. Dashed black marker at 2 s: opening of the clutch. Dashed black marker at around 3.5 s: starting of feedback control. The engine speed signal is low-pass filtered with a cut-off frequency slightly lower than the engine segment frequency such that oscillations due to the individual combustion events are filtered. All other signals are presented in their raw form.

Figure 7.
Schematic illustration of the relevant engine and sensor components.

Figure 8.
Influence of the center of combustion on the engine and catalyst behavior during the warm-up phase. In the second plot from the top, the temperatures are shown for the cases and only for better visibility.
Figure 8.
Influence of the center of combustion on the engine and catalyst behavior during the warm-up phase. In the second plot from the top, the temperatures are shown for the cases and only for better visibility.

Figure 9.
Fuel consumption, cumulative tailpipe hydrocarbon emissions, and cumulative engine-out hydrocarbon emissions over the temperature inside the catalyst. All signals are shown for a duration of 200 s.
Figure 9.
Fuel consumption, cumulative tailpipe hydrocarbon emissions, and cumulative engine-out hydrocarbon emissions over the temperature inside the catalyst. All signals are shown for a duration of 200 s.

Figure 10.
Cumulative tailpipe hydrocarbon emissions, total fuel consumption, and the time required until a certain temperature in the three-way catalytic converter (TWC) is reached. Five different fixed centers of combustion are compared; for each, three experiments are recorded. The gray areas are bounded by the maximum and minimum measured data samples, while the lines represent the average trends. With a set point of , cannot be reached within the 200 s analyzed.


Table 1.
Relative gain array (RGA) matrix of the system shown in Figure 1.
Table 1.
Relative gain array (RGA) matrix of the system shown in Figure 1.
| 0.49 | 0.62 | −0.11 | |
| 0.32 | 0.74 | −0.06 | |
| 0.19 | −0.36 | 1.17 |
© 2017 by the authors. Licensee MDPI, Basel, Switzerland. This article is an open access article distributed under the terms and conditions of the Creative Commons Attribution (CC BY) license (http://creativecommons.org/licenses/by/4.0/).
Share and Cite
MDPI and ACS Style
Hedinger, R.; Elbert, P.; Onder, C. Optimal Cold-Start Control of a Gasoline Engine. Energies 2017, 10, 1548. https://doi.org/10.3390/en10101548
AMA Style
Hedinger R, Elbert P, Onder C. Optimal Cold-Start Control of a Gasoline Engine. Energies. 2017; 10(10):1548. https://doi.org/10.3390/en10101548
Chicago/Turabian StyleHedinger, Raffael, Philipp Elbert, and Christopher Onder. 2017. "Optimal Cold-Start Control of a Gasoline Engine" Energies 10, no. 10: 1548. https://doi.org/10.3390/en10101548
Note that from the first issue of 2016, this journal uses article numbers instead of page numbers. See further details here.