Designing a Sustainable University Recharge Area for Electric Vehicles: Technical and Economic Analysis


Dipartimento di Energia, Ingegneria dell’Informazione e Modelli Matematici, University of Palermo, 90133 Palermo, Italy
*
Author to whom correspondence should be addressed.
Energies 2017, 10(10), 1604; https://doi.org/10.3390/en10101604
Submission received: 13 September 2017
/
Revised: 5 October 2017
/
Accepted: 7 October 2017
/
Published: 13 October 2017
(This article belongs to the Special Issue Decentralised Energy Supply Systems)
Abstract
:This article addresses the technical and economic challenges regarding the design of a “green” recharge area for electric vehicles at the University of Palermo in order to reduce costs and pollution connected to the charging process. Based on the behaviour of the student population, the electrical load is identified and two possible solutions are evaluated to manage the peak load: an orientation of the panels increasing the power at defined time and the use of a storage system. The main strength and weakness points of two systems are investigated by taking into account the Levelized Cost of Energy (LCOE), which reaches 75.3 €/MWh for the orientation of panel and 103 €/MWh for the storage system. Furthermore, the cost of the topologies of power plant and the cost of energy are discussed in depth.

1. Introduction
International targets for reducing greenhouse gas emissions have led to a significant use of renewable energy, which aims to replace more and more generation sources employing traditional fossil fuels such as oil, natural gas and coal. Among the measures for achieving these targets, the use of energy efficiency technologies is one of the major initiatives.
In this context, the Kyoto Protocol was adopted in Kyoto, Japan, in 1997, but, due to a complex ratification process, it entered into force in 2005. Unlike previous negotiations on climate change, which had only suggested that governments voluntarily reduce their emission of greenhouse gases, the Kyoto Protocol contains concrete mandatory standards for all the countries that have signed it, as for example Italy [1]. The European Union has also proposed a strategic plan identified with the Directive 2009/28/EC [2] and energy package called 20-20-20, in which three objectives are planned: a 20% of reduction in greenhouse gas emissions, a rise to 20% of energy produced from renewable sources and, finally, the obtainment of 20% of energy savings by 2020. Consequentially, a strong increase in renewable energy generation from new photovoltaic is a trend to which many countries are oriented.
The transport sector is one of the major causes of fossil fuel consumption and CO2 emissions. In particular, one of the most critical issues faced is traffic [3,4], due to the fact that the exposure to the produced air pollution can create the development of several diseases, such as asthma and cancer. It is in this spirit that the electric vehicles (EVs) are taking on a key role during the last years. Indeed, the number of EVs in circulation increases more and more every year. According to data from the European Automobile Manufacturers’ Association (ACEA), during the first 9 months of 2015 more than 190,000 electric and hybrid cars plug-in were sold in Europe, with a growth of approximately 95% in comparison with 2014 [5].
The spread of EVs is due to both a different sensitivity to environmental issues and to a better perception of the technical/economical benefits that an EV can offer, if compared to traditional vehicles. These benefits can be summarized as follows:
- Less pollution: local emissions are reduced to zero and the performances of lithium batteries are constantly improving (about 2000 recharge cycles, 300,000 km for full battery tracks, 10 years of useful life, etc.);
- Reduced consumption: the “fill up” process in an electric car consists in just plugging it into the mains for a few hours at the simple cost of the tariff plan provided by the service supplier;
- Reduced costs of management: unlike traditional vehicles, no liquid for refrigeration or lubrication replacement is required;
- Lack of circulation constraints: being locally non-pollutant vehicles, electric cars are not subject to movement restrictions such as echo pass or limited-traffic areas;
- Reduced noise level: the electric car engine is extremely quiet, which helps to relevantly decrease the noise level, allowing a more pleasant driving experience.
One of the main challenges for the E-mobility spread is represented by the lack of adequate infrastructures, such as charging stations. The most frequented areas where vehicles are parked for relatively long times are certainly better suited to the installation of charging stations, e.g., garages, restaurants, hotels, cottages, camping sites, shopping centers, business parks, sports centers or other business activities with parking [6,7]. In addition, some specialized sites provide useful maps that display the list of the charging points in the related areas and these portals are a reference point for EV owners. A customer owner of an electric car will surely prefer a structure able to offer a top-up service, with all the related safety conditions.
Different papers have faced the problem of electrical recharging from different points of view. As reported in [8], existing studies can be divided into four categories according to their purposes.
- -
- The first type of study focuses on the problem of EV power charging in remote areas that are far from a large grid.
- -
- The second category of research mainly targets the concerns of overload in grids as a result of EV charging.
- -
- The third type of research mainly follows the viewpoint of PV power plants. Solar-powered charging stations may significantly weaken the influence of EV charging on the local grid.
- -
- The fourth category of research emphasizes vehicle-to-grid (V2G) technology, which combines renewable energy and the local grid.
The first type of study directed to the construction of a renewable energy source-powered charging station [9]. The impact of EVs on the power grid is a commonly faced problem [10,11,12,13,14]. An increase in the EV diffusion can cause new peak loads in the power generating system and problems with the power dispatch and quality. Considering a first study [15], it is estimated that the increase in the development of EV charging station will require an increase of the peak loads limited to 1–2% for Texas, New York and New England. Similar results can be obtained considering Canada [16], where there is no federal authority regarding the production of electricity; it is a provincial jurisdiction. By considering a study conducted by Northumbria University [17] in the UK, the researchers estimated that a 30% adoption of electric vehicles would increase the residential peak demand between 6 p.m.–10 p.m. by an additional 45%. Similar value is addressed by an Italian study [18], in which a power peak increase of 57.1% is considered. A recent study [19] suggests for the Croatian case an increase of energy about 17%. These preliminary studies justify the need to go deep into the context and evaluate the impact of a massive use of EVs.
A remark is that the European power grid is still unprepared for the presence of peak loads due to EVs. Some solutions are suggested, for example [13] proposes an aggregator-based interactive charging management scheme with interruptible loads, which defines a continuous reference load for the power grid, that can be useful employed on feeding and EVs depending on State of Charge (SoC).
A discussed point of view is given by the possibility of the use of Photovoltaic (PV) energy for feeding the EVs. In this way, there is the attempt to reduce the EVs required power from the power grid. An economic evaluation model that attests to the ecological and economic benefits of reducing emissions by the use of locally produced photovoltaic energy is presented in [8]. These provisional studies are very important in the cases of strong development of demand for EVs.
In [20] the use of batteries to store the PV energy is presented, and such common point of view will be explanted in this article. The use of batteries for the storage is also considered in [21,22], but economic convenience depends on the country and main results of the analysis remain confined to Australia.
Another category of research is the one that studies the vehicle-to-grid technology (V2G). Large EV parking areas, in addition to being energy draw points, can provide ancillary services [23]. The impact on battery degradation from delivering V2G services is quantified in [24] and in [25] the potential financial incentives required to inspire EV owners to participate actively in the demand response mechanism are discussed.
Another branch of research on charging stations deals with the forecasting energy demand due to the State of Charge of EVs [26]. An interesting review can be found in [27,28]. It is obvious that difficulties arise to the intermittent nature of the photovoltaic and wind sources, and this problem is faced in [14]. From all these aspects, it is evident that there is still no certainty to face the next demands of energy by increasingly growing fleets of EVs.
A fifth type of research that could be added to the list of [8] is incentive policies of the different countries and the user perception of EVs.
Mazur [29] studied the role of the automotive industry in the UK and Germany, and the prospects for EV development. The automotive industry still plays an important role in the UK. The local automotive industry exports 83.7% of the vehicles manufactured in the UK (Nissan, Jaguar Land Rover, MINI, Vauxhall and Toyota). The automotive sector is crucial for Germany’s economy as it generated a turnover of 317 billion in 2010 (20% of German industry). In order to support the migration from internal combustion engine to electric motor, and at the same time gain new market slices for the local industry, the incentive policy for EVs has been created, UK Government has legislated the Climate Change Act 2008 [30] and German Government “Nationaler Entwicklungsplan Elektromobilität” (National Development Plan for Electric Mobility 2009) [31].
Heidrich [32] evaluated the effect of national and local incentive policies for 30 UK cities. He found that many cities do not seem to actively invest in public EV charging infrastructure, with exclusion of London and Newcastle upon Tyne. Both cities have introduced a significant public charging infrastructure and undertook communications and media campaigns to inform the public on the benefits of owning an EV.
In this paper, the authors suggest the previously proposed 5-point analysis for a local survey. In Italy, unlike the UK and German cases, there was no strategic attention to the EVs market [33]. The leading automotive manufacturers (Fiat, Lancia, Alfa-Romeo and Jeep) have shown no particular strategic interest in EVs.
Purchase subsidies, registration tax benefits, VAT benefits and local incentives (local seller discount) are so insignificant that they do not motivate the purchase [34].
Once past the main issue of the higher price, it is common that people decline to purchase an EV because of the impossibility of being able to recharge at home, in particular in Italy where the common contract with energy provider is for 3 kW, inadequate for EV charging. Thus, the presence of charging stations at the workplace [12] or at the University could represent the difference between buying an EV or not.
In this context, the Universities play an important role, holding all the features needed to offer a charging service for EVs given by the enormous daily flow of students, the presence of parking zones, the possibility of forecast the demand, and to inform on the benefits of owning an EV.
Since a generic approach that suits every countries’ context is unthinkable, due to the variability of electric features such costs of PV, storage batteries, and consequently Levelized Cost of Energy in different countries and in different years, the authors introduce the problem of a recharge area located at the University of Palermo, by taking into account different local features, that can be extended to other countries in which is expected to increase the peak energy required due to EVs.
Contrary to other publications, this study, starting from the particular Sicilian scenario [35], will demonstrate that an increase in the diffusion of EVs will help the performance of the power generating system and can reduce local pollutant emissions.
Another addressed key point is the definition of the behavior of the student population. For each student it is possible to obtain an average variation of State of Charge. In such a way, a comparison between suggested driving cycles and particular student driving cycles can be enforced. Such approach is justified by recent studies [36], in which the impacts of heterogeneity driving of EVs is examined.
Furthermore, two recharge areas are described and compared in order to distinguish the cost of different approaches. Moreover, this study discusses on the indirect pollutant emissions [37,38,39] and evaluates the positive contributions of rightful policies [40,41,42,43,44].
The authors propose and analyze an economic system to maximize the power output to EVs without using forecasting algorithms and also limiting the use of storage systems, that, as for any electrical object, but especially object that uses acids, are also considered polluting at end of their life [45] and especially costly [41,46,47].
More in detail, the paper is structured as follows: Section 2 describes the local statistical investigation carried out by interviewing 960 students (including university staff and professors) about their habits regarding the arrival time and their time of permanence on the Campus. The idea is to cover the fifth point of the type of study: the perception of the user about EVs. Different departments have been involved during a period of six months (with rain and sunny days). Sometimes the same students have been interviewed again in order to confirm their habits. This study is addressed to enforce the thesis about a more weight of a deterministic approach to a probabilistic one. Section 3 describes the State of Charge and the overall electrical power profile needed for a reference EV model, which has been taken into account for this study. Here the authors define the electrical load to be faced. The computation of the electrical load profile adopted for the proposed analysis and the design of the recharge area is discussed in Section 4. Section 5 describes the performance comparison of power generation photovoltaic systems by taking into account the Levelized Cost of Energy. Finally, the cost of the topologies of the power plant and the cost of energy are also discussed. To conclude, Section 6 discusses the local carbon dioxide indirect savings and the peak facing issue without increasing emissions.
2. Understanding People’s Behavior
It is well known that the profile of an electric load can only be determined with a probabilistic approach, consequently this is the approach followed in [12], which describes the behavior of an electric load at a parking area. Differently, the authors found that the habits of a student population showed a succession of repeated behaviors. From this hypothesis, the presumption of being able to define correctly the electrical load was born.
Several investigations were carried out in order to detect the habits of the population attending the University of Palermo, Italy, acquiring the exact information about the type of vehicles used to reach the campus, the arrival time and the time spent at that location. In order to cover 960 consultations university staff, professor and student have been interviewed, with a ratio of 90% students, 10% staff and professors.
Figure 1, Figure 2, Figure 3, Figure 4 and Figure 5 summarize the habits of students, obtained by the surveys from almost a thousand students conducted during different periods of the year. Figure 1 shows the actual way students reach the university. Eco-friendly systems are drawn with green colors, non-eco-friendly with red colors. It can be noticed that a considerable part of them (about 43%) travel to the university by car.
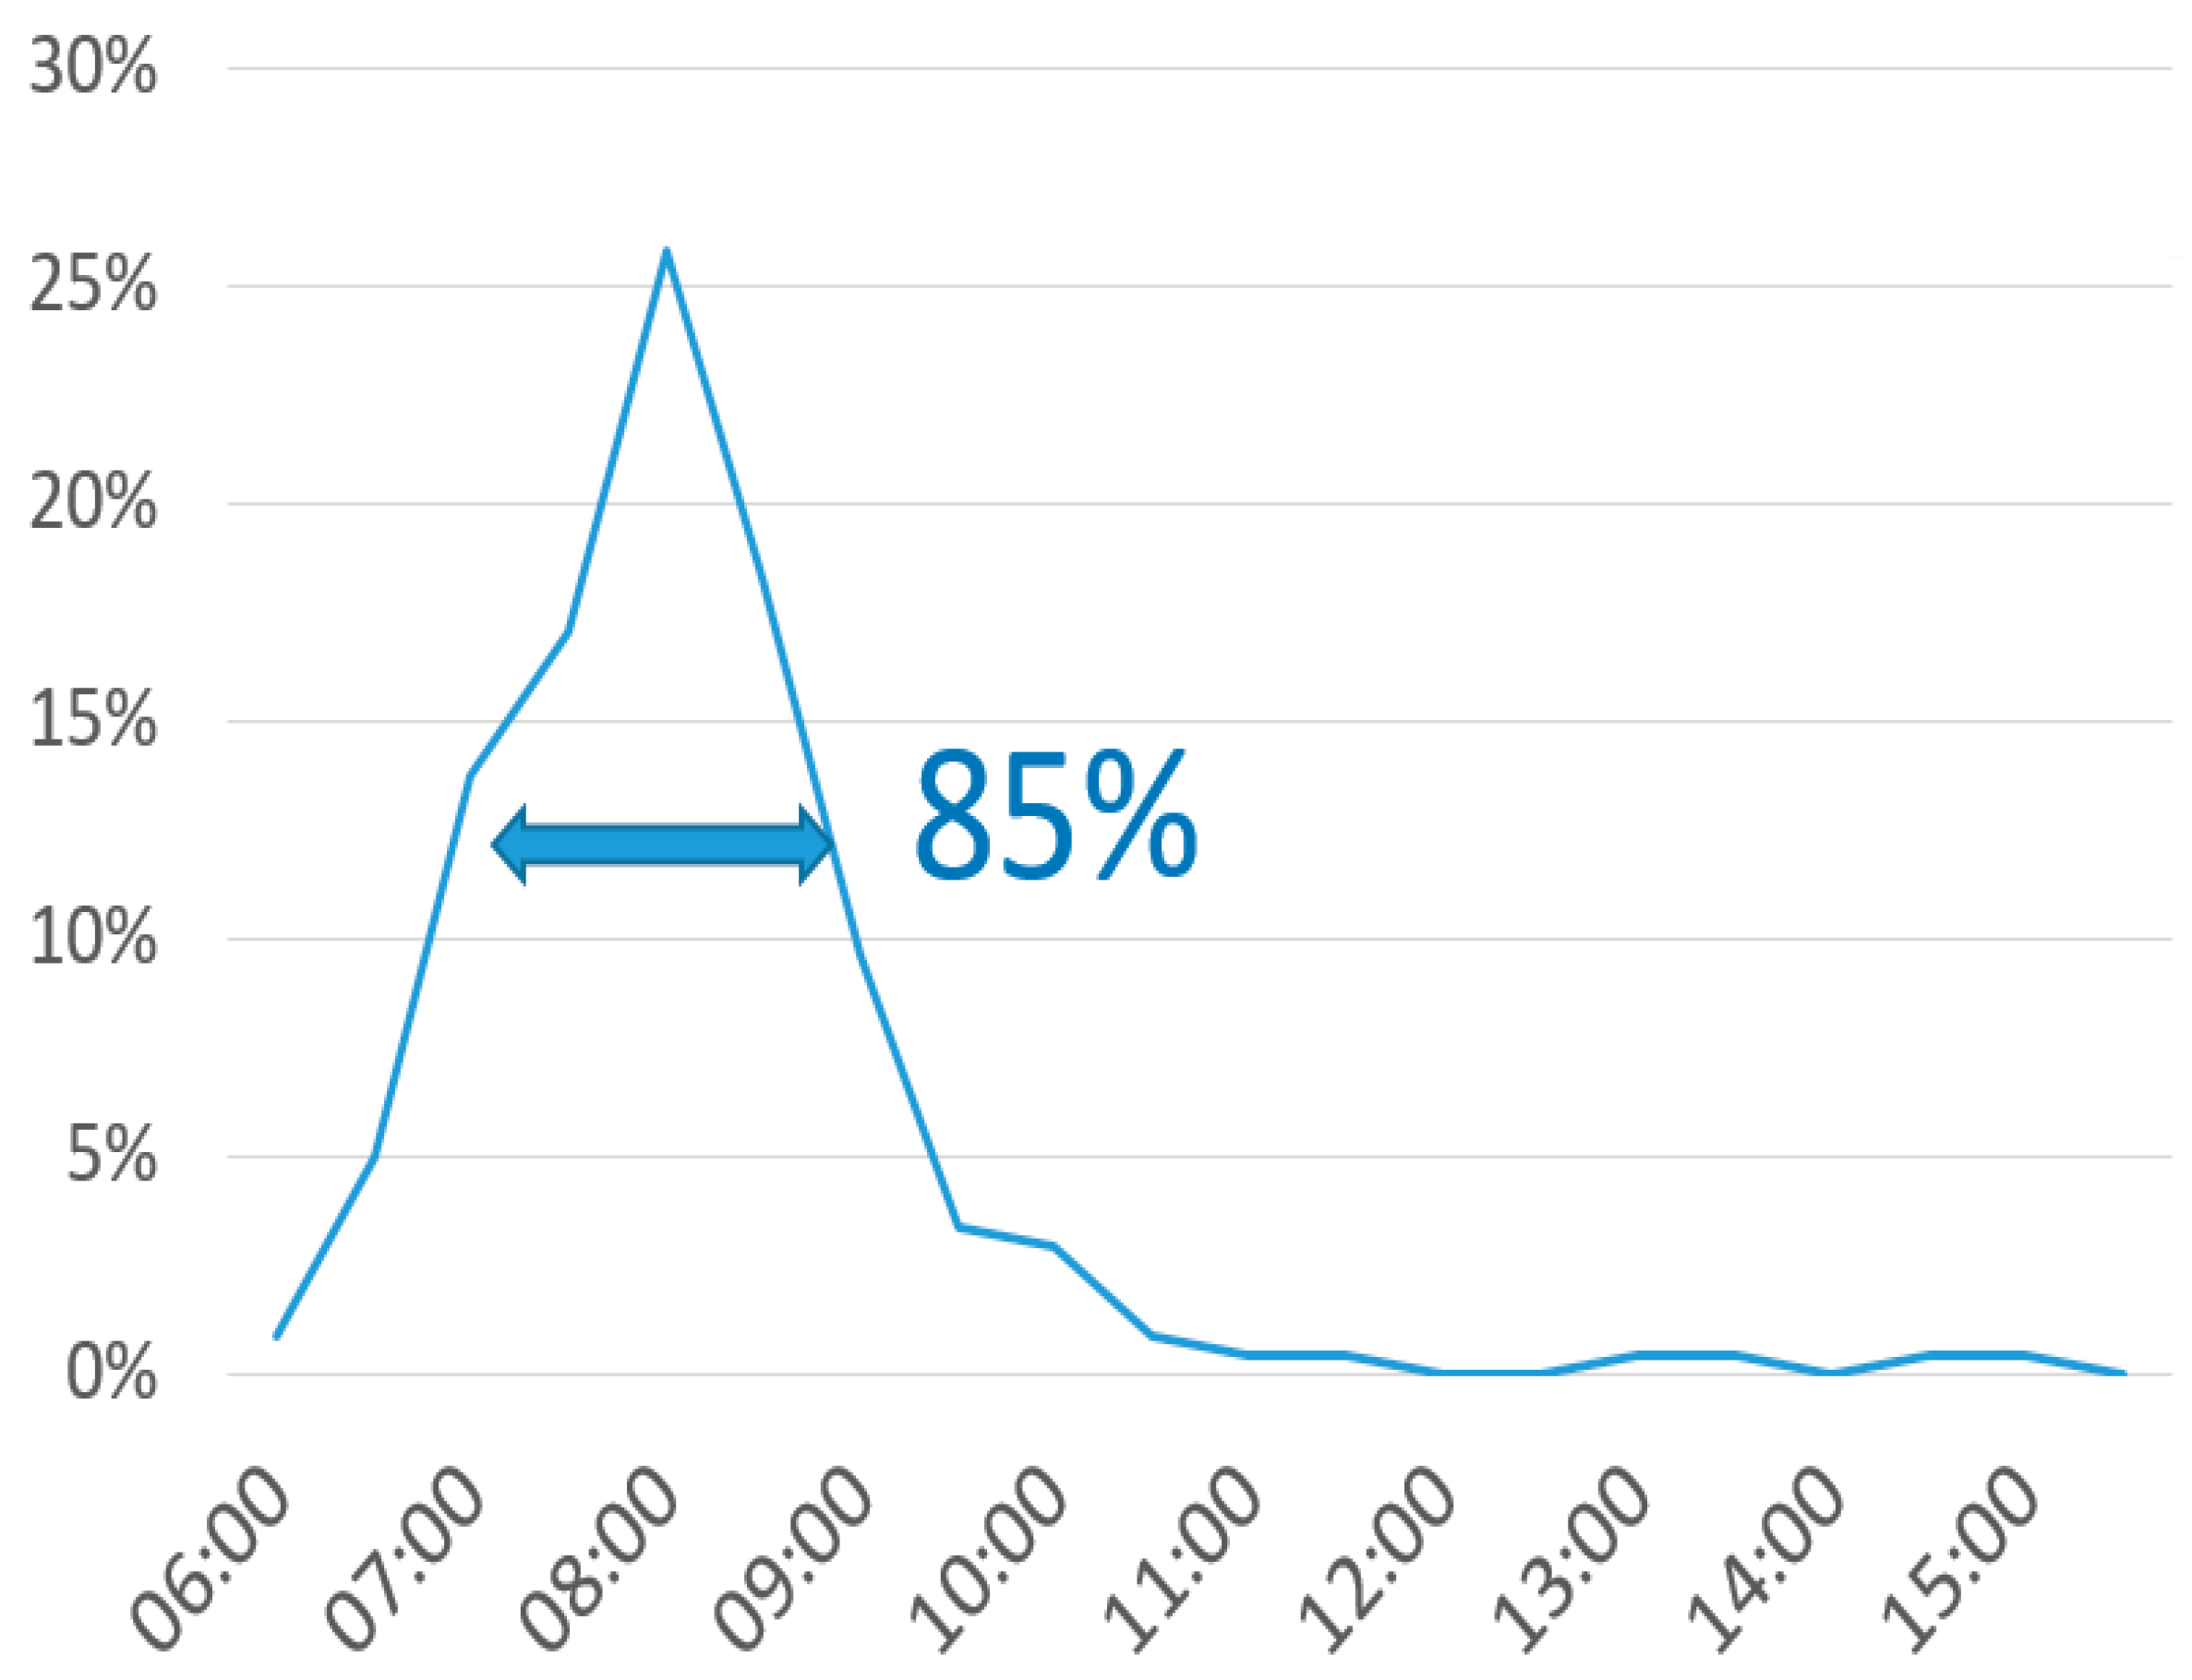
Figure 2 plots the time of arrival at the university, this being some of the more important data in defining the evaluation of the peak load. Without using a time scheduling method and without deploying the charging process over the staying interval, there would be a peak of demand that the university node could not cope with. It can be noticed that a considerable part of students has an arrival time between 7:30 and 8:30 a.m. (85%).
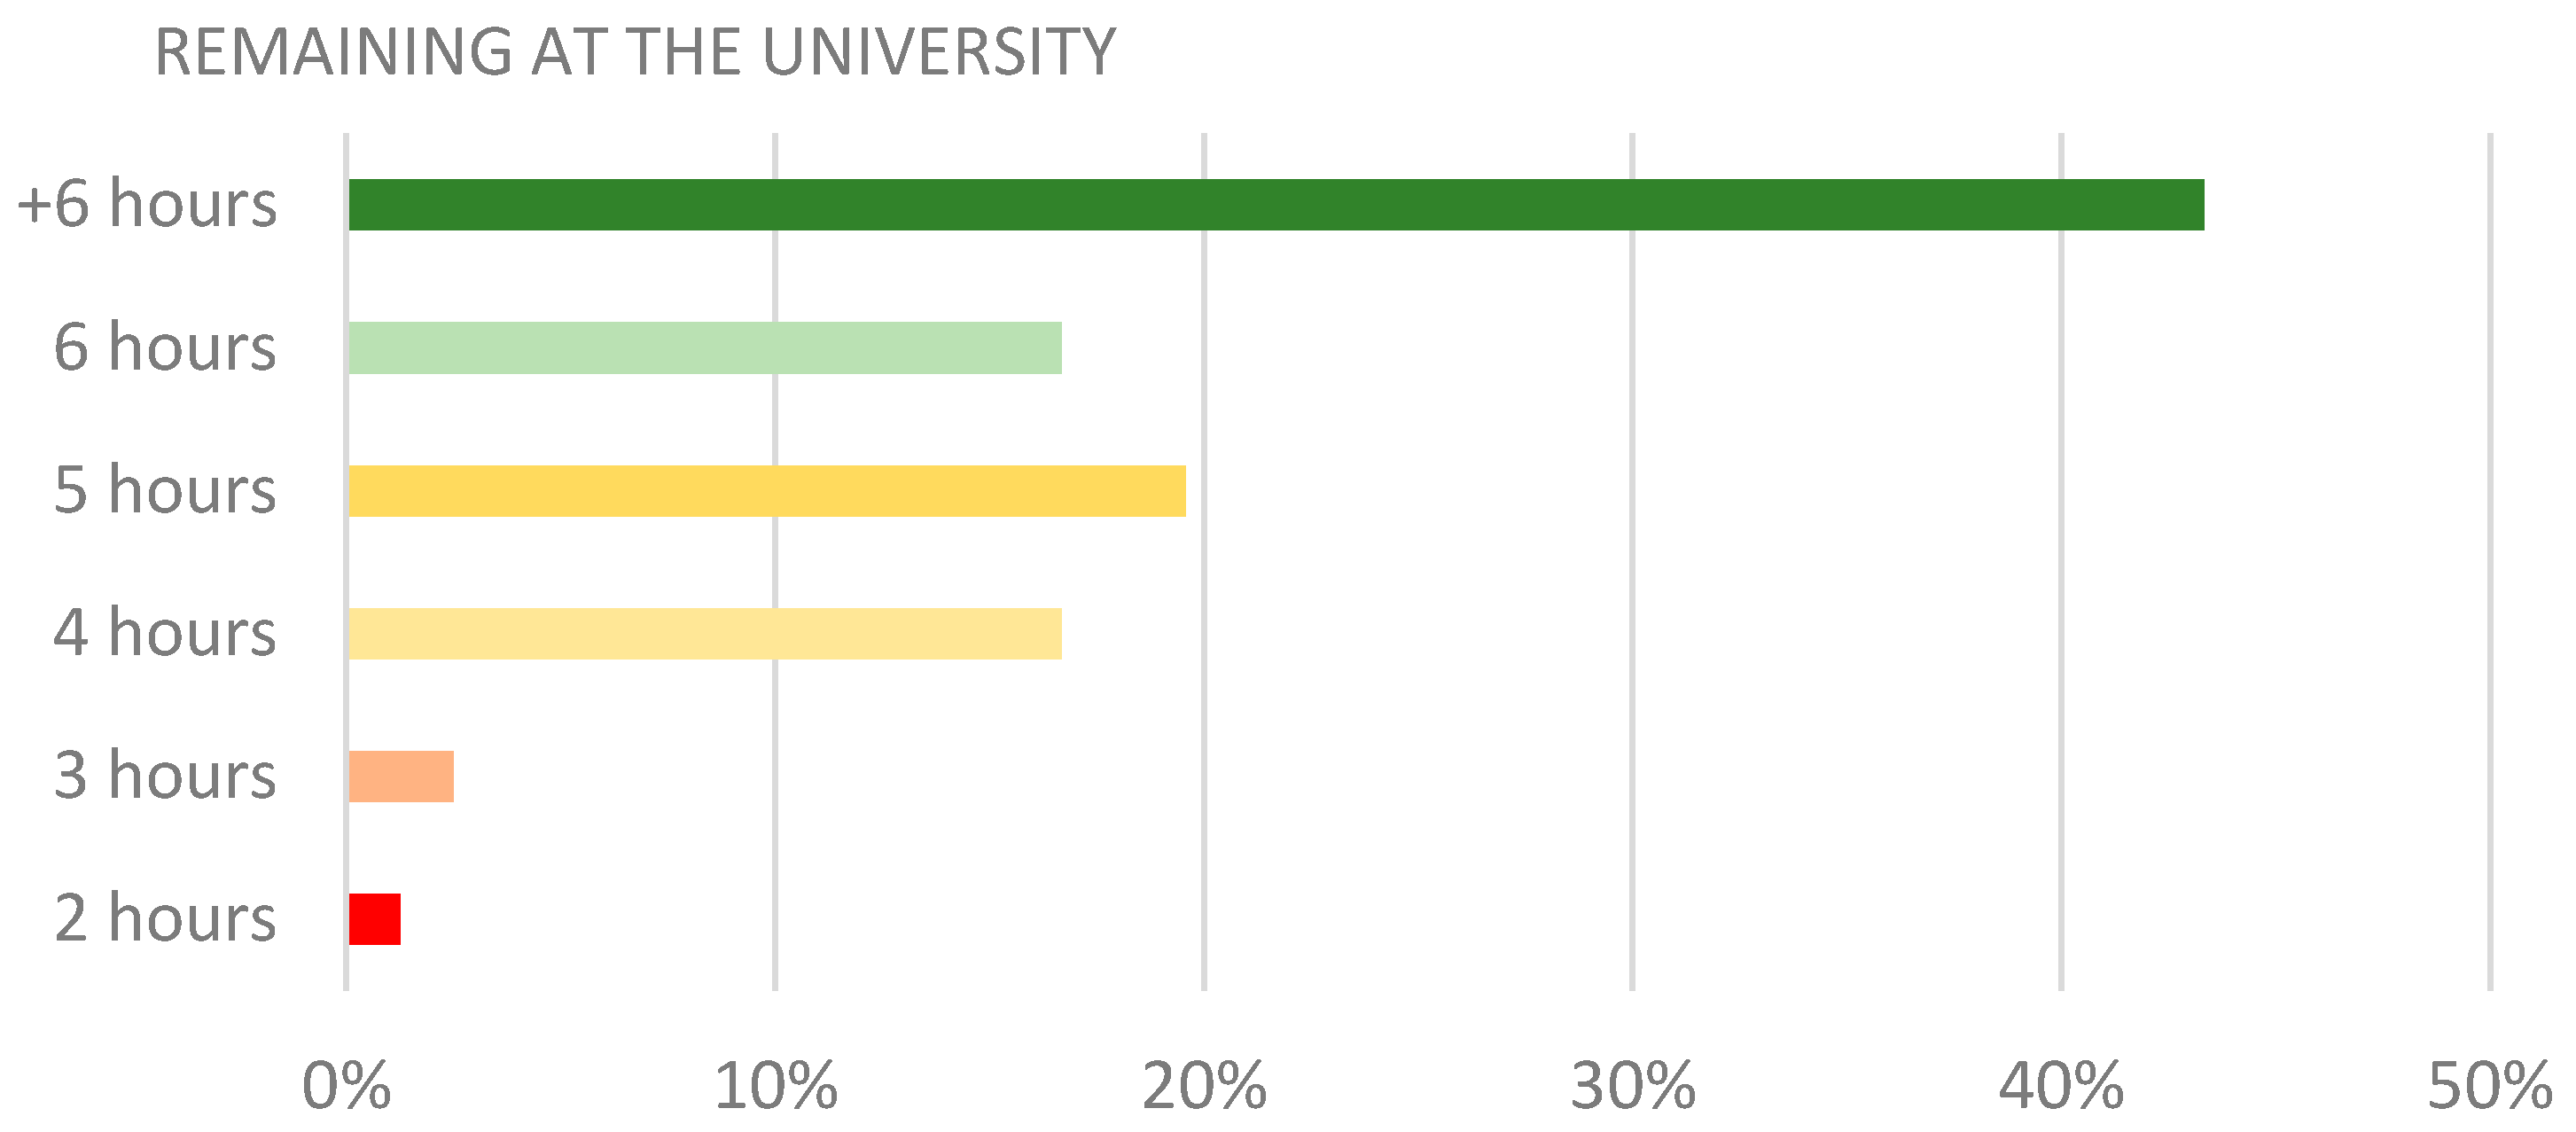
The second issue for importance is given by the time spent at the university (Figure 3); the greater the time spent, the lower the required power. Figure 3 shows the time spent at university by the student population throughout the academic year. It can be noted that remaining time is at least 4 h (96%) and, generally, more than six hours. This enables one to feed the required energy over a longer period of time.
In order to better define the amount of energy spent to get to the university, two items were analyzed: the time elapsed to reach the destination (Figure 4), and distance traveled (Figure 5). The travel time varies between 15 to 24 min, with an average time of 19 min, while the average distance is equal to 6.0 km. By considering the opinion expressed by the students, it has to be highlighted that there is a high potential to replace conventional vehicles with EVs (Figure 6).
However, the most arising challenge is that the arrival time at the university is almost the same for a relevant number of students, as shown in Figure 2, causing a charge demand that could generate a significant peak load.
The collected data show a good projection of EV diffusion and good regularity in the beginning and end of energy demand. This opens up the possibility of establishing slots [48] for charging or securing a supply for each user. In [10,11,12,16,17,18,19] it has been stated that the large-scale uncoordinated charging of EVs will increase the peak loads of power grids at rush hours and possible solutions are to reinforce the power grid or to shift the peak power demand to off-peak hours. The coordinated charging uses the load shifting or valley filling strategy, so an EV aggregator should be used. Such a system works on the basis of time varying price of electric power (a time-of-use (TOU) price system), actively engaging EVs in the demand response process [23,24,25]. In [48] an optimal energy management proposal employs a centralized approach based on the knowledge that the peak loads are at 10.00, 15.30 and 19.30, and in such a way try to smooth out the demand profile by evaluating vehicles both as loads and as generators, based on the time cost of energy. On the contrary, in this work we demonstrated that the peak is at 8.30 and the required energy does not last for different hours so a time shifting or valley filling strategies cannot be enforced, as there is no possibility to move the charging to 16.30, since by then the students are gone. On the other hand, the use of a scheduling system is based precisely on the difference in cost of energy, and on the offer of a more or less immediate recharge. One of the goals of a university is to provide a service, but not to transform it into a business. The service consequently employs a flat rate that allows parking inside the campus, so the slot option was the least suitable.
In addition, students are reluctant to change their habits and to abandon the lessons to move EVs, due the presence of a limited number of charging columns so a dynamical approach is difficult to be employed.
For the reasons explained above, the authors decided to proceed by considering the global electric load at the moment in which it presents itself by using a storage system or matching the PV production, by employing the so called EVs dominant approach, with a time linear allocation, as opposed to the grid dominant approach, which requires a linear price allocation.
3. State of Charge
The determination of the power values that must be provided to the electric motor during the different motion conditions is a relevant aspect for the assessment of the state of battery charge. The power supplied to the motor is intended to counteract four different physical phenomena, which generally oppose the movement of the car: the resistance to penetration from the air, Pair, the resistance offered by the rolling of the wheels on the ground, Prolling, the force of acceleration inertia, Pinertia, the force of gravity in overcoming the height differences of altitude, Pgravity. The resistances to motion can be summarized in aerodynamic (Rair) and rolling (Rrolling); the latter depends not only on the speed, but also on the tire inflation pressure, whereas the inertia resistance is due to incidental elements present only at specific times of the trip (acceleration/deceleration, up/down).
Each force concurs to determine the total required power Ptot, n that should be provided in any conditions of motion, which is expressed by the following formula:
Ptot, n = Pair drag + Prolling + Pinertia + Pgravity
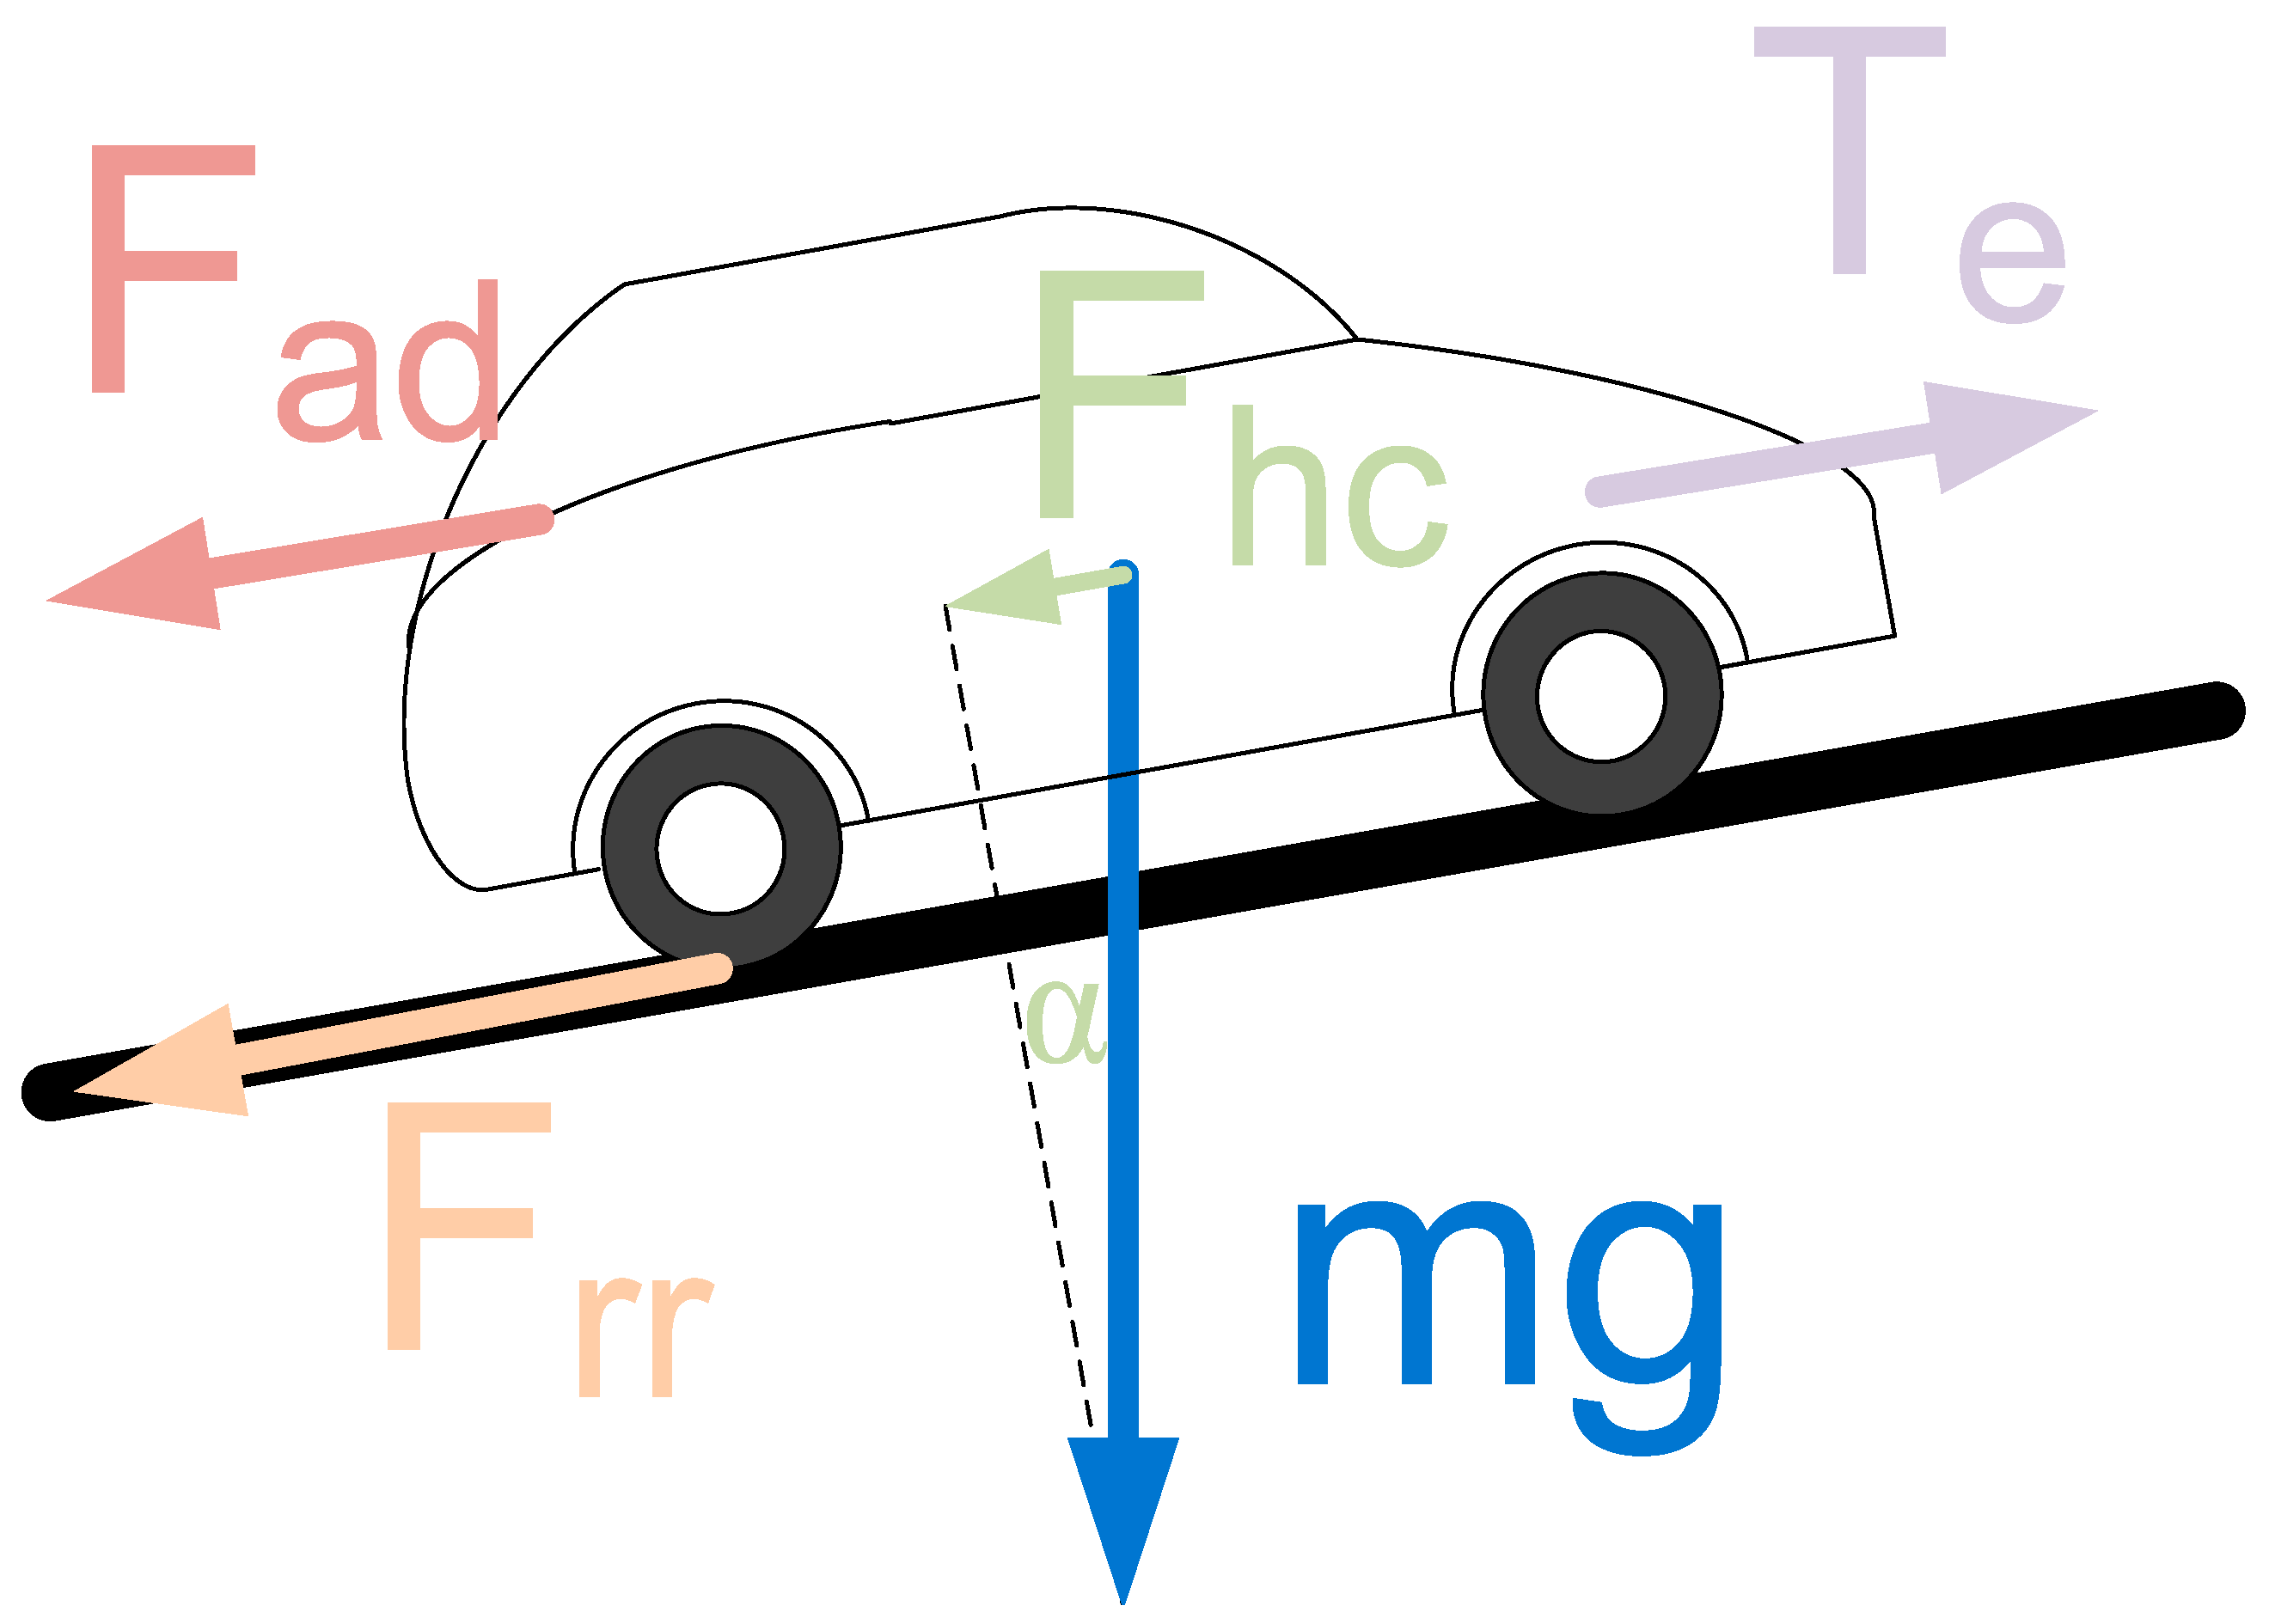
It has to be highlighted that Ptot, n is a third degree polynomial function, dependent on the speed variable v. As explained above, the EV movement is hindered by the following forces: rolling resistance force, aerodynamic drag, hill climbing force, and the traction effort also has to provide the acceleration force. In Figure 7 the resistive forces operating on the EV have been sketched.
Starting from expressions of interest to our students, we have also defined the type of vehicle that could replace the one currently owned by our students. According to the survey statistics, EVs with cost limited up to 30,000 € would be considered by the student population. In such a way, by considering the battery pack for this segment of EVs, we get information about the maximum power demand during the charging process. In the modelling process presented in this paper a typical EV has been considered and its main features are listed in Table 1.
Some of these forces depend on the velocity of the EV, so the velocity profile has to be provided, and since the relationship can be quadratic, it is not possible to use an average velocity. EV performance has been performed by employing the simulation model in [50]:
Aerodynamic drag force:
where ρ is the air density, A is front surface, Cd is the drag coefficient, v is the velocity.
Fad = ½·ρ·A·Cd·v2,
Rolling resistance force:
where µrr is the rolling resistance coefficient.
Frr = µrr·m·g,
Hill climbing force:
with α angle between gravity and perpendicular to the road.
Fhc = m·g·sinα,
Traction force:
where a is the linear acceleration, G the gear ratio, T the motor torque, r the radius of wheel.
Fte = m·a = G·T/r,
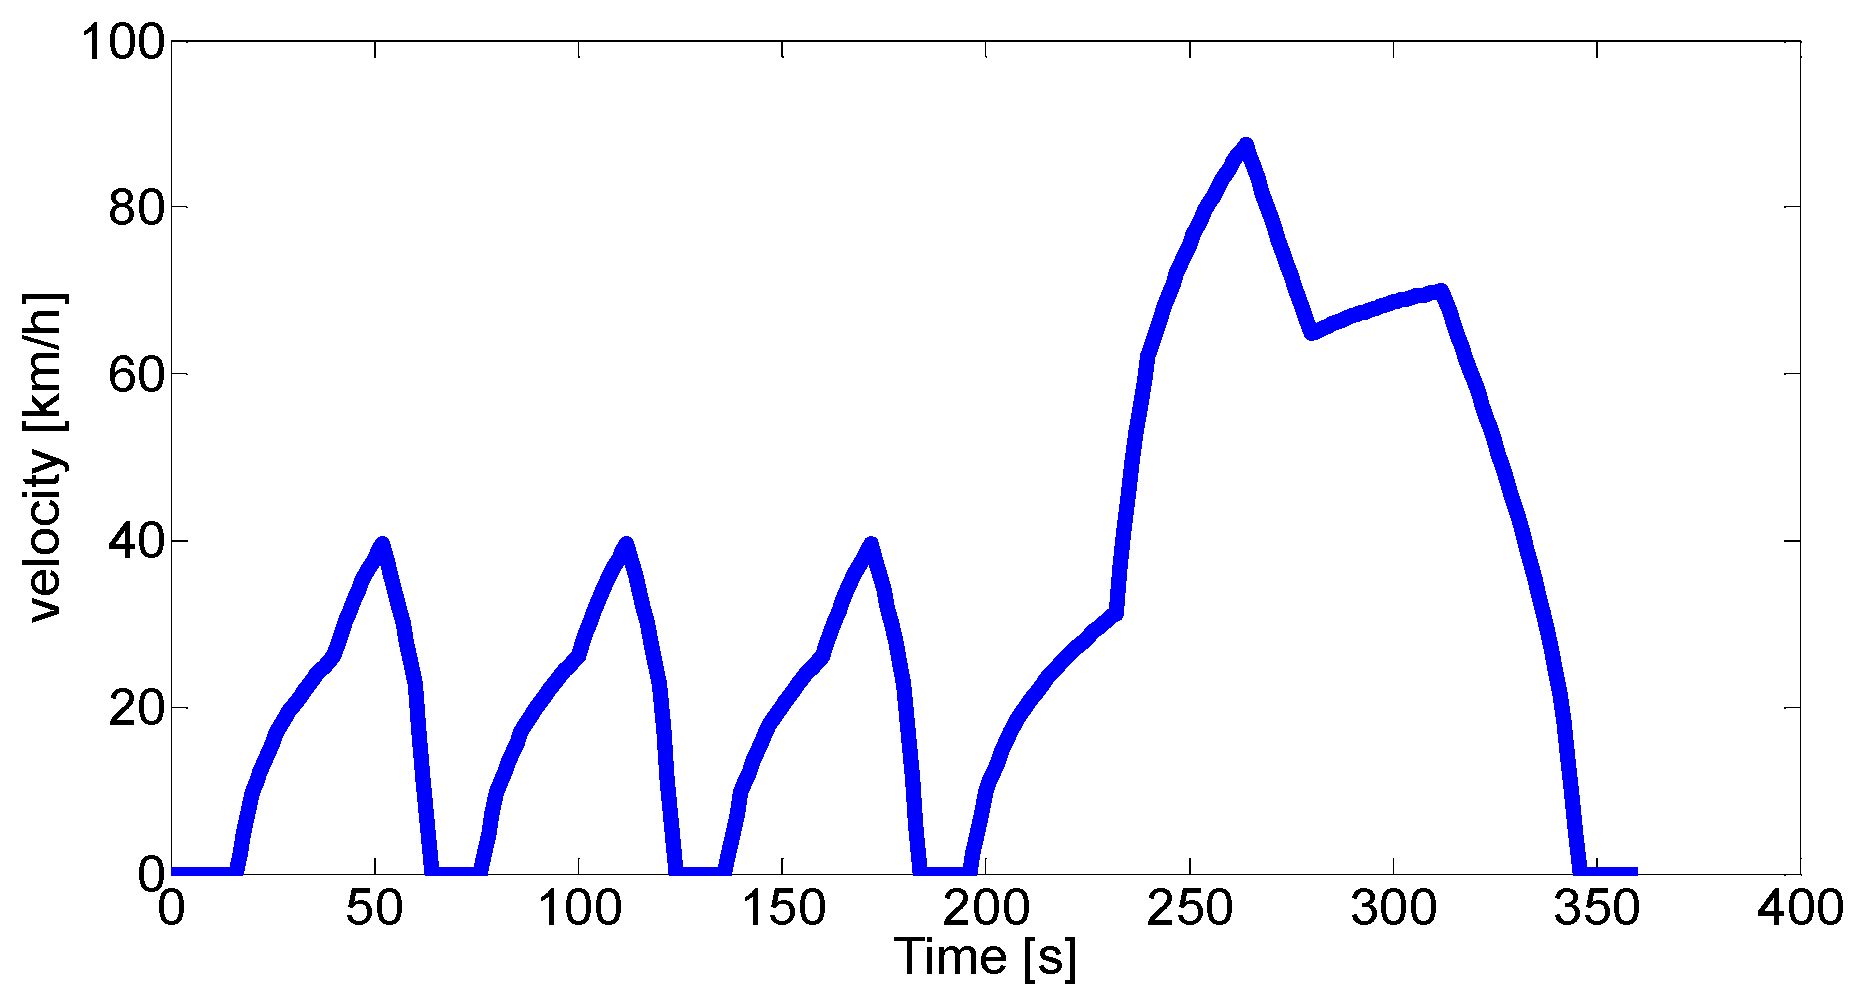
The battery has to provide energy for the traction, counteracting resistive forces. For the sake of simplicity, we suppose that the route is inside a city, without major changes in elevation and the velocity of the EV can be described by the Simplified Federal Urban Driving Schedule cycle (SFUDS, Figure 8), which are a series of tests defined by the US Environmental Protection Agency (EPA) to measure tailpipe emissions and fuel economy of cars [51], but other interesting approach can be found in [52,53,54], in which the driving cycles are based on future driving information with a stochastic prediction method based on the Markov approach or on a telematics technology-based approach, requiring global positioning system (GPS) and intelligent transportation system (ITS) information.
During the route, there are moments with high load and moments with almost zero load. When the load is zero, no power is drained from battery for the motion. Initially, we considered an EV with a mass of 1400 kg, drag coefficient 0.19, front area 1.8 m2, and battery capacity of 60 Ah, with an electric motor of 102 kW. In addition, the efficiency of the transmission has been considered (η = 95%). The battery has a total of 156 cells (26 elements of six cells).
As expressed in Equation (1) the traction power is the sum of different factors. The rolling resistance is constant respect the velocity, so Prr is constant. The power needed to overcome the aerodynamic drag depends on the square of velocity. Substantial power is required for linear acceleration (positive) and deceleration (negative) depending on the first derivative of the velocity of EV or angular velocity of the wheels [50]. The power for the angular acceleration of rotating parts depends on the first derivative of the angular velocity:
Motor angular speed ω = G·v/r;
The cycle presented in Figure 8 has been repeated continuously to simulate the distance traveled by the students, which can be covered in an urban landscape. Once the EV velocity for two consecutive points of the time-profile is known, their differences are representative of the acceleration, and the power drained by resistive loads and that required for the accelerations are also known. In such a way, by taking into account the efficiency of the mechanical and electrical transmissions, the integral of power provides the energy required from the battery and also the variation of SoC. The integral of the maintained speed provides the distance covered.
The power (and consequently the energy) required by the power supply system (battery) is higher than the total power needed to compensate for the forces in opposition to the motion. For its computation, the overall electrical efficiency of the system composed by inverter, battery control system, electric motor, mechanical transmission system, and any energy consumption required to supply auxiliary services (e.g., air conditioning, lighting, etc.) must be taken into account.
The typical efficiency of an inverter is, approximately, equal to ηinv = 95%, whereas the efficiency for a medium-size induction motors (tens of kilowatts) is almost equal to ηmot = 90%. The absence of mechanical transmission (differential) increases the efficiency of the power transmission to the wheels. Therefore, the related efficiency can be estimated at about ηtra = 94%. Thus, the overall performance of the vehicle during the discharging phase of the battery can be computed as the product of the efficiencies of the various components interposed between the battery and the wheels:
ηtot = 0.804
The energy demand for the batteries can be modeled by considering Coulomb counting [55]:
where Vnom is the rated voltage.
The cycle of Figure 8 is composed by short accelerations with sharp decelerations, with top speeds under 40 km/h, lower than the city speed limits. Thus, this first portion is a typical urban driving cycle. Then, the trend is composed by longer accelerations and higher speeds. Several stops can be appreciated between acceleration and sharp decelerations, which simulate the stops of the vehicle at traffic lights. The second part of the cycle simulates the travel along a large suburban avenue, with higher speeds, compared to the pure city circuit, and stops at traffic lights for approximately 20 s each.
The driving cycle completely neglects any road slope. In such a way it is possible to estimate the SoC, and the Coulomb counting algorithm can be taken into account:
By considering the student behaviors Table 2 can be obtained. The first column is the travelled distance, data suggested by the questionnaire and also the time required is used (second column). By employing the velocity of the driving cycle of Figure 8, the current required and state of charge have been evaluated for a Citröen C-zero or Nissan Leaf in the third column, named ΔSoC% (SFUDS).
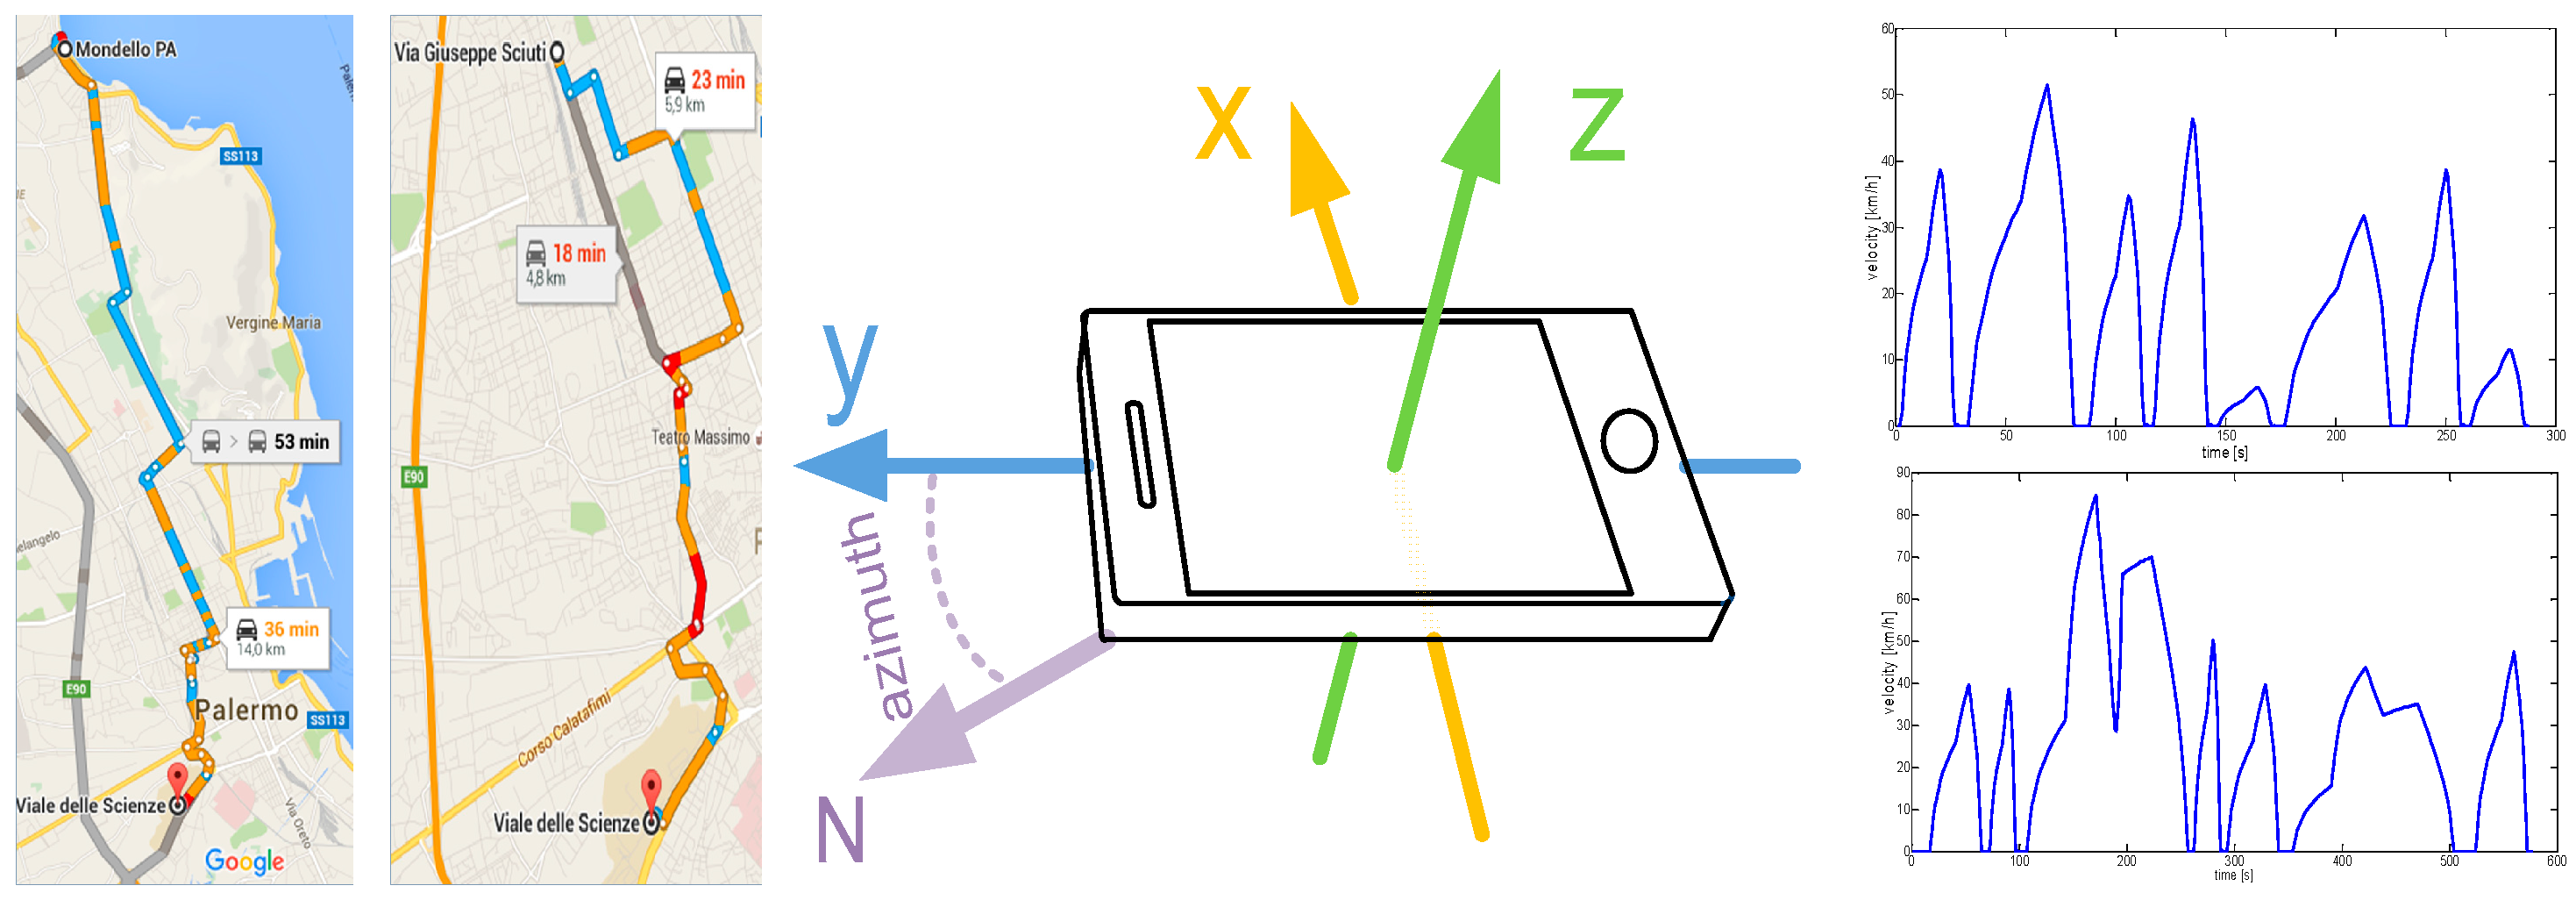
It has to be highlighted that, for each day, even though the distance covered by the students to reach the university may be the same, the driving speed varies and can be very different from the one suggested in Figure 8. In order to get a valid comparison of the performances of the system, the same travelled distance has been determined with a separate measuring system based on the MATLAB Mobile package of MATLAB (version 4.1.1, The MathWorks, Inc., Natick, MA, USA) which supports the acquisition of data from built-in sensors of an Android device. Such approach is similar to the one used in [54].
While driving the vehicle, we recorded, through motion sensors like the accelerometer and position sensors like the GPS, the speed, acceleration, and height that are inserted in the car model built in the same MATLAB language to determine the energy consumption. Instructions are very easy and data which contains latitude, longitude, time, speed, course, altitude and acceleration information are taken every second with the poslog command. Figure 9 shows some of the paths tested with the MATLAB mobile system. X and Y recorded the velocity and the acceleration of the EV, Z the altitude.
Table 2 is completed by adding the fourth column showing the variation of the SoC obtained by performing speed measurement with MATLAB Mobile. The performances are almost the same, although the measured ones were heavily dependent on the traffic encountered, conditioned by weather. We found that ΔSoC were dissimilar if the speed of 80 km/h was exceeded several times.
4. Profiling the Electrical Load and Designing the Recharge Areas
An important procedure for the computation of the electrical load consists in the determination of an average user. From the data of Figure 1, Figure 2, Figure 3, Figure 4 and Figure 5 and from the related considerations mentioned above, it is possible to create the average student profile, whose average data are summarized in Table 3.
To reach the university, the average student consumes 11% of his/her battery charge and may choose to recharge the 11% or to compensate an higher SoC, since not all of the houses can be equipped with a domestic charging facility, due to the limits of contractually enforceable power (the most common limit of 3 kW).
The commercially available charging power varies between 3.7 kW, 7.4 kW, 11 kW and 22 kW. However, during all the design process the charging powers between 3 kW, 7 kW and 22 kW are chosen. Initially, by considering a 90% of SoC before travelling to the university, the charging times can be evaluated by considering Table 4.
From the obtained values it appears evident that also low-power charging can be used in the first hours of the vehicles docking. The charging curve of the EV has a maximum point at the end of the charge at constant current and the beginning of the constant voltage charging. This fact means that the maximum power is required in the first stage of charging, generating peak loads that can affect the stability of the grid. For every 100 students of the University, the required power for the first hour is equal to PI = 231 kW. Obviously the value is very high, as it corresponds, in Italy, to the power demanded by a medium sized building with different laboratories.
One of the key points of the project is to determine the type of stall: these may be concentrated in small areas or distributed along the streets. Before proceeding with the system design, it is useful to adopt the hypothesis of the project in order to restrict the set of possible scenarios and simplifying also the analysis object of this paper. These assumptions can be summarized as follows:
- The entire system is made up of new components (transformers, conductors, switches, charging stations);
- The maximum power required by the electric vehicle is 22 kW. This is due to the fact that the column will automatically adjust the output power to the maximum power allowed by the battery and it do not always effectively recharge to 22 kW;
- An electric vehicle in the city can travel a maximum distance of around 150 km. This feature has been used as a upper limit;
- The optimum number of columns was set equal to 5, each one composed by two charging plugs;
- The power factor is set equal to 1;
- The maximum value of the industrial voltage drop is equal to 4% of the rated voltage, corresponding to 9.2 V.
Two types of layout for the charging stations are taken into account (see Figure 10): one concentrated stall, where all the stalls are located in the same parking area, and a distributed one, where the stalls are spread throughout all the campus streets.
Three possible cases have been studied, depending on the SoC at home: in the first one the arriving SoC is dependent on the distance travelled, ΔSoC is equal to 11%; in the second case initial SoC is equal to 50%, whereas in the third case the state the battery charge at home is very low and there is the charge only to arrive at university (limit case):
- In the limit case of the battery charge equal to 0–1%, the students can complete the charging either with 3 kW, if remaining more than 6 h, or with the 7 kW station if remaining between 5 and 6 h. If the remaining time is less than four hours, then the only possibility is the choice of the 22 kW station;
- In case of a SoC = 50%, the charging time is halved. Then, the stations with 3 kW power will be used by all users that will stop for 5 h or more, whereas the 7 kW stations will be chosen by those who will stop from 2 to 4 h Finally, the 22 kW stations will be needed from all those students that will stay less than 2 h;
For an initial SoC equal to 100%, the stations used are only the 3 kW and the 7 kW ones. A statistical analysis was performed by changing the placement of the ten vehicles (three of 3 kW, five of 7 kW and two of 22 kW), thus, modifying the placement of the critical electric load as shown in Figure 10. Different sizing of the distribution electrical system has been carried out. Specifically, the dimensioning was achieved with respect to the maximum drop in voltage (4%) and the overruling of the thermal flow criterion. Voltage drop is evaluated without considering the distributed photovoltaic plant, which can counter the voltage variations.
In case of concentrated recharging stalls, the design of the plant is quite uninfluenced by the different placement of the vehicles. On the contrary, the placement of the 22 kW stations for the distributed recharging layout can significantly affect the sizing of the sections of plant. By positioning the vehicles at different points, the system was sized by maintaining the voltage drop within the limits and by an appropriate choice of line sections.
From the results of the statistical analysis, some useful considerations for choosing between the two proposed layouts can be made. A first remark concerns the type called concentrated stall: the simulated line sections were more uniform and high yields for each line were obtained. On the other hand, since the university is a large area, sometimes a recharging area is far from the classrooms/laboratories, so there is the risk that some stalls will not be used.
On the contrary, a more suitable choice is represented by a distributed recharging area, as it ensures greater coverage. However, for distributed stalls, in order to respect the voltage limit, larger section of lines should be considered.
For simplicity, to determine which stall type is more convenient, their costs can be considered in terms of the volume of copper conductor used, by defining the α coefficient as:
where Vd is the volume of copper for the distributed stall and Vc is the one for concentrated.
By considering different parking stations, the parameter α has shown a range of variation between 2.15 to 3.41. This coefficient represents the difference in the cost by adopting the distributed stall system instead of the concentrated one, since the costs of excavation, maintenance and leakage in operation are related to the copper amount used. A distributed system can be fed by a distributed PV rain corridor system useful for the pedestrians.
5. Facing the Electrical Load
It is evident that the power required by the users for this case of study represents a peak load for the electrical network, which may cause stability problems and consequentially possible interruptions of service. In order to avoid such situations power should be produced on the campus. In this context, the goal is to identify an autonomous and sustainable way of charging. Thus, the energy request from the electrical grid has to be neglected, as well as the use of a diesel generator.
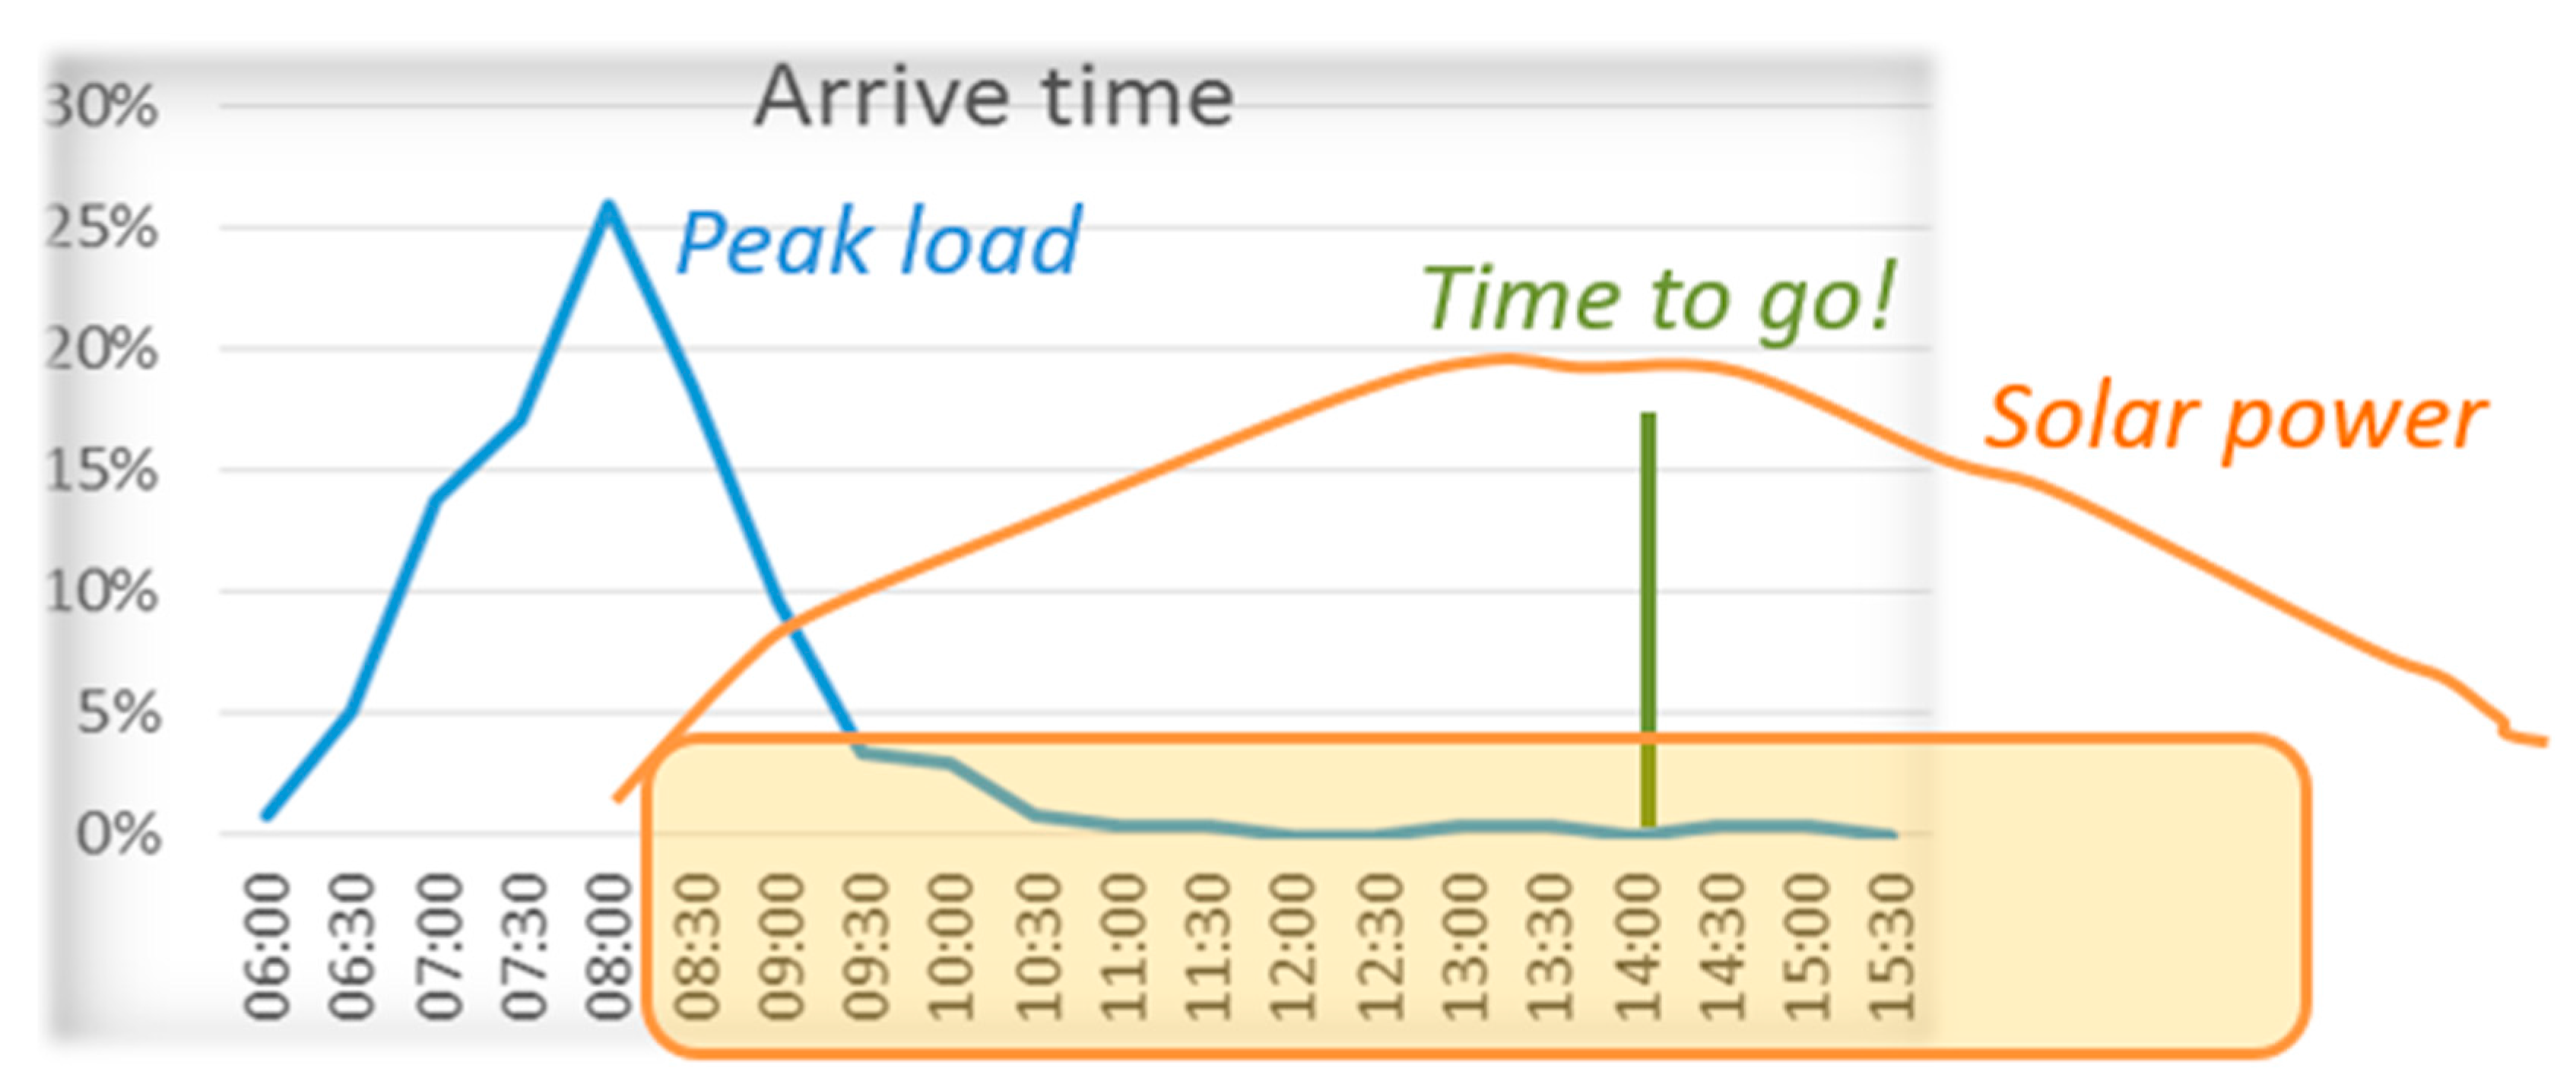
Over the years, photovoltaic energy production has been consolidated. It might be useful to produce the energy needed to recharge the EVs [6,7,8]. The problem is how to correctly size the PV plant. Figure 11 shows the discrepancy between peak power demand (corresponding to the arrival time of the users) and possible temporal production of a photovoltaic plant. If the photovoltaic system is sized to meet the peak demand the plant will be oversized. Scheduling algorithms should be used [20,21,27] but having 6 h for recharging, may be superfluous.
As shown in Figure 10, a group of 10 EVs is considered. To recover the energy spent for reaching university, the 10 EVs will require about 20 kWh of energy (10 × 1.78 kWh, excluding line losses), a quantity that can be guaranteed by a 5 kW plant that works for four equivalent hours. The equivalent hours do not cover the recharge period requested by users. It is therefore necessary, at least, to double the installed power. Exact evaluation of the most suitable size of the PV plant will be the subject of a forthcoming study, and here only the worst case scenario is addressed.
Here, the proposed idea is to guarantee the required power for the 10% of SoC of all EVs in the first hour (leaving the following for the lower SoC) by the use of photovoltaic generators. There is the need to face a power peak in the first hour. Two different techniques can be compared. The first requires the use of a storage system [20,21,22]. The second one is the one presented in [56], the PV power plant layout has been optimized to meet the load requirements. For this purpose, two cases have been considered and compared:
- Case A:
- Panels facing the south direction, maximum power from 12:00 a.m. and storage system to inject energy in the early hours.
- Case B:
- Panels facing the east direction, maximum power between 7:30–9:30 a.m.
Figure 11 shows that the maximum power production of the PV plant is 13.00 to 15:00 (measures taken in May, June and July). The charging period starts on the 8:00 and should be completed by 14:00. A part of energy (20%) can be shifted from the afternoon of the day to the next morning by the use of storage systems.
In order to compare the proposed case solutions, an economic analysis of the Levelized Cost of Energy (LCOE) has to be performed. LCOE is defined as the total lifetime cost of an investment divided by the cumulated generated energy and it can be calculated as [35,57]:
where E0 (kWh/kWp/year) is the energy produced by the PV system in the first year of operation, N is lifespan of the plant, dr the degradation rate of the considered PV modules, FO&MC are the operation and maintenance costs, respectively, CRF the is the Capital Recovery Factor and OCS is the Overnight Capital Cost.
Several factors can influence the LCOE assessment, e.g., the plant size, the exposure and the average daily radiation. In this work, the following values have been considered:
- -
- Yield: 1496 kWh/kWp/year corresponding to a tilt angle of 25° and PV modules oriented in the south direction;
- -
- Lifespan of the plant: 30 years;
- -
- Degradation rate of the PV modules: 0.7%/year;
- -
- Capital Recovery Factor: 6%;
- -
- Operation and Maintenance Costs: 5%;
- -
- Overnight Capital Cost (OCS) of the PV system: 1260.00 €/kWp.
In [35] the LCOE for Sicily, in South Italy, is suggested to be around 71.3 €/MWh. The complete assessment of Case A requires some additional comments: based on the Capital Recovery Factor, it is assumed that a good investment should generate a positive economic flow. Thus, the use of a storage system, capable of storing energy and then releasing it, does not have a unitary yield, and it must be used only when the price of energy changes in an adequate manner: during low-cost energy periods, the energy must be stored, whereas during high-cost energy periods, the energy must be released. Therefore, the economic advantage on the use of storage systems is due to the time varying price of energy [20,21,22].
However, in this case the generation system is mainly disconnected from the grid (the objective of the university is not to sell energy, but feed EVs) and, so, the cost of the energy is only affected by the cost of the plant. In this perspective, the storage system represents a cost, related to 20% of energy that can be transported from one day to the next (losses excluded).
Regarding this aspect, different technologies can be used, each one with its own efficiency: lead-acid (yield 65%, degradation for year 3.7%), lithium-ion (yield 80% with 2.0% of degradation) and fuel cell (yield 70% with 0.1% of degradation) [57]. In [35] the authors state that the LCOE is equal to 338 €/MWh for fuel cells, 1670 €/MWh for lithium ion and 3072 €/MWh for lead acid. Furthermore in [52] it is suggested a LCOE for percentage of energy of the combined PV and storage system equal to 255 €/MWh, which is closer to the one stated in [57] (about 290 €/MWh for solar PV and battery systems in Germany to 2020). The LCOE conversion from the German case to the Italian one is not immediate: although the regions produce a greater amount of energy, the storage system is affected by harsh weather conditions, due to the high temperatures. Therefore, as a precaution, the value obtained for Germany has been considered. By following [57], a storage system for a 100 €/MWh plant in Germany raises the LCOE to 145 €/MWh (Figure 12), whereas in Sicily the LCOE reaches 103 €/MWh.
Case B is solved by means of some experimental measures. The performances of two panels (Conergy, PMMP 215 W, VMPP 28.27 V, IMPP 7.59 A, Voc 36.37, Isc 8.21 A) have been recorded [58]. Figure 13 shows the comparison between the power production of solar panels facing south (blue color) and east (red color). It can be noticed that the power at 7.30–8.30 is more than double for the second case. The same graph shows that the energy produced for Case B is quite similar in comparison with the energy produced in Case A (the areas are quite the same).
For case B, in order to increase the produced power, by changing the exposure of the panels, the LCOE becomes 75.3 €/MWh. This value was obtained by increasing the LCOE according to the factor that takes into account the energy that is lost without using the south exposure, but such energy losses were almost negligible.
This comparison led to a not surprising single result. The LCOE comparison shows the convenience to use a direction system to achieve the maximum power in the early hours of charging, rather than the use of a storage system, which is currently more expensive.
The limits of this result must be discussed. If we consider that in some months of the year, exposure to the east can reduce energy up to 20% (winter), and a very few percentage in the sunny months, an annual weighed reduction of 10% should be considered as worst case. The LCOE, in these conditions, reaches 79 €/MWh, again far from 103 €/MWh.
In any case, due to the reduced availability of solar energy in the winter months, compromised by particular climatic conditions, a small storage facility may be convenient not so much for the reducing the peak in the demand, but to guarantee a reserve of energy, that fills the power interruptions due to clouds.
For the evaluation of the energy transferred to the storage facility, a unitary performance yield was considered, very far from the actual yields, which are an issue limiting diffusion of vehicles with fuel cells [59].
In order to provide information about the size of the PV plant to be used the following reasoning holds: by considering the worst case in which the EVs described in Section 4 arrive with a very low SoC, without a scheduling algorithm, each load would be fed at the moment of arrival, so the power required will be about 88 kW, and this will be the size of the PV plant (Figure 14a). We considered a simple scheduling algorithm with the following constraints:
- -
- Ten loads are used, each represented with its own color;
- -
- Charging time is divided in a time interval of hours (from 8:00 to 14:00);
- -
- Load charging time is randomly placed in the time interval 8:00–14:00;
- -
- -
- Power required by the PV system at time h is the sum of the power of the required in the interval h, Phtot:
The power generation profile of Figure 13 is followed: P1tot ≤ P2tot ≤ P3tot ≤ P4tot ≥ P5tot ≥ P6tot;
For each possible solution the variance:
The minimum of the function ΔP of Equation (14) has been evaluated with a Particle Swarm Optimization (PSO) algorithm. By adopting the scheduling algorithm, a possible time operation is shown in Figure 14b, where the PV plant has a peak power of 44 kW. By considering Conergy panels a 44 kW plant necessitates a surface of 330 m2 with 200 solar panels. Such an area is greater than the one required to cover ten EVs, so in addition to a covered parking lot, a photovoltaic corridor can also be used, as explained in [8].
6. Discussion on CO2 Savings
A discussion of the importance of use a local PV system to feed EVs is also presented. A comparison between the indirect carbon dioxide emissions of an EV and the direct emissions of internal combustion engine is considered. A complete analysis on the well-to-wheels CO2 reduction can be found in [37], but here a simplified one is reported here, by considering the global coefficient of carbon dioxide emissions.
In the European Union the use of battery EVs is strongly encouraged. The idea is to reduce direct emissions of pollutants, but indirect emissions must not be forgotten. The use of EVs requires the production of electricity from the national power plants system, which also produces carbon dioxide emissions.
Each country has an own electric generating system, which affects the production of carbon dioxide (CO2) and other unwanted emissions. Thermal plants employ different types of fuel to boil water until it becomes high-temperature steam. The considered fuels are coal, oil (petroleum) and natural gas, and for the last also different combined cycles can be considered (combined cycle gas turbine CCGT). The generation of electric power can change year by year, and consequently the emissions, but in order to give some references the following coefficients can be used: coal 845 gCO2/kWh, oil 709 gCO2/kWh and gas 381 gCO2/kWh [60]. Such parameters vary during the years they consider the annual performance and the amortization of production of emissions for construction and disposal stage. Hydroelectric power is a clean, renewable form of energy. No carbon dioxide emissions are associated with hydroelectric plants when they are generating electrical energy, but the CO2 involved in constructing hydroelectric plants cannot be neglected and it has to be considered during a plant’s lifetime, so for the carbon emissions a medium coefficient of 24 gCO2/kWh can be used. Similarly, for solar plants and wind plants the following coefficients can be used: 53.3 gCO2/kWh and 6.4 gCO2/kWh [61]. As for the hydroelectric plants no carbon dioxide emissions are associated with the production phase of electric energy, so a medium coefficient of 19.7 gCO2/kWh seems useful to describe the carbon emissions. The national average coefficient is then given by a weighted average of all the coefficients of emissions.
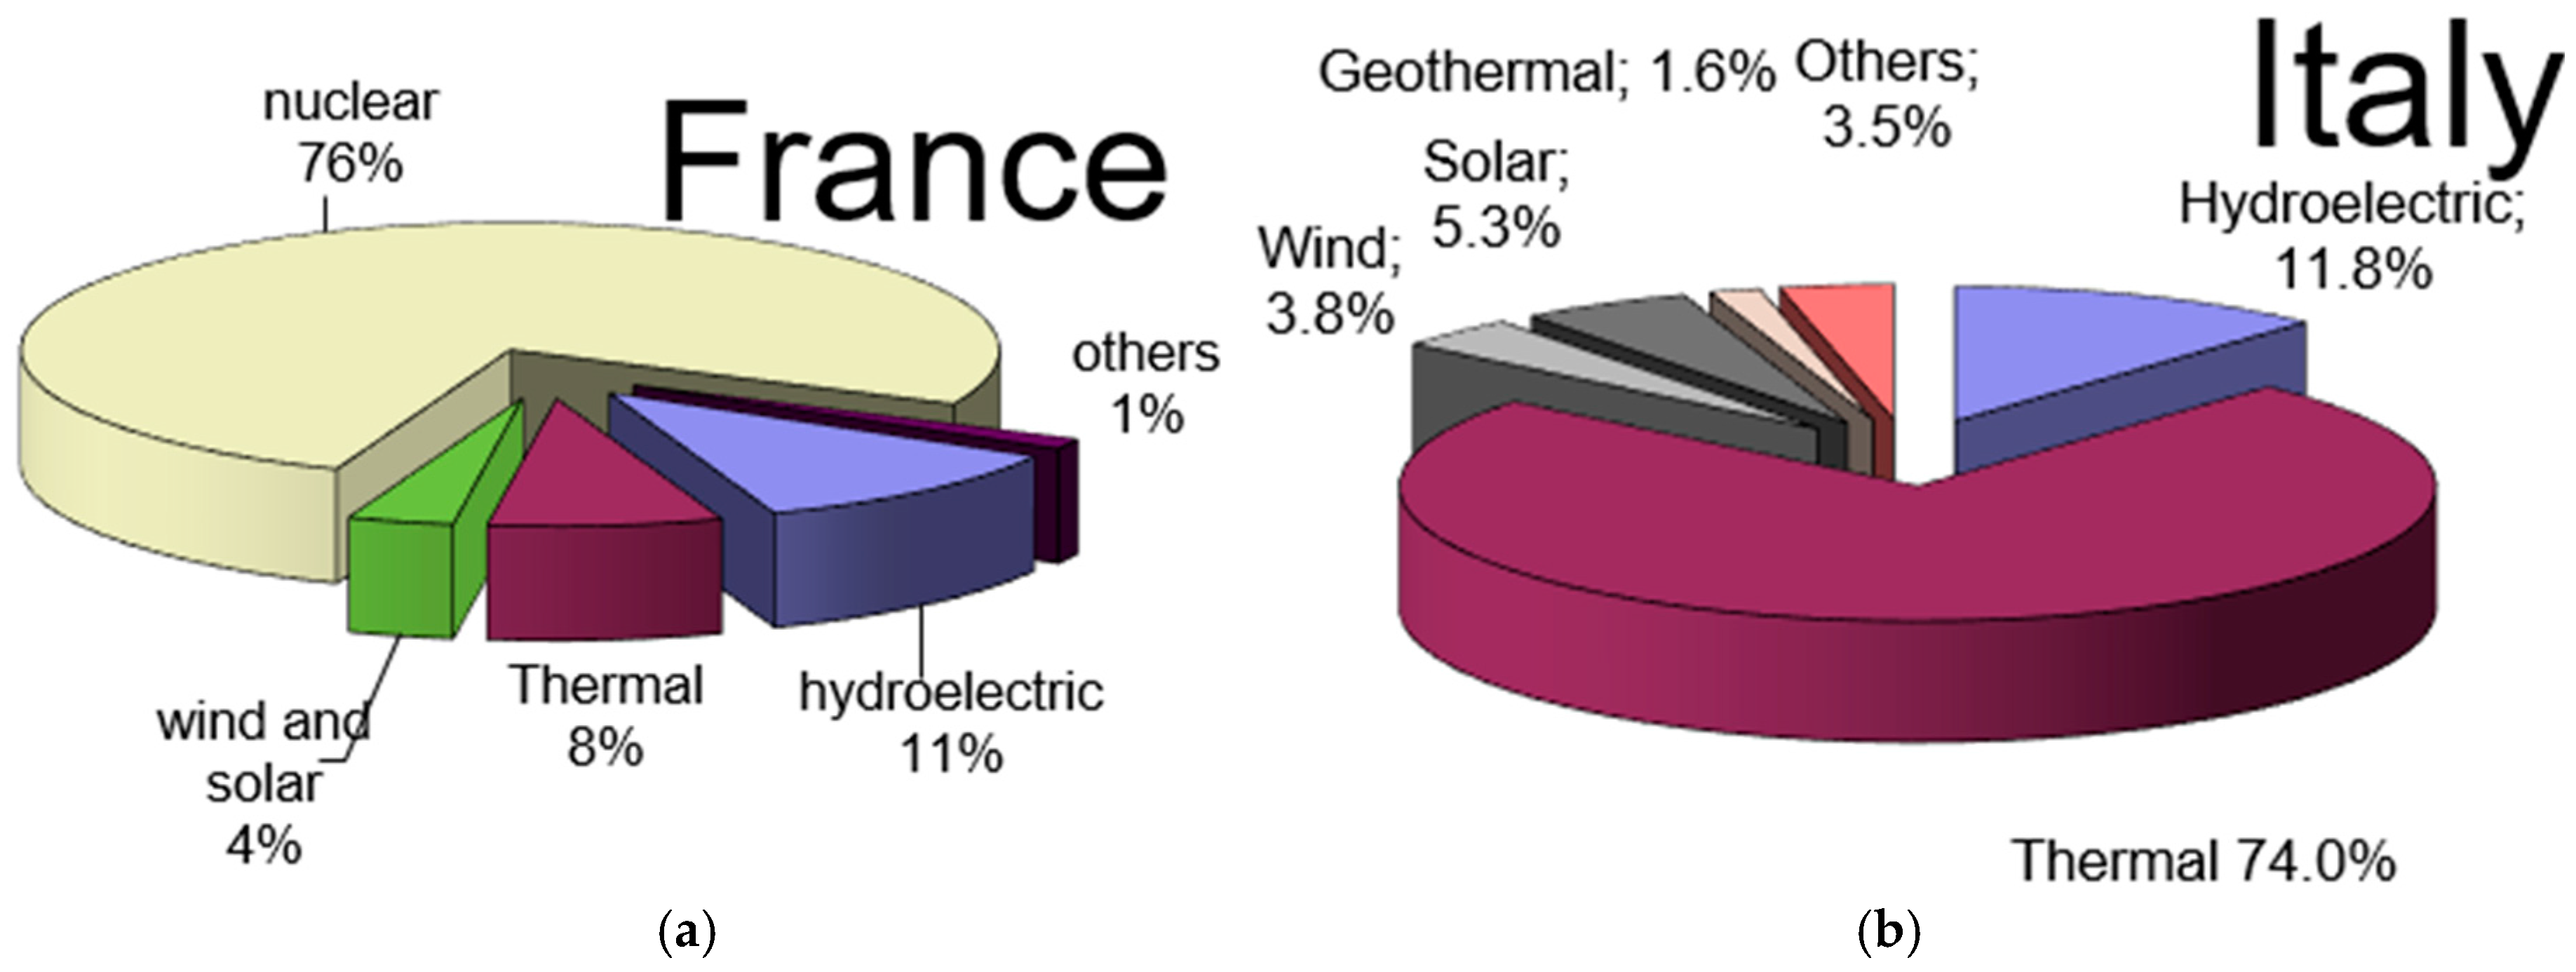
Some countries use predominantly nuclear power plants that produce low carbon dioxide emission values, for example, France has a coefficient of 80 gCO2/kWh, due to the limited use of thermal plants, as shown in Figure 15 [60].
A small size battery EV, similar to a Renault Zoe or Nissan Leaf, can travel 100 km with a variation of State of Charge of 16 kWh. In France, the indirect emissions, related to such a trip reach a value of 12.8 gCO2/km: battery EVs show very good carbon dioxide emission performance.
In Italy the massive presence of traditional thermal power plants in the national production system leads to a coefficient of emission of pollutants of about 400–500 gCO2/kWh, depending on availability of energy in the international market, higher than the one considered for European plants (367 g/kWh) in [62,63] and much closer to the emission coefficient of Japan, 428 g/kWh.
In the worst scenario, by considering the well-to-wheels without infrastructure or materials, a Zoe can have indirect emissions about 80 gCO2/km, very close to the one of a Renault Clio dCI EURO6, 85 gCO2/km.
Such a comparison shows how in the Italian scenario it is necessary to limit the use of grid power and to stimulate local production, but also the need to correctly create incentives and to change the perception that users have about EVs.
Particular focus can be enforced on the local scenario. In Sicily, solar production has great predominance and it would always be encouraged. However, in Sicily as well as the whole of Italy, there is a directive for which renewable energies have precedence over the transmission lines [64]. The effects of this directive, dictated by ecological viewpoints, are not ecological.
Due to a non-perfect high voltage grid [35], bottlenecks are created, and on the high voltage lines during the hours of maximum production can transit or photovoltaic and wind energy or the production of CCGTs.
During the solar energy production peak, the high voltage lines are saturated, and CCGT plants [65] have to reduce the generation of power, working as regulation plants. A reduction of the economic margins of production due to the poor use of the plants, has caused a significant erosion of profitability and yield, thus modifying the CO2 coefficient. A first effect is the increase of the price of the energy in the Sicilian market. A second effect is that the CO2 coefficient is higher than expected, since the gas plants do not perform the combined cycle. In such a way, the use of EV recharging from the power grid during the peak hours seems to be prohibitive.
In authors’ opinion, for the Sicilian scenario, the use of electric power during the daylight has to be encouraged, with a policy that uses local PV generation, and excludes the night recharge.
The motivations are two-fold. First, the low cost of local production of solar energy should efficiently reduce the overall dioxide emissions, without affecting the grid peak. The second one is linked to a new development of the high voltage connection in Sicily, the Terna Sorgente-Rizziconi line, inaugurated on 28 May 2016, using submarine cable carrying an alternating current of 380 kV, with a capacity up to 1110 MW.
Figure 16 shows the trend of the Italian Unity Price (Prezzo Unico Nazionale or PUN) and the cost of energy in Sicily. For the various years historically the official prices of energy in Sicilian marked were greater than the PUN. The entry into operation of the new high voltage line had no immediate effect on the Sicilian electrical market. In the first months after the introduction of the line, the prices at MWh in the Sicilian market were still considerably higher than those of the PUN. This behaviour was not unexpected, and was due to the fact that the new infrastructure needed adjustments and technical interventions. Finally the good effects are manifest [66]. After the end of regulation period on February 2017, the Sicilian cost of energy has become lower than the national one, allowing the possibility of an efficient recharge of EVs also by the power grid.
Therefore, Sicily now is ready to face the EV peak loads by employing the local distributed generation of power, by considering the new trend in cost of energy in the Sicilian market also requiring aliquots to the power grid.
In such a scenario by employing only a local photovoltaic system a Leaf or a Zoe should have a footprint of 8.5 gCO2/km. The same footprint rises to about 9.1 gCO2/km if a small storage system (20% of energy stored) is used, and 9.8 gCO2/km if a large storage system (50% of energy stored) is used. By employing energy from the net, emissions are 18.3 gCO2/km, if using 80% PV and 20%CCGT, and 33.3 gCO2/km if using 50% of PV and 50% of CCGT.
7. Conclusions
The paper deals with the design of a recharge area for electrical vehicles at the main campus of the University of Palermo. The aim was to investigate locally the problem of charging EVs. Different issues are taken into account, with the aim of representing the local situation.
Starting from the results acquired from a large series of interviews with the students, university staff and professors, but also simulating the performance of an EV model during the daily journeys of users, it was possible to assess the whole electrical power profile required for recharging EVs. The electrical load obtained to restore the state of charge variation causes a demand peak in the power grid. Therefore, local energy production is needed to manage this demand peak.
Two systems have been suggested to allow the prompt charging by users and to compensate the variation of state of charge in reaching the university. From the technical and economic comparison of two different systems, it can be stated that the system composed by a directional PV system prevails over one with a storage system. The use of photovoltaic sources has been justified by the overall carbon dioxide emissions produced by EVs in countries like Italy, which have a high carbon dioxide production coefficient for the produced energy. Finally, a discussion on the demand peak is presented to assess the robustness of the power plant and local grid, for which an increase in demand can bring benefits.
Acknowledgments
This work was financially supported by MIUR—Ministero dell’Istruzione dell’Università e della Ricerca (Italian Ministry of Education, University and Research) and by SDESLab (Sustainable Development and Energy Saving Laboratory) and by LEAP (Laboratory of Electrical Applications) of the University of Palermo.
Author Contributions
The authors have contributed equally to this work. The authors of this manuscript jointly have conceived the theoretical analysis, modeling, simulation and obtained the experimental data.
Conflicts of Interest
The authors declare no conflict of interest.
References
- Walker, S.; Hipel, K.W.; Inohara, T. Strategic analysis of the Kyoto protocol. In Proceedings of the IEEE International Systems, Man and Cybernetics (ISIC), Montreal, QC, Canada, 7–10 October 2007; pp. 1806–1811. [Google Scholar] [CrossRef]
- European Union. European Parliament and the EU Council Directive 2009/28/Ce. Available online: https://ec.europa.eu/energy/en/topics/renewable-energy/renewable-energy-directive (accessed on 11 July 2017).
- Jin, C.; Sheng, X.; Ghosh, P. Optimized Electric Vehicle Charging with Intermittent Renewable Energy Sources. IEEE J. Sel. Top. Signal Process. 2014, 8, 1063–1072. [Google Scholar] [CrossRef]
- Zou, H.; Yue, Y.; Li, Q.; Shi, Y. A spatial analysis approach for describing spatial pattern of urban traffic state. In Proceedings of the 13th International IEEE Conference on Intelligent Transportation Systems (ITSC), Funchal, Portugal, 19–22 September 2010; pp. 557–562. [Google Scholar] [CrossRef]
- ACEA Report. Available online: http://www.acea.be/publications (accessed on 11 July 2017).
- Brenna, M.; Dolara, A.; Foiadelli, F.; Leva, S.; Longo, M. Urban Scale Photovoltaic Charging Stations for Electric Vehicles. IEEE Trans. Sustain. Energy 2014, 5, 1234–1241. [Google Scholar] [CrossRef]
- Longo, M.; Zaninelli, D.; Viola, F.; Romano, P.; Miceli, R.; Caruso, M.; Pellitteri, F. Recharge stations: A review. In Proceedings of the 11th International Conference on Ecological Vehicles and Renewable Energies, Monte Carlo, Monaco, 6–8 April 2016. [Google Scholar]
- Ye, B.; Jiang, J.; Miao, L.; Yang, P.; Li, J.; Shen, B. Feasibility Study of a Solar-Powered Electric Vehicle Charging Station Model. Energies 2015, 8, 13265–13283. [Google Scholar] [CrossRef]
- Ma, T.; Yang, H.; Lu, L. A feasibility study of a stand-alone hybrid solar-wind-battery system for a remote island. Appl. Energy 2014, 121, 149–158. [Google Scholar] [CrossRef]
- Fernandez, L.P.; Roman, T.G.S.; Cossent, R.; Domingo, C.M.; Frias, P. Assessment of the impact of plug-inelectric vehicles on distribution networks. IEEE Trans. Power Syst. 2011, 26, 206–213. [Google Scholar] [CrossRef]
- Hilshey, A.D.; Hines, P.D.H.; Rezaei, P.; Dowds, J.R. Estimating the impact of electric vehicle smart charging on distribution transformer aging. IEEE Trans. Smart Grid 2013, 4, 905–913. [Google Scholar] [CrossRef]
- Tulpule, P.J.; Marano, V.; Yurkovich, S.; Rizzoni, G. Economic and environmental impacts of a PV powered workplace parking garage charging station. Appl. Energy 2013, 108, 323–332. [Google Scholar] [CrossRef]
- Xia, M.; Lai, Q.; Zhong, Y.; Li, C.; Chiang, H.-D. Aggregator-Based Interactive Charging Management System for Electric Vehicle Charging. Energies 2016, 9, 159. [Google Scholar] [CrossRef]
- Yao, L.; Damiran, Z.; Lim, W.H. Optimal Charging and Discharging Scheduling for Electric Vehicles in a Parking Station with Photovoltaic System and Energy Storage System. Energies 2017, 10, 550. [Google Scholar] [CrossRef]
- Harris, C.B.; Webber, M.E. An empirically-validated methodology to simulate electricity demand for electric vehicle charging. Appl. Energy 2014, 126, 172–181. [Google Scholar] [CrossRef]
- Melton, N.; Axsen, J.; Goldberg, S. Evaluating plug-in electric vehicle policies in the context of long-term greenhouse gas reduction goals: Comparing 10 Canadian provinces using the “PEV policy report card”. Energy Policy 2017, 107, 381–393. [Google Scholar] [CrossRef]
- Putrus, G.A.; Suwanapingkarl, P.; Johnston, D.; Bentley, E.C.; Narayana, M. Impact of Electric Vehicles on Power Distribution. In Proceedings of the Vehicle Power and Propulsion Conference, Dearborn, MI, USA, 7–10 September 2009. [Google Scholar]
- Albanese, L.; Ciriminna, R.; Meneguzzo, F.; Pagliaro, M. The impact of electric vehicles on the power market. Energy Sci. Eng. 2015, 3, 300–309. [Google Scholar] [CrossRef]
- Prebeg, P.; Gasparovic, G.; Krajacic, G.; Duic, N. Long-term energy planning of Croatian power system using multi-objective optimization with focus on renewable energy and integration of electric vehicles. Appl. Energy 2016, 184, 1493–1507. [Google Scholar] [CrossRef]
- Aziz, M.; Oda, T.; Mitani, T.; Watanabe, Y.; Kashiwagi, T. Utilization of electric vehicles and their used batteries for peak-load shifting. Energies 2015, 8, 3720–3738. [Google Scholar] [CrossRef]
- Ratnam, E.L.; Weller, S.R.; Kellett, C.M. An optimization-based approach to scheduling residential battery storage with solar PV: Assessing customer benefit. Renew. Energy 2015, 75, 123–134. [Google Scholar] [CrossRef]
- Ren, Z.; Grozev, G.; Higgins, A. Modelling impact of PV battery systems on energy consumption and bill savings of Australian houses under alternative tariff structures. Renew. Energy 2016, 89, 317–330. [Google Scholar] [CrossRef]
- Gough, R.; Dickerson, C.E.; Rowley, P.; Walsh, C. Vehicle-to-grid feasibility: A techno-economic analysis of EV-based energy storage. Appl. Energy 2017, 192, 12–23. [Google Scholar] [CrossRef]
- Bishop, J.D.K.; Axon, C.J.; Bonilla, D.; Tran, M.; Banister, D.; McCulloch, M.D. Evaluating the impact of V2G services on the degradation of batteries in PHEV and EV. Appl. Energy 2013, 111, 206–218. [Google Scholar] [CrossRef]
- Ul-Haq, A.; Cecati, C.; Al-Ammar, E.A. Modeling of a Photovoltaic-Powered Electric Vehicle Charging Station with Vehicle-to-Grid Implementation. Energies 2017, 10, 4. [Google Scholar] [CrossRef]
- Chokkalingam, B.; Padmanaban, S.; Siano, P.; Krishnamoorthy, R.; Selvaraj, R. Real-time forecasting of EV charging station scheduling for smart energy systems. Energies 2017, 10, 377. [Google Scholar] [CrossRef]
- Mukherjee, J.C.; Gupta, A. A review of charge scheduling of electric vehicles in smart grid. IEEE Syst. J. 2014, 9, 1541–1553. [Google Scholar] [CrossRef]
- Tie, S.F.; Tan, C.W. A review of energy sources and energy management system in electric vehicles. Renew. Sustain. Energy Rev. 2013, 20, 82–102. [Google Scholar] [CrossRef]
- Mazur, C.; Contestabile, M.; Offer, G.J.; Brandon, N.P. Assessing and comparing German and UK transition policies for electric mobility. Environ. Innov. Soc. Trans. 2015, 14, 84–100. [Google Scholar] [CrossRef]
- Climate Change Act 2008, Queen’s Printer of Acts of Parliament. Available online: http://www.legislation.gov.uk/ (accessed on 11 July 2017).
- Nationaler Entwicklungsplan Elektromobilität der Bundesregierung. August 2009. Available online: https://www.bmvi.de/SharedDocs/DE/Artikel/G/elektromobilitaet-nationaler-entwicklungsplan.html (accessed on 10 October 2017).
- Heidrich, O.; Hill, G.A.; Neaimeh, M.; Huebner, Y.; Blythe, P.T.; Dawson, R.J. How do cities support electric vehicles and what difference does it make? Technol. Forecast. Soc. Chang. 2017. [Google Scholar] [CrossRef]
- Piano Nazionale Infrastrutturale per la Ricarica dei Veicoli Alimentati ad Energia Elettrica. Available online: http://www.mit.gov.it/mit/mop_all.php?p_id=14588 (accessed on 11 July 2017).
- Viola, F.; Longo, M. On The Strategies for the Diffusion of EVs: Comparison between Norway and Italy. Int. J. Renew. Energy Res. 2017, 7, 1376–1382. [Google Scholar]
- Pavan, A.M.; Sulligoi, G.; Lughi, V.; Pauli, F.; Miceli, R.; Di Dio, V.; Viola, F. Leading the way toward fuel parity in photovoltaics: The utility-scale market in Sicily, Italy. In Proceedings of the International Conference on Environment and Electrical Engineering, Florence, Italy, 7–10 June 2016. [Google Scholar]
- Liu, K.; Wang, J.; Yamamoto, T.; Morikawa, T. Modelling the multilevel structure and mixed effects of the factors influencing the energy consumption of electric vehicles. Appl. Energy 2016, 183, 1351–1360. [Google Scholar] [CrossRef]
- Ke, W.; Zhang, S.; He, X.; Wu, Y.; Hao, J. Well-to-wheels energy consumption and emissions of electric vehicles: Mid-term implications from real-world features and air pollution control progress. Appl. Energy 2017, 188, 367–377. [Google Scholar] [CrossRef]
- Razeghi, G.; Samuelsen, S. Impacts of plug-in electric vehicles in a balancing area. Appl. Energy 2016, 183, 1142–1156. [Google Scholar] [CrossRef]
- Donateo, T.; Licci, F.; D’Elia, A.; Colangelo, G.; Laforgia, D.; Ciancarelli, F. Evaluation of emissions of CO2 and air pollutants from electric vehicles in Italian cities. Appl. Energy 2015, 157, 675–687. [Google Scholar] [CrossRef]
- Du, J.; Ouyang, D. Progress of Chinese electric vehicles industrialization in 2015: A review. Appl. Energy 2017, 188, 529–546. [Google Scholar] [CrossRef]
- Nie, Y.; Ghamami, M.; Zockaie, A.; Xiao, F. Optimization of incentive polices for plug-in electric vehicles. Transp. Res. Part B 2016, 84, 103–123. [Google Scholar] [CrossRef]
- Moon, S.-K.; Kim, I.-O. Balanced charging strategies for electric vehicles on power systems. Appl. Energy 2017, 189, 44–54. [Google Scholar] [CrossRef]
- Zhao, J.; Kucuksari, S.; Mazhari, E.; Son, Y.-J. Integrated analysis of high-penetration PV and PHEV with energy storage and demand response. Appl. Energy 2013, 112, 35–51. [Google Scholar] [CrossRef]
- Riesz, J.; Sotiriadis, C.; Ambach, D.; Donovan, S. Quantifying the costs of a rapid transition to electric vehicles. Appl. Energy 2016, 180, 287–300. [Google Scholar] [CrossRef]
- Rohr, S.; Wagner, S.; Baumann, M.; Müller, S.; Lienkamp, M. A techno-economic analysis of end of life value chains for lithium-ion batteries from electric vehicles. In Proceedings of the 2017 Twelfth International Conference on Ecological Vehicles and Renewable Energies (EVER), Monte Carlo, Monaco, 11–13 April 2017. [Google Scholar]
- Mundada, A.S.; Shah, K.K.; Pearce, J.M. Levelized cost of electricity for solar photovoltaic, battery and cogen hybrid systems. Renew. Sustain. Energy Rev. 2016, 57, 692–703. [Google Scholar] [CrossRef]
- International Renewable Energy Agency Irena. Battery Storage for Renewables: Market Status and Technology Outlook; International Renewable Energy Agency Irena: Abu Dhabi, UAE, 2015. [Google Scholar]
- Jian, L.; Zheng, Y.; Shao, Z. High efficient valley-filling strategy for centralized coordinated charging of large-scale electric vehicles. Appl. Energy 2017, 186, 46–55. [Google Scholar] [CrossRef]
- Citroen C-Zero. Available online: http://info.citroen.co.uk/Assets/pdf/new-cars/c-zero/brochure.pdf (accessed on 11 July 2017).
- Larminie, J.; Lowry, J. Electric Vehicle Technology Explained; Oxford Brookes University: Oxford, UK, 2012. [Google Scholar]
- Vehicle and Fuel Emissions Testing: Dynamometer Drive Schedules. Available online: https://www.epa.gov/vehicle-and-fuel-emissions-testing/dynamometer-drive-schedules (accessed on 11 July 2017).
- Chen, Z.; Xiong, R.; Wang, C.; Cao, J. An on-line predictive energy management strategy for plug-in hybrid electric vehicles to counter the uncertain prediction of the driving cycle. Appl. Energy 2017, 185, 1663–1672. [Google Scholar] [CrossRef]
- Zhang, S.; Xiong, R.; Sun, F. Model predictive control for power management in a plug-in hybrid electric vehicle with a hybrid energy storage system. Appl. Energy 2017, 185, 1654–1662. [Google Scholar] [CrossRef]
- Brady, J.; O’Mahony, M. Development of a driving cycle to evaluate the energy economy of electric vehicles in urban areas. Appl. Energy 2016, 177, 165–178. [Google Scholar] [CrossRef]
- Baccouche, I.; Mlayah, A.; Jemmali, S.; Manai, B.; Amara, N.E.B. Implementation of a Coulomb counting algorithm for SOC estimation of Li-Ion battery for multimedia applications. In Proceedings of the 12th International Multi-Conference on Systems, Signals & Devices, Mahdia, Tunisia, 16–19 March 2015. [Google Scholar]
- Krauter, S. Effective large-scale PV integration: Methods to match load profile with actual PV output. In Proceedings of the IEEE 42nd Photovoltaic Specialist Conference (PVSC), New Orleans, LA, USA, 14–19 June 2015; pp. 1–5. [Google Scholar]
- Pawel, I. The cost of storage—How to calculate the levelized cost of stored energy (LCOE) and applications to renewable energy generation. In Proceedings of the 8th International Renewable Energy Storage Conference and Exhibition, Berlin, Germany, 18–20 November 2013. [Google Scholar]
- Viola, F.; Romano, P.; Miceli, R.; Spataro, C.; Schettino, G. Technical and Economical Evaluation on the Use of Reconfiguration Systems in Some EU Countries for PV Plants. IEEE Trans. Ind. Appl. 2017, 53, 1308–1315. [Google Scholar] [CrossRef]
- Zhang, L.; Yu, J.; Ren, J.; Ma, L.; Zhang, W.; Liang, H. How can fuel cell vehicles bring a bright future for this dragon? Answer by multi-criteria decision making analysis. Int. J. Hydrog. Energy 2016, 41, 17183–17192. [Google Scholar] [CrossRef]
- Viola, F.; Romano, P.; Miceli, R.; La Cascia, D.; Longo, M.; Sauba, G. Economical evaluation of ecological benefits of the demand side management. In Proceedings of the 3rd International Conference on Renewable Energy Research and Applications, Milwaukee, WI, USA, 19–22 October 2014; pp. 995–1000. [Google Scholar]
- Fontaínhas, J.; Cunha, J.; Ferreira, P. Is investing in an electric car worthwhile from a consumers’ perspective? Energy 2016, 115, 1459–1477. [Google Scholar] [CrossRef]
- Silva, C.; Ross, M.; Farias, T. Evaluation of energy consumption, emissions and cost of plug-in hybrid vehicles. Energy Convers. Manag. 2009, 50, 1635–1643. [Google Scholar] [CrossRef]
- Miceli, R. Energy management and smart grids. Energies 2013, 6, 2262–2290. [Google Scholar] [CrossRef] [Green Version]
- Decreto Legislativo 29 Dicembre 2003, n. 387 Attuazione Della Direttiva 2001/77/CE Relativa alla Promozione Dell’energia Elettrica Prodotta da Fonti Energetiche Rinnovabili nel Mercato Interno Dell’elettricità. Available online: http://gazzette.comune.jesi.an.it/2004/25/2.htm (accessed on 11 July 2017).
- Adams, T.; Dowell, N.M. Off-design point modelling of a 420 MW CCGT power plant integrated with an amine-based post-combustion CO2 capture and compression process. Appl. Energy 2016, 178, 681–702. [Google Scholar] [CrossRef]
- Gestore mercati energetici (GME), Esiti Mercato Elettrico. Available online: http://www.mercatoelettrico.org (accessed on 11 July 2017).
Figure 1.
How students reach the University.

Figure 2.
Arrival time at the campus. Between 7:00 and 9:00 85% of the arrival occurs. The mean value is 8:10.
Figure 2.
Arrival time at the campus. Between 7:00 and 9:00 85% of the arrival occurs. The mean value is 8:10.

Figure 3.
Remaining time at the campus. Mean value is 5 h and 48 min.

Figure 4.
Travel time. The mean user arrives before 20 min.

Figure 5.
Traveled distance. The mean distance is 6 km.

Figure 6.
Interest in changing the vehicle to an eco-friendly one. One third of the students will be interested in changing their vehicle for an EV.
Figure 6.
Interest in changing the vehicle to an eco-friendly one. One third of the students will be interested in changing their vehicle for an EV.

Figure 7.
Forces operating on the EV: aerodynamic drag, rolling resistance, hill climbing and the traction effort.
Figure 7.
Forces operating on the EV: aerodynamic drag, rolling resistance, hill climbing and the traction effort.

Figure 8.
Simplified Federal Urban Driving Schedule cycle.

Figure 9.
Possible routes of the students. The routes have been travelled with on board an android device logging position, velocity and acceleration.
Figure 9.
Possible routes of the students. The routes have been travelled with on board an android device logging position, velocity and acceleration.

Figure 10.
Possible placement of EVs. The first scheme involves a concentrated stall, all vehicles are located close to each other. The second scheme provides that vehicles are located along the avenue of the university. By changing the position of critical loads different sections of the power plant have been obtained.

Figure 11.
Discrepancy between demand for electricity, parking of vehicles and solar production.

Figure 12.
LCOE of the combined power plant (PV and storage) for different ratios of storage. For a storage system of 20% the LCOE reaches 0.103 €/kWh.
Figure 12.
LCOE of the combined power plant (PV and storage) for different ratios of storage. For a storage system of 20% the LCOE reaches 0.103 €/kWh.

Figure 13.
Power generated by panels facing east (red) and south (blue) direction.

Figure 14.
Power required by the PV plant without scheduling (a), a peak of 88 kW is required at 8 a.m. Power required by PV plant with scheduling (b), a peak about 44 kW is required between 11:00–13:00 when the PV plant is at its maximum production.
Figure 14.
Power required by the PV plant without scheduling (a), a peak of 88 kW is required at 8 a.m. Power required by PV plant with scheduling (b), a peak about 44 kW is required between 11:00–13:00 when the PV plant is at its maximum production.

Figure 15.
Power production by different sources for (a) France and (b) Italy in 2014 [60].
Figure 15.
Power production by different sources for (a) France and (b) Italy in 2014 [60].

Figure 16.
Cost of energy in Italy (PUN) and Sicily in 2017 [66].
Figure 16.
Cost of energy in Italy (PUN) and Sicily in 2017 [66].


Table 1.
Main characteristics of the EV used as model [49].
Table 1.
Main characteristics of the EV used as model [49].
| Parameter | Value |
|---|---|
| Mass in running order M (kg) | 1120 |
| Length (m) | 3.474 |
| Width (m) | 1.475 |
| Height (m) | 1.61 |
| front surface S (m2) | 2 |
| drag coefficient Cd | 0.19 |
| Rolling friction coefficient µrr | 0.009 |
| energy storage capacity Cn (Ah) | 50 |
| Rated voltage (V) | 330 |
Table 2.
Distance and variation of SoC.
| Distance (km) | Δt (h) | ΔSoC (%) (SFUDS) | ΔSoC (%) (Acquired) |
|---|---|---|---|
| 3.5 | 0.16 | 5.4 | 5.2 |
| 5.9 | 0.27 | 10.5 | 10.7 |
| 10.1 | 0.47 | 18.1 | 17.6 |
| 14.1 | 0.65 | 25.0 | 24.5 |
Table 3.
Average student profile.
| Distance (km) | Δt (h) | ΔSoC (%) (SFUDS) | ΔSoC (%) (Acquired) | ΔSoC (%) |
|---|---|---|---|---|
| 6.0 | 0.29 | 10.5 | 10.7 | 11 |
Table 4.
Charging time.
| Initial SoC (%) | Final SoC (%) | ΔEnergy (kWh) | Δt 3.0 kW (h) | Δt 7.0 kW (h) | Δt 22 kW (h) |
|---|---|---|---|---|---|
| 100 | 89 | 1.78 | 0.60 | 0.27 | 0.08 |
| 50 | 39 | 12.2 | 4.0 | 1.74 | 0.55 |
| 12 | 1 | 19.8 | 6.6 | 2.83 | 0.9 |
© 2017 by the authors. Licensee MDPI, Basel, Switzerland. This article is an open access article distributed under the terms and conditions of the Creative Commons Attribution (CC BY) license (http://creativecommons.org/licenses/by/4.0/).
Share and Cite
MDPI and ACS Style
Miceli, R.; Viola, F. Designing a Sustainable University Recharge Area for Electric Vehicles: Technical and Economic Analysis. Energies 2017, 10, 1604. https://doi.org/10.3390/en10101604
AMA Style
Miceli R, Viola F. Designing a Sustainable University Recharge Area for Electric Vehicles: Technical and Economic Analysis. Energies. 2017; 10(10):1604. https://doi.org/10.3390/en10101604
Chicago/Turabian StyleMiceli, Rosario, and Fabio Viola. 2017. "Designing a Sustainable University Recharge Area for Electric Vehicles: Technical and Economic Analysis" Energies 10, no. 10: 1604. https://doi.org/10.3390/en10101604
Note that from the first issue of 2016, this journal uses article numbers instead of page numbers. See further details here.