Article

Aggregation Potentials for Buildings—Business Models of Demand Response and Virtual Power Plants

by
Zheng Ma
*,
Joy Dalmacio Billanes
and
Bo Nørregaard Jørgensen
Center for Energy Informatics, Mærsk Mc-Kinney Møller Institute, University of Southern Denmark, Campusvej 55, 5230 Odense M, Denmark
*
Author to whom correspondence should be addressed.
Energies 2017, 10(10), 1646; https://doi.org/10.3390/en10101646
Submission received: 13 August 2017 / Revised: 15 October 2017 / Accepted: 16 October 2017 / Published: 20 October 2017
(This article belongs to the Special Issue Distributed Energy Resources Management)

Abstract

:
Buildings as prosumers have an important role in the energy aggregation market due to their potential flexible energy consumption and distributed energy resources. However, energy flexibility provided by buildings can be very complex and depend on many factors. The immaturity of the current aggregation market with unclear incentives is still a challenge for buildings to participate in the aggregation market. However, few studies have investigated business models for building participation in the aggregation market. Therefore, this paper develops four business models for buildings to participate in the energy aggregation market: (1) buildings participate in the implicit Demand Response (DR) program via retailers; (2) buildings with small energy consumption participate in the explicit DR via aggregators; (3) buildings directly access the explicit DR program; (4) buildings access energy market via Virtual Power Plant (VPP) aggregators by providing Distributed Energy Resources (DER)s. This paper also determines that it is essential to understand building owners’ needs, comforts, and behaviours to develop feasible market access strategies for different types of buildings. Meanwhile, the incentive programs, national regulations and energy market structures strongly influence buildings’ participation in the aggregation market. Under the current Nordic market regulation, business model one is the most feasible one, and business model two faces more challenges due to regulation barriers and limited monetary incentives.

1. Introduction

Energy stability and flexibility are essential for the entire power system [1]. Flexibility is the ability of electricity systems to maintain the balance between energy supply and demand [2]. Flexibility addresses generation-load imbalance, reduces peak load, power outage, electricity cost, and improves grid reliability [3].
Energy aggregation provides an efficient solution for providing flexibility in power systems. Two models have been discussed broadly that can provide aggregation potentials in the electricity system: Demand Response (DR) and Virtual Power Plants (VPPs). Various stakeholders in the electricity market can participate in the energy aggregation market with new roles or new presence. For instance, consumers convert to prosumers, and new market players such as service aggregators appear.
Buildings as prosumers have an important role in the energy aggregation market due to their potential flexible energy consumption and distributed energy resources [4]. However, energy flexibility provided by buildings can be very complex, and depends on many factors. Meanwhile, different types of buildings can provide different energy flexibilities [5]. Energy flexibility programs that buildings can participate in are defined by regulations and policies. The immaturity of the current aggregation market with unclear incentives is still a challenge for buildings (especially with small energy consumption) to participate in the aggregation market. Various energy flexibility programs also impede buildings’ motivation. So far, only a few studies have investigated business models for buildings’ participation in the aggregation market.
To fill this gap, this paper aims to (1) understand two existing business models in the energy aggregation market (DR and VPPs) including market players and their relationships; (2) evaluate building energy aggregation potentials; and (3) develop business models for different types of buildings to participate in the energy aggregation market.
This paper is organized as: Section 2 discusses two aggregation models (DR and VPPs), stakeholders and their relationships in DR and VPPs. Section 3 presents three types of buildings and their energy flexibility resources. Section 4 introduces methods applied in this paper including a business model canvas, an evaluation tool for business model analysis, Strengths, Weaknesses, Opportunities, and Threats (SWOT) analysis, and TOWS analysis (a derivative of SWOT analysis). Section 5 presents four business models for buildings to participate in the energy aggregation market. Section 6 use the Nordic electricity market as a case study to discuss potentials and challenges that affect buildings’ participation in the four business models, and provide suggestions. Section 7 provides conclusion and further research.

2. Aggregation Models

Two aggregation models broadly discussed in practice that can provide flexibility in the electricity system are Demand Response (DR) and Virtual Power Plants (VPPs).

2.1. Demand Response (DR)

DR is defined by the European Commission as “voluntary changes by end-consumers of their usual electricity use patterns—in response to market signals” [6]. It is a shift of electricity usage in response to price signals or certain requests [7]. DR reduces peak load, electricity cost, and improves system reliability [8]. Electricity consumers can participate in energy-load balance through DR [9]. Controllable appliances in buildings that contribute to DR include commercial buildings like (heating, ventilation and air-conditioning) HVAC systems, home appliances (e.g., dishwashers, dryers, and freezers) [10], energy storage (e.g., batteries of electric vehicles, heat pumps, and refrigeration) [11], and industrial processes (e.g., roller press) [12].

DR Programs

There are two types of DR programs: explicit and implicit demand response. The two types of DR programs are activated at different times and serve different purposes in markets. Consumers can participate in both programs. Consumers typically receive a lower bill by participating in a dynamic pricing program (implicit DR), and receive a direct payment for participating in an explicit demand response program [13].
Explicit DR (also called incentive-based DR program) is divided into traditional-based (e.g., direct load control, interruptible pricing) and market-based (e.g., emergency demand response programs, capacity market programs, demand bidding programs, and ancillary services market programs) [14].
In explicit DR, demand competes directly with supply in wholesale, balancing, and ancillary services markets through services by aggregators or as single large consumers. Load requirements (size of energy consumption) need to comply to participate in DR programs [15]. Therefore, small consumers only can participate by contracting with DR service providers. DR service providers can either be third-party aggregators or customer retailers. Through incentive-based programs, consumers receive direct payments to change their electricity consumption upon request (e.g., to consume more or less) [15].
Explicit DR is more flexible in terms of helping DR service providers acquire DR resources [16]. Direct load control enables DR service providers to control appliances within a short notice [15]. Explicit DR provides a valuable and reliable operational tool for system operators to adjust load to resolve operational issues [13].
On the other hand, implicit DR (sometimes called price-based DR program) refers to the voluntary program in which consumers are exposed to time-varying electricity prices or time-varying network tariffs (such as a day/night tariff) [15]. Compared to explicit DR with direct load control, implicit DR provides less flexibility from the perspective of energy suppliers [16]. Price-based programs depend on the cost of electricity production at different times, and on consumers’ own preferences and constraints [15]. In some Nordic countries, customers have opportunities to participate in priced-based programs (e.g., time-of-use (TOU), critical peak pricing, and real-time pricing) [15]. For instance, in real-time pricing, consumers reduce electricity usage at peak periods or shift their usage to off-peak periods [9]. These prices are always part of their supply contract [13].
Market players in DR markets can include producers, grid operators (Transmission System Operators (TSOs), Distribution System Operations (DSOs)), retailers, aggregators, Balance Response Parties (BRPs), policymakers, and consumers (building owners and occupants). New actors (e.g., aggregators) and new roles (e.g., retailers’ aggregation service) appear in the energy market. The main relationships between actors in the DR market are shown Table 1.

2.2. Virtual Power Plants

Virtual Power Plants (VPPs) aggregate DER units and offer them to the energy market [17]. The aggregated DERs maintain reliability of renewable energy resources [18] and address grid congestion [19]. VPPs can be managed by third-party aggregators, BRPs, or suppliers [20,21]. VPPs provide a variety of services to power plant operators, industries, public services, energy suppliers, and grid operators. VPPs create new business opportunities for aggregators and suppliers [21]. In Denmark, DONG Energy implements VPPs known as the Power Hub that integrates DR with large industrial companies to balance the power systems [22].
VPPs are aggregated DERs forming a Local Virtual Plant (LVPP). Then the aggregated LVPPs form a Regional Virtual Plant (RVPP) [22]. LVPPs provide various opportunities to stakeholders, such as energy trade, network services, and balancing services [21,22]. VPPs focus on the physical aspect of DERs and their impact on the electrical system [20]. Meanwhile, VPP units at different locations [19] are coordinated using networking infrastructure [23].

2.2.1. Components of VPPs

A VPP is comprised of generation units [24], energy storage, and Information Communication Technology (ICT) [21]. Generation technology in VPPs consists of DER portfolios (supply-side and demand response) [24]. Supply-side in DER portfolios are Distributed Generation (DG) units [24], such as Combined Heat and Power (CHP), biomass and biogas, small power plants, solar, and wind generation [21]. DR in DER portfolios consists of flexible loads and energy storage [24]. Flexible loads refer to loads or consumption patterns shifted in response to price signals (e.g., heating, cooling, and charging of electrical vehicles) [18]. VPPs require energy storage to store energy such as Hydraulic Pumped Energy Storage (HPES), Compressed Air Energy Storage (CAES), Flywheel Energy Storage (FES), Superconducting Magnetic Energy Storage (SMES), Battery Energy Storage System (BESS), and electric vehicles [18]. VPPs are coordinated through ICT systems that help to reduce transmission system losses, relieve congestions, and provide grid stability [25]. This ICT infrastructure includes Energy Management Systems (EMS), and Supervisory Control and Data Acquisition (SCADA) systems. VPPs can monitor energy flows of DERs, storage facilities, and controllable loads [10].

2.2.2. Systems-of-Interests in Virtual Power Plants

The operation of VPP systems serves trade, balancing, and network support according to the Systems-of-Interests (SoI):
(1) Virtual Power Plants for Trade
VPP systems provide energy trade opportunities to VPP owners. VVPs optimize and aggregate DERs’ capacity (DG units and DR) and provide DERs with visibility and market access [18,21]. VPP owners submit bids and optimize DERs’ revenue in the wholesale market [26].
The DER owners can receive more benefits by collectively participating in wholesale energy markets compared to participating individually. Moreover, volume threshold for power producers may prevent small DER owners to trade their energy individually [22]. Practically, both DER owners and participants in demand side response are represented by RVPP operators as a single entity in the wholesale market [22].
(2) Virtual Power Plants for Balancing
VPPs can participate in the energy balancing market by employing available DER units, storage devices, and controllable loads [22]. The balancing market is the regulating market in the Nord Pool market structure. BRPs might be particularly interested in this VPP operation, due to imbalance responsibilities.
VPPs can contribute short, medium, and long term balancing of energy flow by the operations of virtual synchronous generators and demand side management. The duration of primary control is presented in seconds, and VPPs can contribute with fast power response obtained from rotating (synchronous) generators, super capacitors, and fast batteries [22]. VPPs can also contribute to secondary control by (1) increasing the generation of reserve DER units (e.g., micro-CHP) for a period of minutes; and (2) decreasing the demand through employment of controllable loads for a few hours until top-down power supply is recovered [22].
(3) Virtual Power Plants for Network Services
Due to the increase of load or generation, network operators need to either expand network capacity or prevent overload or congestion [22]. VPPs can provide grid services to TSOs/DSOs to support load and congestion management and improve power quality [24]. VPPs can also provide services to DSOs’ local system management [21]. In addition, VPPs provide system services (e.g., black start, voltage control) to TSOs [24].

2.2.3. The VPP Stakeholders

The main actors in VPPs are VPP aggregators. Third-party aggregators manage VPPs [20], aggregate DERs, storages and adjustable loads [15] and offer them to different market participants (e.g., TSOs, BRPs) [27]. There are large and small (e.g., DERs, prosumers) energy producers. DERs are small energy generators located in low-voltage grid expecting high return of investment [22]. Energy consumers can provide adjustable loads, DERs, or storages to VPP aggregators based on their energy flexibility resources. BRPs can also play a role of an aggregator. For example, NEAS Energy, an independent BRP, acts as an aggregator by aggregating various generation units (e.g., CHP, wind, hydro, solar) in Denmark [28]. The main relationship between actors in the VPP aggregation market is shown Table 2.

3. Buildings and Energy Flexibility

Buildings are responsible for a large percentage of the global energy consumption (e.g., about 45% energy consumption in Denmark is from buildings, shown in Figure 1) and are therefore good candidates for providing energy aggregation potentials to the grid. Buildings can participate in the energy aggregation market via different channels. Meanwhile, energy consumption may vary between residential, commercial, and industrial buildings due to differences in building features.
Residential buildings are defined as small electricity consumers due to their numerosity [31]. In Europe, residential buildings constitute 75% of the total number of buildings and 16% are high-rise buildings constructed within the period of 1960–1980 [32]. A majority of residential buildings consist of standard building technologies such as heating, hot water, cooling, ventilation, and lighting. However, residential building appliances’ differ between each other. Common, potentially controllable appliances in residential buildings are dishwashers, washing machines, clothes dryers, freezers and refrigerators, heat pumps, and electric vehicles. The consumptions of appliances are different. For instance, statistics (shown in Figure 2) show the energy consumption by appliances in residential buildings in North America.
Residential buildings can provide energy flexibility. Flexibility potentials by home appliances vary. For instance, freezers and refrigerators provide less flexibility because more than 30 min interruption to freezer or refrigerator operation may cause spoilage [33]. Compared to other appliances, heating and ventilation provide more flexibility by shifting the temperature, especially during the day when households are empty [31].
Commercial buildings include hospitals, hotels, stores, and offices. An example of the energy consumption by appliances in commercial building is shown in Figure 3. Some commercial buildings are more reluctant to participate to DR (e.g., reschedule their usage of power) due to the effect on their business routines and profits [35]. For instance, hotels and hospitals operate 24/7, and are reluctant to shift their usage of power due to consideration of their profits or occupants’ comfort. Small or medium size commercial buildings (e.g., stores, offices) might participate in direct load control programs, while hospitals, hotels, and other large commercial buildings can participate in more interruptible programs.
Industries are usually large energy consumers. There are different types of industries engaging in different processes (e.g., steel, textile, food industries) and technologies [12]. Industrial buildings are often equipped with wind turbines or CHP to generate their own electricity. The energy flexibility potentials differ from one industry to another (e.g., Table 3 shows potentials for load flexibility of different processes in agriculture and industry in Denmark). For instance, refrigeration companies have particularly high load shift potentials with duration of several hours, and there are several approaches to obtain energy flexibility from refrigerators/freezers [37]. As with some commercial buildings that have large energy consumption rates, industrial buildings usually are reluctant to reschedule their usage of power considering their big profits [35].

4. Methods

This paper applies three analysis methods to review and evaluate aggregation potentials for buildings. The method of ‘business model canvas’ is adopted to describe potential scenarios that buildings can participate in energy aggregation markets with different values and channels. SWOT and TOWS analyses aim to evaluate feasibility and barriers of different business models in the current situation and in future trends of energy systems.

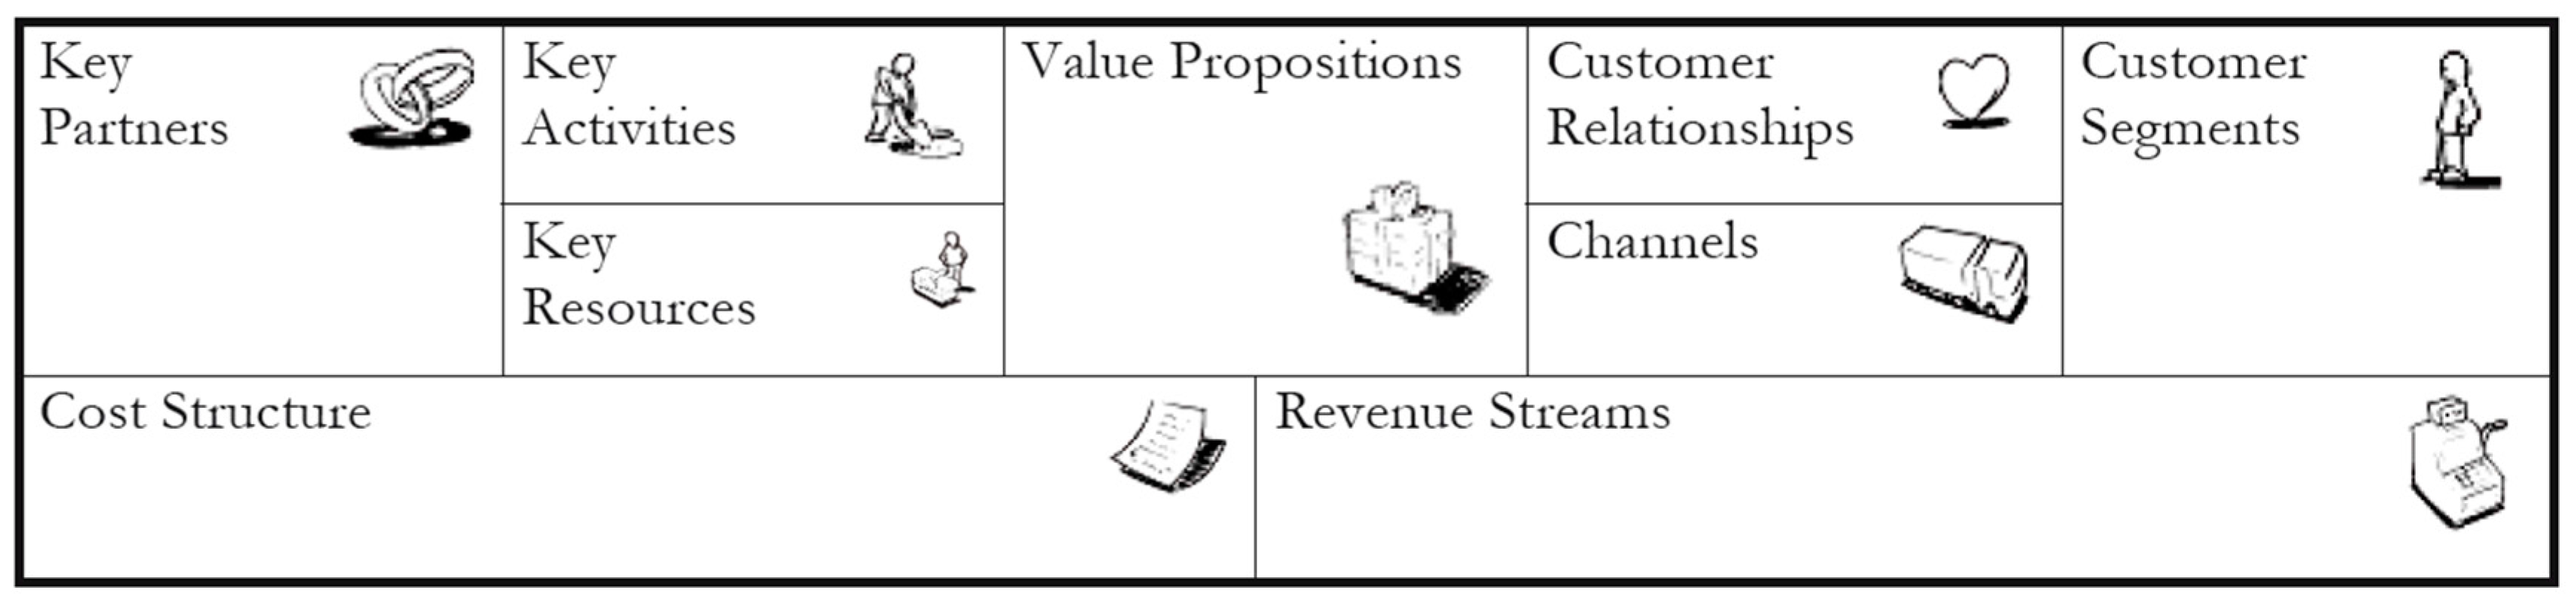
4.1. Business Model Canvas

Buildings can provide aggregation potentials to energy market via different channels with different values. Meanwhile, there are different involved market players, structures of revenue and cost, and dependencies among scenarios. Therefore, this paper adopts the ‘business model’ concept to discuss different scenarios for buildings to participate in the energy aggregation markets.
The term ‘business model’ has been massively applied and discussed in recent years. A business model is “a system of resources and activities which create a value that is useful to the customer and the sale of this value makes money for the company” [38]. It is part of a company’s business strategy that describes how a company creates, delivers, and captures value within economic, social, cultural or other contexts [39].
So far, several business model generation methods have been developed. For example, Mullins and Komisar’s five-pillar model [40] (including revenue model, gross margin model, operating model, working capital model, investment model). However, this model has barriers to be applied for complex analysis, due to little attention to the value offered to customers. The business model developed by Afuah [41] divides the model into six components (shown in Figure 4). However, this model also does not describe the value offered to customers.
This paper adopts the ‘business model canvas’ by Osterwalder and Pigneur [42] which divides the business model into nine components: customer segments, customer relationships, distribution channels, value proposition, key resources, key activities, partners, cost structure and revenue streams (shown in Figure 5). Compared to other methods, the business model canvas is a more powerful visualized and flexible tool that is popularly adopted by both industry and academia.

4.2. Evaluation Tool for Business Model Analysis

To evaluate the value of potential business models, this paper modifies the evaluation tool developed by [43]. The tool is an organized and transparent system that facilities the work of the evaluators of potential business models [43]. This tool includes all factors that affect the business models and can be adapted to specific needs/strategies. This evaluation tool is originally intended for smart cities business models, and this paper modifies it for evaluating business models of buildings’ participation in the aggregation market. The modified evaluation tool can be applied to general business model analysis, and the decision-making (value criteria) can be specific for different scenarios (shown in Table 4).
The value of the business model (VBM) in this paper is calculated as follows:
Value of business model = value proposition × customer segment × (partners + resources + revenue streams − cost + customer relationship + channels + activities)

4.3. SWOT Analysis and TOWS Analysis

The discussion of buildings’ aggregation potentials needs to be integrated with the context of the specific electricity market. For instance, the demand response status among EU member countries is divided into three groups: (1) who have yet to seriously engage with DR reforms; (2) who are in the process of enabling DR through retailers only; (3) who enable both DR and independent aggregation [6]. Therefore, business models for buildings to participate in energy aggregation markets are strongly influenced by national electricity market structures.
This paper uses the Nordic electricity market as an example, and applies SWOT and TOWS analyses to evaluate feasibility and barriers of different business models. SWOT is an acronym for strengths, weaknesses, opportunities, and threats. It is a structured planning method that evaluates internal and external factors of an organization, project, or business venture. Strengths and weaknesses aim to examine organization’s internal situation, opportunities and threats focus on external environment. SWOT analysis is broadly used in planning and decision-making.
However, SWOT analysis does not show relationships between internal and external factors. Therefore, this paper applies TOWS analysis to match internal factors and external factors to identify relevant strategic options. The strategy options in TOWS are described in Table 5.

5. Results

Buildings are commonly defined into three types (residential, commercial, and industrial). Due to the requirement of volume threshold for aggregation markets (e.g., the minimum bid to provide primary service in Demark is 0.3 MW), this paper divides buildings into two categories according to their energy consumptions: small and large energy consumers. The majority of residential buildings and some commercial buildings are small energy consumers. Comparatively, industrial buildings and some commercial buildings are large energy consumers.
There are four business models proposed for buildings to participate in the energy aggregation market in this paper (shown in Table 6).

5.1. Business Model 1—Buildings Participate in the Implicit DR Program via Retailers

All buildings can participate in the implicit DR program. In this business model (shown in Table 7), buildings receive the DR program package as part of their electricity supply contract with their electricity retailer. Therefore, buildings can obtain a lower bill. For instance, buildings can reduce electricity usage at peak periods or shift their usage to off-peak periods.
Retailers can provide different DR program packages due to buildings’ own preferences and constraints, and improve consumers’ satisfaction rate. For instance, customers’ satisfaction rate can be increased due to lower bills. Retailers might get new customers by providing an explicit DR package as a competitive offer. On the other hand, retailers need to provide consulting services to customers. Retailers usually do not have professional knowledge in the DR domain, and DR services are a new business model for retailers. Therefore, retailers need to hire experts and additional staff for the DR business.

5.2. Business Model 2—Buildings (Especially with Small Energy Consumption) Participate in the Explicit DR Program via Aggregators

In Business Model 2 (shown in Table 8), buildings, especially those with low energy consumption, can obtain direct payment by participating in explicit DR programs via aggregators.
Aggregators can maintain good relationships with customers through (1) an efficient and customer-friendly payment system and control system; (2) a training and consulting service, including DR knowledge and market information sharing. Meanwhile, the customized DR contracts should be based on customers’ energy constraints and preferences; (3) the participation in the DR market needs customers to install direct load control systems. Therefore, aggregators can provide discount or free control systems, and maintenance services to customers; (4) Aggregators provide backup for individual loads as part of pooling activities that can increase the overall reliability, and reduce risk for individual consumers.
Aggregators generate revenue by providing DR services to the market (e.g., wholesale market, regulating market, and ancillary service). Aggregators might also receive incentives from regulators, TSOs and DSOs, depended on market regulations and structures.

5.3. Business Model 3—Buildings (with Large Energy Consumption) Directly Access Explicit DR Program

Buildings with large energy consumption are the energy flexibility providers who can directly participate and compete directly with producers in the DR market (wholesale market, regulating market, or ancillary service) (shown in Table 9).
To participate in wholesale and balancing markets, large energy consumers need to comply with market rules. Meanwhile, to participate in the reserve market as an ancillary service, buildings need to allow TSOs to directly control energy flexibility resources of buildings (e.g., building energy management systems).
Buildings can receive direct payment by providing flexibility via direct participation in explicit DR programs, and may get incentives from regulators, DSOs and TSOs.

5.4. Business Model 4—Buildings Access the Energy Market via VPP Aggregators by Providing DERs

In this business model, buildings (which have DERs) are able to obtain direct payment from VPP aggregators by providing energy flexibility. The volume threshold for power producers may prevent small DER owners to trade their energy individually, and VPP aggregators aggregate DERs and flexible loads as a single entity in the wholesale market that can help DER owners collectively to participate in the market with lower risk.
Buildings can have different types of DERs. Therefore, DER owners can participate in different aggregation markets (shown in Table 10). For instance, residential buildings usually only have PVs. Due to response requirements for different markets (e.g., primary service in Denmark requires a response in 15 seconds with a minimum of 0.3 MW), aggregation potentials that can be provided by DER owners depend mainly on the types of DERs.
VPP aggregators can provide customized market access strategies for different types of DER owners. Meanwhile, VPP aggregators should provide accurate forecast information of supply and demand, and user-friendly control systems, because this influences DER owners’ daily business or energy usage patterns.
The main reason for DER owners to participate in the energy flexibility market is monetary benefits. Therefore, VPP aggregators need to provide an efficient and fair payment system that also affects DER owners’ satisfaction and motivation.

6. Case Study—The Aggregation Potential for Buildings in the Nordic Electricity Market

The Nordic electricity market of Denmark, Finland, Norway, and Sweden, comprises of a wholesale market and a retail market. Each Nordic country is an integral part of the free Nordic electricity market [44]. The wholesale market trade is via the Nord Pool Spot market. The Nord Pool market is owned by the TSOs in the Nordic countries. There are two electricity market places in the Nord Pool Spot market: Elspot (Day-ahead) and Elbas (Intra-day), and a regulating power market. The national TSOs in each country are responsible for the electricity retail markets. In Denmark, Energinet.dk is responsible, and consumers can freely choose their electricity retailers.
In the current Nordic electricity market, there is no independent aggregator, and demand response has been enabled within the ancillary services [13]. In some Nordic countries, customers have opportunities to participate in priced-based programs (e.g., time-of-use (TOU), critical peak pricing, and real-time pricing) [15].
There are nearly 15 million electricity customers in the Nordic electricity market, and the four business models show that there are opportunities and benefits for electricity consumers to participate in the energy aggregation market. However, there are also barriers and constraints under the current energy market structure.
Opportunities: there is a market need for buildings’ energy flexibility, due to market (e.g., imbalance payment) and grid (grid capacity) demands. Meanwhile, technologies including control systems, forecast software, and DERs, are more advanced, cheaper, and user-friendly compared to before. Therefore, market players, such as aggregators and buildings, participate much more easily in the aggregation market. In many countries, regulators, TSOs, or DSOs have provided incentives for participation in the aggregation market.
Threats: there are still regulation barriers for market players to access the aggregation market. For instance, there is no DR market in some countries such as Denmark, and DR participation is limited to the small consumers and only large consumers can participate in the wholesale market. Meanwhile, monetary benefit is not significantly visible to encourage buildings to participate in the aggregation market, especially with the compromise of comfort and low return on investment.
Strengths: the majority of buildings have potentials to provide flexibility to the energy market, either by changing energy usage pattern (adjustable loads) or by giving direct control of their appliances or DERs to aggregators.
Weaknesses: Return on investment is the main concern for energy consumers. Small energy consumers, e.g., residential buildings, still lack investment incentives to purchase controllable appliances, control systems, and DERs. Energy consumers might also be conservative due to potential effects on their daily business or energy usage patterns. Meanwhile, limited capacity of energy flexibility provided by small energy consumers (e.g., residential buildings) might prevent their access to the aggregation market or not have visible monetary benefits.

6.1. Value of the Business Model (VBM) in the Nordic Electricity Market

For the aggregation market development, it is necessary to investigate which business model brings more value to the whole market. By applying the evaluation of business model analysis (1), the value for the four business models are shown in Table 11.
Under the current situation of the Nordic electricity market, Business Model 1—‘buildings participate in the implicit DR program via retailers’ significantly provides the highest value to the whole aggregation market. This business model not only covers all buildings, is highly supported by regulations, but also requests few changes in the existing market structure.
Comparatively, Business Model 2—‘buildings participate in the explicit DR via aggregators’ brings the lowest value to the whole aggregation market. The reason is (1) there are no independent aggregators in the Nordic electricity market as yet, and stakeholders are conservative to this business model (the value of ‘partners’ is only 0.425); (2) buildings with small energy consumption provide limited energy flexibility, and the benefit is not visible under the current Nordic market regulation (the values of ‘value proposition’ is 0.5); meanwhile, (3) buildings with small energy consumption usually do not install building control systems, and the cost to participate the market and install control systems is high (the values of ‘cost’ is −1.4).
Business Models 2 and 4 both present buildings’ participation in the aggregation market via aggregators. The comparison results show that buildings that equip DERs have more potentials and incentives to participate the aggregation market.

6.2. Recommendation for Encouraging Building Participation

With TOWS analysis (shown in Table 12), this paper presents the following suggestions to encourage buildings to participate in the aggregation market:
  • Regulation needs to be adjusted to allow buildings easy access to the aggregation market;
  • Incentives from regulators, TSOs/DSOs can encourage buildings to participate in the energy aggregation market;
  • Clear monetary benefits (e.g., payment) needs to be defined;
  • Financial support, e.g., loans, renting, cost reduction strategies and packages, for installation of control systems, DERs, and controllable appliances;
  • Easy and user-friendly control systems with accurate forecast and analysis;
  • Customized service (e.g., payment and control solutions) for different types of buildings;
  • Selective market access for buildings which can have visible benefit from the aggregation market (e.g., large energy consumers or industrial buildings with large capacity of DERs);
  • Utilization of ADR (automatic DR) in buildings with challenges of privacy, user acceptance, and security needs to be addressed.

7. Conclusions

This paper develops and discusses four business models for buildings (e.g., residential, industrial, and commercial) to participate in the aggregation markets by providing flexible loads and DERs. With a case study of the Nordic electricity market, an evaluation of the four business models is conducted with the SWOT analysis and evaluation tool of business model analysis. The evaluation result shows that there are opportunities for buildings to participate in the aggregation market and constraints for different types of buildings. Under the current Nordic market regulation, the most feasible business model is: buildings participate in the implicit DR program via retailers. Meanwhile, the regulation barriers and limited monetary incentives impede buildings’ participation. Therefore, the business model of ‘buildings with small energy consumption participate in explicit DR via aggregators’ possesses more challenges compared to other three business models.
This study contributes to the literature in several unique ways. First, this study demonstrates four business models with explicit description about how the flexibility potentials of buildings can be utilized in different aggregation scenarios.
Second, by investigating buildings’ participation in the four scenarios, this study contributes to the literature regarding the correlation between buildings’ flexibility and aggregation market access. This study finds that the flexibility resources and potentials are different for different types of buildings, and building owners have different needs and behaviors. Thus, it is essential to understand building owners’ needs, comforts, and behaviors to develop feasible market access strategies for different types of buildings.
Third, the importance and implication of incentive programs, national regulations and energy market structures to the buildings’ participation are identified. Incentive programs can enhance buildings’ participation. In addition, the involvement of governments and regulators in the aggregation market can provide incentives, increase DR awareness and participation. However, the aggregation market is still immature, and regulations and polices of aggregation markets are various across countries. For instance, in Europe, the countries Belgium, France, Ireland, and the UK have created the regulative framework to enable both DR and independent aggregators, whereas other European countries have not yet engaged with DR reforms, e.g., Portugal and Spain. Therefore, the business models of aggregation potentials for buildings need to be based on national regulations and energy market structures.

Acknowledgments

This study was conducted as part of Energy in Buildings and Communities Programme (EBC) Annex 67 Energy Flexible Buildings.

Author Contributions

Zheng Ma and Bo Nørregaard Jørgensen conceived and designed the methodologies; Joy Dalmacio Billanes contributed literature analysis; Zheng Ma wrote the paper and performed the business model development and analysis.

Conflicts of Interest

The authors declare no conflict of interest.

References

  1. European Commission. The Future Role and Challenges of Energy Storage; Europa.eu: Brussels, Belgium, 2017. [Google Scholar]
  2. Papalexopoulos, A.; Hansen, C.; Frowd, R.; Tuohy, A.; Lannoye, E. Impact of the transmission grid on the operational system flexibility. In Proceedings of the 2016 Power Systems Computation Conference (PSCC), Genoa, Italy, 20–24 June 2016; pp. 1–10. [Google Scholar]
  3. Wu, H.; Shahidehpour, M.; Alabdulwahab, A.; Abusorrah, A. Thermal generation flexibility with ramping costs and hourly demand response in stochastic security-constrained scheduling of variable energy sources. IEEE Trans. Power Syst. 2015, 30, 2955–2964. [Google Scholar] [CrossRef]
  4. Ma, Z.; Badi, A.; Jørgensen, B.N. Market opportunities and barriers for smart buildings. In Proceedings of the 2016 IEEE Green Energy and Systems Conference (IGSEC), Long Beach, CA, USA, 6–7 November 2016; pp. 1–6. [Google Scholar]
  5. Ma, Z.; Billanes, J.D.; Kjærgaard, M.B.; Jørgensen, B.N. Energy flexibility in retail buildings: From a business ecosystem perspective. In Proceedings of the 2017 14th International Conference on the European Energy Market (EEM), Dresden, Germany, 6–9 June 2017; p. 6. [Google Scholar]
  6. Annala, S.; Honkapuro, S. Demand response in Australian and European electricity markets. In Proceedings of the 2016 13th International Conference on the European Energy Market (EEM), Porto, Portugal, 6–9 June 2016; pp. 1–5. [Google Scholar]
  7. Du, H.; Liu, S.; Kong, Q.; Zhao, W.; Zhao, D.; Yao, M.G. A microgrid energy management system with demand response. In Proceedings of the 2014 China International Conference on Electricity Distribution (CICED), Shenzhen, China, 23–26 September 2014; pp. 551–554. [Google Scholar]
  8. Minou, M.; Stamoulis, G.D.; Thanos, G.; Chandan, V. Incentives and targeting policies for automated demand response contracts. In Proceedings of the 2015 IEEE International Conference on Smart Grid Communications (SmartGridComm), Miami, FL, USA, 2–5 November 2015; pp. 557–562. [Google Scholar]
  9. Liu, Z.; Zeng, X.J.; Ma, Q. Integrating demand response into electricity market. In Proceedings of the 2016 IEEE Congress on Evolutionary Computation (CEC), Vancouver, BC, Canada, 24–29 July 2016; pp. 2021–2027. [Google Scholar]
  10. Son, J.; Hara, R.; Kita, H.; Tanaka, E. Energy management considering demand response resource in commercial building with chiller system and energy storage systems. In Proceedings of the 2014 International Conference on Power Engineering and Renewable Energy (ICPERE), Bali, Indonesia, 9–11 December 2014; pp. 96–101. [Google Scholar]
  11. De Vries, L.J.; Verzijlbergh, R. Organizing flexibility: How to adapt market design to the growing demand for flexibility. In Proceedings of the 2015 12th International Conference on the European Energy Market (EEM), Lisbon, Portugal, 19–22 May 2015; pp. 1–5. [Google Scholar]
  12. Ma, Z.; Friis, H.T.A.; Mostrup, C.G.; Jørgensen, B.N. Energy flexibility potential of industrial processes in the regulating power market. In Proceedings of the 6th International Conference on Smart Cities and Green ICT Systems, Porto, Portugal, 22–24 April 2017; pp. 109–115. [Google Scholar]
  13. Bertoldi, P.; Zancanella, P.; Boza-Kiss, B. Demand Response Status in EU Member States; Europa.eu: Brussels, Belgium, 2016. [Google Scholar]
  14. Sebastian, S.; Margaret, V. Application of demand response programs for residential loads to minimize energy cost. In Proceedings of the 2016 International Conference on Circuit, Power and Computing Technologies (ICCPCT), KK Dist, India, 18–19 March 2016; pp. 1–4. [Google Scholar]
  15. Lamprinos, I.; Hatziargyriou, N.D.; Kokos, I.; Dimeas, A.D. Making demand response a reality in Europe: Policy, regulations, and deployment status. IEEE Commun. Mag. 2016, 54, 108–113. [Google Scholar] [CrossRef]
  16. Yu, M.; Hong, S.H.; Beom, K.J. Incentive-based demand response approach for aggregated demand side participation. In Proceedings of the 2016 IEEE International Conference on Smart Grid Communications (SmartGridComm), Sydney, Australia, 6–9 November 2016; pp. 51–56. [Google Scholar]
  17. Gharesifard, B.; Başar, T.; Domínguez-García, A.D. Price-based coordinated aggregation of networked distributed energy resources. IEEE Trans. Autom. Control 2016, 61, 2936–2946. [Google Scholar] [CrossRef]
  18. Ghavidel, S.; Li, L.; Aghaei, J.; Yu, T.; Zhu, J. A review on the virtual power plant: Components and operation systems. In Proceedings of the 2016 IEEE International Conference on Power System Technology (POWERCON), Wollongong, Australia, 28 September–1 October 2016; pp. 1–6. [Google Scholar]
  19. Vandoorn, T.L.; Zwaenepoel, B.; de Kooning, J.D.M.; Meersman, B.; Vandevelde, L. Smart microgrids and virtual power plants in a hierarchical control structure. In Proceedings of the 2011 2nd IEEE PES International Conference and Exhibition on Innovative Smart Grid Technologies, Manchester, UK, 5–7 December 2011; pp. 1–7. [Google Scholar]
  20. Goutard, E.; Passelergue, J.C.; Sun, D. Flexibility marketplace to foster use of distributed energy resources. In Proceedings of the 22nd International Conference and Exhibition on Electricity Distribution (CIRED 2013), Stockholm, Sweden, 10–13 June 2013; pp. 1–4. [Google Scholar]
  21. Saboori, H.; Mohammadi, M.; Taghe, R. Virtual Power Plant (VPP), definition, concept, components and types. In Proceedings of the 2011 Asia-Pacific Power and Energy Engineering Conference, Wuhan, China, 22–28 March 2011; pp. 1–4. [Google Scholar]
  22. Bakari, K.E.; Kling, W.L. Development and operation of virtual power plant system. In Proceedings of the 2011 2nd IEEE PES International Conference and Exhibition on Innovative Smart Grid Technologies, Manchester, UK, 5–7 December 2011; pp. 1–5. [Google Scholar]
  23. Hatziargyriou, N.D.; Tsikalakis, A.G.; Karfopoulos, E.; Tomtsi, T.K.; Karagiorgis, G.; Christodoulou, C.; Poullikkas, A. Evaluation of Virtual Power Plant (VPP) operation based on actual measurements. In Proceedings of the 7th Mediterranean Conference and Exhibition on Power Generation, Transmission, Distribution and Energy Conversion (MedPower 2010), Agia Napa, Cyprus, 7–10 November 2010; pp. 1–8. [Google Scholar]
  24. Plancke, G.; de Vos, K.; Belmans, R.; Delnooz, A. Virtual power plants: Definition, applications and barriers to the implementation in the distribution system. In Proceedings of the 2015 12th International Conference on the European Energy Market (EEM), Lisbon, Portugal, 19–22 May 2015; pp. 1–5. [Google Scholar]
  25. Zehir, M.A.; Bagriyanik, M. Smart energy aggregation network (SEAN): An advanced management system for using distributed energy resources in virtual power plant applications. In Proceedings of the 2015 3rd International Istanbul Smart Grid Congress and Fair (ICSG), Istanbul, Turkey, 29–30 April 2015; pp. 1–4. [Google Scholar]
  26. Ravichandran, S.; Vijayalakshmi, A.; Swarup, K.S.; Rajamani, H.S.; Pillai, P. Short term energy forecasting techniques for virtual power plants. In Proceedings of the 2016 IEEE 6th International Conference on Power Systems (ICPS), New Delhi, India, 4–6 March 2016; pp. 1–6. [Google Scholar]
  27. Kessels, K.; Claessens, B.; hulst, R.D.; Six, D. The value of residential flexibility to manage a BRP portfolio: A Belgian case study. In Proceedings of the 2016 IEEE International Energy Conference (ENERGYCON), Leuven, Belgium, 4–8 April 2016; pp. 1–6. [Google Scholar]
  28. The European Association for the Promotion of Cogeneration (COGEN Europe). The Role of Aggregators in Bringing District Heating and Electricity Networks Together: Integrated Supply Maximising the Value of Energy Assets; Europa.eu: Brussels, Belgium, 2014; pp. 1–3. Available online: http://www.cogeneurope.eu/medialibrary/2014/12/03/4bb831e2/Case%20Study%20-%20Neas%20Energy%20-%20December%202014%20FINAL.pdf (accessed on 15 July 2017).
  29. Puglia, L.; Patrinos, P.; Bernardini, D.; Bemporad, A. Reliability and efficiency for market parties in power systems. In Proceedings of the 2013 10th International Conference on the European Energy Market (EEM), Stockholm, Sweden, 28–30 May 2013; pp. 1–8. [Google Scholar]
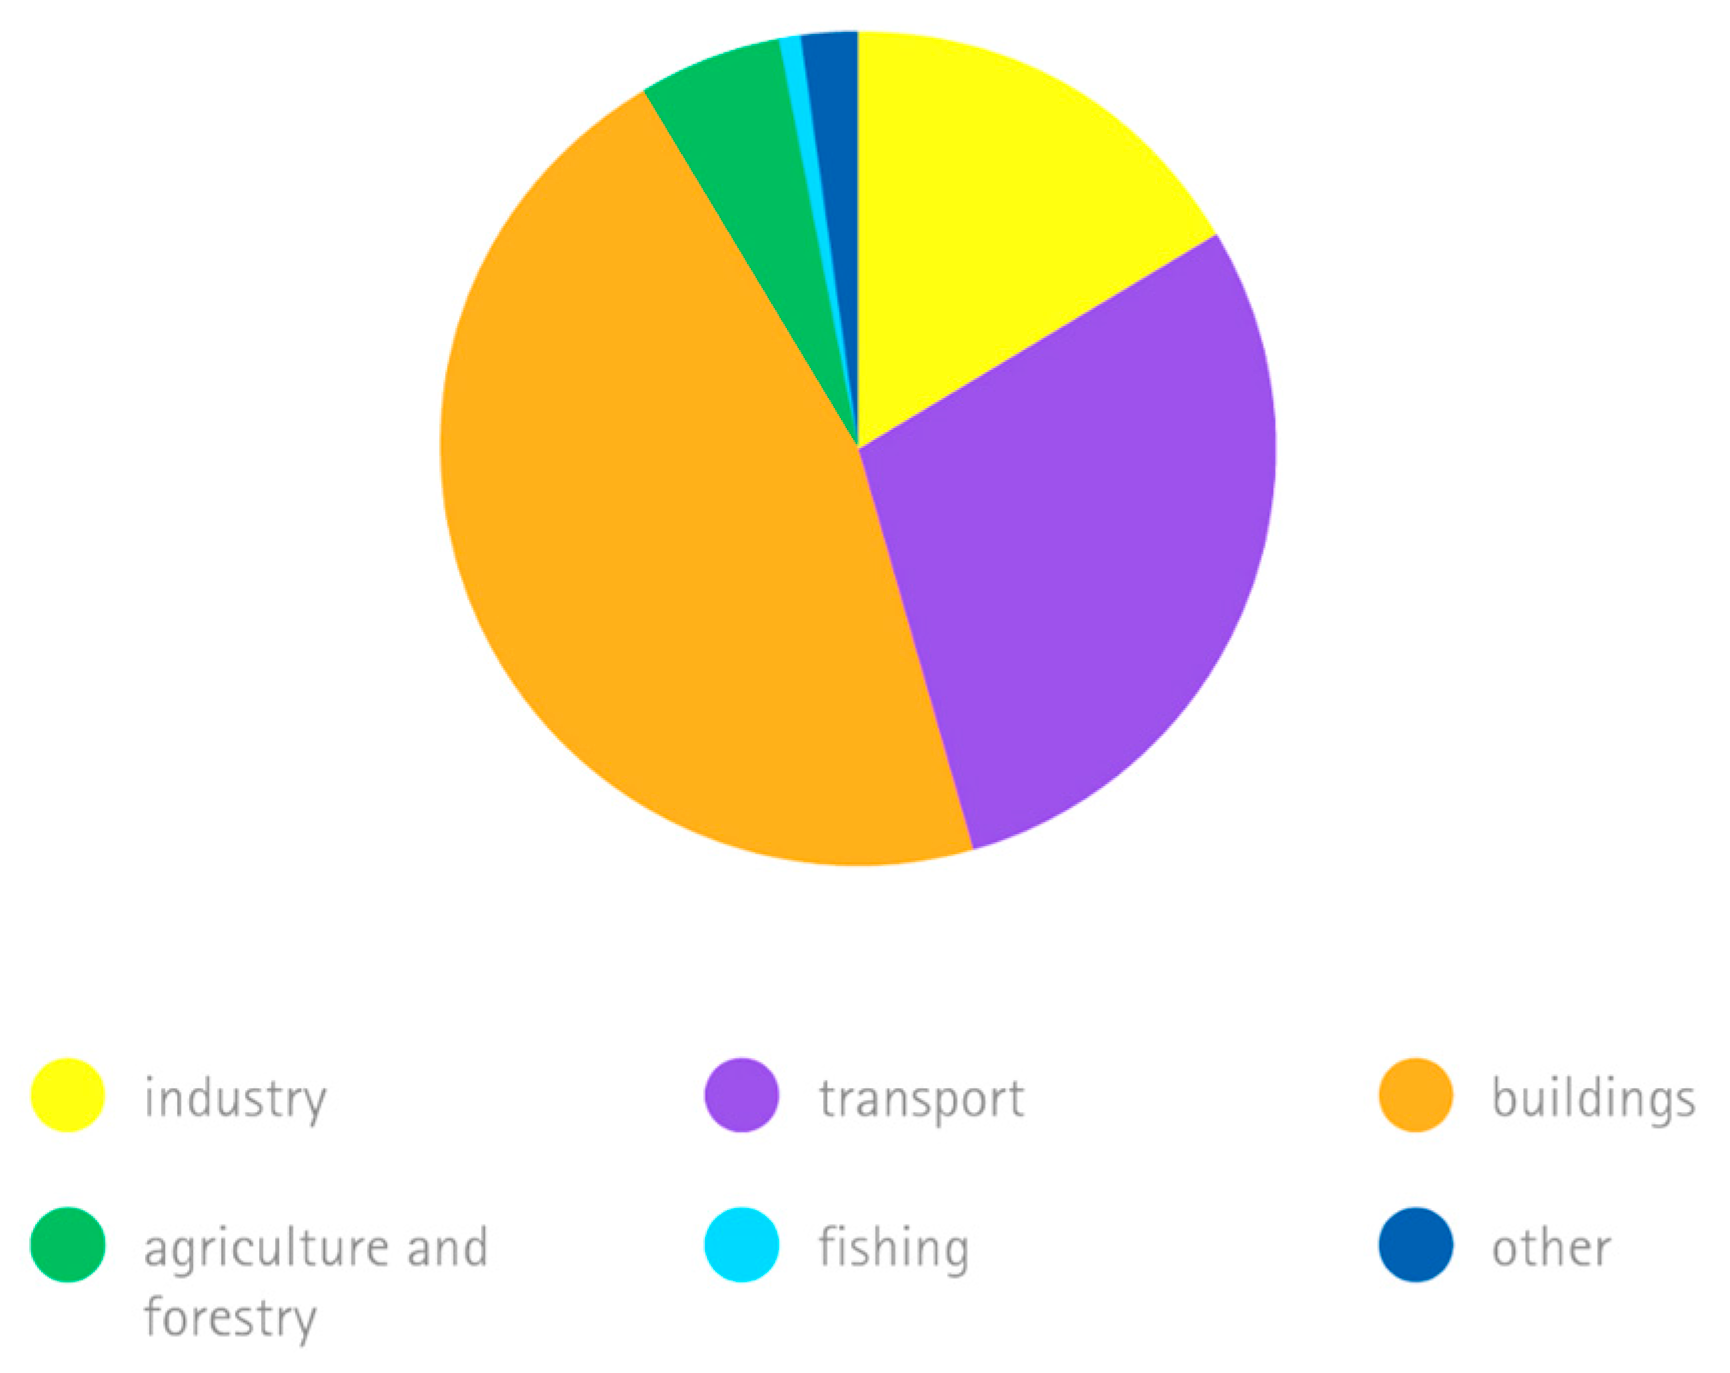
  30. Nordic Energy Research. Denmark: Danish Energy Used Mostly in Buildings. 2013. Available online: http://www.nordicenergy.org/figure/energy-consumption-by-sector/danish-energy-used-mostly-in-buildings/ (accessed on 12 January 2017).
  31. Thavlov, A.; Bindner, H.W. An aggregation model for households connected in the low-voltage grid using a VPP interface. In Proceedings of the IEEE PES ISGT Europe 2013, Lyngby, Denmark, 6–9 October 2013; pp. 1–5. [Google Scholar]
  32. Kimmo, I.; Sirvio, A. Sustainable Buildings for the High North. Existing Buildings—Technologies and Challenges for Residential and Commercial Use; ePooki: Oulu, Finland, 2015; Available online: http://www.oamk.fi/epooki/2015/high-north-project-existing-buildings/ (accessed on 15 March 2017).
  33. Safdarian, A.; Fotuhi-Firuzabad, M.; Lehtonen, M. Benefits of Demand Response on Operation of Distribution Networks: A Case Study. IEEE Syst. J. 2016, 10, 189–197. [Google Scholar] [CrossRef]
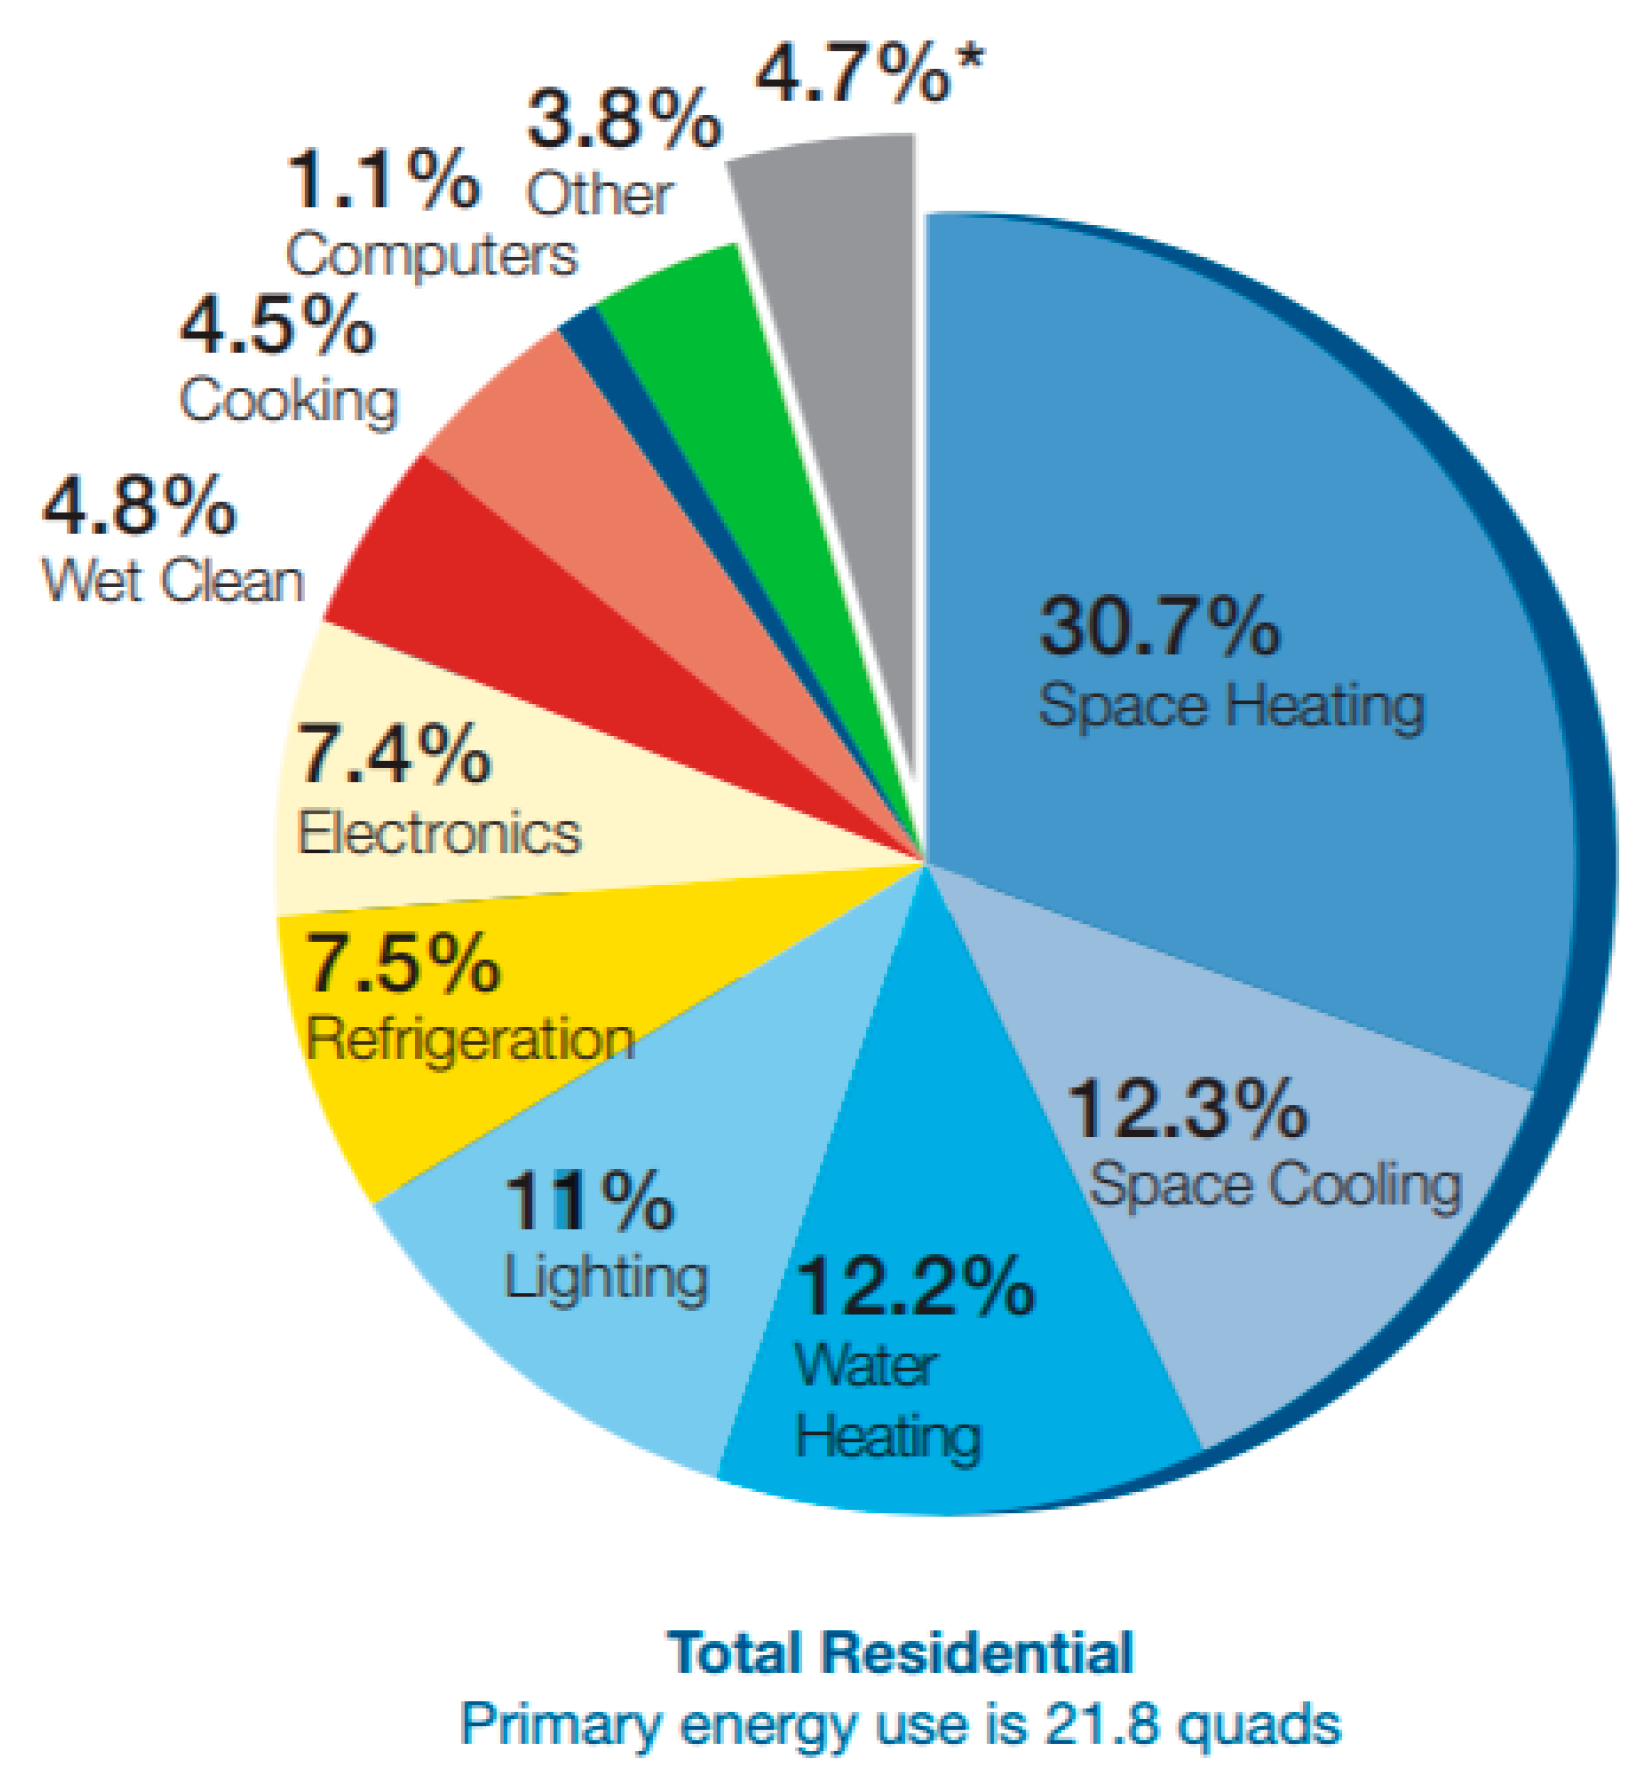
  34. Energy Information Administration (EIA). Residential Site Energy Consumption by End Use. Available online: http://buildingsdatabook.eren.doe.gov/ChapterIntro2.aspx (accessed on 15 June 2016).
  35. Yang, Z.; Wang, L. Demand Response Management for multiple utility companies and multi-type users in smart grid. In Proceedings of the 2016 35th Chinese Control Conference (CCC), Chengdu, China, 27–29 July 2016; pp. 10051–10055. [Google Scholar]
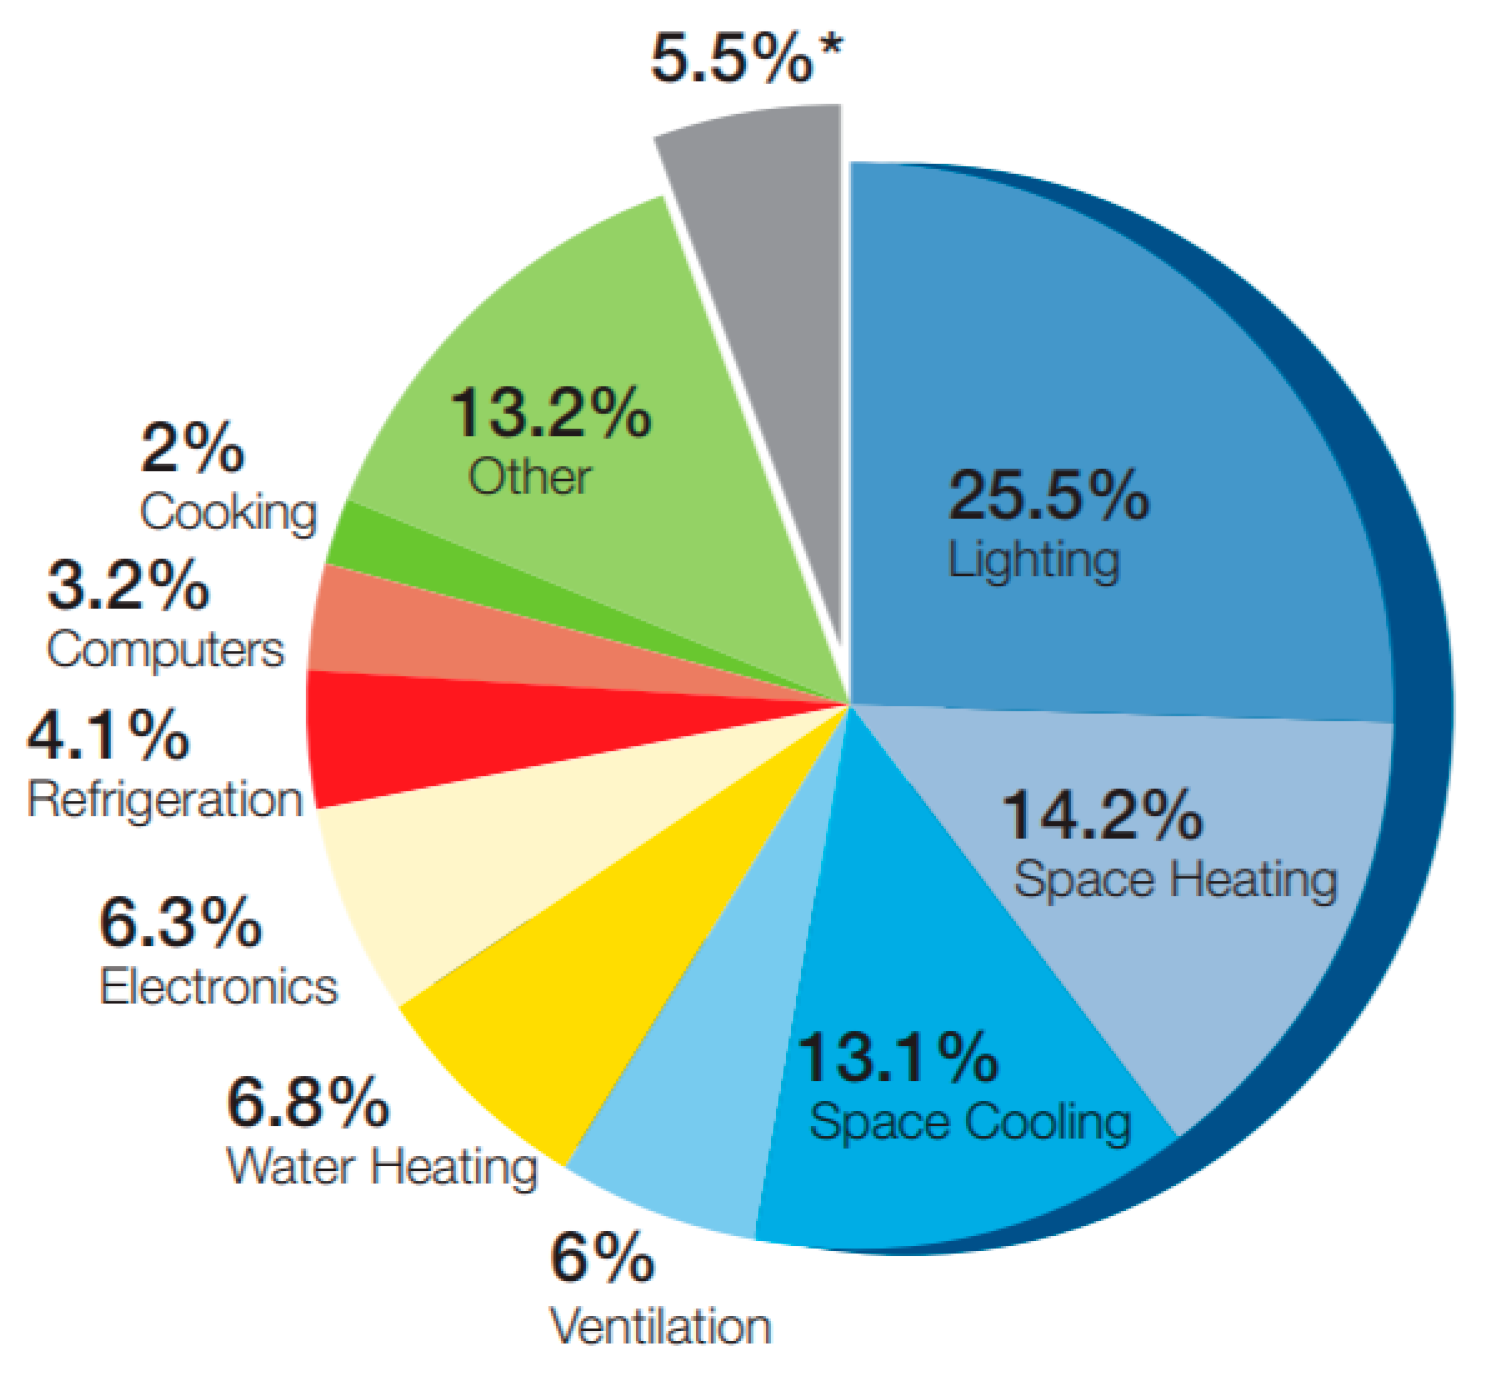
  36. Energy Information Administration (EIA). Commercial Site Energy Consumption by End Use. Available online: http://buildingsdatabook.eren.doe.gov/ChapterIntro3.aspx (accessed on 23 February 2017).
  37. Ea Energianalyse for Energunet. Dk; Dansk Energi. Kortlægning af Potentialet for Fleksibelt Elforbrug I Industri, Handel og Service; Energinet.dk: Vejle, Denmark, 2011. [Google Scholar]
  38. Štefan, S.; Richard, B. Analysis of business models. J. Compet. 2014, 6, 19–40. [Google Scholar]
  39. Duening, T.N.; Hisrich, R.D.; Lechter, M.A. Chapter 1—Fundamentals of Business. In Technology Entrepreneurship; Academic Press: Boston, MA, USA, 2010; pp. 1–27. [Google Scholar]
  40. Mullins, J.; Komisar, R. Getting to Plan B: Breaking through to a Better Business Model; Harvard Business Press: Boston, MA, USA, 2009. [Google Scholar]
  41. Afuah, A. Business Models: A Strategic Management Approach; McGraw-Hill/Irwin: New York, NY, USA, 2003. [Google Scholar]
  42. Osterwalder, A.; Pigneur, Y. Business Model Generation; John Wiley & Sons: Hoboken, NJ, USA, 2009. [Google Scholar]
  43. Díaz-Díaz, R.; Muñoz, L.; Pérez-González, D. The business model evaluation tool for smart cities: Application to smart santander use cases. Energies 2017, 10, 262. [Google Scholar] [CrossRef]
  44. Ma, Z.P.Z.; Jørgensen, B.N. The international electricity market infrastructure-insight from the nordic electricity market. In Proceedings of the 13th European Energy Market Conference (EEM 2016), Porto, Portugal, 6–9 June 2016; p. 5. [Google Scholar]
Figure 1. Danish energy consumption by sector in 2012 [30].
Energies 10 01646 g001
Figure 2. Residential primary energy end-use in the USA 2005 [34].
Energies 10 01646 g002
Figure 3. Commercial primary energy end-use in the USA 2005 [36].
Energies 10 01646 g003
Figure 4. Business model by Afuah.
Energies 10 01646 g004
Figure 5. Business model canvas by Osterwalder and Pigneur.
Energies 10 01646 g005
Table 1. Actors in demand response.
ActorsOffersTo
AggregatorPay for BRPs’ energy lossBRP
Market accessConsumer
DR incentives
Ancillary servicesTransmission System Operator (TSO)
Tariff
Network balancing servicesDistribution System Operation (DSO)
Tariff
Supplier/retailerIncentives and contract package for the implicit DR programConsumers
RegulatorDR incentivesAll actors
DR regulations
DR awareness
ConsumerDemand profileAggregator
Direct controlSupplier/retailer
Large consumers can directly provide energy flexibility to the DR marketDemand Response (DR) market
Table 2. Actors in Virtual Power Plants (VPPs).
ActorOffersTo
VPP aggregatorMarket accessDER owners
Ancillary servicesTSO
Balancing servicesBRP
Buy and sell electricityWholesale Market
Network servicesDSO
DER ownerProduce electricityVPP aggregator
Direct controlVPP aggregator
BRPSettle the imbalanceMarket
Accurate forecast of supply and demandVPP aggregator
Bilateral contracts [29]VPP aggregator
Policy makerEnergy rulesAll actors
Table 3. Potential for load flexibility of different processes in agriculture and industry [37].
IndustryElectricity Consumption, GWh/Year (2001)Flexibility Potential, MW
Eastern DenmarkWestern DenmarkTotalEastWestTotal
Agriculture40521502555136982
Food and beverage51817382526134356
Textile14194208044
Wood industry123281404268
Paper and printing industry22852775551116
Chemical industry111610792195171633
Stone, clay, and glass industry21171993041520
Iron and steel mills52811764526632
Foundries-19619601010
Iron and metal44713041751205979
Trade & Service1507220631735479134
Table 4. TOWS analysis and strategy options.
Elements from Business Model CanvasValue Criteria
Value Proposition1: if provide significant more benefits to customers compared to existing solutions (product/service)
0.5: if provide around half more benefits to customers compared to existing solutions
0.1: if not provide visible benefits to customers compared to existing solutions
Customer segmentValue of customer segment = size × purchasing power
Size:
1: if majority of the total potential customers can be targeted, otherwise the percentage of the total potential customers can be targeted
Purchasing power:
1: high
0.5: medium
0.1: low
Partners1: if the partner is the existing partner
0.5: if it is new but easy to reach
0: if it is new but difficult to reach
Note: total value = ∏(value of individual partners), because the more partners you need to have, the more risk exists
Resources1: if it is an existing resource
0.5: if it is new but easy to reach
0: if it is new but difficult to reach
Note: total value = Σ(individual resource)/number of compulsory resources
Revenue streamsDepends mainly on customers’ familiarity and companies’ affordability
1: if it is familiar to customers and fits to companies’ normal business
0.5: if it partly familiar to customers and companies need to make small changes
0: if it is totally new to customers and companies
Cost1: if large spending for devices and personals
0.5: if within the range of affordable spending
0: if based on existing devices and personals
Customer relationshipMainly depends on how simple and easy the approach is.
1: if it is for keeping existing customers
0.5: if it is for growing existing customers
0.1 if it for getting new customers
Note:
If it is easy to get new customers, you can move it to 0.5 or even 1.
Total value = Σ(individual customer relationship)/number of compulsory customer relationships
Channels1: if it is an existing channel
0.5: if it is new but easy to establish
0: if it is new but difficult to establish
Activities1: if it is an existing activity or similar to the existing activities
0.5: if it is new but easy to conduct
0: if it is new but difficult to conduct
Note: total value = Σ(individual activity)/number of activity, because the more activities you need to manage, the more difficult the task
Table 5. TOWS analysis and strategy options.
Strategy OptionsOpportunitiesThreats
StrengthsS-O Strategies
Strategies that use strengths to take advantages of opportunities
S-T Strategies
Strategies that use strengths to avoid threats
WeaknessesO-W Strategies
Strategies that take advantages from opportunities for mitigating weaknesses
W-T Strategies
Strategies that mitigate weakness and avoid threat
Table 6. Four Business Models of Buildings’ Participation in the Aggregation Market.
Aggregation MarketTypesBusiness ModelDirect ParticipantsIndirect Building Participants
Demand ResponseImplicit DR (price based)1—buildings participate in the implicit DR program via retailersRetailersAll buildings
Explicit DR2—buildings (small energy consumers) participate in the explicit DR via aggregatorsIndependent aggregatorBuildings with small energy consumption
3—buildings (large energy consumers) directly access the explicit DR programBuildings with large energy consumption-
Virtual Power PlantsTrading, balancing, network services4—buildings access the energy market via VPP aggregators by providing DERsVPP aggregatorsDER owners (buildings which equip the DERs)
Table 7. Business Model 1—buildings participate in the implicit DR program via retailers.
PartnersActivitiesValue PropositionCustomer RelationCustomers
  • Regulators
  • Billing companies
  • Electricity retailers
  • Customer analysis to provide different DR offers;
  • Customer education to promote the offers;
  • Customer consulting due to customer constraints;
  • Billing system integration
  • Staffs/expert recruitment
Buildings receive a lower electricity bill
  • Different DR offers due to buildings’ own preferences and constraints for existing customers
  • Increase existing customers’ satisfaction rate due to lower bills
All buildings
ResourcesChannels
  • Price signal
  • Regulators’ support
Part of the electricity supply contract
Cost StructureRevenue Streams
Integration of DR offers into electricity supply contract (which might need DR experts and facility purchasing)
Price signal sending to customers (facilities and staffs)
Optional choices for existing customers
Table 8. Business Model 2—buildings (small energy consumption) participate in the explicit DR via aggregators.
PartnersActivitiesValue PropositionCustomer RelationCustomers
  • Regulators
  • BRPs
  • DSOs
  • TSOs
  • Control system providers
  • Energy suppliers (retailers)
  • Access customers via energy suppliers or other channels
  • Provide consulting and analysis of customer demand pattern
  • Participate in DR market (wholesale, balancing or ancillary market)
  • Control customers’ appliances
  • Payment to customers for energy flexibility
Buildings receive direct payment by participating in the explicit DR market via aggregators
  • Payment system
  • Incentives by regulation, TSOs and DSOs
  • Consulting service (e.g., training, building energy behavior analysis)
  • Control system operations and maintenance
Buildings (who are small energy consumers)
ResourcesChannels
  • Local control system
  • Customer data (demand pattern)
  • Market information
  • energy consulting directly by aggregators
  • access customers via energy suppliers (retailers)
Cost StructureRevenue Streams
  • DR control system (customer side and aggregator side)
  • Payment to customers
  • Tariffs to DSOs and TSOs
  • Payment/compensation to BRPs
  • Market access fees to the DR markets
  • Payment from the DR market (including reserve capacity payment from TSO)
  • Incentive from TSO/DSO and regulators
Table 9. Business Model 3- buildings directly access the explicit DR program.
PartnersActivitiesValue PropositionCustomer RelationCustomers
  • Technology providers
  • TSOs
  • BRPs
  • Energy consulting
  • DSOs
  • Regulators
  • Install energy control system;
  • Analysis and integration of DR into the existing building management system;
  • Directly participate in the DR markets.
Buildings receive direct payment by providing energy flexibility to the market
  • Allow direct load control by TSOs in the reserve market as ancillary service;
  • Comply to market rules in wholesale and balancing markets
DR market (wholesale market, and ancillary service to TSOs)
ResourcesChannels
  • Energy flexibility from appliances in the buildings;
  • Building energy control systems
  • Direct participation in the wholesale and balancing market;
  • Bidding in the reserve market (there are rules for bidding and ancillary capacity, and control in the reserve market)
Cost StructureRevenue Streams
  • Employees’ salary or expert consulting
  • Control system installation/upgrade
  • Market access fee (rules for participation in wholesale and balancing markets)
  • Fees to BRPs by contract
  • Tariffs to DSOs and TSOs
  • Cost due to energy behavioral changes (influence production or occupants’ satisfaction in buildings)
  • Payment by providing demands in wholesale and balancing markets
  • Reserve capacity payment from TSOs
  • Incentive from TSOs/DSOs, and regulators
Table 10. Business Model 4- buildings access the energy market via VPP aggregators by providing DERs.
PartnersActivitiesValue PropositionCustomer RelationCustomers
  • Technology providers
  • TSOs
  • BRPs
  • Energy consulting
  • DSOs
  • Regulators
  • Install control system
  • Customer service (analysis and package deals)
Buildings can access the market with direct payment and low risk
  • Customized market access strategy
  • Payment system
  • Forecast information
  • Direct control system
Building with DERs (e.g., PV, micro-CHP)
ResourcesChannels
  • Accurate forecast of supply and demand
  • DERs
  • Direct contact;
  • Via DER technology/equipment providers;
  • Via electricity retailers
Cost StructureRevenue Streams
  • VPP control system
  • Employees’ salary (including expert payment)
  • Market access fee (rules to participate in the wholesale and balancing markets)
  • Fees to BRPs by contract
  • Tariffs to DSOs and TSOs
  • Trading via wholesale market
  • Balancing service offered to BRPs
  • Reserve capacity payment from TSOs
  • Network service offered to DSOs
Note
  • This business model canvas only focuses on the ‘independent VPP aggregators’. The scenario of the existing retailers/BRPs new role as ‘VPP aggregators’ is not considered.
  • The correlation between building types and installed DERs is not considered. However, it is important to be aware that different building types can equip different DERs due to preferences and constraints of buildings. For example, a majority of residential buildings are only equipped with PV systems, but industrial buildings, such as greenhouses, might be equipped with CHPs. The differences influence market contribution from DER owners.
Table 11. Value of four developed business models in the Nordic electricity market.
Business Model1—buildings participate in the implicit DR program via retailers2—buildings participate in the explicit DR via aggregators3—buildings directly access to the explicit DR program4—buildings access the energy market via VPP aggregators by providing DERs
Value Proposition10.511
Customer Segment10.210.210.19
Partners10.02510.125
Resources10.830.750.75
Revenue Streams0.51.11.21.7
Cost−0.5−1.4−0.5−1.4
Customer Relationship0.750.4250.750.875
Channels111.51.5
Activities10.60.671
Value of Business Model3.75≅0.17 (0.1659)≅1.34 (1.3377)≅0.77 (0.7695)
Table 12. Combined SWOT and TOWS analyses of buildings’ energy aggregation potentials.
OpportunitiesThreats
  • European Union (EU) climate and energy goals
  • Technology readiness
  • Market demands
  • Constraints of grid capacity
  • Cost reduction
  • Incentives
  • Regulation barriers
  • Limited monetary benefits
  • Slow Return on investment (ROI)
StrenghtsS-O StrategiesS-T Strategies
  • Flexible load
  • Installed DERs
  • Advanced appliances
  • Cost reduction strategies and packages of control system and DER equipment;
  • Easy and user-friendly control systems
  • Regulation changed to allow buildings easy access to the aggregation market;
  • Clear monetary benefits and incentives;
  • Analysis and service (including training) regarding consumer behavior.
WeaknessesO-W StrategiesW-T Strategies
  • No investment support
  • Constraints of daily business and energy usage pattern
  • Low capacity of energy flexibility
  • Aggregation of small consumers by DR and VPP programs;
  • Incentives from regulators, TSOs/DSOs;
  • Software support for forecast and analysis.
  • Financial support for equipment control system (e.g., loans, renting);
  • Selective market access for buildings which can have visible benefits from the aggregation market (e.g., large energy consumers, or industrial buildings with large capacity of DERs)

