Prospects of Mixtures as Working Fluids in Real-Gas Brayton Cycles


Department of Mechanical and Industrial Engineering, University of Brescia, Via Branze 38, 25123 Brescia, Italy
Energies 2017, 10(10), 1649; https://doi.org/10.3390/en10101649
Submission received: 9 September 2017
/
Revised: 7 October 2017
/
Accepted: 16 October 2017
/
Published: 19 October 2017
(This article belongs to the Section I: Energy Fundamentals and Conversion)
Abstract
:This paper discusses the thermodynamic characteristics of the closed Brayton cycles in which the compression is placed near the critical point of the working fluid. Under these conditions, the specific volumes of the fluid during the compression are a fraction of the corresponding values under ideal gas conditions, and the cycle performances improve significantly, mainly at moderate top temperatures. As the heat is discharged at about the critical temperature, the choice of the correct working fluid is strictly correlated with the environmental temperature or with the temperature of potential heat users. To resort to mixtures greatly extend the choice of the right working fluid, allowing a continuous variation of the critical temperature. These cycles have a high power density, and the use of ordinary turbomachinery is accompanied by high capacities (tens of megawatts). In the low power range, microturbines or reciprocating engines are required. One important constraint on the choice of the right working fluid is its thermochemical stability that restricts the operative temperatures. Among the organic compounds, the maximum safe temperatures are limited to about 400 °C and, forecasting high temperature applications, it could be interesting to explore the potentiality of the inorganic compounds as secondary fluids in binary mixtures.
1. Introduction
The merits and the disadvantages of open Brayton cycles are well-known. Among the disadvantages, here it is worth mentioning (see, e.g., [1], Section 1.7) the constraint fixed by the ambient pressure and the strong effects of the ambient conditions (temperature and pressure) on the design and the performances of the cycle. Furthermore is the need for high inlet turbine temperatures to achieve good thermodynamic efficiencies.
Closed Brayton cycles have been proposed for special applications when using solid or gaseous fuels of low quality and cost, nuclear energy, waste heat recovery, and solar energy ([1], Section 1.7; [2]). In one sense, resorting to closed gas cycles introduces the necessity for additional heat exchangers (at least, the primary heat exchanger and the radiator), but, on the other hand, this assures two additional degrees of freedom: (1) the choice of working fluids with preset characteristics, and (2) the choice of the minimum pressure of the engine, providing the maximum economy for the unit.
The first prototype closed-cycle gas turbine was the AK-36 plant [2,3,4] built by Escher Wyss (Zürich, Switzerland) in 1939, which used a recuperated cycle, with air as the working fluid and was fired by light oil. The turbine inlet temperature was 650 °C, with an electric power of 2 MW and an electrical efficiency of about 30%. The plant configuration was rather complex, with two shafts, three compressors and two intercoolers.
The last closed cycle with air as the working fluid was the engine built in 1985 by Garret Corporation [3] and was a 5 MW plant burning a low-grade fuel in an atmospheric fluidized bed combustor.
From then on, helium has been the preferred working fluid, mainly for the devised nuclear closed gas cycles at high temperatures [3,5].
However, different working fluids have always been considered and proposed, according to the power and to the different design conditions: helium (mainly for engines of large power size), argon, nitrogen, carbon dioxide and some mixtures.
For example, in [6], an engine of 3 kWe is discussed. In this case, the selected working fluid was argon, in accordance with the small power of the engine. The maximum and the minimum pressure were 0.69 and 0.31 bar, respectively. The inlet turbine temperature was 838 °C.
In [7], a detailed design of a unit of 12 kWe is described. The working fluid is carbon dioxide with a maximum working pressure of 6.895 bar and a pressure ratio equal to 2.
The relevant properties of mixtures as working fluids in closed Brayton cycles are, for example, discussed in [8,9]. In [10], a detailed discussion of the effects of different mixtures of helium on the cycle’s thermodynamic efficiency, on the turbomachines and on the recuperator dimensions is carried out.
In all the cited examples, the fluids revolving in the cycle are always under the condition of ideal gases, that is, at temperatures and pressures far from their dew and bubble lines.
In [11,12,13,14], the use of carbon dioxide for supercritical and condensation closed cycles is proposed. In the suggested cycles, the compression of the carbon dioxide occurs near the bubble line, close to the critical temperature (31.06 °C) and with the minimum pressure near the critical value (73.83 bar).
The compressibility factor Z for a gas near the critical point reduces, on average, to about 70% in comparison with the corresponding value under ideal gas conditions. For example, carbon dioxide at a temperature of T = 34 °C (Tr = 1.01) and at a pressure of P = 1.0 bar (Pr = 0.014) has a compressibility factor of Z = 0.995 (that is, it is completely similar to an ideal gas); at the critical point, Z is 0.274.
A significant reduction in the compressibility factor, as a consequence, reduces the compression work. Thus, closed Brayton cycles with a minimum temperature and a minimum pressure near the critical values are characterised by a relatively small compression work, in comparison to the expansion work even at a reasonably low maximum temperature. The outcome is a positive efficiency at low maximum temperatures also (τ = 1.5 − 2.0, rather than τ = 3.5 − 4.0).
In Table 1 are reported the critical compressibility factor, the critical temperature and the critical pressure for some fluids. As the minimum temperature of the cycle has to be near the ambient temperature, carbon dioxide, with its critical temperature of about 31 °C and its benign properties, is naturally a favorite candidate working fluid.
On the other hand, whether the average ambient temperature is rather high (for example, in desert areas—where cooling water is not available—considered suitable for the thermodynamic conversion of the solar energy), or when one wishes to design cogeneration systems, a critical temperature of about 30 °C could be too low and could jeopardize the advantages of the real-gas’ low compressibility. In such situations, one must resort to other working fluids. In this context, the mixtures could play an important role.
Another favourable real-gas effect in closed Brayton cycles is the presence of reversible dissociation and association chemical reactions. A significant example is the suggestion to recourse to nitrogen tetroxide (N2O4) as a working fluid [17,18,19].
Normally, nitrogen tetroxide is an equilibrium mixture of di-nitrogen tetroxide, nitrogen dioxide and nitric oxide, according to N2O4 ⇌ 2NO2 ⇌ 2NO + O2. In one atmosphere, the first step of the reaction occurs at relatively low temperatures; the second step occurs between 240 and 850 °C [19]. The specific volume is doubled when the first step is completed and tripled after the second step; this fact, together with the released and the absorbed reaction heats, introduces beneficial effects on the cycle thermodynamics.
In the following, the real-gas effects on the thermodynamics of the closed Brayton cycles are illustrated, and the potential role of mixtures is pointed out. Although a discussion about reactive systems is also interesting, only the results strictly related to the compressibility effects are presented and summarized here. All the thermodynamic calculations were developed by the Peng–Robinson equation of state ([15], Section 4.6) and the program AspenPlus 7.3. A simple cubic equation of state certainly does not give a very accurate description of the peculiar thermodynamic properties near the critical point. Nevertheless, it grasps the basic thermodynamic key features, and, as it is simple and easily extended to many different fluids and mixtures, it is adequate for our aims. For example, in [20], the average errors connected with the equation are stated to be 1.14% and 0.13% for predicting the critical temperatures and pressures of 32 different mixtures, respectively. In [21], the overall average error, for 22 compounds, in the prediction of the specific volumes was declared to be about 5% in the supercritical region.
2. The Basic Thermodynamics of the Real-Gas Brayton Cycles
In this Section, with reference to carbon dioxide and to the cycle scheme in Figure 1, the fundamental aspects of the thermodynamic features of “real-gas” closed Brayton cycles are discussed. Here, only the effects of the variation of the compressibility of the working fluid are considered.
For all the following calculations, the assumptions of isentropic compressor and turbine efficiencies of 0.85 (most comprehensive of the mechanical and electrical efficiencies) and no pressure-drops (unless specified) were adopted. For simplicity, all the parameters were assumed to be constant, independently of the compression ratios and the working fluid.
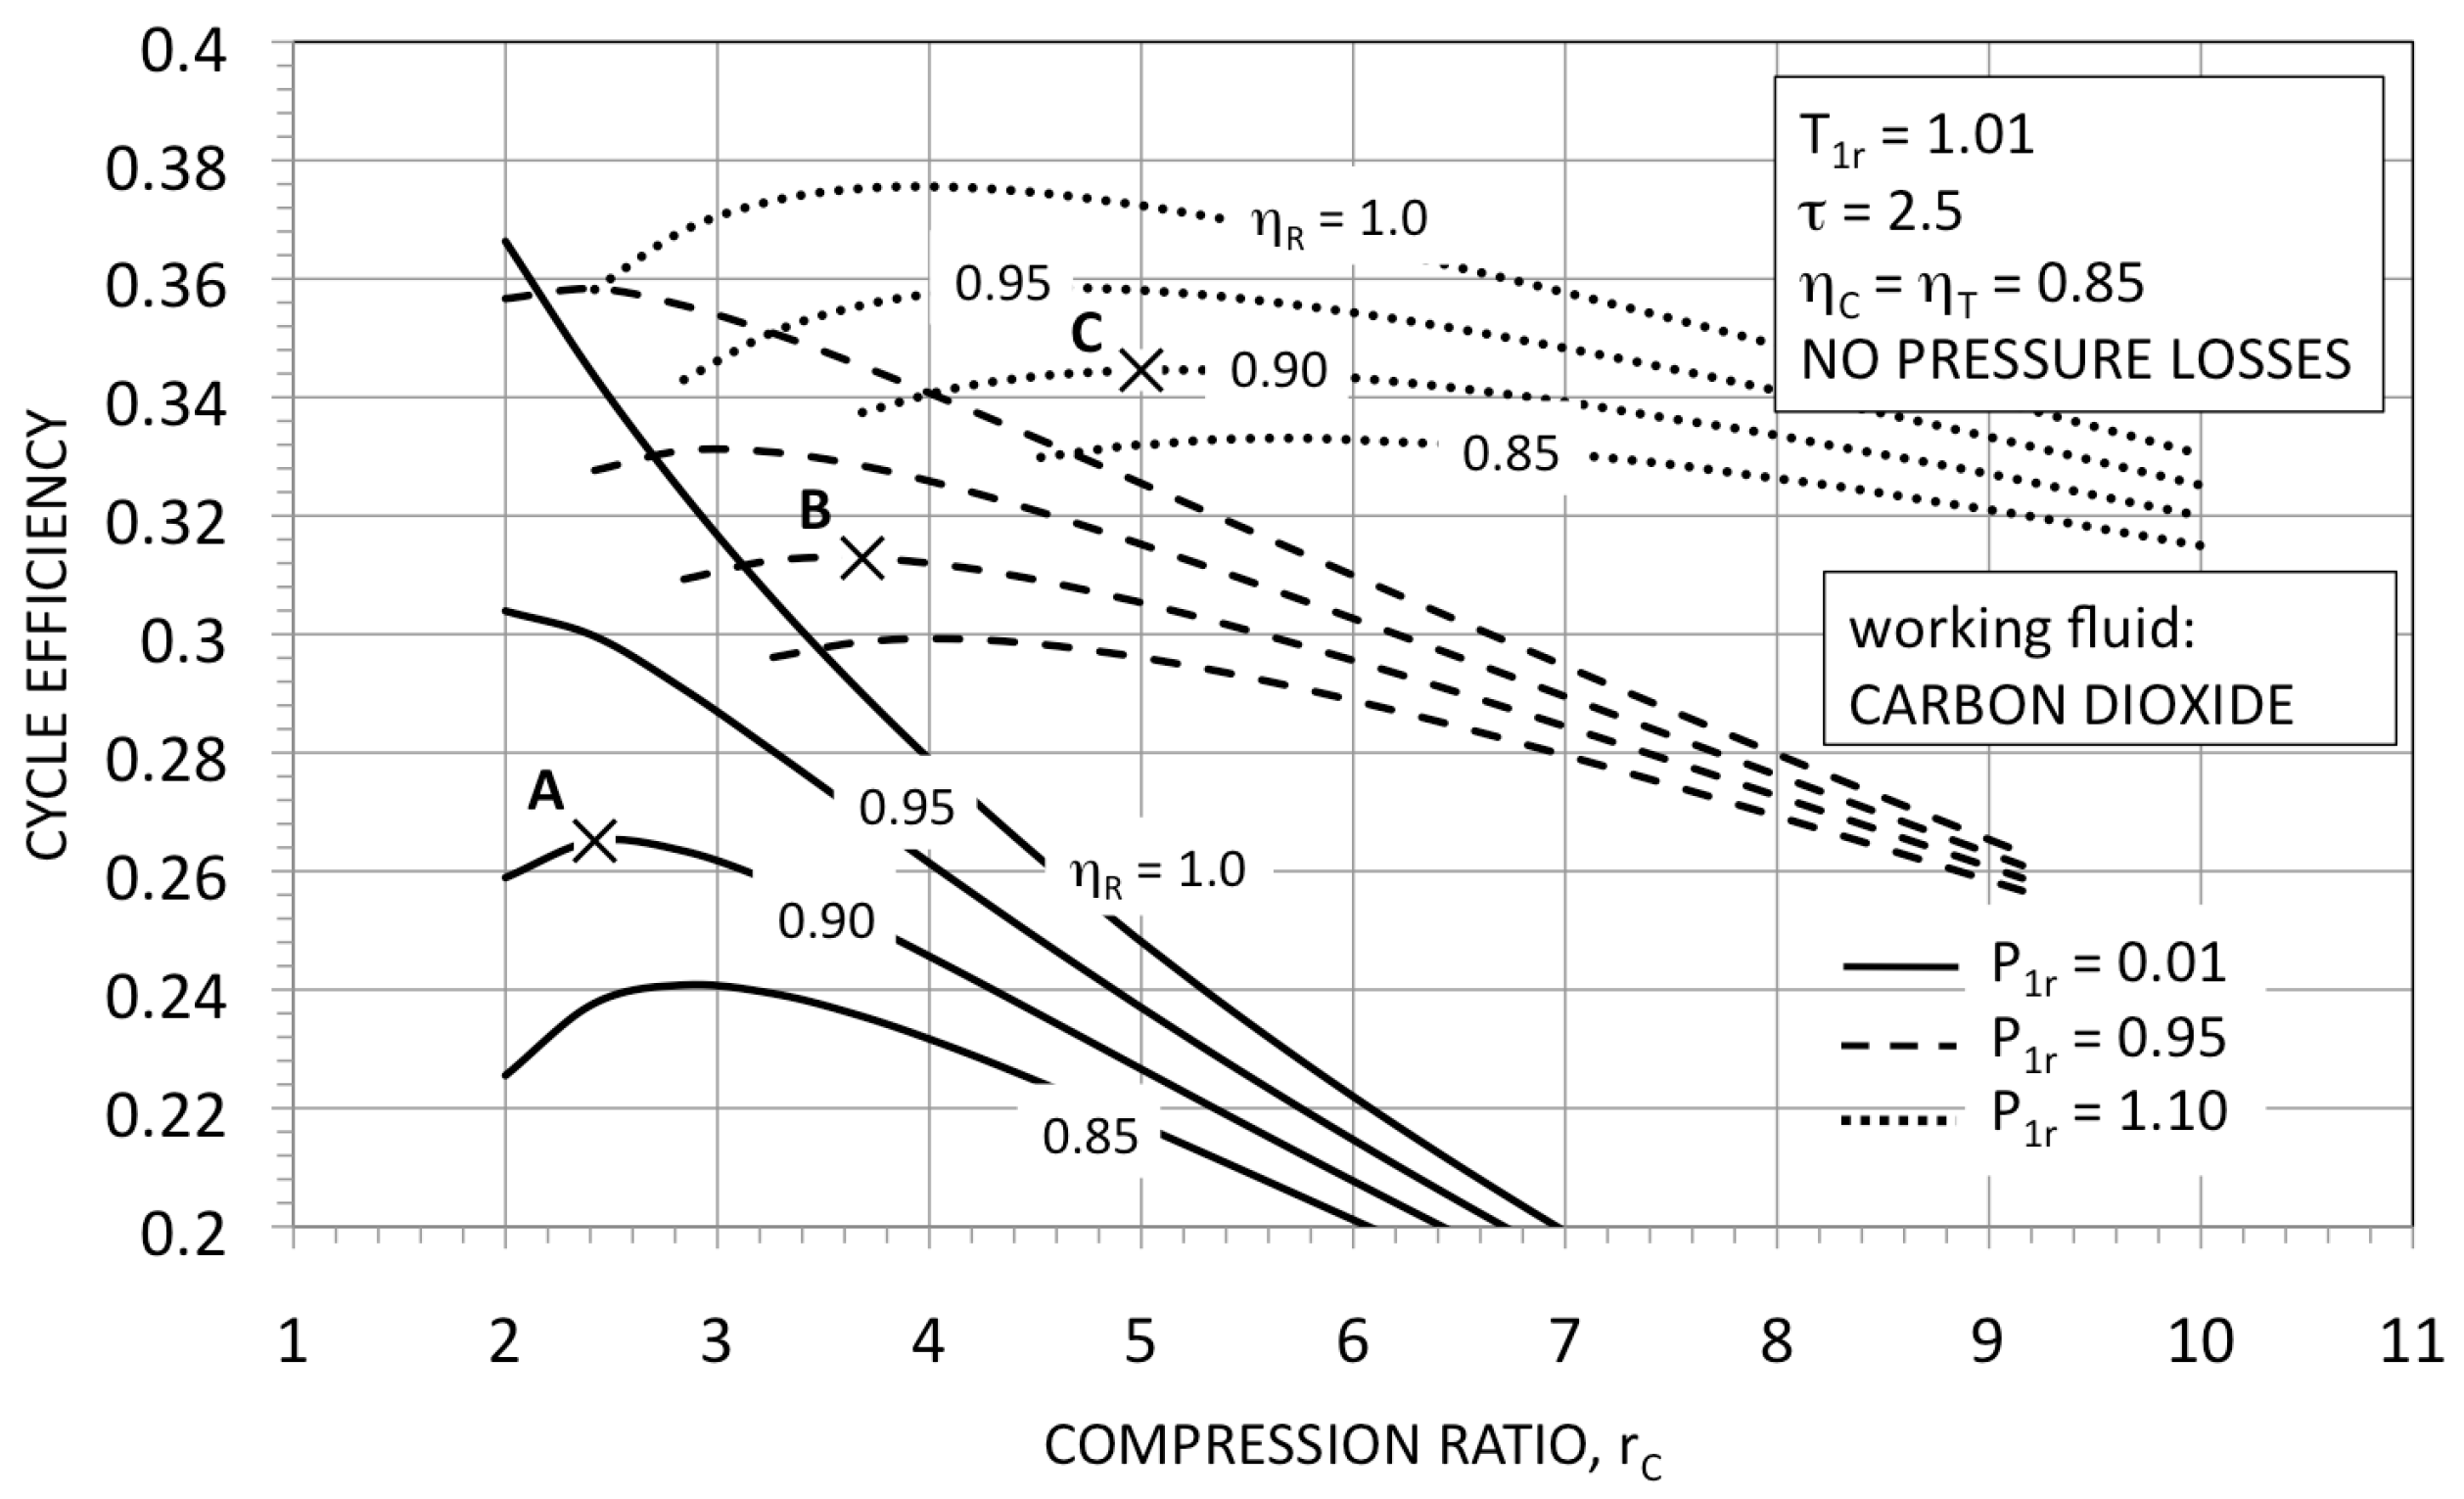
Figure 2 reports the thermodynamic efficiency of closed Brayton cycles as a function of the compression ratio rC. The ratio τ = T4/T1 is fixed on 2.5, the reduced temperature is 1.01, and the minimum reduced pressure varies from 0.01 to 1.1.
Assuming, as a reference, a recuperator efficiency of , the points “A”, “B” and “C” represent the thermodynamic efficiency for Brayton cycles with carbon dioxide under ideal gas conditions and with significant real-gas effects.
Cycle A has an efficiency η of 0.265 at , cycle B has η = 0.313 at , and cycle C has at . With increasing , the thermodynamic efficiency and the optimum increase. In general, the optimum efficiency is obtained at [22].
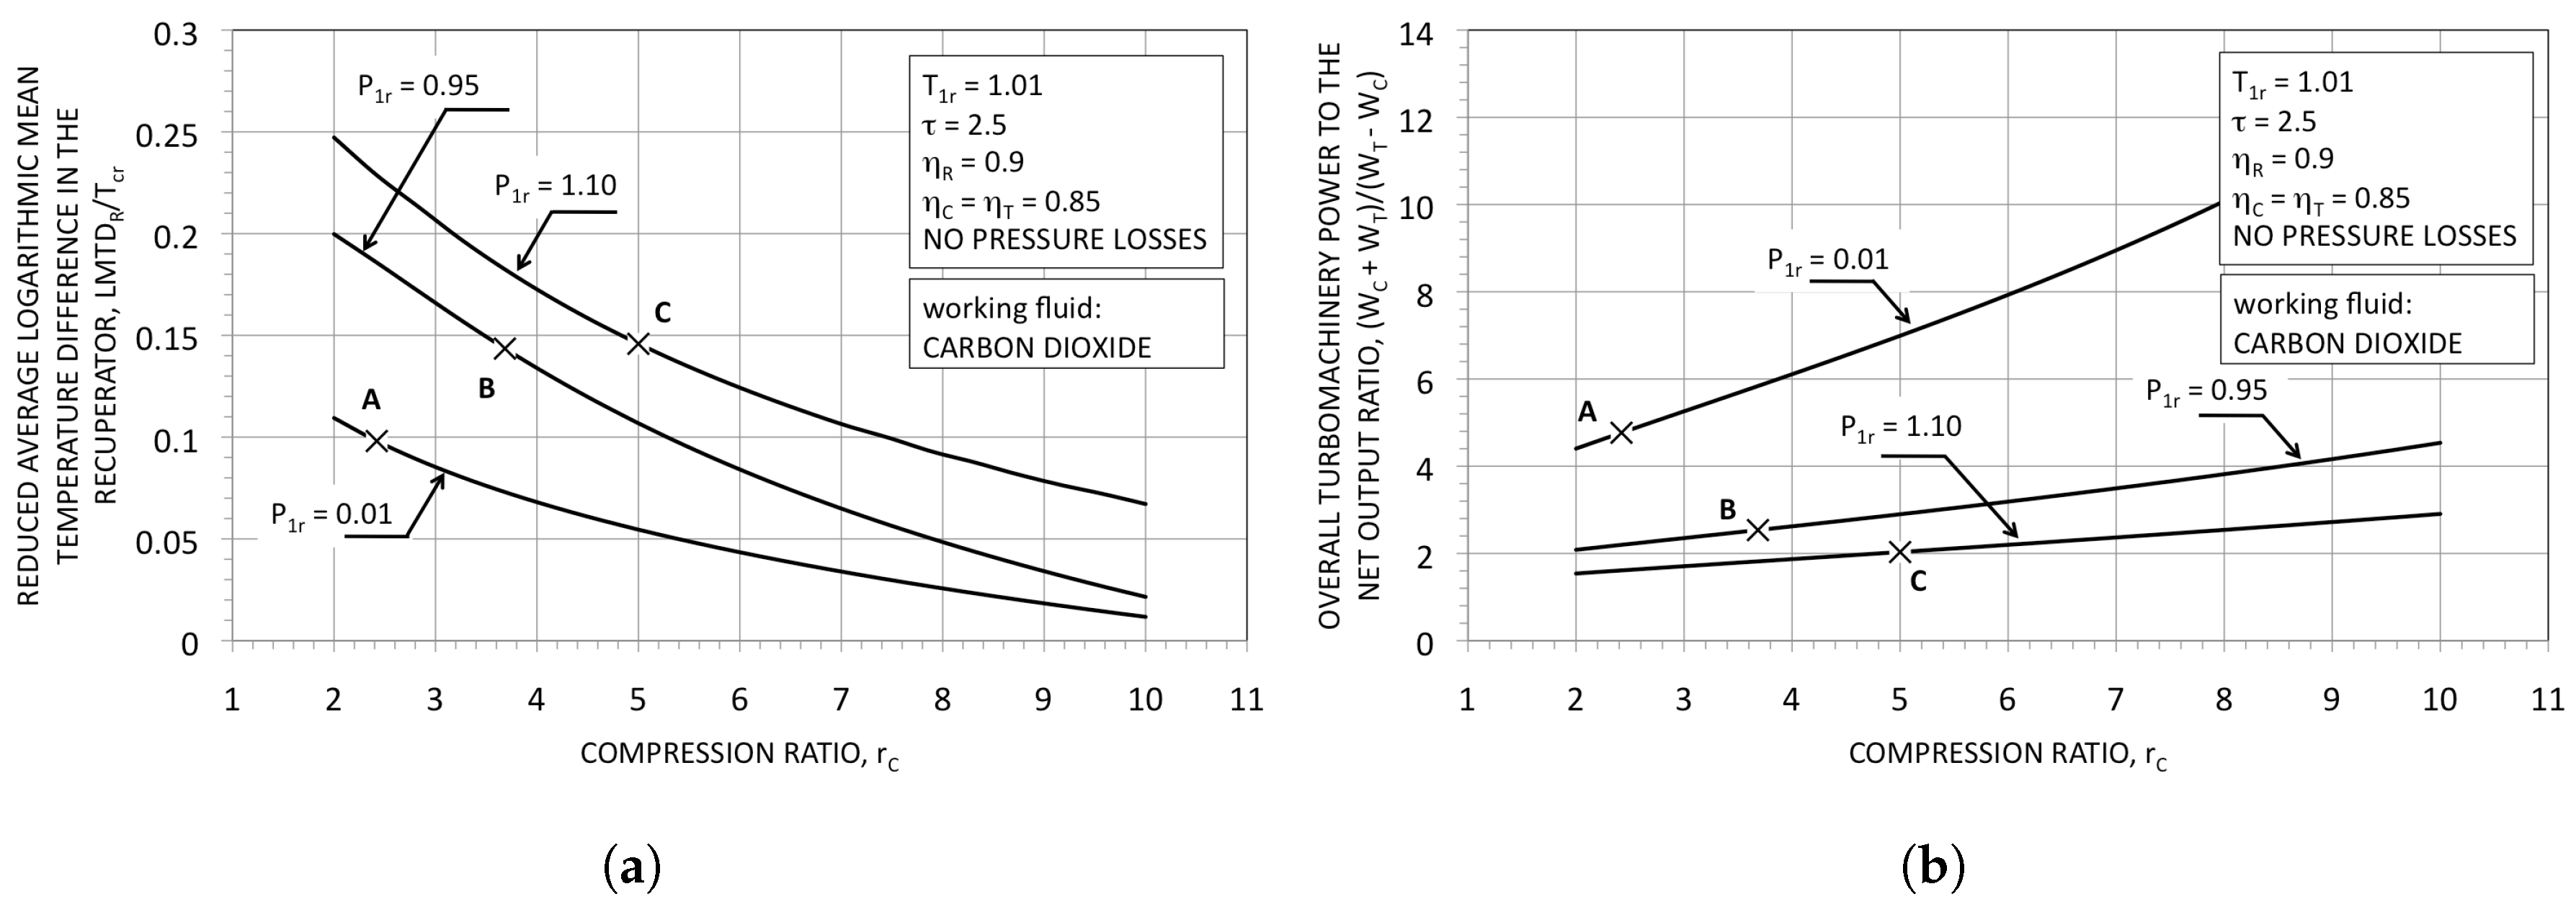
In Figure 3, in the T–S plane, cycles A and C are plotted. Cycle D, with a temperature of , is also reported for comparison. As it clearly appears from the figure, (fixed recuperator efficiency), the temperature difference is greater for cycles C and D than for cycle A. This is the consequence of the considerable difference in the heat capacities of the high pressure and of the lower pressure streams in the recuperator.
The result is a greater average logarithmic mean temperature difference in the recuperator (see Figure 4a) and a greater thermodynamic loss. This disadvantage is largely compensated for by the reduction of the overall turbomachinery power to the net output power ratio (see Figure 4b). The net result is a higher thermodynamic efficiency for real-gas cycles in comparison with the ideal gas cycles.
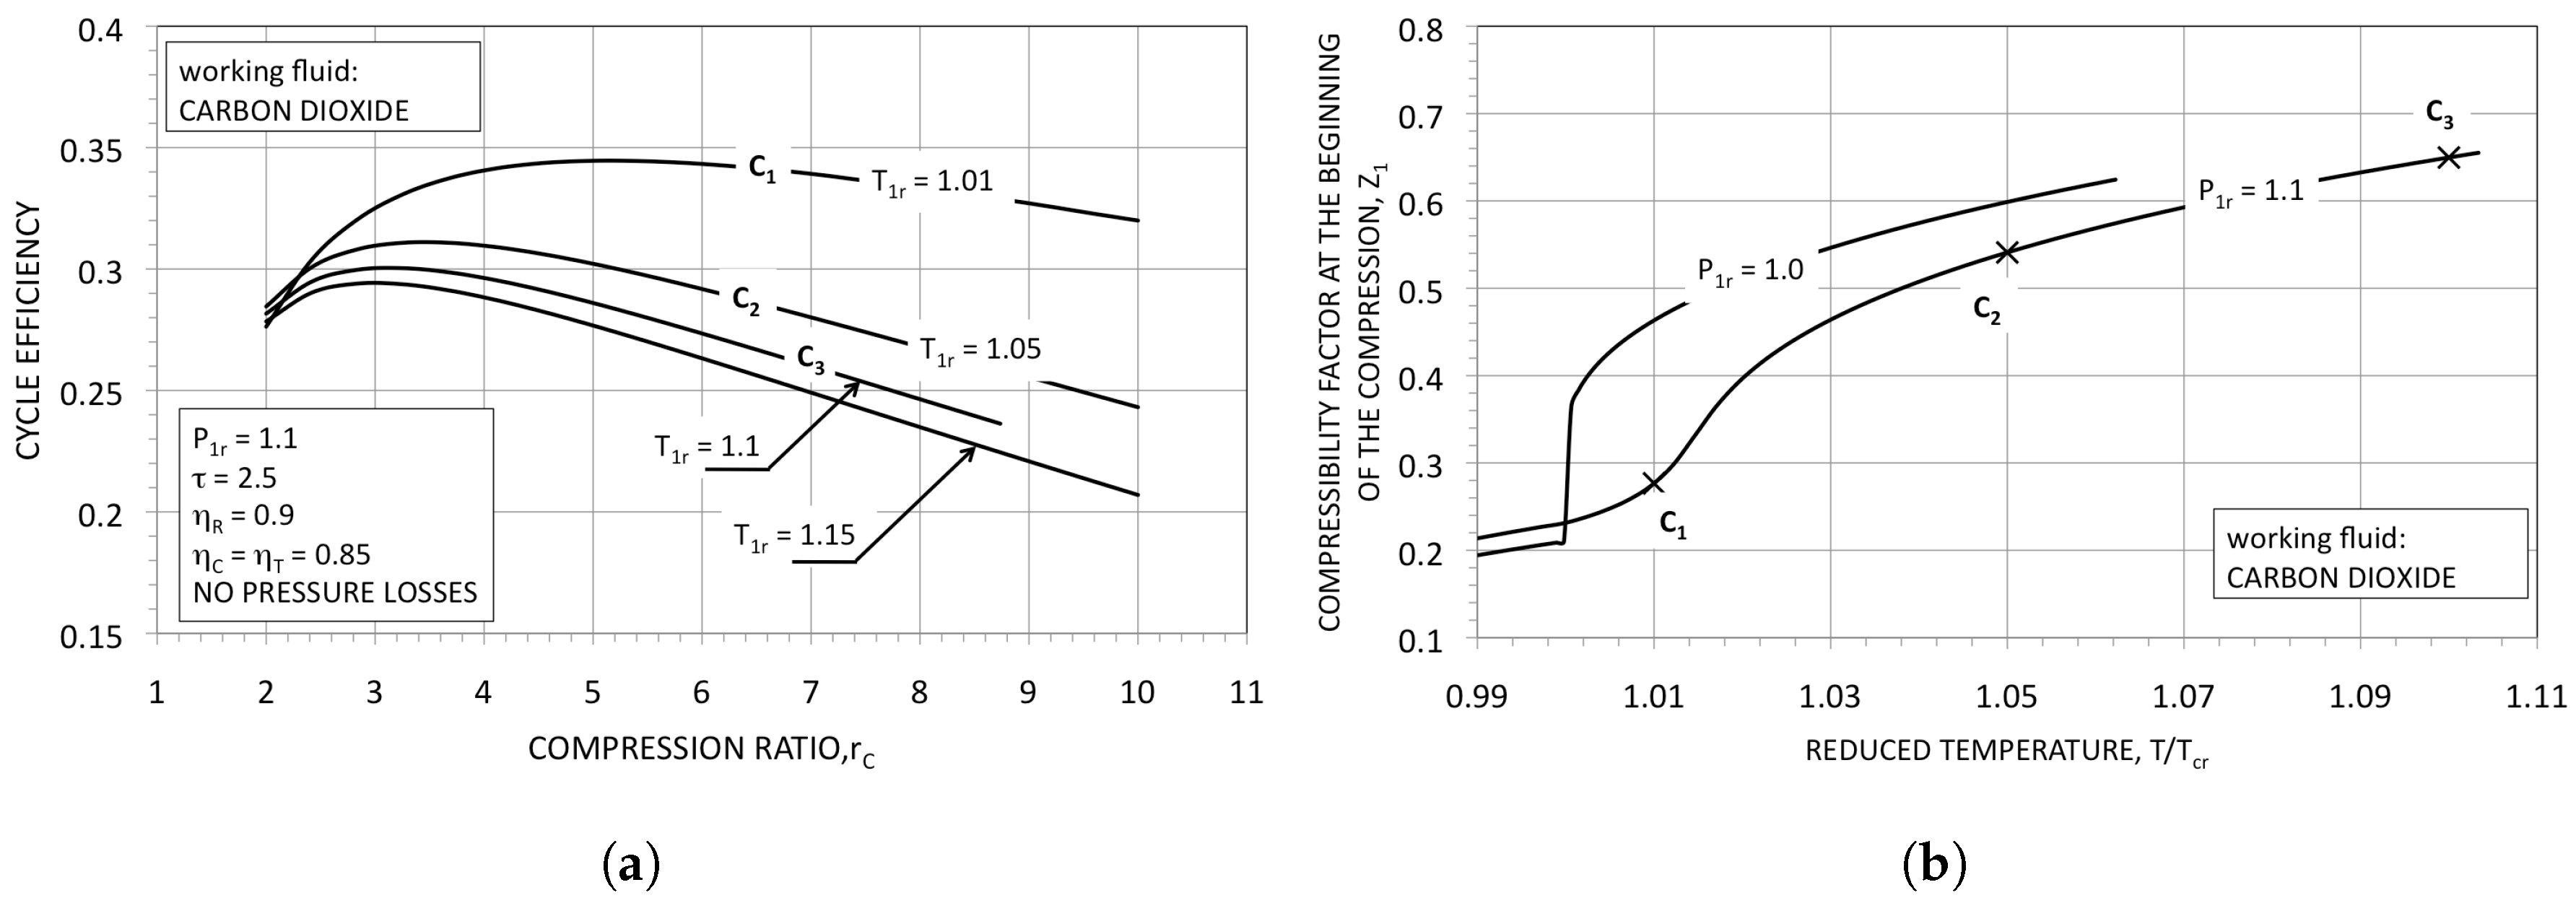
The effects of the minimum temperature on the thermodynamic efficiency are shown in Figure 5a. Increasing from 1.01 to 1.05 reduced the maximum efficiency to about 0.034 points. When (corresponding to a temperature of about 60 °C for carbon dioxide) the efficiency η was 0.3, against a value of 0.344 at . The reason for this significant reduction in the cycle efficiency was the increase of the compressibility factor Z at the beginning of the compression (see Figure 5b); from to , Z was raised from 0.28 (point C1) to 0.65 (point C3).
Good cycle efficiencies are obtainable only if the compression begins very close to the critical temperature, which, in turn, should be close to that of the environment or to that of a possible user of the discharged heat (in the case of a cogenerative engine).
The positive consequences of the real-gas effects are impressive at low temperature ratios τ. For (T4 = 187 °C), when (ideal gas conditions; Figure 6a), no practical cycles are possible; on the other hand, if (Figure 6b), the maximum cycle efficiency results (according to the assumed parameters) in about 0.147, or 44% of the ideal value. Higher values of τ reduce the difference in the cycle efficiencies; when τ = 3.0, the maximum efficiencies result in 0.339 and 0.406 for the case of an ideal gas and a real gas, respectively.
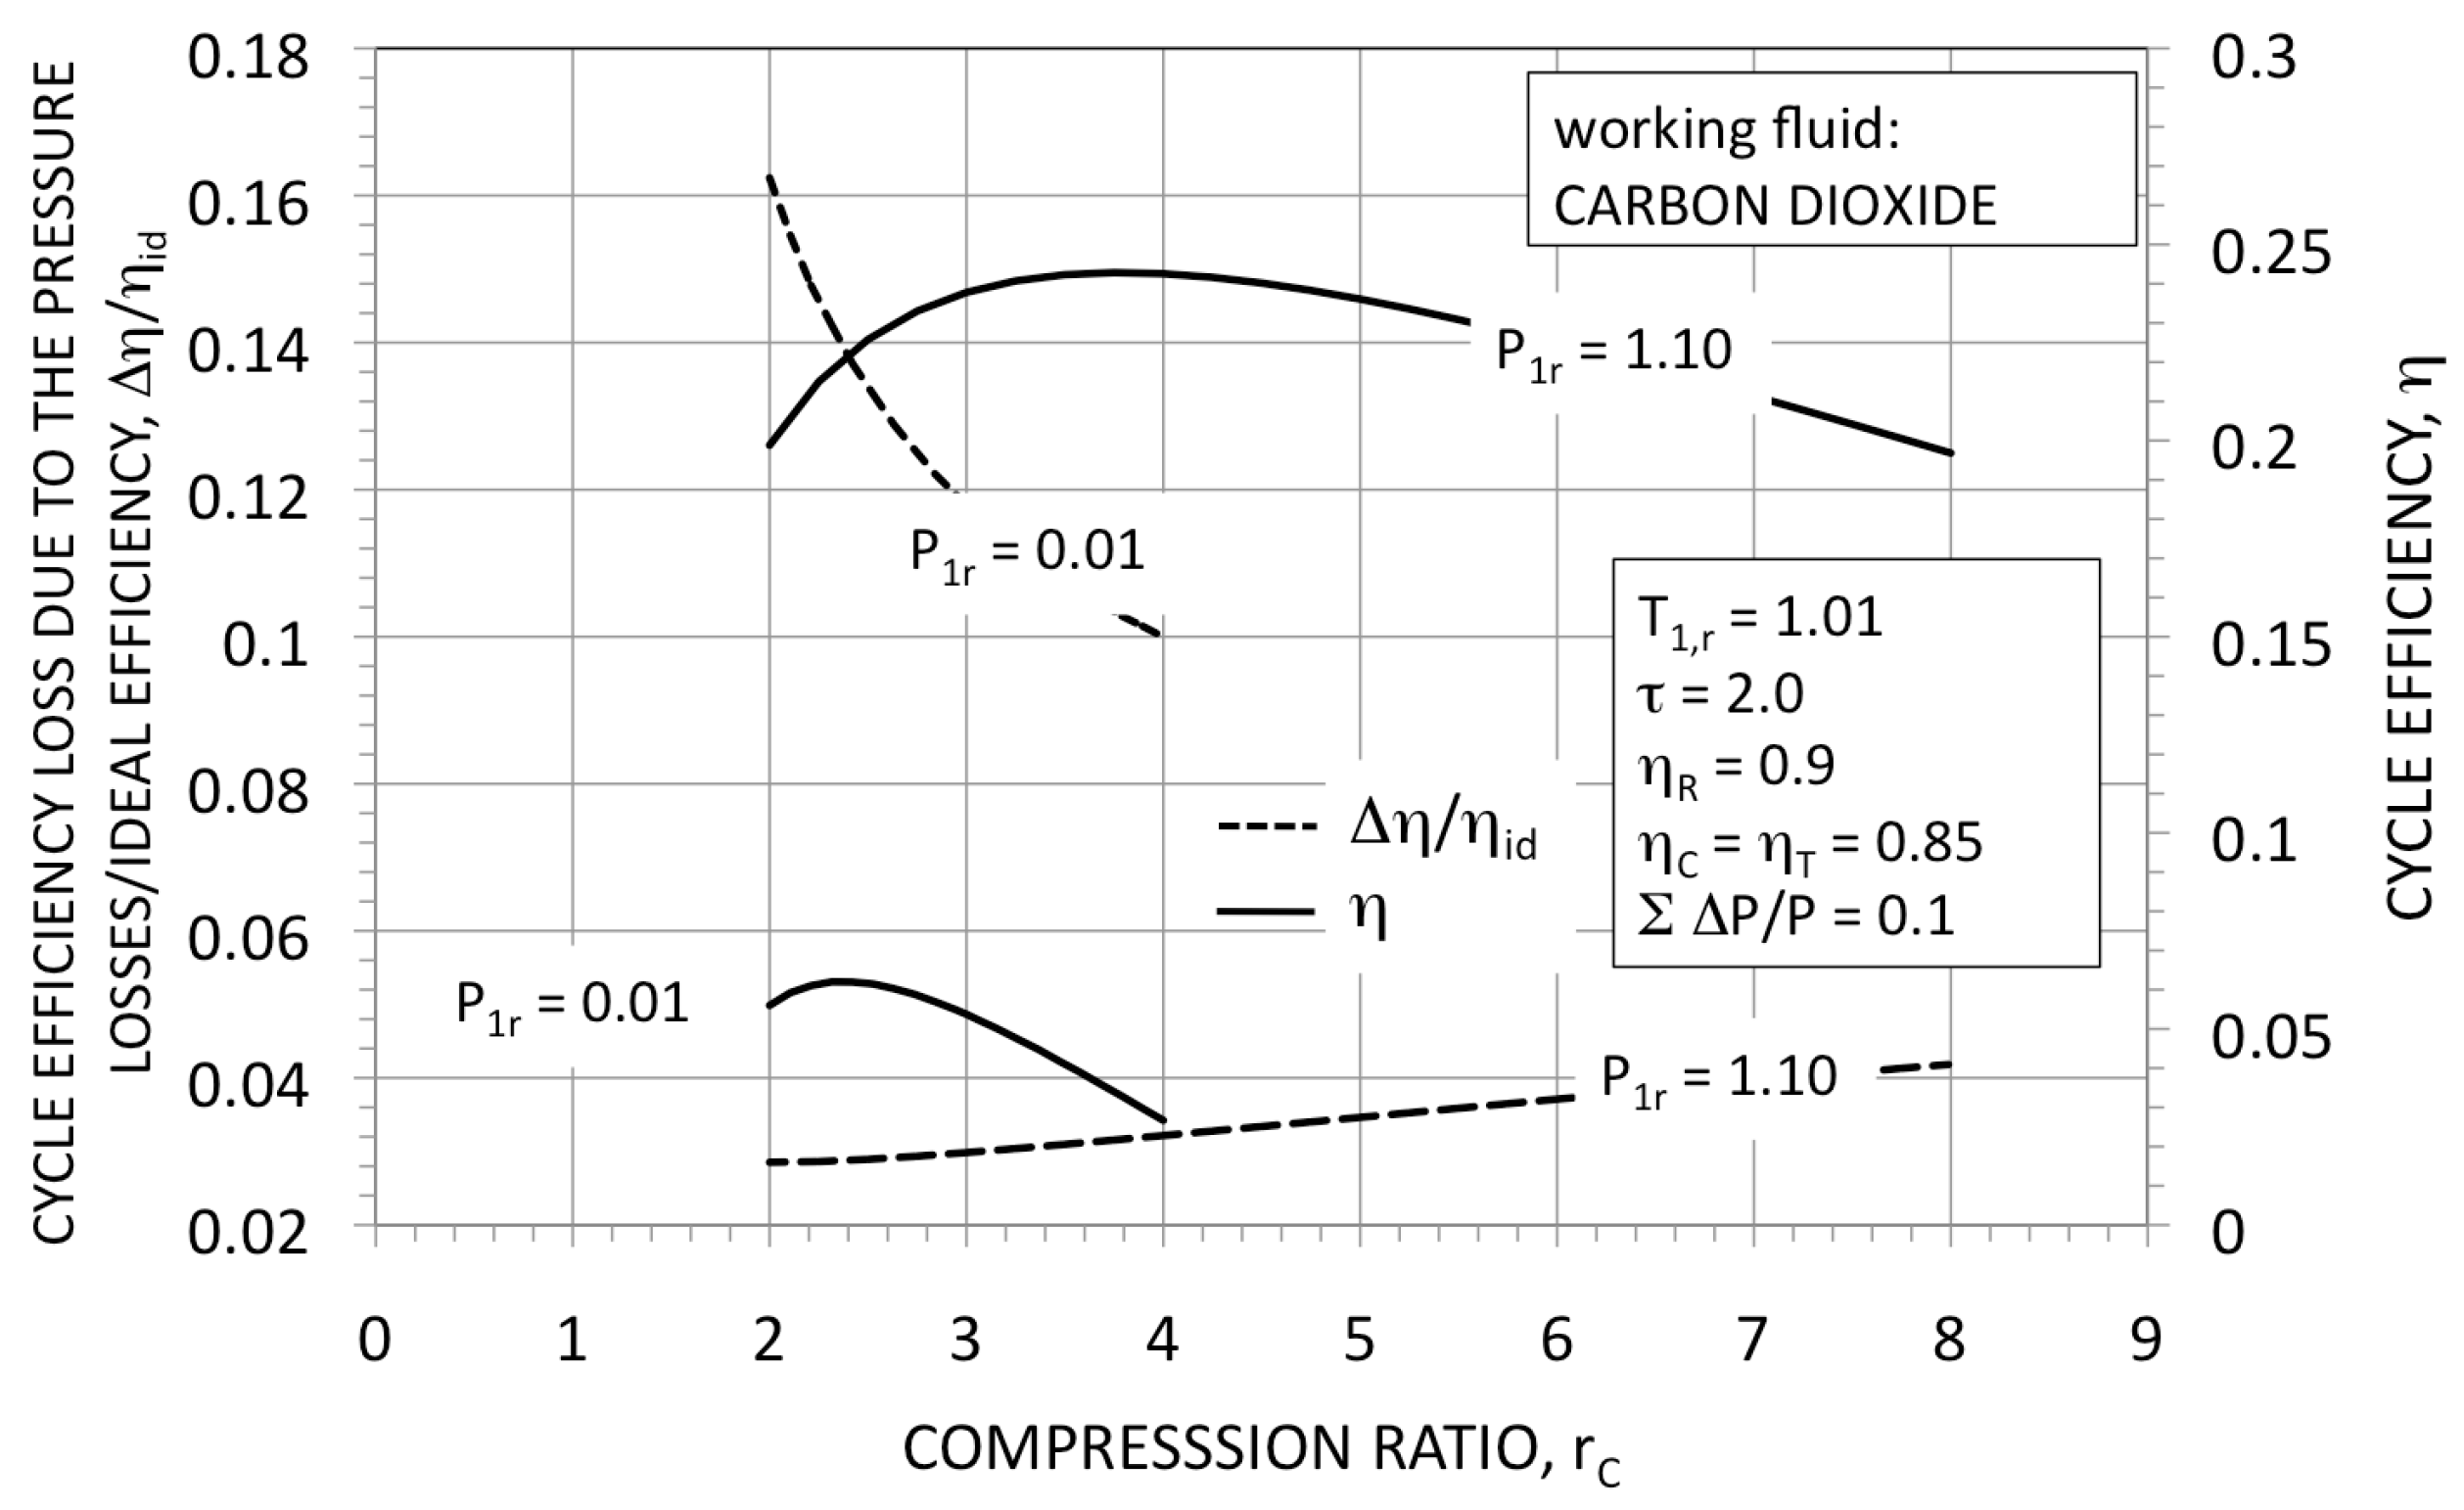
Figure 7 gives an indication of the effects of the pressure losses on the cycle efficiency in the cases of ideal and real-gas cycles. In the considered example, at the optimum conditions, the loss efficiency connected with the pressure loss, in the case of the working fluid under ideal gas conditions, is about 4.5 times greater than the corresponding value for the real-gas cycle.
Table 2 lists some fluids (hydrocarbons, and perfluoro and halogen compounds) that are all potential candidates as working fluids in closed Brayton cycles for power generation and for combined heat and power (CHP) systems. Among the halogen compounds, there are may fluids with critical temperatures ranging from about 30 to about 100 °C. Aside from environmental and safety restrictions, one limiting constraint in the use of a fluid in real-gas Brayton cycles is its thermal stability and material compatibility at (relatively) high temperatures. Furthermore (see, e.g., [23]), near the critical point, the physical properties of the fluids change remarkably, and, in general, they are not available with the required precision.
However, the potentiality of the real-gas Brayton cycles seems higher, and the topic deserves broad experimental and numerical research.
Figure 8 shows a comparison of some different fluids: xenon (monoatomic), carbon dioxide, sulphur hexafluoride, and the refrigerant R-134a. The final two fluids are similar in their molecular complexity. As a general rule, the maximum cycle efficiency and the optimal compression ratio increase with the molecular complexity of the working fluid.
3. The Thermodynamics Performances of the Mixtures
As discussed in Section 2, when the waste heat rejection temperature is selected, the critical point of the working fluid is fixed as a consequence. The mixing of two different fluids could offer an effective tool to obtain working fluids with a continuously variable critical temperature.
The liquid–vapour critical point of a mixture is defined as the point at which the liquid and the vapour phases have identical properties [26]. Because, in a mixture, there exists a temperature “glide” between the bubble and the dew lines, the critical point (subjected to well-defined equilibrium conditions [20]) is generally not the coexistence point of the two phases at the maximum temperature and pressure ([27], Section 8-5). This apparent anomaly is responsible for the “retrograde condensation” [26,27] (Section 8-5), and, from our point of view, the outcome is the difficulty in selecting the minimum pressure and temperature of the supercritical Brayton cycle.
Furthermore, the shape of the critical locus depends on the relative size of the components, and on the molecular structure and the chemical nature of the components [26]. Under some conditions, the components cannot be completely miscible, and the partial miscibility can form a critical locus between liquids or with the coexistence of three phases. All these complex circumstances result in the need for experimental data and good thermodynamic models.
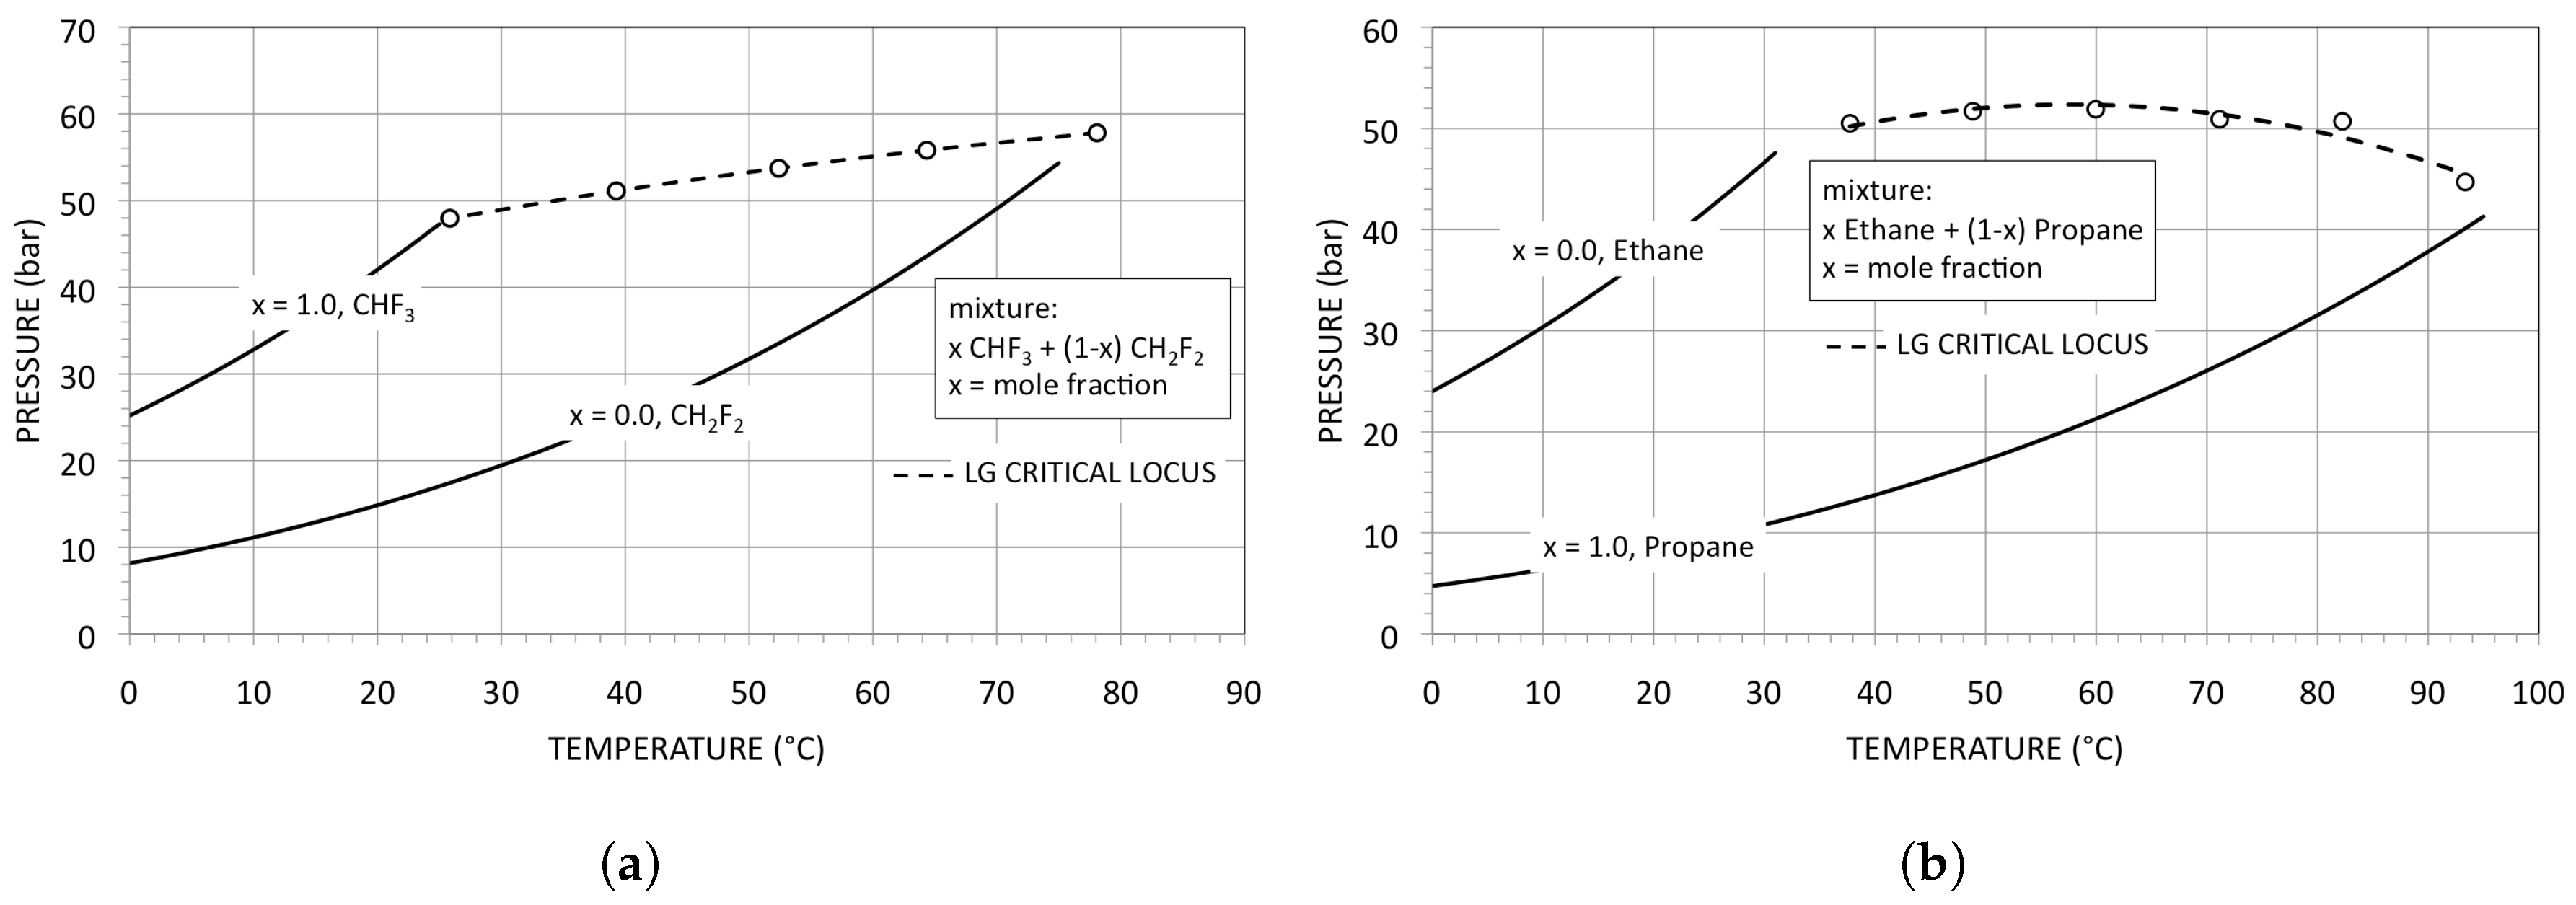
Figure 9a shows the liquid–gas (LG) critical locus of a mixture of two refrigerants. As the size of the molecules is similar and the two components belong to the same chemical family, the critical locus varies almost linearly with the molar composition. Figure 9b shows the critical locus for mixtures of ethane and n-propane; by varying the composition, the critical pressure reaches a maximum value greater than the critical pressures of the two pure components.
In Figure 10, the LG critical loci of two mixtures of carbon dioxide are reported. Carbon dioxide is now considered a good working fluid for power conversion systems in nuclear or concentrating solar power plants, at maximum temperatures of 500–700 °C [30]. This could be, in principle, also used for other applications at lower maximum temperatures (200–400 °C), for example, in geothermal advanced systems or for waste heat recovery.
The mixing of carbon dioxide and n-butane (C4H10, a relatively simple hydrocarbon molecule) gives a sensible non linearity in the variation of the critical pressure (see Figure 10a). The mixing with sulphur hexafluoride (SF6; see Figure 10b) even results in a considerable reduction in the critical temperature and pressure of the mixture, with unexpected results.
The cited examples show that the correct estimation of the LG critical locus for mixtures is generally difficult, and that the calculations have to rely on high-pressure vapour liquid equilibrium (VLE) experimental data.
The choice of the components of the mixtures is strictly correlated with their thermal stability, as this limits the maximum operational temperature. Thus, for example, using carbon dioxide as the main component, the other must ideally have at least the same thermal stability as the carbon dioxide.
Among the organic substances, the most thermally stable fluids are the aromatic or polyaromatic compounds, possibly perfluorinated. Among these, toluene is known as thermally stable at a high temperature, and it is considered a good working fluid in the “high-temperature organic Rankine cycles”; at 400 °C, its rate of decomposition is the same of that of n-pentane at 315 °C [31].
Figure 11 shows the LG critical locus for mixtures of carbon dioxide and toluene. The figure also reports pressure–temperature curves for mixtures of different composition; a mixture of about 5% toluene has a critical temperature of about 50 °C and could be used in Brayton cycles using air condensation in relatively hot environments. Unfortunately, as a result, the critical pressure is rather high: about 100–110 bar (see Figure 11).
Figure 12a shows the temperature–entropy plane; the limit curve of the mixture (x = 0.95 carbon dioxide and toluene) is compared with the limit curves of the pure carbon dioxide () and of the pure toluene (). In Figure 12b, the limit curves for mixtures of refrigerant HFC-23 and refrigerant HFC-32 are instead represented. The mixture of the two considered refrigerants is more regular than the mixture of carbon dioxide and toluene, and it has moderate temperature glides and lower critical pressures. In both considered mixtures, the resulting critical temperature is about 50 °C.
The thermodynamic cycle efficiency and the turbine inlet pressure for the selected mixtures are shown in Figure 13. Temperatures and were set at 53 and 350 °C, respectively.
For the assumed parameters, the efficiency of the pure carbon dioxide cycles’ results were lower in comparison with the cycles using mixtures; at bar, the maximum thermodynamic cycle efficiency of carbon dioxide (point H in Figure 13, at bar) was 0.047 and 0.035 points lower than the cycle efficiency of the cycle with the equi-molar mixtures of refrigerants (point E, bar) and the mixture of carbon dioxide and toluene (point F, bar), respectively. The cycle corresponding to point F had a thermodynamic efficiency lower than that of cycle E by about 0.012 points. The recuperated thermal power per unit of useful work, , resulted in 3.1 and 5.9 for cycles E and F, respectively. In Figure 14, the ratio is reported as a function of the cycle efficiency for carbon dioxide cycles with bar and for the same two mixtures in Figure 13. Additionally from this point of view result cycle E’s advantages: the ratio is about 0.11, against about 0.28 for cycle F.
In the considered examples, strictly from the thermodynamic point of view, cycle E with the refrigerant mixture is better than that with the carbon dioxide mixture (cycle F), but the thermal stability of the two refrigerants at 350 °C is questionable.
As a comparison, in Figure 13 are also reported the results for cycles with pure HFC-32. Given their critical temperature of about 78 °C, these allow a condensation thermodynamic cycle at 53 °C with the compression in the liquid phase (on the bubble line) and the expansion in the gas phase. The maximum thermodynamic cycle efficiency of 0.259 occurs at point G, that is, a value of 0.023 points higher than the value corresponding to that at point E. On the other hand, it is well known that the condensation cycles (fixed maximum and minimum temperature) have better thermodynamic performances than Brayton cycles. In fact, in the considered example, 77% of the discharged heat in cycle G was transferred at the minimum cycle temperature. When the temperature is that at which the heat has to be discharged and when the available working fluid allows it, the condensation (at constant temperature) is generally the better choice from the thermodynamic point of view.
In Figure 15 are reported the two real-gas cycles corresponding to points E and F of Figure 13. The mixture of refrigerants, with a greater molecular complexity, has an optimum thermodynamic efficiency at a compression ratio of about 4.0, against an optimum compression ratio of 2.5 in the case of the mixture of carbon dioxide and toluene. The high critical pressure of the mixture of carbon dioxide (see Figure 11 and Figure 12a) gives very high maximum optimal pressures.
Regarding the main components of the engine, in general, turbomachines, compared to those in the cycles with ideal gases, will be more compact (fixed power size and operative temperatures), as the flow area depends mainly on the fluid density. The number of stages, strictly connected with the molecular weight, depends of the nature on the working fluid used. The rotation speed could be high, according with the power level, and, for small engines, one may devise the use of volumetric expanders and compressors.
With regard to the recuperator, and with reference to any of the two flow streams, for the ratio between the power friction and the exchanged thermal power, the following relation applies [1] (Section 1.7.4):
where v is the mean flow velocity, μ is the fluid viscosity, k is the fluid thermal conductivity, is the isobaric heat capacity of the working fluid, and is the logarithmic mean temperature difference in the heat exchanger. In the supercritical region, increases threefold or fourfold, with respect to the corresponding values under the ideal gas conditions [34]. It is therefore reasonable to expect an appreciable reduction in the pumping power per unit of exchanged thermal power. The volume and the weight of the recuperator are difficult to predict, as they are conditioned by the chosen geometry.
4. Conclusions
In the previous sections, the considerable advances in the specific work and in the cycle efficiency due to the real-gas effects have been shown. These results are the consequence of the compression occurring near the critical point of the working fluid.
These positive effects are more important at moderate turbine inlet temperatures, allowing the use of ordinary materials and the extension of the number of the potentially useful heat sources. On the other hand, the minimum pressures (near the critical pressure) are generally rather high; as a consequence, the optimum inlet turbine pressures could become very high, up to 200–300 bar, according to the maximum-to-minimum temperature ratio and to the working fluid. As an outcome, a large power density is obtained, with small turbomachinery rotating at a high speed. As a rough example, for a power size of 10 MW, a single, full-admission, stage axial turbine with a mean diameter of 15–16 cm and a rotating speed of 30,000 rpm can be designed. The resulting turbomachinery efficiencies are good, considering the limited volumetric expansion ratios, provided that the power is suitably high. Lower power sizes demand micro-turbocompressors or reciprocating engines. The working fluid critical temperature has to be close to the waste heat rejection temperature (e.g., about 30–50 °C for power generation and 50–100 °C for CHP units). This limits the availability of inorganic working fluids and forces us to choose among the organic fluids.
The use of mixtures, allowing a continuous variation of the critical point of the resultant fluid, greatly extends the range of choice. In any case, the thermal stability limits the maximum operating temperatures. Among the organic compounds, aromatics, polyaromatics and aromatic perfluorocarbons have the highest thermal stability, but is unlikely that they can work with continuity and without decomposition at temperatures greater than 400–450 °C.
For higher operating temperatures, it could be interesting to explore the potential use of inorganic compounds (e.g., nitrogen tetroxide) as secondary component in binary mixtures. For example, intense research and industrial activity are in progress with regard to closed real-gas carbon dioxide Brayton cycles, focusing on high-temperature applications (650–750 °C), with challenging problems in the material choice. The use of mixtures, provided that suitable working fluids are identified, could contribute to achieving high efficiencies with lower maximum temperatures, relaxing the material constraints.
As shown, a mixture of carbon dioxide (as the primary component) and a second substance allows for a variation of the critical temperature and an adaptability to any environmental temperature, assuring good thermodynamic performances. However, the second component of the mixture must have a thermal stability comparable to that of the carbon dioxide. Despite this, in high-pressure engines, as for the closed gas cycles discussed here, the effects of a minimum decomposition of one of the components of the mixture likely does not substantially affect the thermodynamics, provided that the thermochemical degradation of one fluid does not cause massive scaling or corrosion.
As closed cycles are suited for external heating or for external combustion, among the potentially interesting applications of real-gas Brayton cycles is the use of biomass in sites not connected to the grid. This feature, together with the possibility to operate efficiently even at moderately high temperatures and with the basic simplicity of the cycle configuration, makes this type of engine interesting for developing countries. Clearly, it goes without saying that significant improvements in the thermodynamic efficiency can be obtained with more sophisticated configurations, for example, resorting to re-compression: a practice extensively proposed in closed carbon dioxide cycles.
Conflicts of Interest
The author declares no conflicts of interest.
Abbreviations
The following abbreviations, symbols and subscripts are used in this manuscript:
| Combined heat and power | |
| Liquid–gas | |
| Logarithmic mean temperature difference in the recuperator, °C | |
| Vapour–liquid equilibrium | |
| P | Pressure, bar |
| Critical pressure, bar | |
| Reduced pressure () | |
| H | Specific enthalphy, J/kg |
| Recuperated heat in the thermodynamic cycle (; see Figure 1), J/kg | |
| Recuperated thermal power in the thermodynamic cycle (), W | |
| The product of the total heat transfer coefficient by the heat transfer area in the recuperator, W/K | |
| Mass flow rate, kg/s | |
| R | Gas constant, J/kg/K |
| S | Entropy, J/kg/K |
| Compression ratio (; see Figure 1) | |
| T | Temperature, °C or K |
| Critical temperature, °C or K | |
| Reduced temperature () | |
| Compressor work, J/kg | |
| Turbine expansion work, J/kg | |
| x | Molar fraction |
| Z | Compressibility factor () |
| Critical compressibility factor () | |
| Useful work (), J/kg | |
| Useful power (), J/kg | |
| ρ | Density, kg/m3 |
| Critical density, kg/m3 | |
| η | Cycle efficiency |
| Isentropic compressor efficiency | |
| Ideal maximum cycle efficiency (; see Figure 1) | |
| Isentropic turbine efficiency | |
| Efficiency of the recuperator (regenerator) | |
| τ | Maximum-to-minimum temperature ratio (; see Figure 1) |
| 1, 2 ⋯ | Numbers indicating the different points in the scheme in Figure 1 |
References
- Invernizzi, C.M. Closed Power Cycles—Thermodynamic Fundamentals and Applications; Springer: London, UK, 2013. [Google Scholar]
- Olumayegun, O.; Meihong, W.; Kelsall, G. Closed-cycle gas turbine for power generation: A state-of-the-art review. Fuel 2016, 180, 694–717. [Google Scholar] [CrossRef]
- McDonald, C.F. Helium turbomachinery operating experience from gas turbine power plants and test facilities. Appl. Therm. Eng. 2012, 44, 108–142. [Google Scholar] [CrossRef]
- Frutschi, H.U. Closed-Cycle Gas Turbines. Operating Experience and Future Potential; ASME Press: New York, NY, USA, 2005. [Google Scholar]
- Van Rooijen, W.F.G. Gas-cooled fast reactor: A historical overview and future outlook. Sci. Technol. Nuclear Install. 2009, 2009, 965757. [Google Scholar] [CrossRef]
- McCormick, J.E.; Redding, T.E. 3-kiloWatt recuperated closed brayton-cycle electrical power system. In Proceedings of the 1967 Intersociety Energy Conversion Engineering Conference, Miami Beach, FL, USA, 13–17 August 1967. [Google Scholar]
- Fuller, R.L. Closed Brayton Cycle Power Conversion Unit for Fission Surface Power Phase I—Final Report; NASA/CR–2010-215673; NASA, Glenn Research Center Cleveland: Washington, OH, USA, 2010.
- Pierce, B.L. The influence of recent heat transfer data on gas mixtures (He–Ar, He–CO2) on closed cycles gas turbines. Trans. ASME J. Eng. Power 1981, 103, 114–117. [Google Scholar] [CrossRef]
- Lee, J.C.; Campbell, J.; Wright, D.E., Jr. Close-cycle gas turbine working fluids. Trans. ASME J. Eng. Power 1981, 103, 220–228. [Google Scholar] [CrossRef]
- Bammert, K.; Klein, R. The influence of He−Ne, He−N2, and He−CO2 gas Mixtures on closed-cycle gas turbines. In Proceedings of the ASME 1974 International Gas Turbine Conference and Products Show, Zurich, Switzerland, 30 March–4 April 1974. [Google Scholar]
- Feher, E.G. The supercritical thermodynamic power cycle. Energy Convers. 1968, 8, 8590. [Google Scholar] [CrossRef]
- Angelino, G. Perspectives for the liquid phase compression gas turbine. Trans. ASME J. Eng. Power 1967, 89, 229–237. [Google Scholar] [CrossRef]
- Angelino, G. Carbon Dioxide Condensation Cycles for Power Production. Trans. ASME J. Eng. Power 1968, 90, 287–295. [Google Scholar] [CrossRef]
- Angelino, G. Real gas effects in carbon dioxide cycles. In Proceedings of the ASME 1969 Gas Turbine Conference and Products Show, Cleveland, OH, USA, 9–13 March 1969. [Google Scholar]
- Poling, B.E.; Prausnitz, J.M.; O’Connell, J.P. The Properties of Gases and Liquids, 5th ed.; McGraw-Hill: New York, NY, USA, 2001. [Google Scholar]
- Reynolds, W.C. Thermodynamic Properties in SI Units; Department of Mechanical Engineering, Stanford University: Stanford, CA, USA, 1979; p. 94305. [Google Scholar]
- Krasin, A.K.; Nesterenko, V.B. Dissociating gases: A new class of coolants and working substances for large power plants. At. Energy Rev. 1971, 9, 177–194. [Google Scholar]
- Krasin, A.K.; Nesterenko, V.B. New prospects in the creation of gas-cooled fast reactors with a short doubling time, using dissociating N2O4. Sov. At. Energy 1974, 37, 687–698. [Google Scholar] [CrossRef]
- Angelino, G. Performance of N2O4 gas cycles for solar power applications. Proc. Inst. Mech. Eng. 1979, 193, 313–320. [Google Scholar] [CrossRef]
- Peng, D.-Y.; Robinson, D.B. A Rigorous Method for Predicting the Critical Properties in Multicomponent System from an Equation of State. AIChE J. 1977, 23, 137–144. [Google Scholar] [CrossRef]
- Mak, P.C.-N. Thermodynamic Properties From Cubic Equations of State. Master’s Thesis, Department of Chemical Engineering, The Faculty of Graduate Studies, The University of British Columbia, Vancouver, BC, Canada, 1988. [Google Scholar]
- Angelino, G.; Invernizzi, C. Real gas Brayton cycles for organic working fluids. Proc. Inst. Mech. Eng. Part A J. Power Energy 2001, 215, 27–38. [Google Scholar] [CrossRef]
- Ghajar, A.J.; Asadi, A. Improved Forced Convective Heat-Transfer Correlations for Liquids in the Near-Critical Region. AIAA J. 1986, 4, 2030–2037. [Google Scholar] [CrossRef]
- Angelino, G.; Invernizzi, C.M. The role of real gas Brayton cycles for use of liquid natual gas physical exergy. Appl. Therm. Eng. 2011, 31, 827–833. [Google Scholar] [CrossRef]
- Invernizzi, C.M.; Iora, P. The exploitation of the physical exergy of liquid natural gas by closed power thermodynamic cycles: An overview. Energy 2016, 105, 2–15. [Google Scholar] [CrossRef]
- Kay, W.B. The Critical Locus Curve and the Phase Behavior of Mixtures. Acc. Chem. Res. 1968, 1, 344–351. [Google Scholar] [CrossRef]
- Smith, J.M.; Van Ness, H.C. Introduction to Chemical Engineering Thermodynamics, 3rd ed.; McGraw-Hill Kogakusha: Tokyo, Japan, 1975. [Google Scholar]
- Diefenbcher, A.; Türk, M. Critical (P, ρ, T) properties of CH2F2, {xCO2 + (1 − x)SF6}, {xSF6 + (1 − x)CH2F2}, and {xCHf3 + (1 − x)CH2F2}. J. Chem. Thermodyn. 1999, 31, 905–919. [Google Scholar] [CrossRef]
- Hicks, C.P.; Young, C.L. The Gas-Liquid Critical Properties of Binary Mixtures. Chem. Rev. 1975, 75, 119–175. [Google Scholar] [CrossRef]
- Klaus, B.; Peter, F.; Richard, D. (Eds.) Fundamentals and Applications of Supercritical Carbon Dioxide (sCO2) Based Power Cycles; Woodhead Publishing: Duxford, UK, 2017. [Google Scholar]
- Invernizzi, C.M.; Iora, P.; Manzolini, G.; Lasala, S. Thermal stability of n-pentane, cyclo-pentane and toluene as working fluids in organic Rankine cycles. Appl. Therm. Eng. 2017, 121, 172–179. [Google Scholar] [CrossRef]
- Ng, H.-J.; Robinson, D.B. Equilibrium Phase Properties of the Toluene-Carbon Dioxide System. J. Chem. Eng. Data 1978, 23, 325–327. [Google Scholar] [CrossRef]
- Chen, J.-X.; Hu, P.; Chen, Z.-S. Study on the Interaction Coefficients in PR Equation with vdW Mixing Rules for HFC and HC Binary Mixtures. Int. J. Thermophys. 2008, 29, 1945–1953. [Google Scholar] [CrossRef]
- Dordain, L.; Coxam, J.Y.; Quint, J.R.; Grolier, J.P.E.; Lemmon, E.W.; Penoncello, S.G. Isobaric Het Capacities of Carbon Dioxide and Argon Between 323 and 423 K and at Pressures up to 25 MPa. J. Supercrit. Fluids 1995, 8, 228–235. [Google Scholar] [CrossRef]
Figure 1.
Simplified plant scheme of the considered cycles.

Figure 2.
Effects on the thermodynamic efficiency of the minimum reduced pressure fixing the reduced minimum temperature and the temperature ratio .
Figure 2.
Effects on the thermodynamic efficiency of the minimum reduced pressure fixing the reduced minimum temperature and the temperature ratio .

Figure 3.
Some thermodynamic cycles in the reduced temperature–reduced entropy thermodynamic plane. Cycle A operates in the ideal gas region; cycles C and D are two real-gas Brayton cycles. The temperature in cycle D is subcritical.
Figure 3.
Some thermodynamic cycles in the reduced temperature–reduced entropy thermodynamic plane. Cycle A operates in the ideal gas region; cycles C and D are two real-gas Brayton cycles. The temperature in cycle D is subcritical.

Figure 4.
(a) Reduced average logarithmic mean temperature difference in the recuperator, and (b) turbomachinery power at different minimum reduced pressures as a function of the compression ratio. The minimum reduced temperature and the temperature ratio are fixed.
Figure 4.
(a) Reduced average logarithmic mean temperature difference in the recuperator, and (b) turbomachinery power at different minimum reduced pressures as a function of the compression ratio. The minimum reduced temperature and the temperature ratio are fixed.

Figure 5.
(a) Effect of the minimum reduced temperature on the cycle efficiency, and (b) compressibility factor in the point 1 (at the beginning of the compression). The minimum reduced pressure and the temperature ratio are fixed.
Figure 5.
(a) Effect of the minimum reduced temperature on the cycle efficiency, and (b) compressibility factor in the point 1 (at the beginning of the compression). The minimum reduced pressure and the temperature ratio are fixed.

Figure 6.
Effect of the temperature ratio on the cycle’s thermodynamic efficiency. (a) Brayton cycles operating with ideal gas (); (b) Brayton cycles operating with real strong gas effects in the compression phase (). The minimum reduced temperature is fixed.
Figure 6.
Effect of the temperature ratio on the cycle’s thermodynamic efficiency. (a) Brayton cycles operating with ideal gas (); (b) Brayton cycles operating with real strong gas effects in the compression phase (). The minimum reduced temperature is fixed.

Figure 7.
Cycle thermodynamic efficiency losses due to the pressure losses and cycle efficiencies as a function of the compression ratio. For simplicity, the pressure losses were concentrated after the compressor discharge.
Figure 7.
Cycle thermodynamic efficiency losses due to the pressure losses and cycle efficiencies as a function of the compression ratio. For simplicity, the pressure losses were concentrated after the compressor discharge.

Figure 8.
Thermodynamic efficiency for real-gas cycles as a function of the compression ratio for different working fluids.
Figure 8.
Thermodynamic efficiency for real-gas cycles as a function of the compression ratio for different working fluids.

Figure 9.
(a) Liquid–gas (LG) critical loci for binary mixtures of refrigerants HFC-23 () and HFC-32 (). Data are from [28]; (b) LG critical loci for binary mixtures of ethane and propane. Data are from [29].

Figure 10.
(a) Liquid–gas (LG) critical loci for binary mixtures of n-butane and carbon dioxide. Data are from [29]; (b) LG critical loci for binary mixtures of carbon dioxide and sulphur hexafluoride (). Data are from [28].

Figure 11.
Liquid–gas (LG) critical locus and pressure–temperature curves for the carbon dioxide–toluene system. The binary interaction coefficients for the used equation of state are from the data bank of Aspen Plus. The open circles are from [32].
Figure 11.
Liquid–gas (LG) critical locus and pressure–temperature curves for the carbon dioxide–toluene system. The binary interaction coefficients for the used equation of state are from the data bank of Aspen Plus. The open circles are from [32].

Figure 12.
Bubble and dew lines for some pure fluids and their mixtures in the T–S plane. (a) Carbon dioxide, pure toluene and a mixture composed by 95% of carbon dioxide (molar composition). The binary interaction coefficients for the used equation of state are from the data bank of Aspen Plus; (b) Refrigerant 23 and refrigerant 32. The binary interaction coefficients are from [33].

Figure 13.
Turbine inlet pressure as a function of the thermodynamic cycle efficiency for pure fluids and for two different mixtures.
Figure 13.
Turbine inlet pressure as a function of the thermodynamic cycle efficiency for pure fluids and for two different mixtures.

Figure 14.
The heat transfer surface for the recuperator per unit power multiplied by the overall heat transfer coefficient as a function of the thermodynamic cycle efficiency for a carbon dioxide cycle and for two different mixtures.
Figure 14.
The heat transfer surface for the recuperator per unit power multiplied by the overall heat transfer coefficient as a function of the thermodynamic cycle efficiency for a carbon dioxide cycle and for two different mixtures.

Figure 15.
Two real-gas cycles with mixtures as working fluid in the thermodynamic plane T–S.


Table 1.
Some properties of substances that could be used as working fluids in closed Brayton cycles. Data are from [15] (Appendix A) and [16].
| Fluid | Critical Temperature Tcr (K) | Critical Pressure Pcr (bar) | Critical Compressibility Factor, Zcr | Molecular Weight |
|---|---|---|---|---|
| Helium (He) | 5.19 | 2.27 | 0.301 | 4.004 |
| Nitrogen (N2) | 126.2 | 33.98 | 0.289 | 28.014 |
| Air | 132.5 | 37.7 | 0.28 | 28.96 |
| Argon (Ar) | 150.86 | 48.98 | 0.291 | 39.948 |
| Ethylene (CH2=CH2) | 282.34 | 50.41 | 0.282 | 28.054 |
| Xenon (Xe) | 289.74 | 58.4 | 0.286 | 131.29 |
| Hexafluoroethane (CF3−CF3) | 293.04 | 30.39 | 0.277 | 138.12 |
| Carbon dioxide (CO2) | 304.12 | 73.74 | 0.274 | 44.01 |
| Ethane (CH3−CH3) | 305.32 | 48.72 | 0.279 | 30.07 |
| Sulphur hexafluoride (SF6) | 318.72 | 37.6 | 0.282 | 164.056 |
Table 2.
Some potential working fluid compounds in closed real-gas Brayton cycles. Data are from [15] (Appendix A).
Table 2.
Some potential working fluid compounds in closed real-gas Brayton cycles. Data are from [15] (Appendix A).
| Fluid | Critical Temperature Tcr (K) | Critical Pressure Pcr (bar) | Molecular Weight |
|---|---|---|---|
| Hydrocarbons | |||
| Ethane () | 305.32 | 48.72 | 30.07 |
| Propene (propylene) () | 364.9 | 46.00 | 42.08 |
| Propane () | 369.83 | 42.48 | 44.10 |
| Perfluoro compounds | |||
| Tetrafluoroethene () | 306.4 | 39.44 | 100.02 |
| Sulphur hexafluoride () | 318.72 | 37.6 | 146.06 |
| Octafluoropropane (R-218) () | 345.1 | 26.8 | 188.02 |
| Halogen compounds | |||
| 1,1-Difluoroethene () | 303.2 | 44.33 | 64.03 |
| Fluoromethane () | 315.0 | 55.48 | 34.03 |
| Pentafluoroethane () | 339.17 | 36.15 | 120.02 |
| Bromotrifluoromethane () | 340.15 | 39.70 | 148.91 |
| 1,1,1-Trifluoroethane (R-143a) () | 346.30 | 37.92 | 84.04 |
| Difluoromethane (R-32) () | 351.26 | 58.05 | 52.02 |
| 1-Chloro-1,1,2,2,2-pentafluoroethane () | 353.1 | 31.29 | 154.47 |
| Chlorodifluoromethane (R-22) () | 369.28 | 49.86 | 86.47 |
| 1,1,1,2-Tetrafluoroethane (R-134a) () | 374.26 | 40.59 | 102.03 |
| Fluoroethane () | 375.28 | 50.27 | 48.06 |
© 2017 by the author. Licensee MDPI, Basel, Switzerland. This article is an open access article distributed under the terms and conditions of the Creative Commons Attribution (CC BY) license (http://creativecommons.org/licenses/by/4.0/).
Share and Cite
MDPI and ACS Style
Invernizzi, C.M. Prospects of Mixtures as Working Fluids in Real-Gas Brayton Cycles. Energies 2017, 10, 1649. https://doi.org/10.3390/en10101649
AMA Style
Invernizzi CM. Prospects of Mixtures as Working Fluids in Real-Gas Brayton Cycles. Energies. 2017; 10(10):1649. https://doi.org/10.3390/en10101649
Chicago/Turabian StyleInvernizzi, Costante Mario. 2017. "Prospects of Mixtures as Working Fluids in Real-Gas Brayton Cycles" Energies 10, no. 10: 1649. https://doi.org/10.3390/en10101649
Note that from the first issue of 2016, this journal uses article numbers instead of page numbers. See further details here.