
An Extended System Frequency Response Model Considering Wind Power Participation in Frequency Regulation


1
Jiangsu Provincial Key Laboratory of Smart Grid Technology & Equipment, Southeast University, Nanjing 210096, China
2
Technology Center of Central China Grid, Wuhan 430077, China
3
State Key Laboratory of Operation and Control of Renewable Energy & Storage Systems, China Electric Power Research Institute, Beijing 100192, China
*
Author to whom correspondence should be addressed.
Energies 2017, 10(11), 1797; https://doi.org/10.3390/en10111797
Submission received: 22 September 2017
/
Revised: 16 October 2017
/
Accepted: 1 November 2017
/
Published: 8 November 2017
(This article belongs to the Special Issue Wind Generators Modelling and Control)
Abstract
:With increasing penetration of wind power into the power system, wind power participation in frequency regulation is regarded as a beneficial strategy to improve the dynamic frequency response characteristics of power systems. The traditional power system frequency response (SFR) model, which only includes synchronous generators, is no longer suitable for power systems with high penetrated wind power. An extended SFR model, based on the reduced-order model of wind turbine generator (WTG) and the traditional SFR model, is presented in this paper. In the extended SFR model, the reduced-order model of WTG with combined frequency control is deduced by employing small signal analysis theory. Afterwards, the stability analysis of a closed-loop control system for the extended SFR model is carried out. Time-domain simulations using a test system are performed to validate the effectiveness of the extended SFR model; this model can provide a simpler, clearer and faster way to analyze the dynamic frequency response characteristic for a high-wind integrated power systems. The impact of additional frequency control parameters and wind speed disturbances on the system dynamic frequency response characteristics are investigated.
1. Introduction
Wind power, as one of the most developed energy generation modes, has been increasing in the modern power system, more conventional synchronous generators which enjoy the ability of frequency support are replaced by wind turbine generators (WTGs). Unlike conventional synchronous generators, WTGs are connected to the power grid through power electronic converters, and as a result, the system frequency is decoupled from the rotor speed of the WTGs [1]. In addition, WTGs usually operate over the maximum power point tracking curve so that there is no available reserve power. Therefore, WTGs do not provide inherent inertia, and do not respond to system frequencies when a disturbance occurs; they pose a great challenge to the frequency stability in a power system with a high wind power penetration level [2,3,4]. Thus, WTGs should assist in system frequency regulation to maintain the frequency stability of power systems with increased wind power.
To solve the frequency stability problem caused by decreased inertia in a power system with increased wind power, a large amount of research has been conducted to enable wind power to participate in system frequency regulation, so as to improve inertial response [5,6,7,8,9,10,11,12,13,14,15,16]. The most common idea is to establish a supplementary control loop between system frequency and an extra active power reference; as a result, the coupling relation between frequency deviation and active power is established. These methods can generally be divided into three control modes: virtual inertial control [5,6,7,8], power reserve control [9,10,11,12], combined virtual inertial control and power reserve control [13,14,15,16]. The above research can effectively improve the frequency control ability of wind turbines themselves. However, relatively little literature focuses on the dynamic frequency response characteristics of wind power integrated power systems [17,18]. A frequency domain model, including governors, networks and load characteristics is developed in [17] to analyze the power system frequency response to wind power fluctuations of different frequencies. The researchers in [18] develop an assessment method on the impact of wind power injection on power system frequency deviations. However, the above studies consider the wind turbine as a negative load, ignoring the internal dynamic response characteristics of the wind turbine. Simultaneously, these are static frequency evaluation methods, and hence, it is difficult to efficaciously reflect the dynamic frequency response characteristics of high-wind integrated power systems. Recently, the research on dynamic frequency characteristics for traditional power systems have received the attention of many researchers. A quintessential low-order system frequency response (SFR) model is widely used in power system frequency analysis due to its simple and clear calculation [19], which can effectively analyze and evaluate the frequency dynamics of power system disturbances, and can help technology policy makers to develop relevant emergency control strategies to maintain the frequency stability of the system.
With large-scale wind power into the grid, the traditional SFR model is no longer suitable for high permeability wind power systems, research into the dynamic frequency response characteristics of high-wind integrated power systems becomes a crucial subject to be studied. Hence, it is indispensable to investigate the SFR model for power systems with high penetrated wind power. There are three main contributions in this paper. Firstly, the combined frequency control strategy of WTG based on the virtual inertia control and the pitch-control-based deloading control is introduced. Secondly, the reduced-order model of WTG is deduced by employing small signal analysis theory, and an extended SFR model that takes the wind power into account based on the reduced-order model of WTG and the traditional SFR model. Afterwards, the stability of the extended SFR model is analyzed. Finally, analytical tests and evaluations of the extended SFR model are given.
2. Primary Frequency Regulation of WTG
Here, the dynamic frequency control strategy of variable speed WTG based on combined virtual inertia control and pitch-control-based deloading control is considered, as shown in Figure 1. Hw is the inertia time constant of the wind turbine, ω is the rotor speed, Tm and Te are the mechanical torque and the electromagnetic torque, respectively, Pe is the active power output of the WTG, Δf is the frequency deviation, Δβ is the pitch angle deviation, kw and Rw are the scale coefficients and the gain of the droop setting, respectively, and kb is the scale factor.
2.1. Virtual Inertia Control
A general approach to enabling the WTG participating in the grid short-term frequency control is virtual inertia control, which is adding an additional active power reference value associated with system frequency variations. The quintessential additional virtual inertial frequency control scheme of WTG is a proportional differential control as shown in Figure 1. Here ΔPe1 can be expressed by
2.2. Pitch-Control-Based Deloading Control
As shown in Figure 1, the WTG operates in the combination of Maximum power point tracking (MPPT) strategy and pitch-control-based deloading. The initial pitch angle is set as a fixed reference value βref according to the reserve power of the wind power. Therefore, at a given wind speed, rotor speed and pitch angle, wind turbines exhibit maximum power. The mechanical power equation of WTG extracted from the wind is expressed as
With the tip speed ratio
where ρ is the air density, r is blade length, vm is wind speed, Cp is the coefficient of performance of the wind turbine, λ is the tip-speed ratio and β is the blade pitch angle and ωm is the turbine rotor angular.
When the wind turbine operates at maximum power, the corresponding tip speed ratio is the optimal tip speed ratio, i.e., λnom. Accordingly, the per unit tip speed ratio is
where ω and v are the per unit values of rotor speed and wind speed on base wind speed 12 m/s, respectively.
The per unit mechanical power and tip speed ratio can be written as
With
where Pbase is the rated power of WTG and kp is scaling factor, and represents maximum turbine output power under the base wind speed, Cp,max is the maximum value of power coefficient performance.
Hence, the per unit mechanical torque of wind turbine is
The values of per unit performance coefficient Cp (pu) and the per unit tip speed ratio λpu are 1 when the wind turbine operates at maximum power, thus the output torque of the wind turbine can be written as
And the equation of the generator torque at MPPT state can be written as
Under a certain wind speed, the WTG extracts the maximum mechanical power when the pitch angle β is set to zero; the wind turbine has no reserve capacity available at this point. However, when the pitch angle β is set to greater than zero, the coefficient of performance Cp, and thereby, the mechanical power output will decrease. Therefore, when the maximum power point tracking control and pitch angle control are adopted, the reserve power can be obtained, and the WTG is said to be decoded. Here, the relation between the frequency deviation and the pitch angle change is as follows:
2.3. Combined Frequency Control
For the combined frequency control in this paper, the virtual inertial control of the WTG can quickly adjust the active power, and releases the kinetic energy stored in the rotating masses in a WTG to provide temporary active support so as to arrest the frequency drop during the disturbance events, thus improving the ability of the system to restrain frequency change. On the other hand, the use of pitch-control-based deloading can increase the input mechanical power to participate in the system’s long frequency regulation and reduce the steady-state deviation of frequency. Although the reserve power control sacrificed part of the power of the WTG, the proper load shedding can avoid cutting off the machine due to the wind power being higher than the load. Therefore, frequency regulation strategy for the perfect wind farm should have these two capabilities simultaneously.
3. SFR Model for High-Wind Integrated Power System
Frequency response characteristics of a high-wind integrated power system are analyzed using small signal analysis in this section, the reduced order dynamic model of WTG can be derived and expressed in the form of small signal linearized transfer functions. Thus, the extended SFR model for high-wind integrated power systems can be obtained. The reduced order dynamic model of WTG, the extended SFR model and the system stability of a closed-loop system for the extended SFR model are presented in this section.
3.1. Reduced Order Dynamic Model of WTG
The response of the frequency deviation of the WTG system is controlled by regulating electromagnetic power Pe and mechanical power Pm of the WTG. When frequency perturbation occurs, the electromagnetic power Pe is controlled by virtual inertial control to add the additional transient power ΔPe to the initial electromagnetic power, whereas the mechanical power Pm is controlled by pitch angle control to add the increment of pitch angle Δβ to the initial pitch angle.
From (1), the change in electromagnetic torque with change in frequency for the virtual inertial control method is calculated in the frequency domain:
Similarly, from (9), the dynamic deloading torque based on pitch angle control can be considered as a function of rotor speed, thus the change of dynamic deloading torque can be represented by the variation of the rotor speed:
Putting (9) into (12), the (12) can be modified as
Adding (11) and (13), the total change in electrical torque when the frequency changes is expressed as follows:
From (8), the linearized mechanical torque Tm can be considered as a function of the small changes of frequency, wind speed and rotor speed, thus linearized mechanical torque Tm can be represented by the variation of the frequency, wind speed and rotor speed:
Let and , the values of both are constant, and can be calculated from the relational expression of .
Now, putting (8) and (10) in (15), the linearized mechanical torque Tm is derived and given in Equation (16) as shown.
The power swing equation in terms of the unbalance torque ΔTe and ΔTm can be expressed as in frequency domain:
Putting (14) and (16) into (17), the relation between the change of rotor speed and the change of frequency and wind speed is derived as follow
By inserting (18) into (14), the change in electrical power output can be written as
where
3.2. Extended SFR Model
In the process of power system frequency response analysis and frequency stability control, the system frequency response (SFR) model proposed by P.M. Anderson is a widely used equivalent model method where the dynamic aggregation of multiple generators is performed [19]. When the penetration rate of wind power is increasing, the system requires that the wind turbines have the ability of frequency regulation, and the traditional SFR model is no longer suitable for a power system with high penetrated wind power. Based on the reduced order dynamic model of WTG and the traditional SFR model, the extended low-order linearized SFR model for the high-wind integrated power system is proposed as shown in Figure 2. Similarly, the equivalent wind farm in this model is the result of dynamic equivalent aggregation of all wind turbines. In Figure 2, TR and FH are the equivalent turbine time constants and speed governor, respectively, R is the equivalent droop value, H and D are the equivalent inertia constant and load-damping coefficient of the conventional power system, respectively, and α is the wind power penetration level.
From the above analysis, the extended SFR model is a multi-input and single output (MISO) transfer function system compared with the traditional SFR model; the input signals are the change of load ΔPL and the change of wind speed Δv, and the output signal is the system frequency deviation Δf, as shown in Figure 2. This means that the output of the extended SFR model is affected by the change in load as well as wind speed. For the extended SFR model, synchronous generators and the wind farm work together on frequency control to balance the external power disturbance (ΔPL and Δv). In this paper, it is assumed that the total generating capacity of the system remains fixed; the wind turbines are connected to the grid to replace some of the conventional generators, and as a result, the net inertial and damping coefficient of the power system is affected.
For MISO transfer function system, the superposition theorem can be used for analysis, namely one disturbance at a time is considered [20]. It is considered that the disturbance of the wind speed is set to zero when analyzing the impact of the load disturbance on the system frequency. Similarly, the disturbance of the load is set to zero when analyzing the impact of the wind speed disturbance on the system frequency. Combining Equation (20) and Figure 2, the transfer function expression of the extended SFR model is
where
For a sudden load disturbance and wind speed disturbance, they are usually represented as a step function
where ΔPd and Δvd are the disturbance magnitude of the active load and wind speed per unit based on the total installed capacity of the system and rated wind speed respectively, and u(t) is the unit step function.
After the Laplace transform, the (23) can be expressed as
Putting (24) into (21), the transfer function expression of the extended SFR model can be written as
According to the initial/final value theorem of the Laplace transform, the initial frequency change rate (IFCR) and steady-state frequency deviation (SFD) can be obtained:
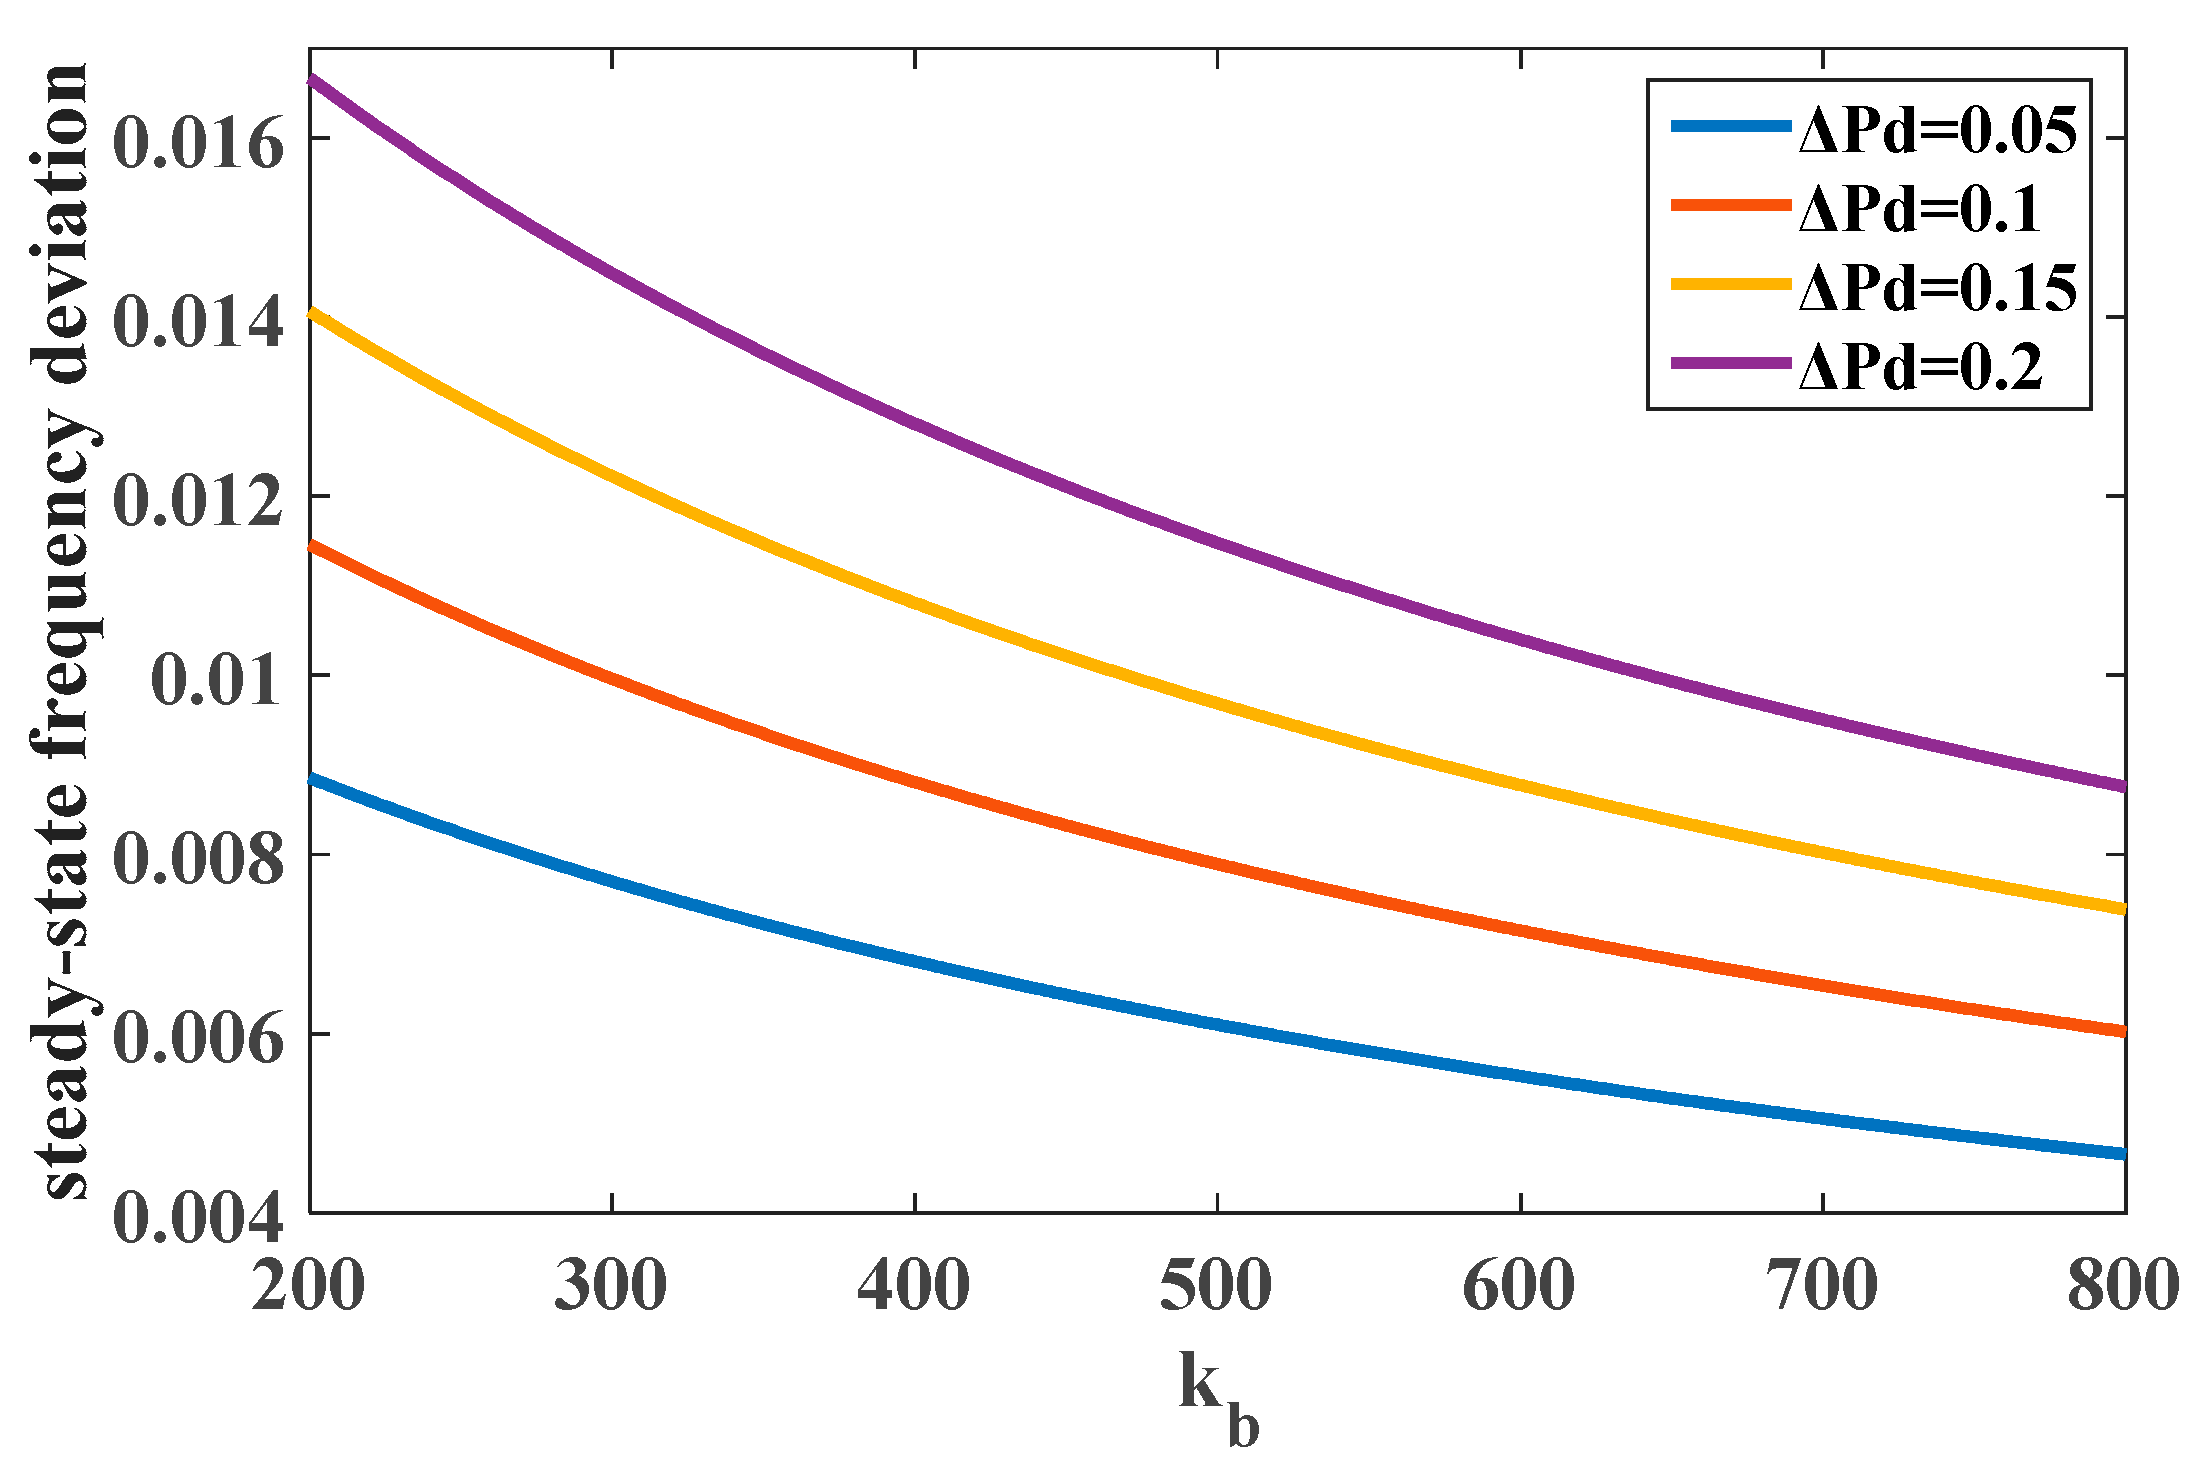
From (26) and (27), it can be seen that the parameter kw of the virtual inertial control is a key factor in influencing the IFCR, but has no inhibitory effect on SFD; and parameter Rw of the virtual inertial control and parameter kb of the pitch-control-based deloading control have a positive effect on SFD, but have no inhibitory effect on IFCR at all. Thus, the curves of IFCR under different parameter kw can be plotted as in Figure 3, based on (26). It can be seen that the greater the load disturbance will lead to a larger IFCR, and the IFCR decrease gradually with the increase of kw. Meanwhile, curves of IFCR under different parameter kb can be also plotted as Figure 4, based on (27). It can be observed from the Figure 4 that the greater the load disturbance will also lead to a larger SFD, and SFD decreases gradually with the increase of kb.
3.3. Stability Analysis of the Closed-Loop System
For the extended SFR model as shown in Figure 2, the loop of the wind farm involved in frequency regulation is added in the conventional SFR model. Taking only load disturbances as an example (Δvd = 0), the open-loop transfer function, where only the conventional generator participate in frequency regulation, can be derived as follows:
The closed-loop transfer function, where the wind farm also participate in frequency regulation, can be derived as follows:
The bode plots of TOL(s) and TCL(s) are shown in Figure 5, and demonstrate that both systems are stable, and the magnitude of TOL(s) is larger than the magnitude of TCL(s). This indicates that the frequency deviation of the system is relatively large when the wind farm is not involved in frequency regulation.
The stability of the feedback control system is a prerequisite of its normal operation, and the gain and phase margin are two main indices to judge stability in the control field. The gain and phase margin can be obtained from the Bode diagrams of the open-loop transfer function of the closed-loop system. For the closed-loop system, its poles are zeros of characteristic expressions [21,22]. According to (28) and (29), the characteristic expression of the closed-loop system, with and without wind power involved in frequency regulation, can be written as
where and are the open-loop transfer function for the closed-loop system, with and without wind power involvement in frequency regulation (as shown in Figure 2), respectively.
The Bode plots of the systems of (30) and (31) are shown in Figure 6. It can be seen that both systems (with and without wind farm involved in frequency regulation) are relatively stable, and the larger gain and phase margins have been achieved when the loop of wind power involved in frequency regulation is added to the system. The results indicate that wind power participating in frequency regulation is more advantageous to system stability in areas with higher wind penetration.
4. Verification of the Extended SFR Model
In order to verify the validity of the proposed extended SFR model, the IEEE-14 bus system is chosen as a case study. The wiring diagram is shown in Figure 7; system total load power is 220 MW and generator nodes are 1, 2, 3, 6 and 8. Using the unit substitution method, the 6# synchronous generator is replaced by wind turbines to maintain the power flow balance of the system, the ratio of wind turbine capacity to total generator capacity is 30%, namely α = 0.3, and it is assumed that the wind turbines are replaced by a dynamic aggregate wind turbine generator [23,24]. The synchronous generators are made of thermal power units, and both of them are equipped with a prime mover governor system. The wind power adopts permanent magnet direct drive wind turbine, and the wind turbine adopts the frequency regulation control strategy shown in Figure 1. The operating data and parameters for the extended SFR model for the high-wind integrated power system, such as wind turbine generators and traditional generators, are mentioned in Appendix A.
For wind power generation, the output power of WTG is affected by wind speed. Therefore, the impact of wind speed should not be neglected when analyzing the dynamic frequency response of high-wind integrated power systems. However, the wind speed is uncontrollable, and the output power of the WTG fluctuates with the fluctuation of the wind speed, so the resulting in frequency fluctuates. In order to make wind speed closer to reality in the case study, the mathematical model of stochastic fluctuating wind speed is applied, the wind speed is composed of base wind speed, gust wind speed, ramp wind speed and noise wind speed [25,26], as shown in Figure 8. And it is assumed that a 0.2 pu load disturbance occurs at t = 5 s in the simulation.
The system frequency response of the reduced-order model and the detailed time simulation model of wind farms are depicted and compared in Figure 9. It can be seen that the curves of the frequency obtained from the reduced-order model and time simulation model of wind farms are in good agreement; the system frequencies of wind farms based on the reduced-order model are accurately simulated in comparison to the time simulation model. That means the reduced-order model can represent real time frequency dynamic response of the wind farm.
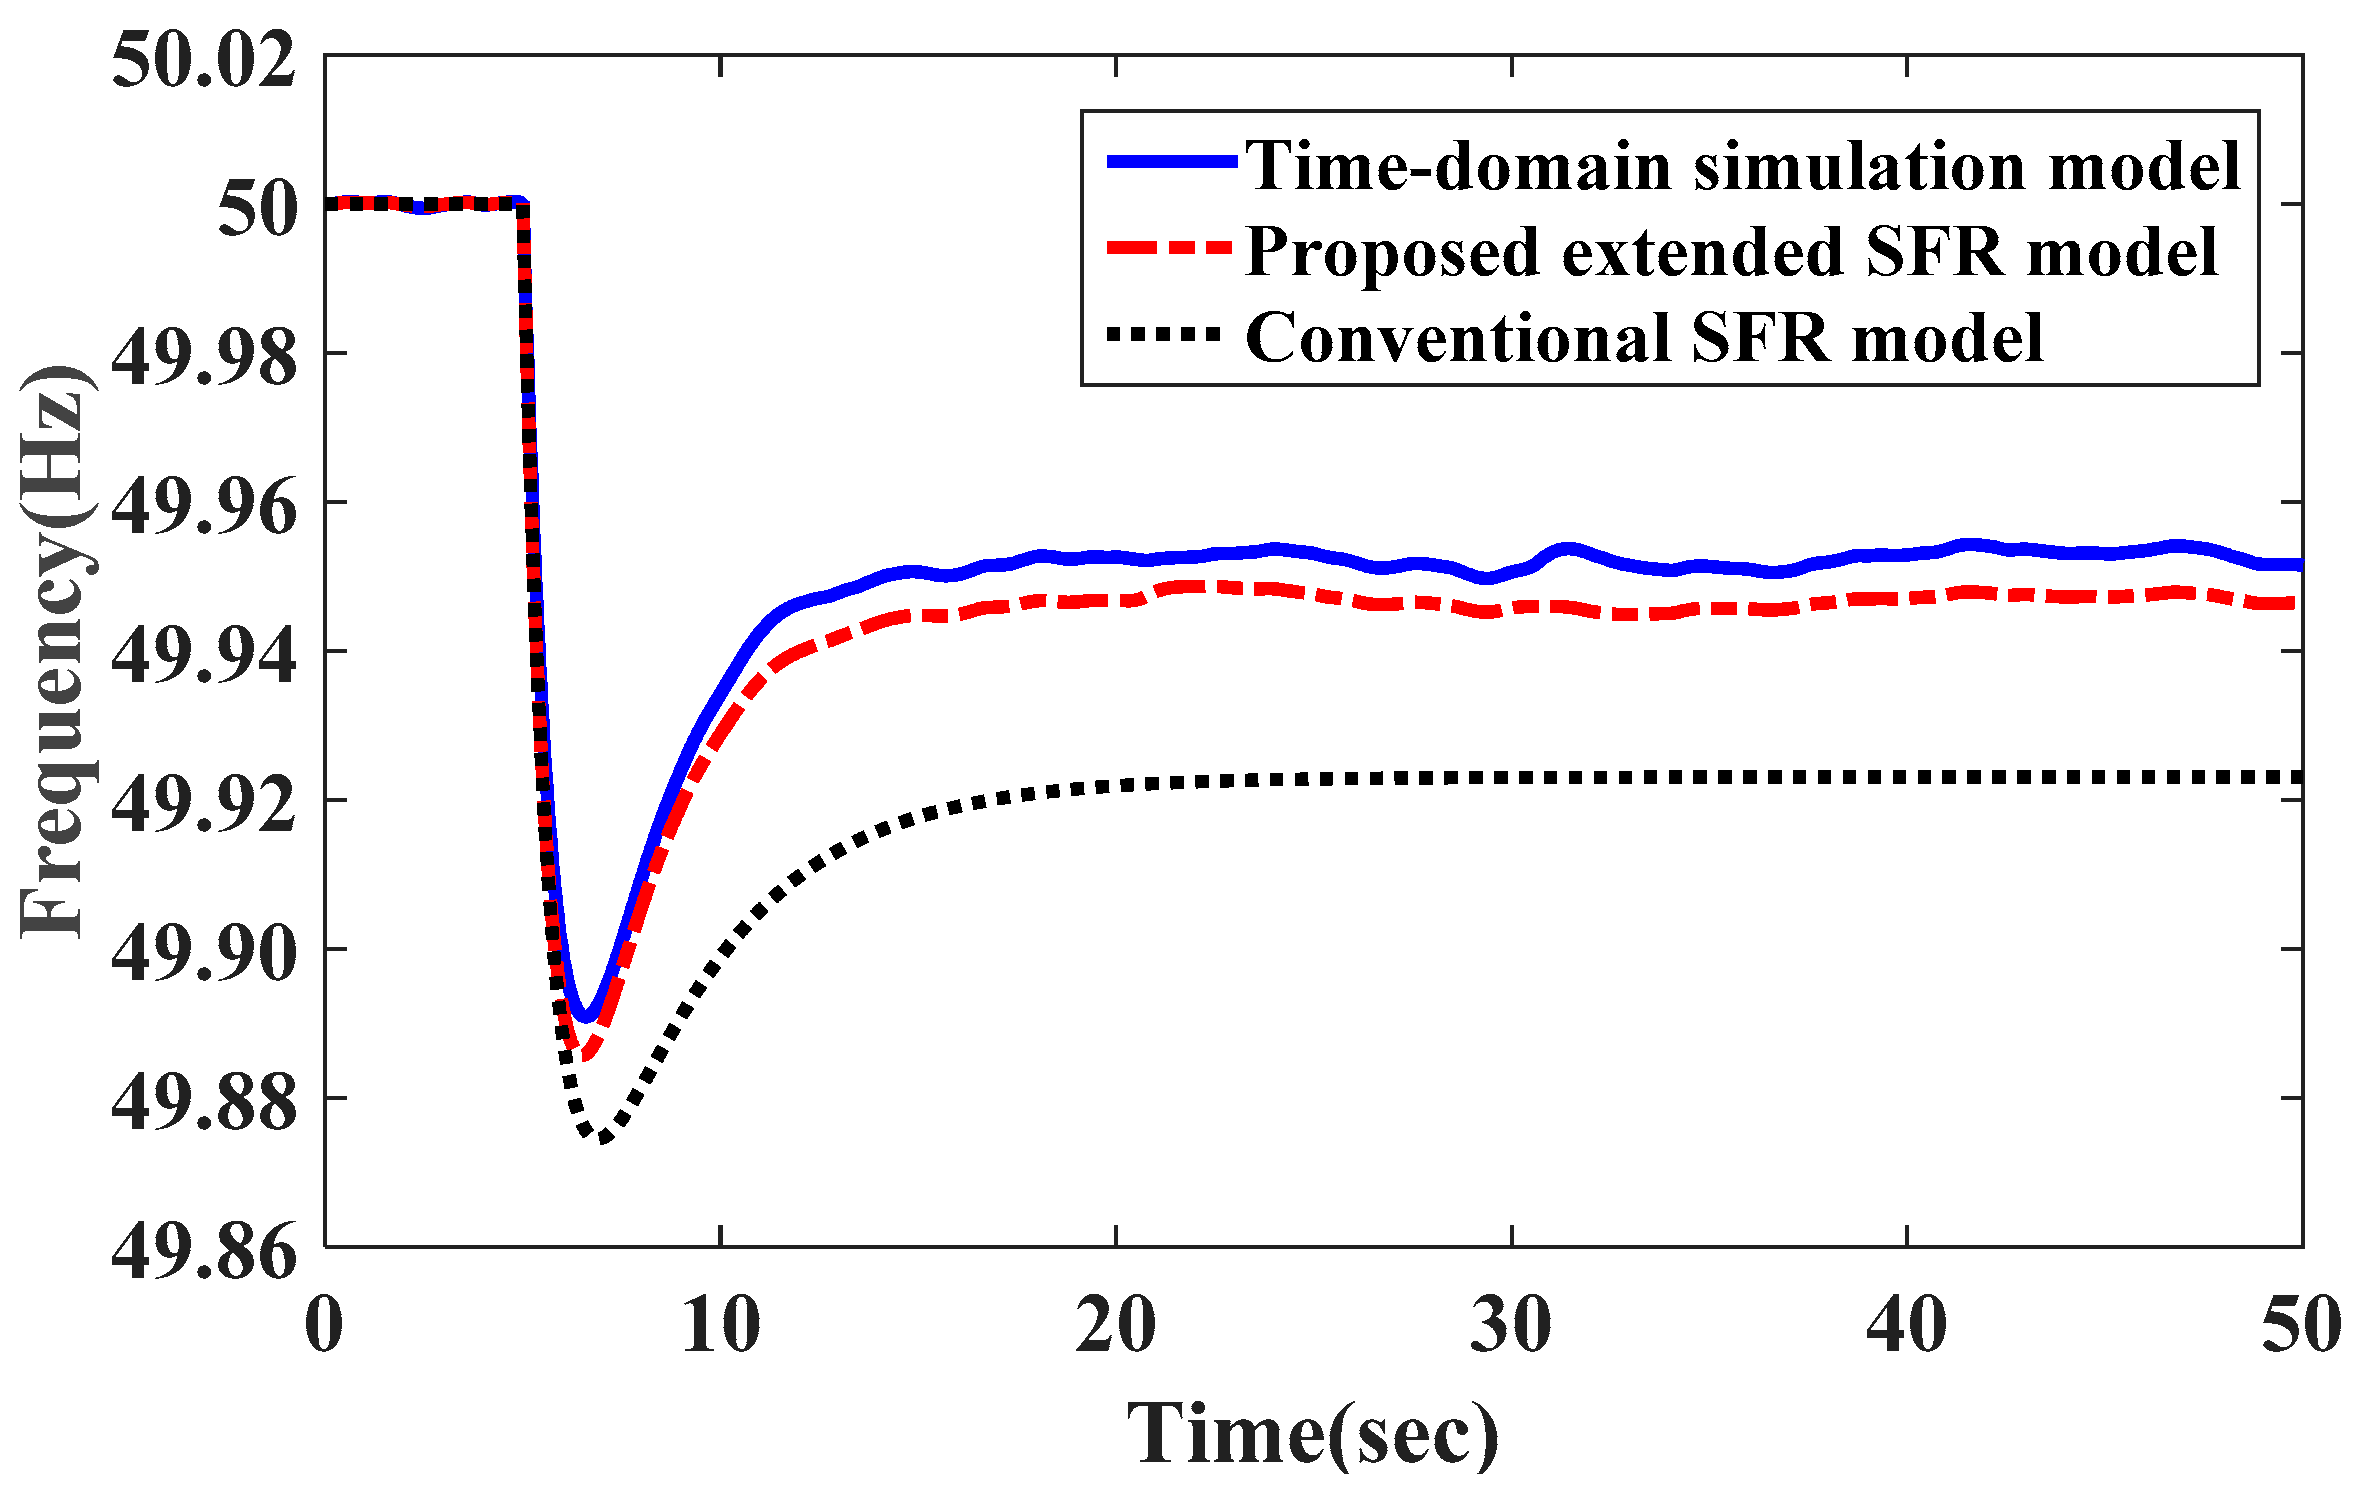
The system frequency response of the extended SFR model, the conventional SFR model and the detailed time simulation model based on test system, as shown in Figure 7, are also depicted and compared in Figure 10. Although the extended SFR model ignores the topological structure of the network and cannot reflect the dynamic power of the branch, the initial frequency response, the minimum frequency and the frequency steady-state value of the extended SFR model have higher simulation accuracy. Compared with the whole time domain simulation results, the maximum error in the frequency drop is less than 0.005 Hz, and the frequency steady value error is less than 0.006 Hz; thus, the extended SFR model method can calculate the frequency response process of the system. Compared with the conventional SFR model (proposed in [18]), the proposed extended SFR model exhibits a smaller frequency nadir error and steady-state frequency error. It can also more efficaciously reflect the dynamic response characteristics of wind turbines.
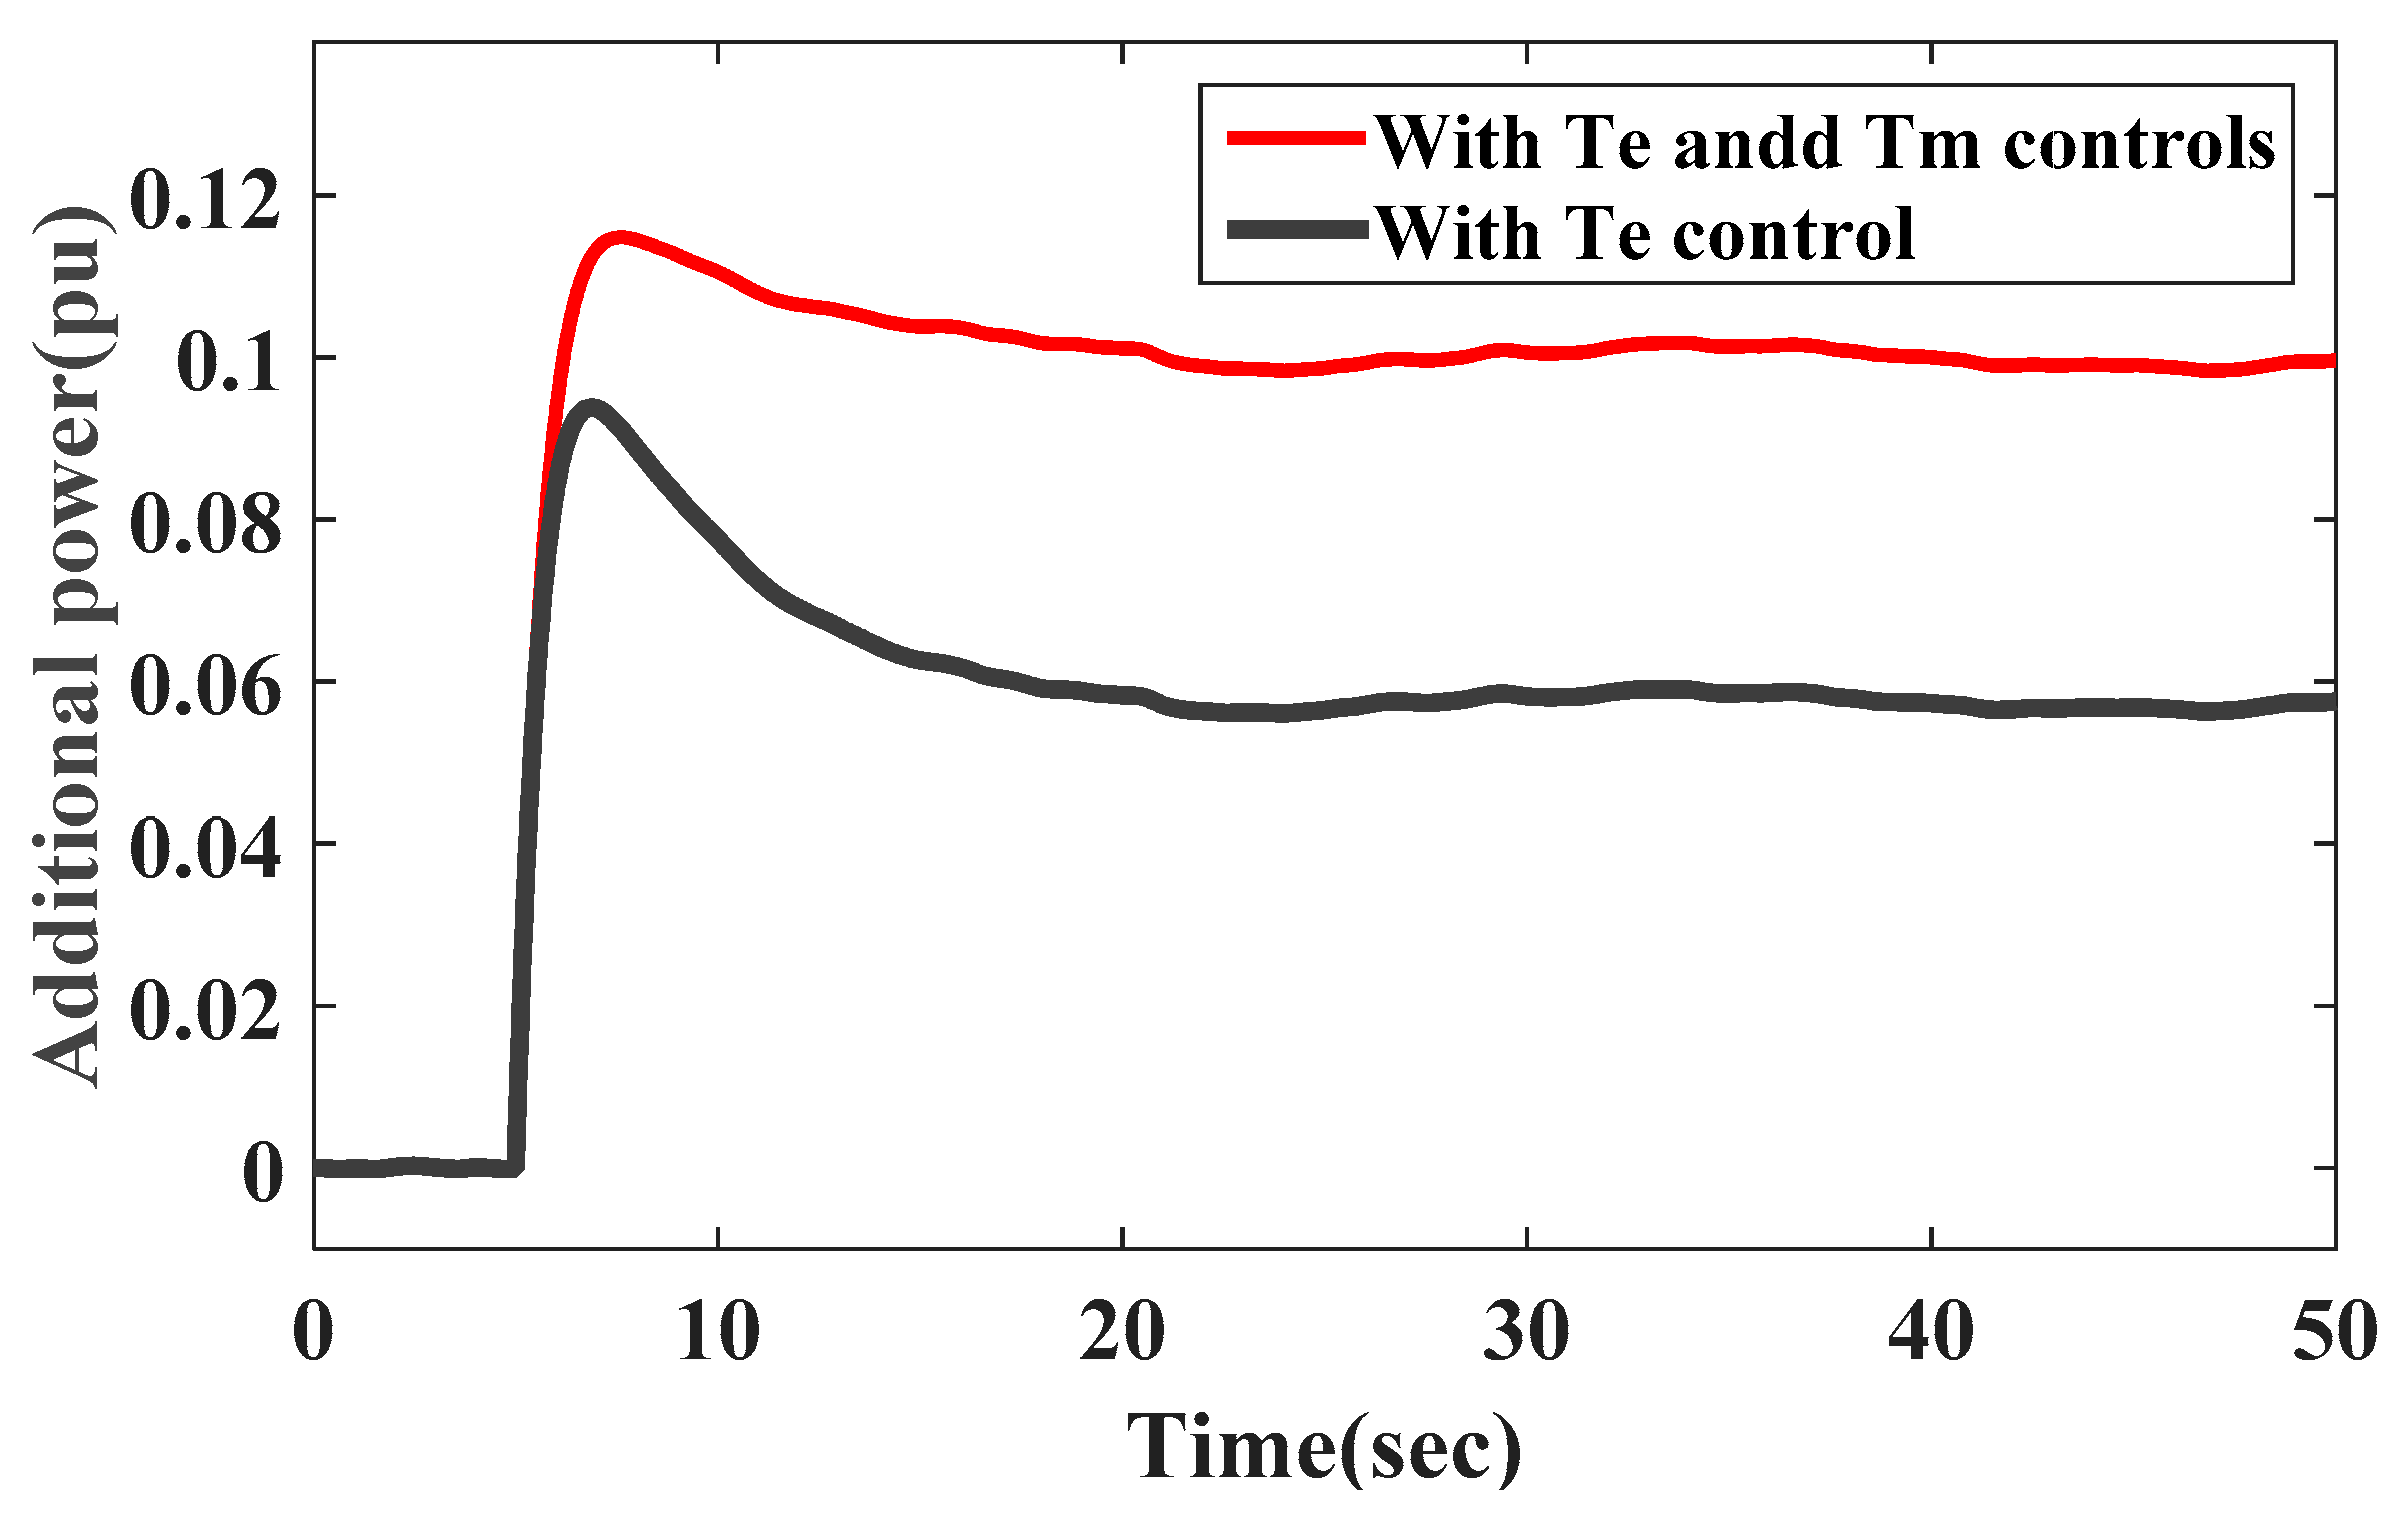
The WTG responds to the system frequency by controlling electromagnetic torque Te or mechanical torque Tm. The electromagnetic torque control in this paper refers to the virtual inertial control, and the mechanical torque control is the pitch-control-based deloading control. Figure 11 shows the dynamic frequency response and the additional power of the system with different torque control. Based on the extended SFR model, it can be seen that the frequency dynamic characteristics after disturbance can be improved when combined with Te control and Tm control; as a result, the minimum frequency and the steady-state frequency value are improved. When only the Te control is applied in the extended SFR model, the minimum frequency is 49.875 Hz, and the quasi steady state value is 49.925 Hz. When the Tm control is added, the system minimum frequency is 49.885, and the steady-state frequency value is 49.948 Hz. In addition, it can be seen that the control of adding Tm does not affect the initial rate of frequency change (see the enlarged diagram in Figure 11). Figure 12 shows the additional power-per-unit value of the WTG; after adding Tm control, the wind turbine can release a certain reserve power according to the change of the frequency. This part of the reserve power accelerates the rotor, thereby reducing the steady-state frequency deviation.
From the analysis in Section 3, it is suggested that parameters of virtual inertia control, such as kw, Rw and pitch-control-based deloading control kb, will affect the frequency dynamic response characteristics of the power system. Therefore, in order to evaluate the impact of parameters kw, Rw and kb on system specific frequency response, different values of parameter kw, Rw and kb are considered in Figure 13, Figure 14 and Figure 15. It is assumed that all load disturbances and wind speeds are the same in the simulation scenario.
From Figure 13, it can be seen that kw has almost no impact on the steady-state frequency value of the perturbed system, but affects the initial frequency change rate, the minimum frequency and the arrival time of minimum frequency of the perturbed system. The minimum frequency is comparatively higher when the value of kw is larger, and the initial frequency change rate becomes slower and the arrival time of the minimum frequency is later at higher value of kw. That means the frequency change rate is sensitive to the change of parameter kw; the simulation result is consistent with the analysis of (26) and Figure 3. Also, as can be seen from Figure 14, Rw mainly affects the minimum frequency; the minimum frequency is comparatively higher when the value of Rw is less; it has little effect on the rate of the frequency change, and also has a slight effect on the steady-state frequency value. This demonstrates that the inertial control of WTG can make a contribution to the frequency stabilization, and the larger kw and smaller Rw can play a greater role. However, the improvement in steady-state frequency deviation is not particularly good.
The impact of parameter kb on frequency dynamic response is shown in Figure 15, where kb represents the proportional relationship between the frequency deviation and the pitch angle deviation. It can be seen that kb does not affect the initial frequency change rate, but has a greater impact on the minimum frequency and the steady-state frequency values. With an increase of parameter kb, the initial frequency change rate of each frequency response curve is coincident, and the minimum frequency and the steady-state frequency values are higher. That means the minimum frequency and the steady-state frequency values are sensitive to the change of parameter kb. That is mainly because a higher kb setting will result in a larger reserve power controlled by pitch-control-based deloading control. The simulation result is also consistent with the analysis of (27) and Figure 4.
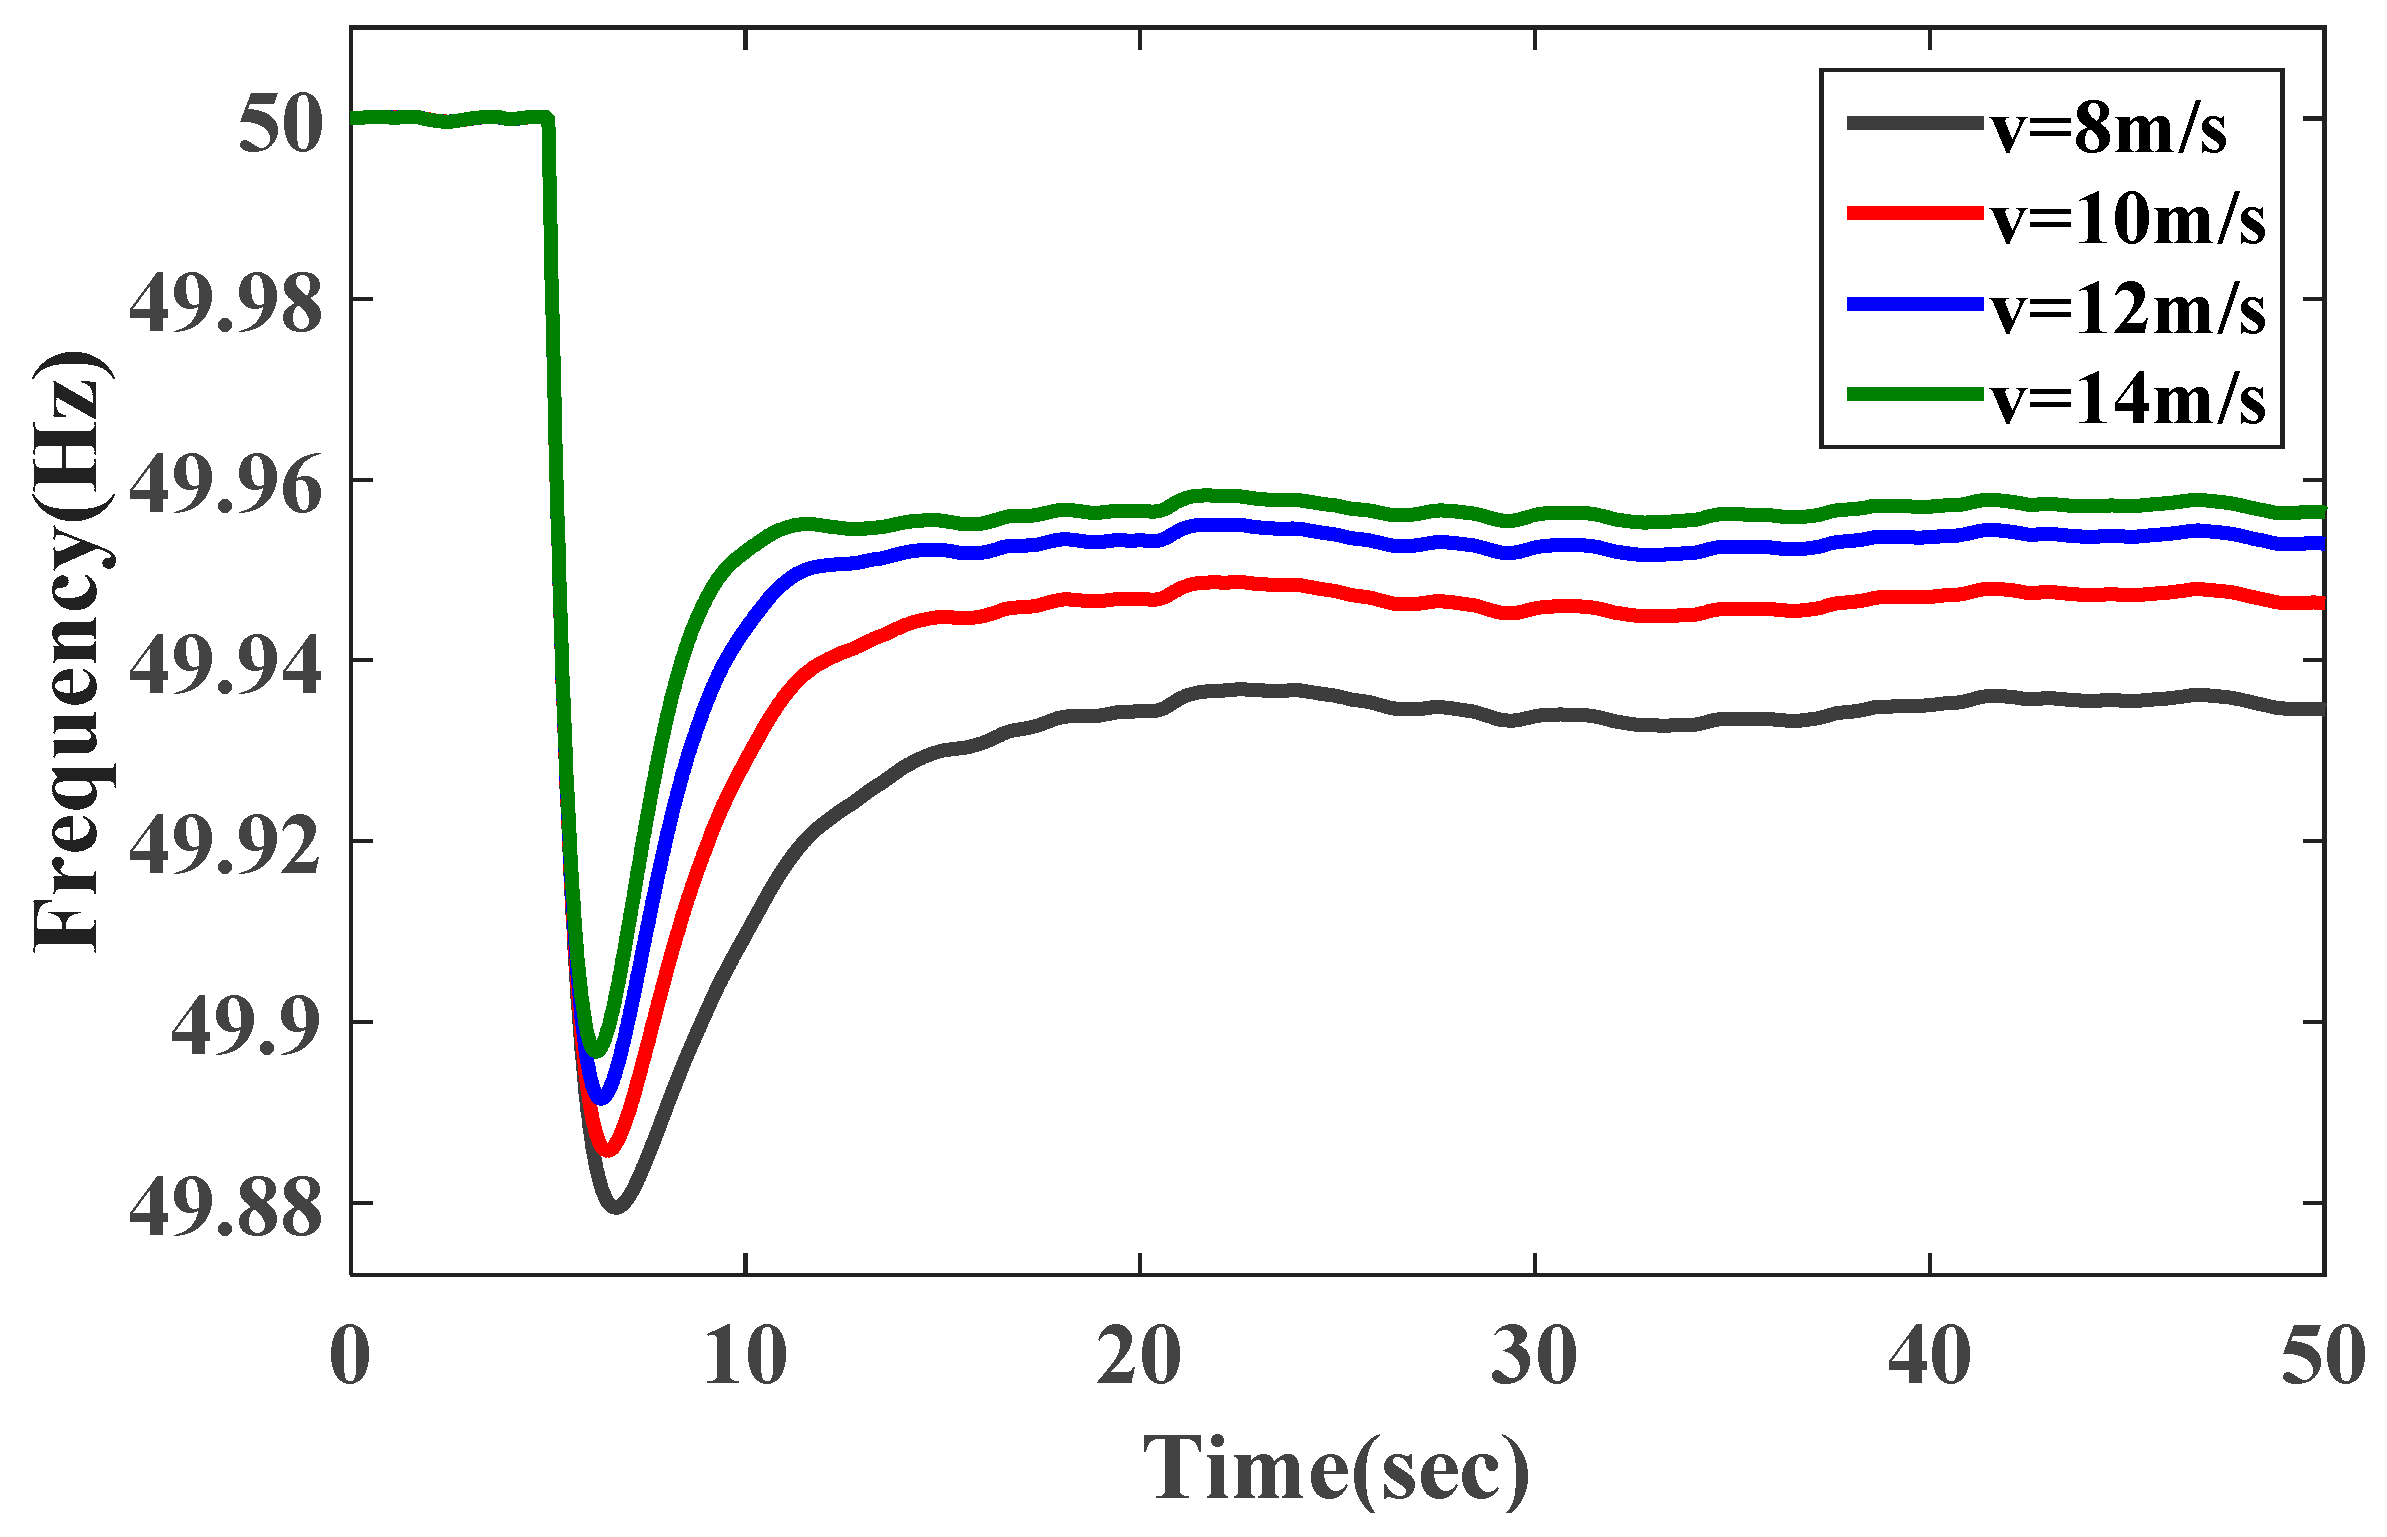
As mentioned above, the fluctuation of wind speed results into frequency variation. The impact of initial operating wind speed v on frequency dynamic response is shown in Figure 16. It can be seen that an increase in initial operating wind speed v improves the frequency dynamics, which can be particularly reflected by the dynamic indices of the minimum frequency and the steady-state frequency values. This is mainly because a higher initial operating wind speed v setting will also result in a larger output power of WTG and the change of the reserve power controlled by pitch-control-based deloading control.
The above analysis is based on load disturbance. In fact, the wind speed may change suddenly in the area where the wind resource fluctuates greatly. Meanwhile, according to Figure 2 and (25), sudden disturbance of wind speed will also affect the dynamic response frequency. The step wind speed model for WTG is considered as shown in Figure 17; it is also composed of base wind speed, gust wind speed, ramp wind speed and noise wind speed in order to present more realistic results [25,26]. It is assumed that the initial average operating wind speed is 12 m/s, which is the rated wind speed. The wind speed suddenly increased to 13 m/s at t = 50 s and suddenly decreased to 12.5 m/s at t = 100 s, as shown in Figure 17. Meanwhile, assume that only the wind speed disturbance occurs (∆Pd = 0). The frequency response and the active power response of the system under wind speed conditions shown in Figure 17 are shown in Figure 18 and Figure 19, respectively.
It can be observed from the Figure 18 that the frequency response trends are the same as the wind speed; namely, the sudden increase in wind speed will increase the value of system frequency. Conversely, the sudden decrease of wind speed will reduce the value of system frequency. But the frequency response is smoother (i.e., dip value is less) with a sudden disturbance in wind speed as compared to a sudden disturbance in load. That is mainly because the output power of WTG varies with the change of wind speed. The transfer function expression between the wind speed variation and output power variation of WTG is a first-order system as shown in Equation (21), which acts like a first-order low-pass filter, thus the inertial damping will be acted. Figure 19 shows that the sudden change in wind speed will change the power of two parts: one is the output power of the WTG itself (ΔP1), and another is the power released by the wind turbine (ΔP2) participating in frequency regulation. It is worth mentioning that the change in direction of ΔP1 and ΔP2 is reversed, and the magnitude of the change of ΔP2 is larger than ΔP1; thus, it is concluded that the variation of wind speed will bring frequency deviation of the system.
In addition, the frequency response for varying values of wind speed v is shown in Figure 20, it can be noticed that the dynamic response characteristics of frequency become worse when the wind speed is more abrupt. The result is extremely similar to varying the parameter ΔPd, the difference is that the frequency response is smoother (i.e., dip value is less) than mentioned above.
5. Conclusions
In this study, a linearized reduced-order model of WTG has been obtained by employing the small signal analysis theory. Based on the reduced-order model of WTG and the traditional SFR model, an extended SFR model, considering wind power participation in frequency regulation, is presented. Compared to the time-simulation model, the extended SFR model not only has a higher simulation accuracy for the dynamic frequency response index, but also can provide a simpler, clearer and faster way to evaluate the dynamic frequency response characteristic for a high-wind integrated power system during load and wind speed disturbances.
Based on the extended SFR model, the impact of additional frequency control parameters and wind speed disturbances on the system dynamic frequency response characteristics are investigated. The results indicate that higher values of parameters kw, kb and a lower value of parameter Rw contribute to the improvement of dynamic frequency response characteristic and wind speed disturbance. They also affect the dynamic frequency response characteristics of the system, making it smoother (i.e., dip value is less) as compared to the sudden disturbance in load.
Acknowledgments
This work is supported by the National Natural Science Foundation of China (NSFC) (Grant No. 61503197), the Projects of International Cooperation and Exchanges NSFC (Grant No. 51561145011), the Natural Science Foundation of Jiangsu Province (Grant No. BK20140872), the Technology Project of State Grid Electric Power Company (Grant No. 13442XT170022), the Technology Project of State Grid Electric Power Company (Grant No. 8516000829) and the Open Fund of State Key Laboratory of Operation and Control of Renewable Energy & Storage Systems (Grant No. 8516000853).
Author Contributions
Yi Tang and Jianfeng Dai conceived and designed the study; Jianfeng Dai analyzed the data, performed the experiments and wrote the paper; Jia Ning helped analyze the data and edited the figures and tables; Jie Dang, Xinshou Tian and Yan Li provide some actual wind power parameters and checked the results of this work. All the authors read and approved the final manuscript.
Conflicts of Interest
The authors declare no conflict of interest.
Appendix A
WTG Parameters:
Rated power of WTG = 1.5 MW, Rated wind speed at 12 m/s, Hw = 5, ω = 0.8054, v = 0.875, kp = 0.73, β = 4°, Cpref = 0.9547, λref = 0.9986, kc = 0.0771, kβ = −0.1422, kw = 0.2, Rw = 0.05, kb = 600.
Traditional Power System Parameters:
H = 5, D = 1, TR = 7, FH = 0.3, R = 0.05.
References
- Benidris, M.; Elsaiah, S.; Sulaeman, S.; Mitra, J. Transient stability of distributed generators in the presence of energy storage devices. In Proceedings of the IEEE North American Power Symposium, Champaign, IL, USA, 9–11 September 2012. [Google Scholar]
- Chang, C.; Wu, Y.; Chen, B. Determination of maximum wind power penetration in a isolated island system by considering spinning reserve. Energies 2016, 9, 688. [Google Scholar] [CrossRef]
- Vidyanandan, K.V.; Senroy, N. Primary frequency regulation by deloaded wind turbines using variable droop. IEEE Trans. Power Syst. 2013, 28, 837–846. [Google Scholar] [CrossRef]
- Margaris, I.D.; Papathanassiou, S.A.; Hatziargyriou, N.D.; Hansen, A.D.; Sørensen, P. Frequency Control in Autonomous Power Systems With High Wind Power Penetration. IEEE Trans. Sustain. Energy 2012, 3, 189–199. [Google Scholar] [CrossRef]
- Kim, K.H.; Tan, L.; Lee, D.C.; Song, S.; Kim, E.H. Maximum Output Power Tracking Control in Variable-Speed Wind Turbine Systems Considering Rotor Inertial Power. IEEE Trans. Ind. Electron. 2013, 60, 3207–3217. [Google Scholar] [CrossRef]
- Tang, Y.; Dai, J.; Wang, Q.; Feng, Y. Frequency Control Strategy for Black Starts via PMSG-Based Wind Power Generation. Energies 2017, 10, 358. [Google Scholar] [CrossRef]
- Zhang, X.; Wang, Y.; Fu, Y.; Xu, L. A novel method for obtaining virtual inertial response of DFIG-based wind turbines. Wind Energy 2016, 19, 313–328. [Google Scholar] [CrossRef]
- Wang, S.; Hu, J.; Yuan, X.; Sun, L. On Inertial Dynamics of Virtual-Synchronous-Controlled DFIG-Based Wind Turbines. IEEE Trans. Energy Convers. 2015, 30, 1691–1702. [Google Scholar] [CrossRef]
- Jeong, Y.; Johnson, K.; Fleming, P. Comparison and testing of power reserve control strategies for grid-connected wind turbines. Wind Energy 2014, 17, 343–358. [Google Scholar] [CrossRef]
- Bao, Y.; Li, Y. On deloading control strategies of wind generators for system frequency regulation. Int. Trans. Electr. Energy Syst. 2015, 25, 623–635. [Google Scholar] [CrossRef]
- Gui, Y.; Kim, C.; Chung, C.C. Temporary primary frequency control support by deloaded wind power plant using input-output linearization. In Proceedings of the IEEE International Conference on Control, Automation and Systems, Gyeongju, Korea, 16–19 October 2017. [Google Scholar]
- Krishan, O. Frequency regulation in a standalone wind-diesel hybrid power system using pitch-angle controller. In Proceedings of the IEEE International Conference on Computing for Sustainable Global Development, New Delhi, India, 16–18 March 2016. [Google Scholar]
- Díaz-González, F.; Hau, M.; Sumper, A.; Gomis-Bellmunt, O. Participation of wind power plants in system frequency control: Review of grid code requirements and control methods. Renew. Sustain. Energy Rev. 2014, 34, 551–564. [Google Scholar] [CrossRef]
- Gu, W.; Liu, W.; Wu, Z.; Zhao, B.; Chen, W. Cooperative Control to Enhance the Frequency Stability of Islanded Microgrids with DFIG-SMES. Energies 2013, 6, 3951–3971. [Google Scholar] [CrossRef]
- Fu, Y.; Zhang, X.; Yang, H.; Wang, H. Active participation of variable speed wind turbine in inertial and primary frequency regulations. Electr. Power Syst. Res. 2017, 147, 174–184. [Google Scholar] [CrossRef]
- Zhao, J.; Xue, L.; Fu, Y.; Hu, X.; Li, F. Coordinated Microgrid Frequency Regulation Based on DFIG Variable Coefficient Using Virtual Inertia and Primary Frequency Control. IEEE Trans. Energy Convers. 2016, 31, 833–845. [Google Scholar] [CrossRef]
- Xu, J.; Shi, W.; Xu, Q. A Fast Assessment Method for Power System Dynamic Frequency Response to Wind Power Fluctuation. Autom. Electr. Power Syst. 2015, 39, 22–27. [Google Scholar]
- Wang, X.; Choi, S. A statistical approach to assess the impact of wind power generation on network frequency. In Proceedings of the IEEE International Conference on Control and Automation, Christchurch, New Zealand, 9–11 December 2009. [Google Scholar]
- Anderson, P.M.; Mirheydar, M. A low-order system frequency response model. IEEE Trans. Power Syst. 2002, 5, 720–729. [Google Scholar] [CrossRef]
- Katsuura, H.; Sprecher, D.A. Computational aspects of Kolmogorov’s superposition theorem. Neural Netw. 1994, 7, 455–461. [Google Scholar] [CrossRef]
- Walsh, G.C.; Ye, H.; Bushnell, L.G. Stability analysis of networked control systems. IEEE Trans. Control Syst. Technol. 2002, 10, 438–446. [Google Scholar] [CrossRef]
- Porter, A. Basic Principles of Automatic Control Systems. Proc. Inst. Mech. Eng. 1948, 159, 25–45. [Google Scholar] [CrossRef]
- Zou, J.; Peng, C.; Yan, Y.; Zheng, H.; Li, Y. A survey of dynamic equivalent modeling for wind farm. Renew. Sustain. Energy Rev. 2014, 40, 956–963. [Google Scholar] [CrossRef]
- Zhou, H.; Song, Z.; Wang, J.; Xue, Y. A Review on Dynamic Equivalent Methods for Large Scale Wind Farms. In Proceedings of the IEEE Asia-Pacific Power and Energy Engineering Conference, Wuhan, China, 25–28 March 2011. [Google Scholar]
- Pradhan, C.; Bhende, C.N. Adaptive deloading of stand-alone wind farm for primary frequency control. Energy Syst. 2015, 6, 109–127. [Google Scholar] [CrossRef]
- Lee, D.J.; Wang, L. Small-Signal Stability Analysis of an Autonomous Hybrid Renewable Energy Power Generation/Energy Storage System Part I: Time-Domain Simulations. IEEE Trans. Energy Convers. 2015, 23, 311–320. [Google Scholar] [CrossRef]
Figure 1.
Frequency combination control strategy of wind turbine generators (WTGs).

Figure 2.
Extended system frequency response (SFR) model for the high-wind integrated power system.

Figure 3.
Curves of initial frequency change rate (IFCR) under different parameter kw.

Figure 4.
Curves of steady-state frequency deviation (SFD) under different parameter kb.

Figure 5.
Bode plots of TOL(s) and TCL(s).

Figure 6.
Bode plots of the closed-loop system for stability analysis.

Figure 7.
Five machine fourteen bus test system.

Figure 8.
Wind speed variations.

Figure 9.
Comparison of reduced-order model with time simulation model of wind farm.

Figure 10.
Comparison of SFR model with time simulation model of test system.

Figure 11.
Frequency response with different torque control.

Figure 12.
Additional power response of WTG with different torque control.

Figure 13.
The impact of parameter kw on frequency dynamic response.

Figure 14.
The impact of parameter Rw on frequency dynamic response.

Figure 15.
The impact of parameter kb on frequency dynamic response.

Figure 16.
The impact of initial operating wind speed v on frequency dynamic response.

Figure 17.
Wind speed variations with sudden disturbance.

Figure 18.
Frequency response when the wind speed change suddenly.

Figure 19.
Active power response when the wind speed change suddenly.

Figure 20.
Frequency response for varying values of wind speed v.

© 2017 by the authors. Licensee MDPI, Basel, Switzerland. This article is an open access article distributed under the terms and conditions of the Creative Commons Attribution (CC BY) license (http://creativecommons.org/licenses/by/4.0/).
Share and Cite
MDPI and ACS Style
Tang, Y.; Dai, J.; Ning, J.; Dang, J.; Li, Y.; Tian, X. An Extended System Frequency Response Model Considering Wind Power Participation in Frequency Regulation. Energies 2017, 10, 1797. https://doi.org/10.3390/en10111797
AMA Style
Tang Y, Dai J, Ning J, Dang J, Li Y, Tian X. An Extended System Frequency Response Model Considering Wind Power Participation in Frequency Regulation. Energies. 2017; 10(11):1797. https://doi.org/10.3390/en10111797
Chicago/Turabian StyleTang, Yi, Jianfeng Dai, Jia Ning, Jie Dang, Yan Li, and Xinshou Tian. 2017. "An Extended System Frequency Response Model Considering Wind Power Participation in Frequency Regulation" Energies 10, no. 11: 1797. https://doi.org/10.3390/en10111797
Note that from the first issue of 2016, this journal uses article numbers instead of page numbers. See further details here.