LNG–Air Mixture as a Supplementary Energy Injection into a Biogas Distribution Network


1
School of Urban Construction and Environmental Engineering, Chongqing University, Chongqing 400045, China
2
Key Laboratory of Three Gorges Reservoir Region’s Eco-Environment, Ministry of Education, Chongqing University, Chongqing 400045, China
3
Joint International Laboratory of Green Building and Built Environments, Ministry of Education, Chongqing University, Chongqing 400045, China
4
Department of Chemical and Environmental Engineering, University of Nottingham, Nottingham NG7 2RD, UK
*
Author to whom correspondence should be addressed.
Energies 2017, 10(11), 1902; https://doi.org/10.3390/en10111902
Submission received: 21 October 2017
/
Revised: 16 November 2017
/
Accepted: 17 November 2017
/
Published: 19 November 2017
Abstract
:Biogas production efficiency fluctuates with climate variations and agricultural arrangements, which pose a limiting factor upon its single supply to end users via a regional exclusive network, especially in peak demand. In this paper, an appropriate methodology to address the contradiction between biogas supply and demand is proposed. Methane conditioned by the addition of air is described, and can be a supplementary energy injected into a biogas distribution network. To accomplish the mixing process and also inject the exhaust mixture into the distribution system, a mixer–ejector was introduced and integrated into the biogas grid. Finally, the fundamental combustion behaviors of mixed gases were estimated through the analysis of flame appearance, contamination emissions, and the flame stability region. The results showed that the methane/air mixture with a mixing ratio ranging from 49/51 to 53/47 could interchange biogas commendably, and good combustion behavior was obtained on a typical biogas-burning appliance.
1. Introduction
Biogas from the anaerobic digestion of organic sources is deemed as an environmentally-sustainable energy that may contribute to alleviating energy crises, and reducing carbon dioxide (CO2) emissions [1,2]. In the past few decades, China’s biogas digester projects have experienced a rapid construction process, which has improved the family energy consumption structure and promoted the development of livestock breeding and farm production in rural China [3].
Compared to small-scale household digesters [4,5,6], centralized biogas plants (CBPs) [7] based on breeding farms have been the subject of increasing attention in rural areas for their broader uses. Numerous researchers and organizations [8,9,10,11,12,13] have performed considerable investigations into the applications of CBP biogas energy in upgraded or raw forms. Refined biogas has diverse utilization pathways such as automotive fuels, fuel cells, injection into the natural gas (NG) grid, and combined heat and power, which have been put into practical application in many European countries such as Sweden, England, Germany, Denmark, and the Netherlands. Although upgraded biogas can be converted into electricity using a fuel cell or injected into an NG network, the high-cost of the purification process makes it unaffordable for rural households in undeveloped countries [14]. Conversely, only a cleaning process for trace compound removal is carried out before the raw biogas is utilized for cooking, heating, and small-scale power generation through regional distribution biogas grids [15,16,17]. Moreover, CBPs are usually built in the suburbs and have limited access to pipeline NG services [18,19]. In view of the economically-attractive reasons and the site selection for the construction of CBPs, the predominant approach for CBP biogas usage is used on-site in the form of raw biogas.
So far, few attempts have been made to determine the needs of under-developed areas, which take into account the biogas application characteristics with regional suitability. Followed by the on-site use of biogas, the problem involves the limited supply resulting from underproduction and peak energy periods. The biogas yield varies dramatically with ambient temperature conditions and varying fermenting materials [20,21], which results in insufficient biogas productivity versus the gas demand during the winter period [22,23]. Furthermore, residential energy consumption may push biogas demands above the capacity of the CBP during peak hours. As a result, it is extremely important to fill the energy gap between biogas supply and demand when it is delivered to the residents by means of pipeline.
One perspective when addressing the contradiction between biogas supply and demand is to select an alternative fuel gas as the supplementary energy, allowing the existing biogas infrastructure and appliances to be used for direct transport and combustion without any modification, since all burners and combustion systems are optimized for specific fuel types and characteristics, within the specified limits of appliance inlet pressure. Whilst burners can tolerate some variation in properties, the fuel has to be manipulated to ensure that it suits the equipment [24]. The impact of using dissimilar gas provided in the existing biogas system needs to be carefully investigated [25,26].
The objective of this paper was to propose a technique to deal with the imbalance between supply and demand of a biogas-provision system in rural China when using raw or slightly-cleaned biogas as piped fuel on site. A mixer–ejector was introduced and integrated into the biogas network to mix liquefied natural gas (LNG) with air, and then inject the exhaust mixture into the pipeline system to accommodate the consumption demand when encountering insufficient biogas supply. A pilot project was discussed with the aim of testing the interchangeability of biogas with LNG–air mixed gas and the combustion performance of the LNG–air mixture on a typical biogas appliance.
2. Theoretical Analysis
2.1. Interchangeability of Biogas with Methane-Air
In accordance with the Chinese regulation for gas classification [27], raw biogas from fermentation is defined as a 6T gas, which is regarded as a methane-short NG, and methane-enriched NG is defined as a 12T gas, which is the most popular type of gaseous fuel in China. In this study, a synthesized gas consisting of 60% methane and 40% CO2 was used as the experimental biogas, and LNG containing 99.7% CH4 was assumed to be pure methane for the basic equivalent temperament characteristics. The compositions and properties of these gases are listed in Table 1.
Domestic biogas-burning appliances in the Chinese market are almost primarily of a partially premixed type. These are designed and basically built on the basis of the typical constituents of a reference biogas, which consists of 53.4% methane (CH4) and 46.6% carbon dioxide. The biogas appliance may either not work at all, or not perform optimally when run on gases with various components. Thus, the interchangeability of these gases needs to be taken into consideration. Gas interchangeability is defined as the ability to substitute one gaseous fuel for another in a combustion application without affecting the satisfactory operation [28]. The American Gas Association [29] have developed multiple indices, namely, the lifting index, flashback index, and yellow tipping index to describe these abilities. For China’s fuel gas industry, the Wobbe index (WI) and combustion potential (CP) are two of the most common indices specified by criteria to predict the interchangeability of fuel gases.
WI is directly proportional to the thermal energy released on the burner of a gas appliance and is inversely proportional to the relative density of gas. The calculation of WI is thus given by Equation (1):
CP reflects the burning velocity of the gas, which indicates the tendency for flashback and lift-off. It can be calculated as
where K is the oxygen content in the gas correction coefficient, K = 1 + 0.0054O22; O2 is the O2 concentration in gas, %; H2 is the H2 concentration in gas, %; CmHn is the CmHn concentration in gas, %; CO is the CO concentration in gas, %; and CH4 is the CH4 concentration in gas, %.
If one gas is replaced by another for use on a burner, the WI and CP values of the substitution must be nearly equivalent to the original gas to obtain the approximate thermal input, premixed air, and combustion regime. Important boundary conditions are set out by regulations [27] where the WI of a 6T reference gas should range between 21.76–25.01 MJ/m3, and the CP ranges from 17.3–42.7. Both the upper and lower values of the WI and CP total range should not be exceeded.
Technically, methane conditioned with air can precisely influence the heating value and relative density of a mixture so that its properties may approach the gas quality set out by the regulations and burner itself. Figure 1 illustrates the possible fuel gas mixtures with a WI range of 21.76–25.01 MJ/m3, and a CP range of 17.3–42.7, which can be achieved with the addition of air. On the basis of dual strict restrictions, only a narrow air content of 49–53 vol-% is clearly allowed to be added into the methane–air mixture, whose parameters are within the range enabled by the reference gas. In this case, the total mixture (when the methane–air mixture is added to supplement the biogas grid) can satisfy the interchangeability requirements under different ratios of biogas supply.
2.2. Flammability of the Methane-Air Mixed Gas
In this study, to achieve biogas substitution, 47–51 vol-% air was mixed into methane, or in other words, the combustible gas was accompanied with an oxidizer, which means that fire or an explosion might occur in the case of the minimum ignition energy. Under no circumstances should detonation risks arise from the mixing process. Therefore, for the safe mixing and use of a methane/air fuel, it is of vital importance to comprehensively interrogate its explosive behaviors.
The lowest and highest concentrations of a particular gas necessary to support its combustion in air are defined as the lower explosive limit (LEL) and upper explosive limit (UEL), respectively. The range between the LEL and UEL is known as the flammable range (explosive limits) for that gas. The explosive limits of the combustible components need to be discussed before calculating the mixed gas explosive limits due to the existence of nonflammable components. The volume fraction of combustible components need to be readjusted after deducting the content of oxygen and inert gas (treated as N2). Thus, the explosive limits of a gas mixture containing no air base can be calculated as:
where L is the explosive limit of the gas with no air base, %; ro is the oxygen concentration in the gas mixture, %; rk is the combustible components content in the gas mixture, %; Lk are the explosive limits of the combustible components in the gas mixture, %; and rN is the inert gas content in the gas mixture, %.
From the above equation and the definition of the total gas mixture concentration, the gas explosive limits of the total mixture containing air can be derived as:
where LT is the total explosive limit of gas containing air.
2.2.1. Explosive Limits of Methane-Air
The LEL and UEL of pure methane is 5.1% and 15.0%, respectively. During the mixing process, the lowest volume fraction of methane in the mixture is required to be 49%, which is three times higher than the UEL of pure methane, implying that it is a safe action. When methane is conditioned with air, its explosive limits can be calculated from the relevant parameter of the mixed gas adopting the above formulas. The explosive limits of the various fuel gases are listed in Table 2. It can be seen that several gases have a similar flammable range, though both the LEL and UEL of methane/air are a little higher than that of biogas.
2.2.2. Explosive Limits of the Total Mixture
Figure 2 depicts the potential explosive limits of a total mixture containing biogas and additional gas (methane/air mixture for conditioning), based upon the methane/air supply levels in the grid varying from 0–100%, to which methane/air (in a ratio of 53/47 and 49/51, respectively) was added. We observed from this figure that the LEL of mixtures was at the very least 8%, and it trended upwards as the methane/air substitution ratio increased. The higher LEL contributed to reducing the possibility of fire or explosion occurrence when undergoing a gas leak. Moreover, as the methane/air fraction increased, all the explosive limits were raised. Additionally, the total mixture explosive limits were approximately 20% with the addition of methane/air at a ratio of either 49/53 or 53/47. For injection into a regional distribution network, the gas must be odorized so that leaks can be readily detected.
3. Experimental Setup
3.1. A Pilot Blending System
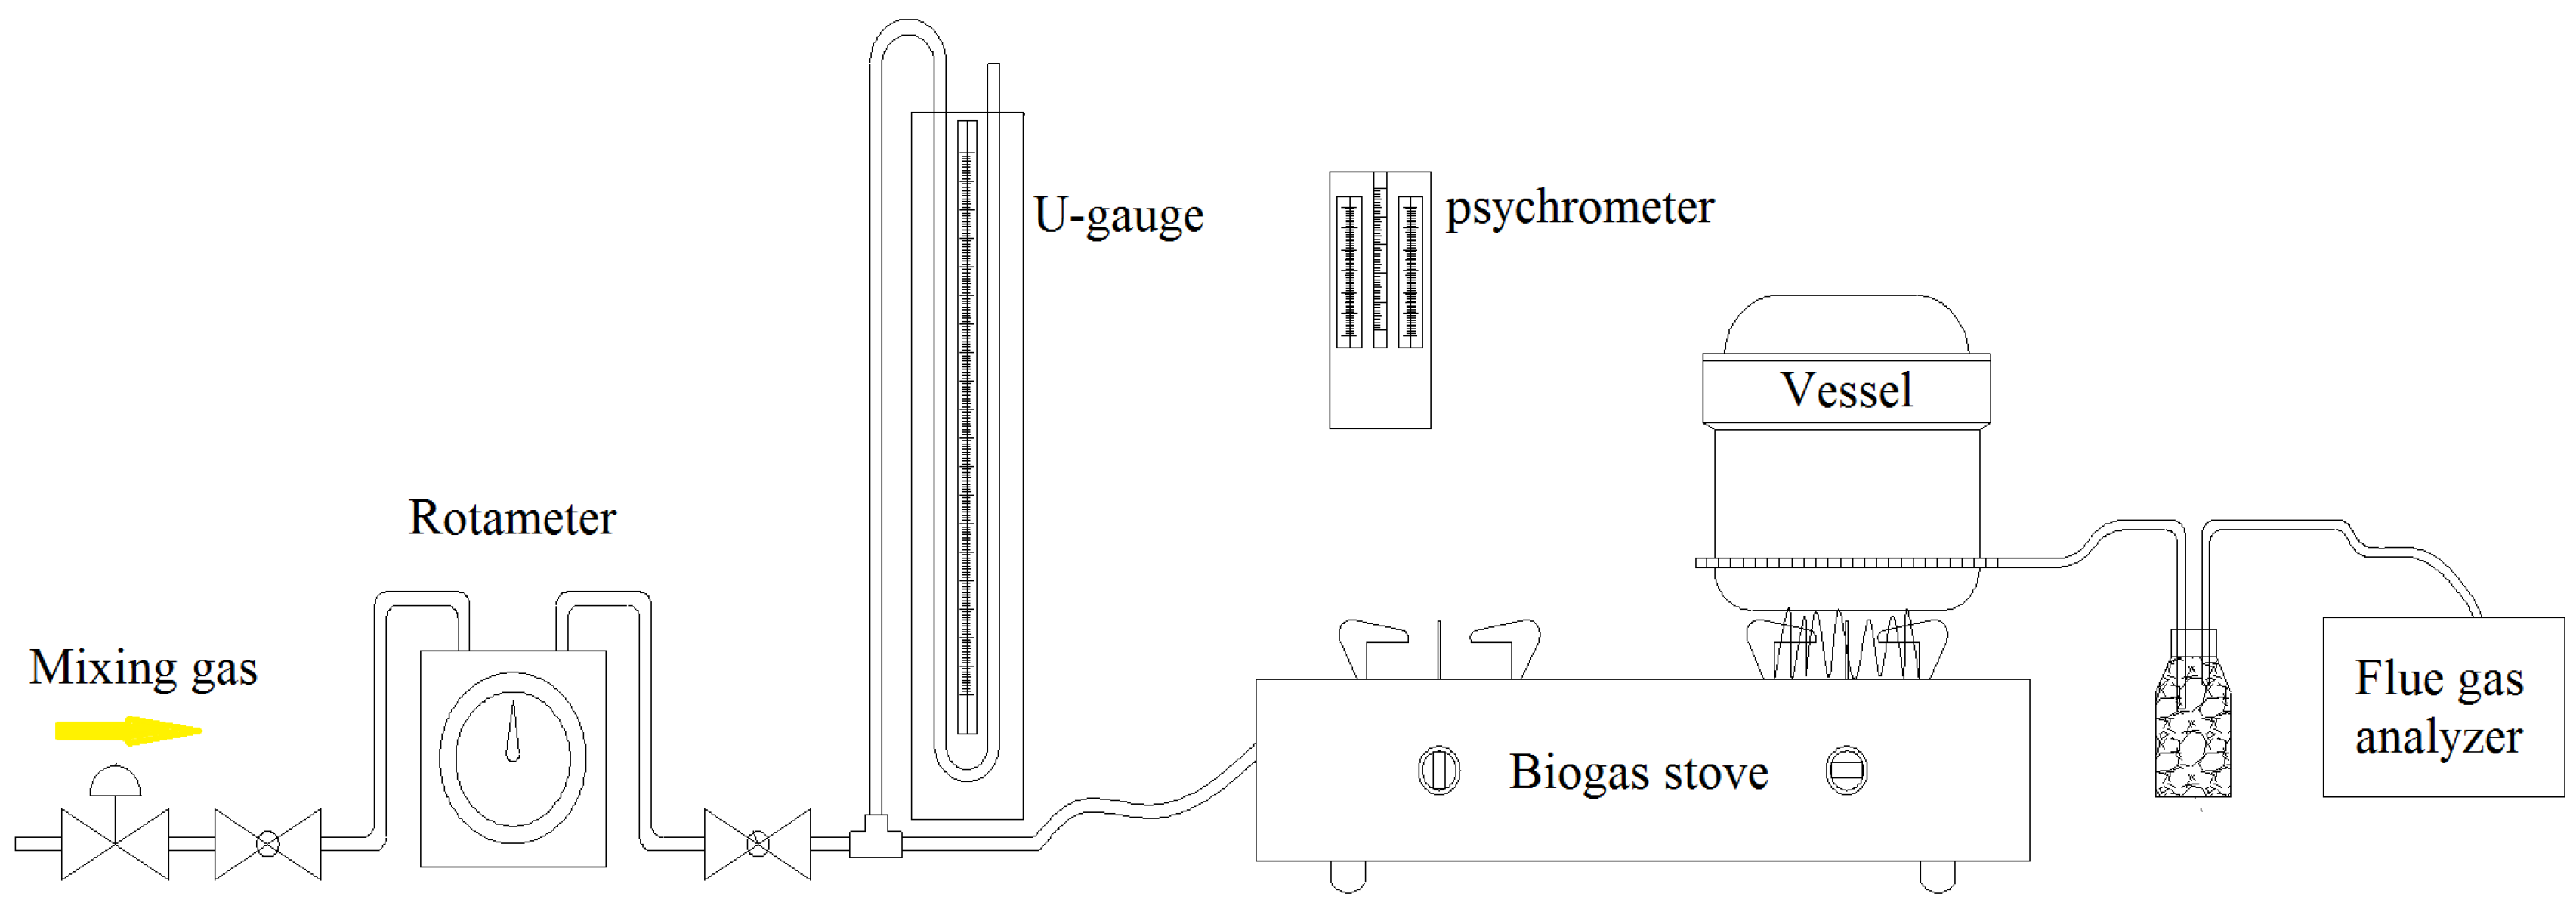
There are three frequently-employed blending techniques: in the LNG tanks, in the send-out section, and in the transmission network [30]. A blending system was designed in this research to mix LNG with air before adding the LNG–air mixture into the biogas network, as shown in Figure 3. Gasified LNG from the cylindrical vessel enters the exhaust mixer–ejector under a given feed pressure after filtering and metering, which forms a negative pressure area in the suction chamber. Consequently, air flowing through the check valve will be inhaled into a mixer–ejector to accomplish the mixing process with methane. Finally, the mixed gas through intensive mixing will flow out of the diffuser, which is then delivered to the biogas system after passing across the root-type flow-meter.
3.2. Combustion Experimental Rigs
The WI and CP indices discussed above were employed to determine the interchangeability of the biogas and LNG–air mixture. One gas can be substituted fully by another gas by means of a favorable and stable combustion performance on the appliance, as well as no occurrence of specific combustion phenomena including yellow tipping, flame lifting, flashback, and incomplete combustion. In this case, flame stabilization, characterized by the primary air coefficient and thermal intensity of the burner port, would provide a deeper insight into the genetic combustion characteristics and adaptability of substitution.
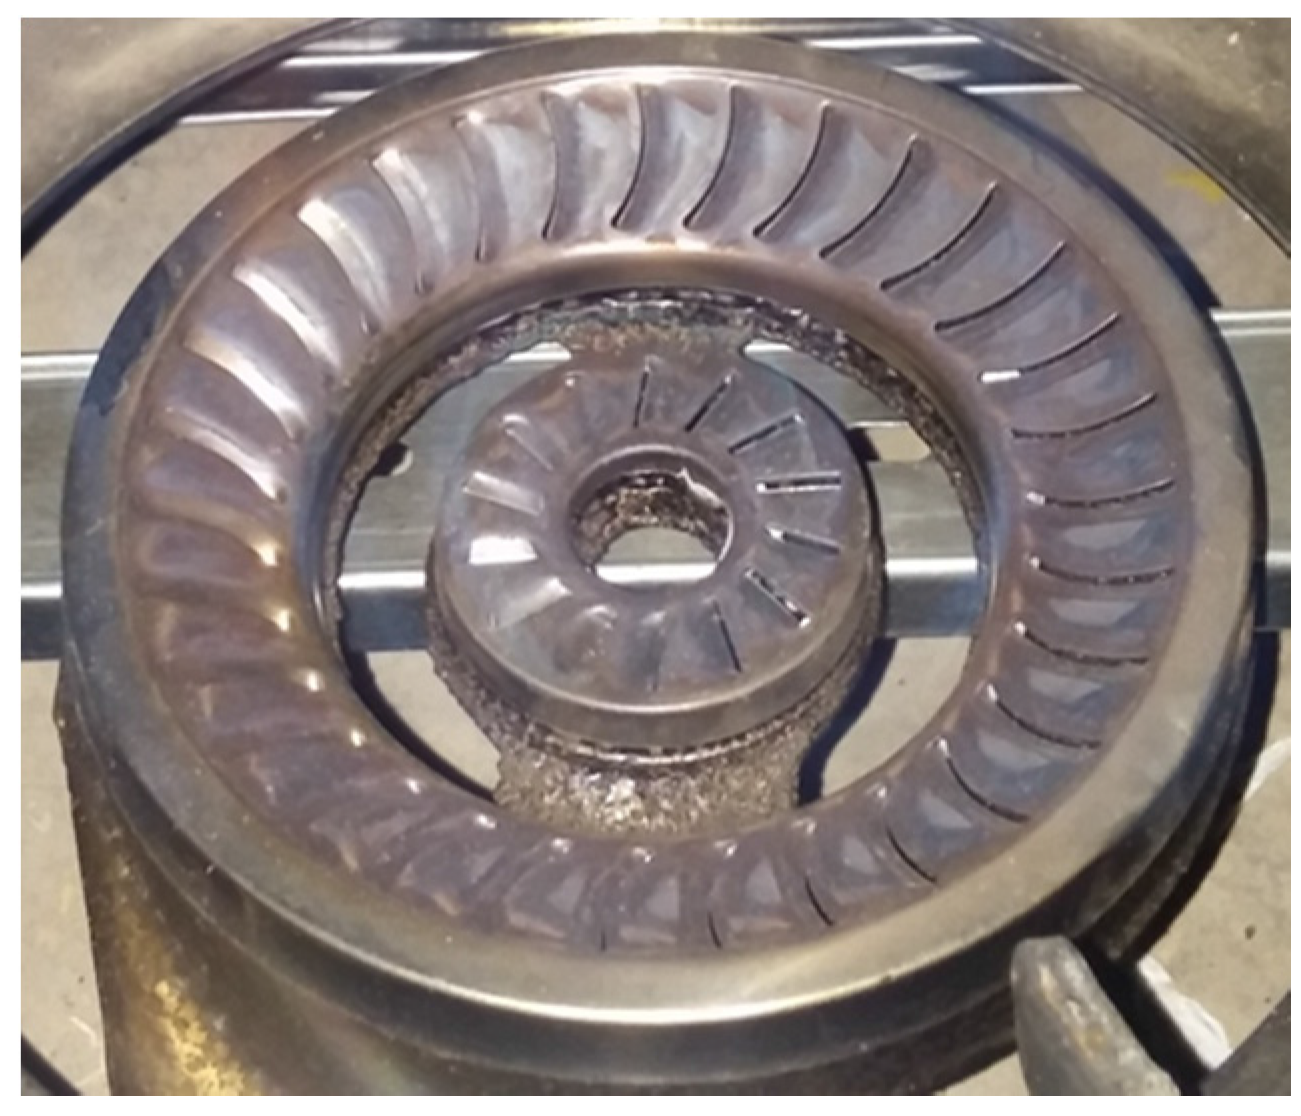
The 6T gas stove adopted in this study is a typical swirling burner that is ubiquitous in the Chinese market. Figure 5 exhibits the burn head with an inner ring cap and an outer ring cap with their own mixing chambers. The evenly premixed mixture of fuel and primary air swirls outward through the bar ports, forming a swirling fluid to obtain a higher, more efficient swirl-flow combustion. The specific technical parameters of the burner caps are shown in Table 4, and the experimental system for testing the combustion performance is presented in Figure 6. The corresponding operating procedure was derived from the measurements and methods section of the national standard [29,31] and was summarized in a previous paper [32].
Considering the uncertainty from the ambient conditions, operation, and instruments, tests were carried out at least twice under each operating condition to verify the robustness of the experimental results. When the deviation of the measured results was within ±2%, their mean values were regarded as the final results.
4. Results
4.1. Experimental Results of Blending
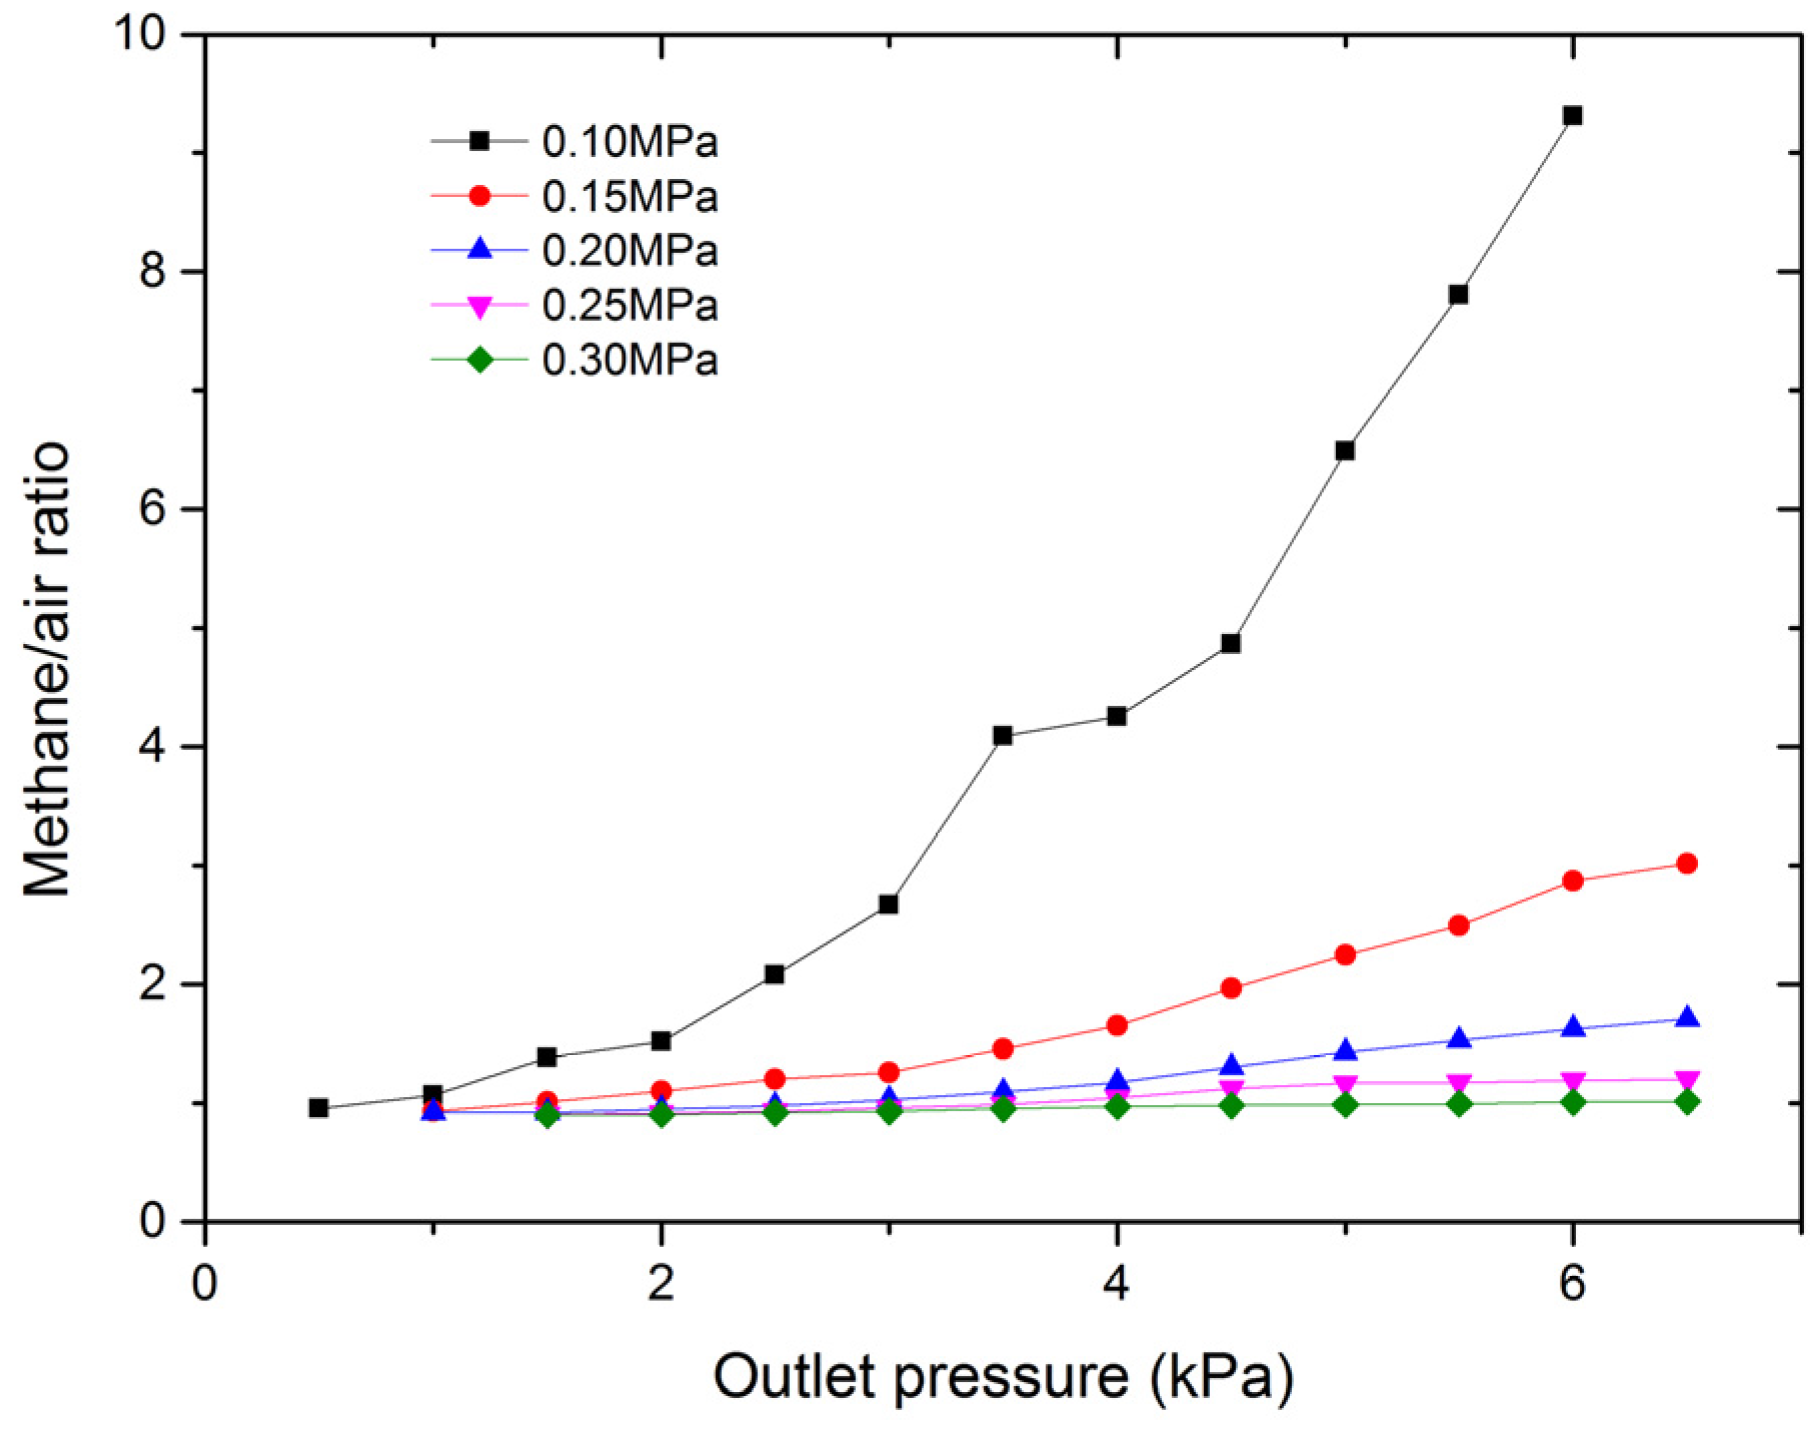
Once the ejector geometry was defined, its performance behavior was based on the operating conditions. Blending experiments were conducted at a wide range of inlet pressures (0.10–0.30 MPa) and outlet pressures (0.5–6.5 kPa). In general, as can be seen in Figure 7, the trend was virtually mirrored by the methane/air ratio, which increased significantly with an increase in the outlet pressure at a constant inlet pressure. This was caused by the smaller pressure difference between the mixer-ejector, which created less air intake. In contrast, as inlet pressure increased, there was a reduction in the methane/air ratio due to a greater pressure difference between the entrance and exit of the ejector. It is noteworthy that the methane/air ratio increased with the outlet pressure, but the increasing trend gradually became insignificant with the higher inlet pressure when compared with those variation line charts comprehensively.
Consequently, to obtain the target entrainment ratio (i.e., methane/air ratio within 49/51 and 53/47) and the permitted oven former pressure, the induced pressure needed to be maintained over 0.25 MPa.
4.2. Experimental Results of Combustion
The blending system managed to maintain the discharge pressure of the oven’s former pressure between 0.8 and 1.6 kPa at intervals of 0.2 kPa. The CH4 and air volumetric ratio was fixed at 53:47 (substitute gas), which is the allowable maximum CH4:air ratio, to investigate its burning characteristics and emission performance. As a comparative case, gas with 59/41 methane–air ratio (comparative gas) was applied to analyze the proportional scope of the constituent that the stove could be adapted to.
4.2.1. Flame Shape
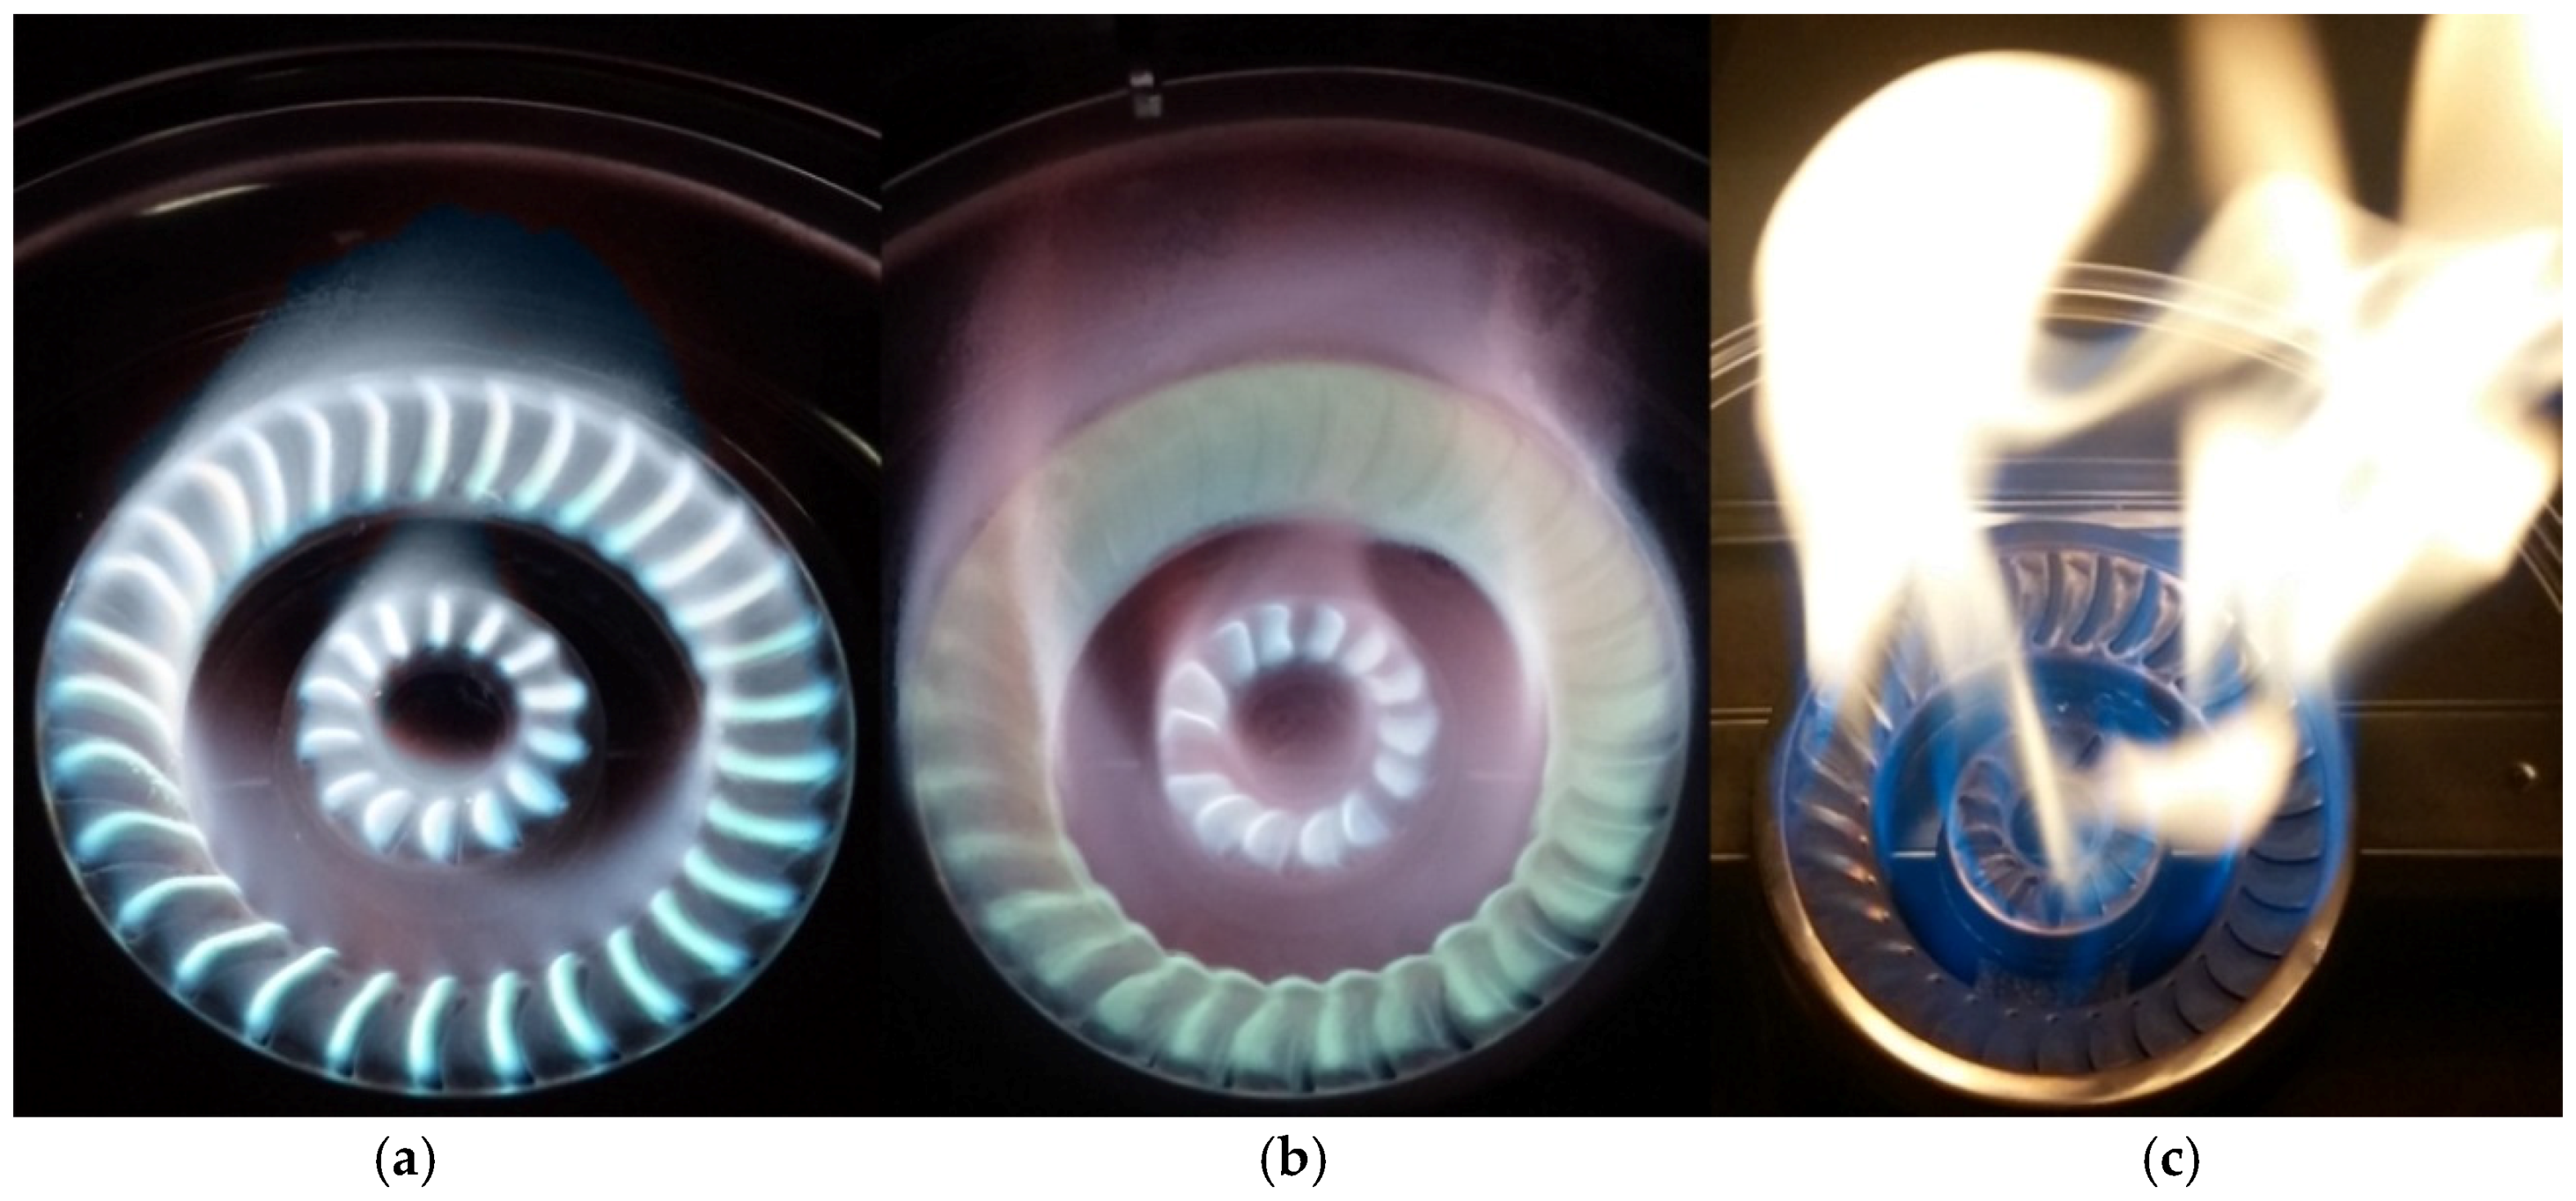
Three types of observed CH4:air flame shapes were identified including normal combustion (a), lifting (b), and yellow tipping (c), as shown in Figure 8. The color, brightness, and length of the flames were strikingly different under diverse combustion regimes. The photographic image (a) denotes a stable inner and outer cone with a light blue and bright white color where the inner cone boundary was more distinct when compared to the outer cone. In image (b), the flame base separated from the port outlet and an ill-defined inner boundary occurred. The flame length became longer due to the higher burning mixture velocity. Under the yellow-tipping circumstance (c), there was a longer flame length caused by a smaller primary coefficient and the flame became unstable and bright yellow in color.
A flashback phenomenon was not observed in this study as the burner port width was smaller than the critical dimension.
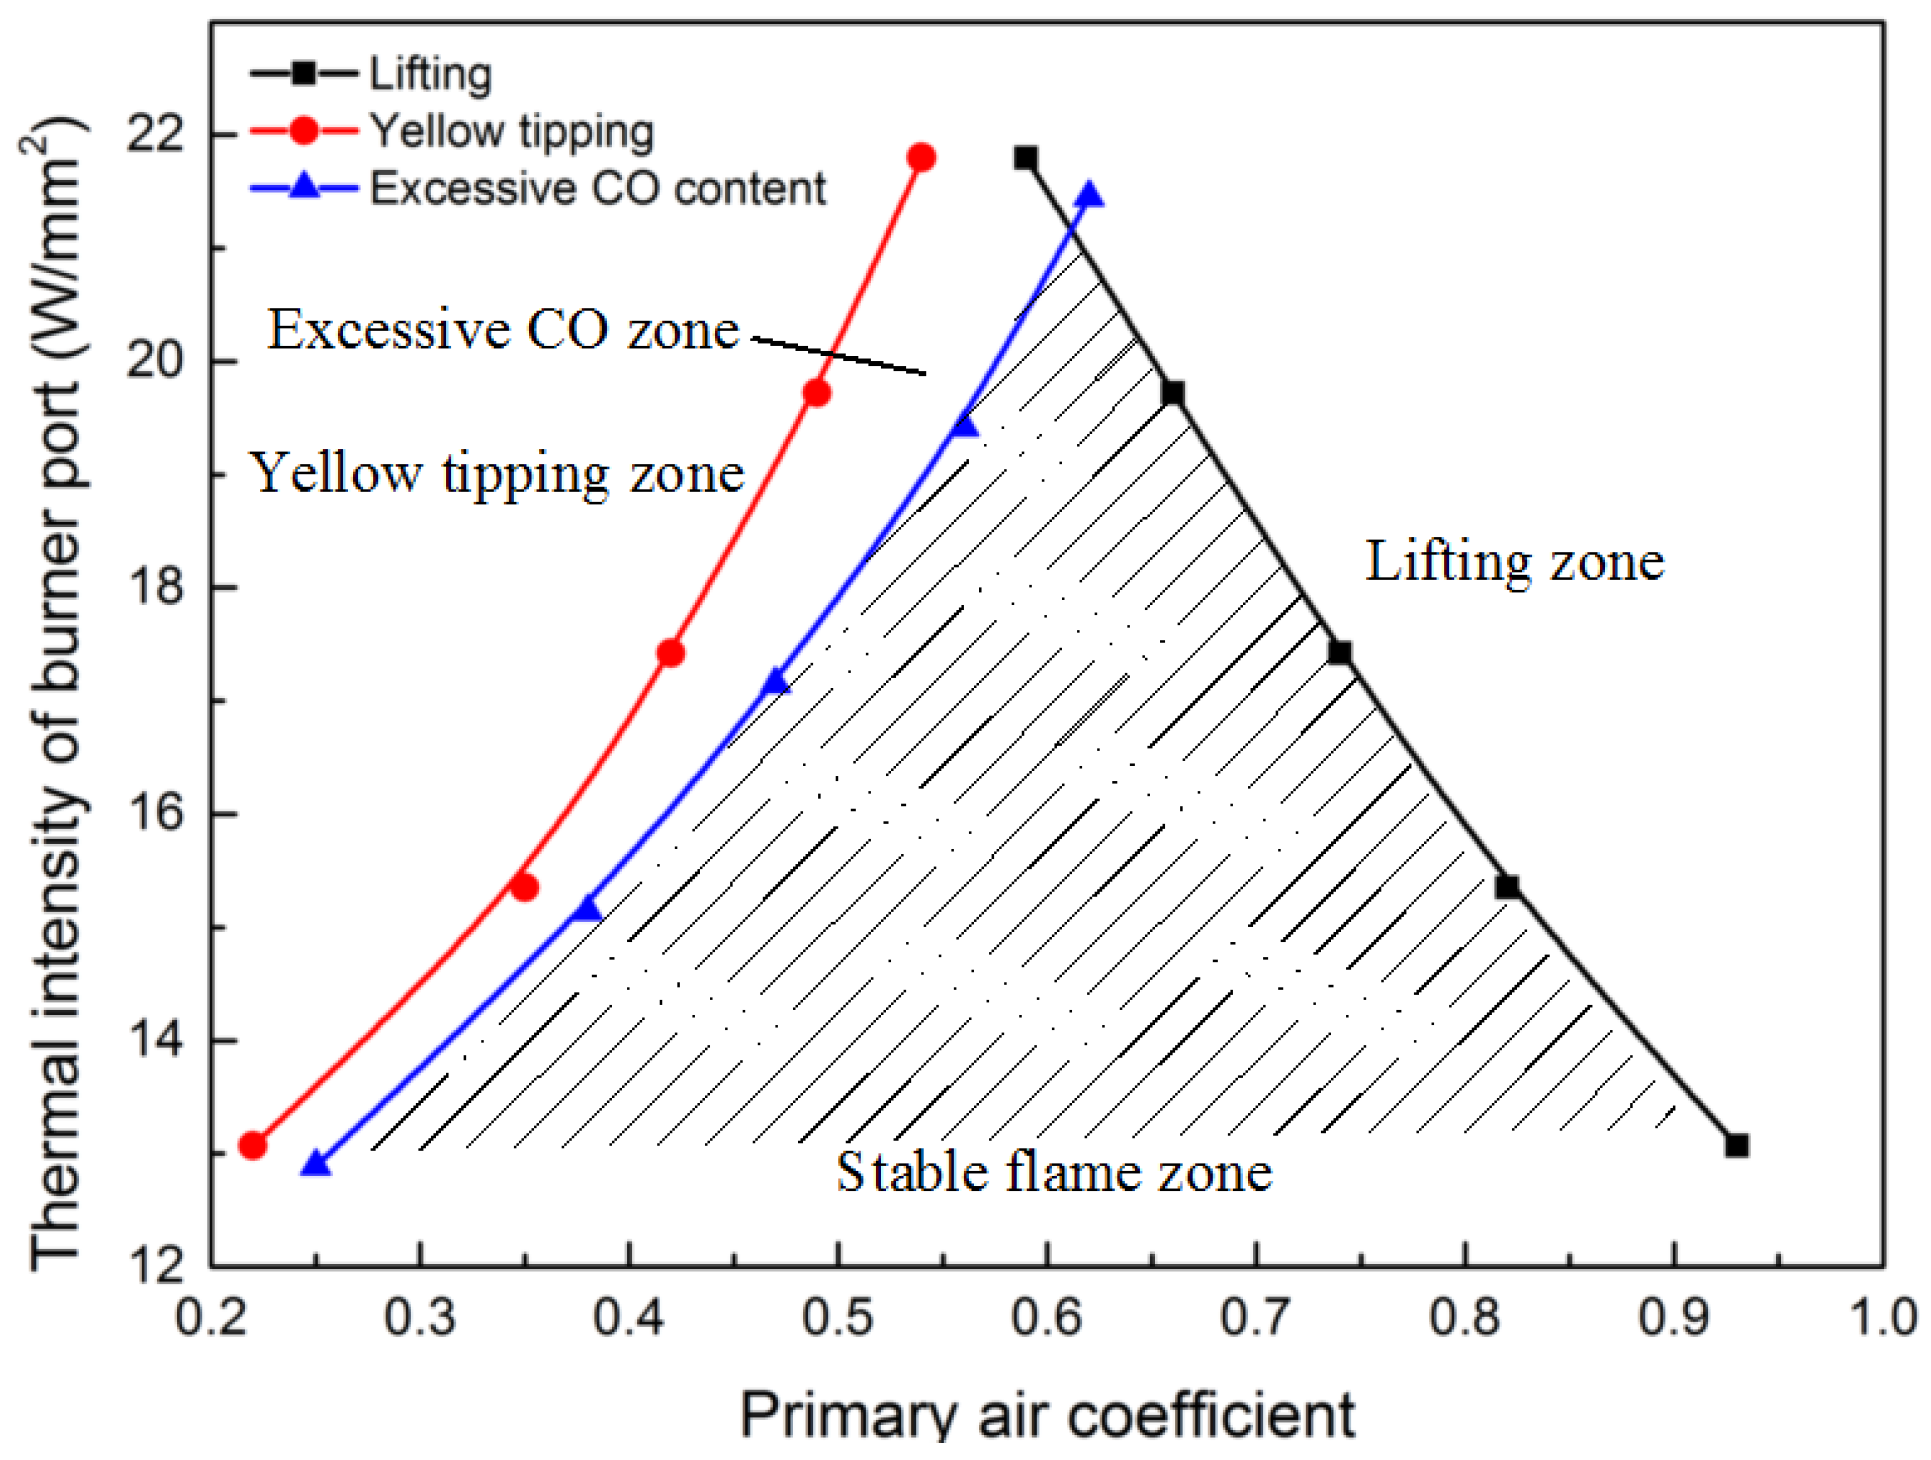
4.2.2. Flame Stabilization
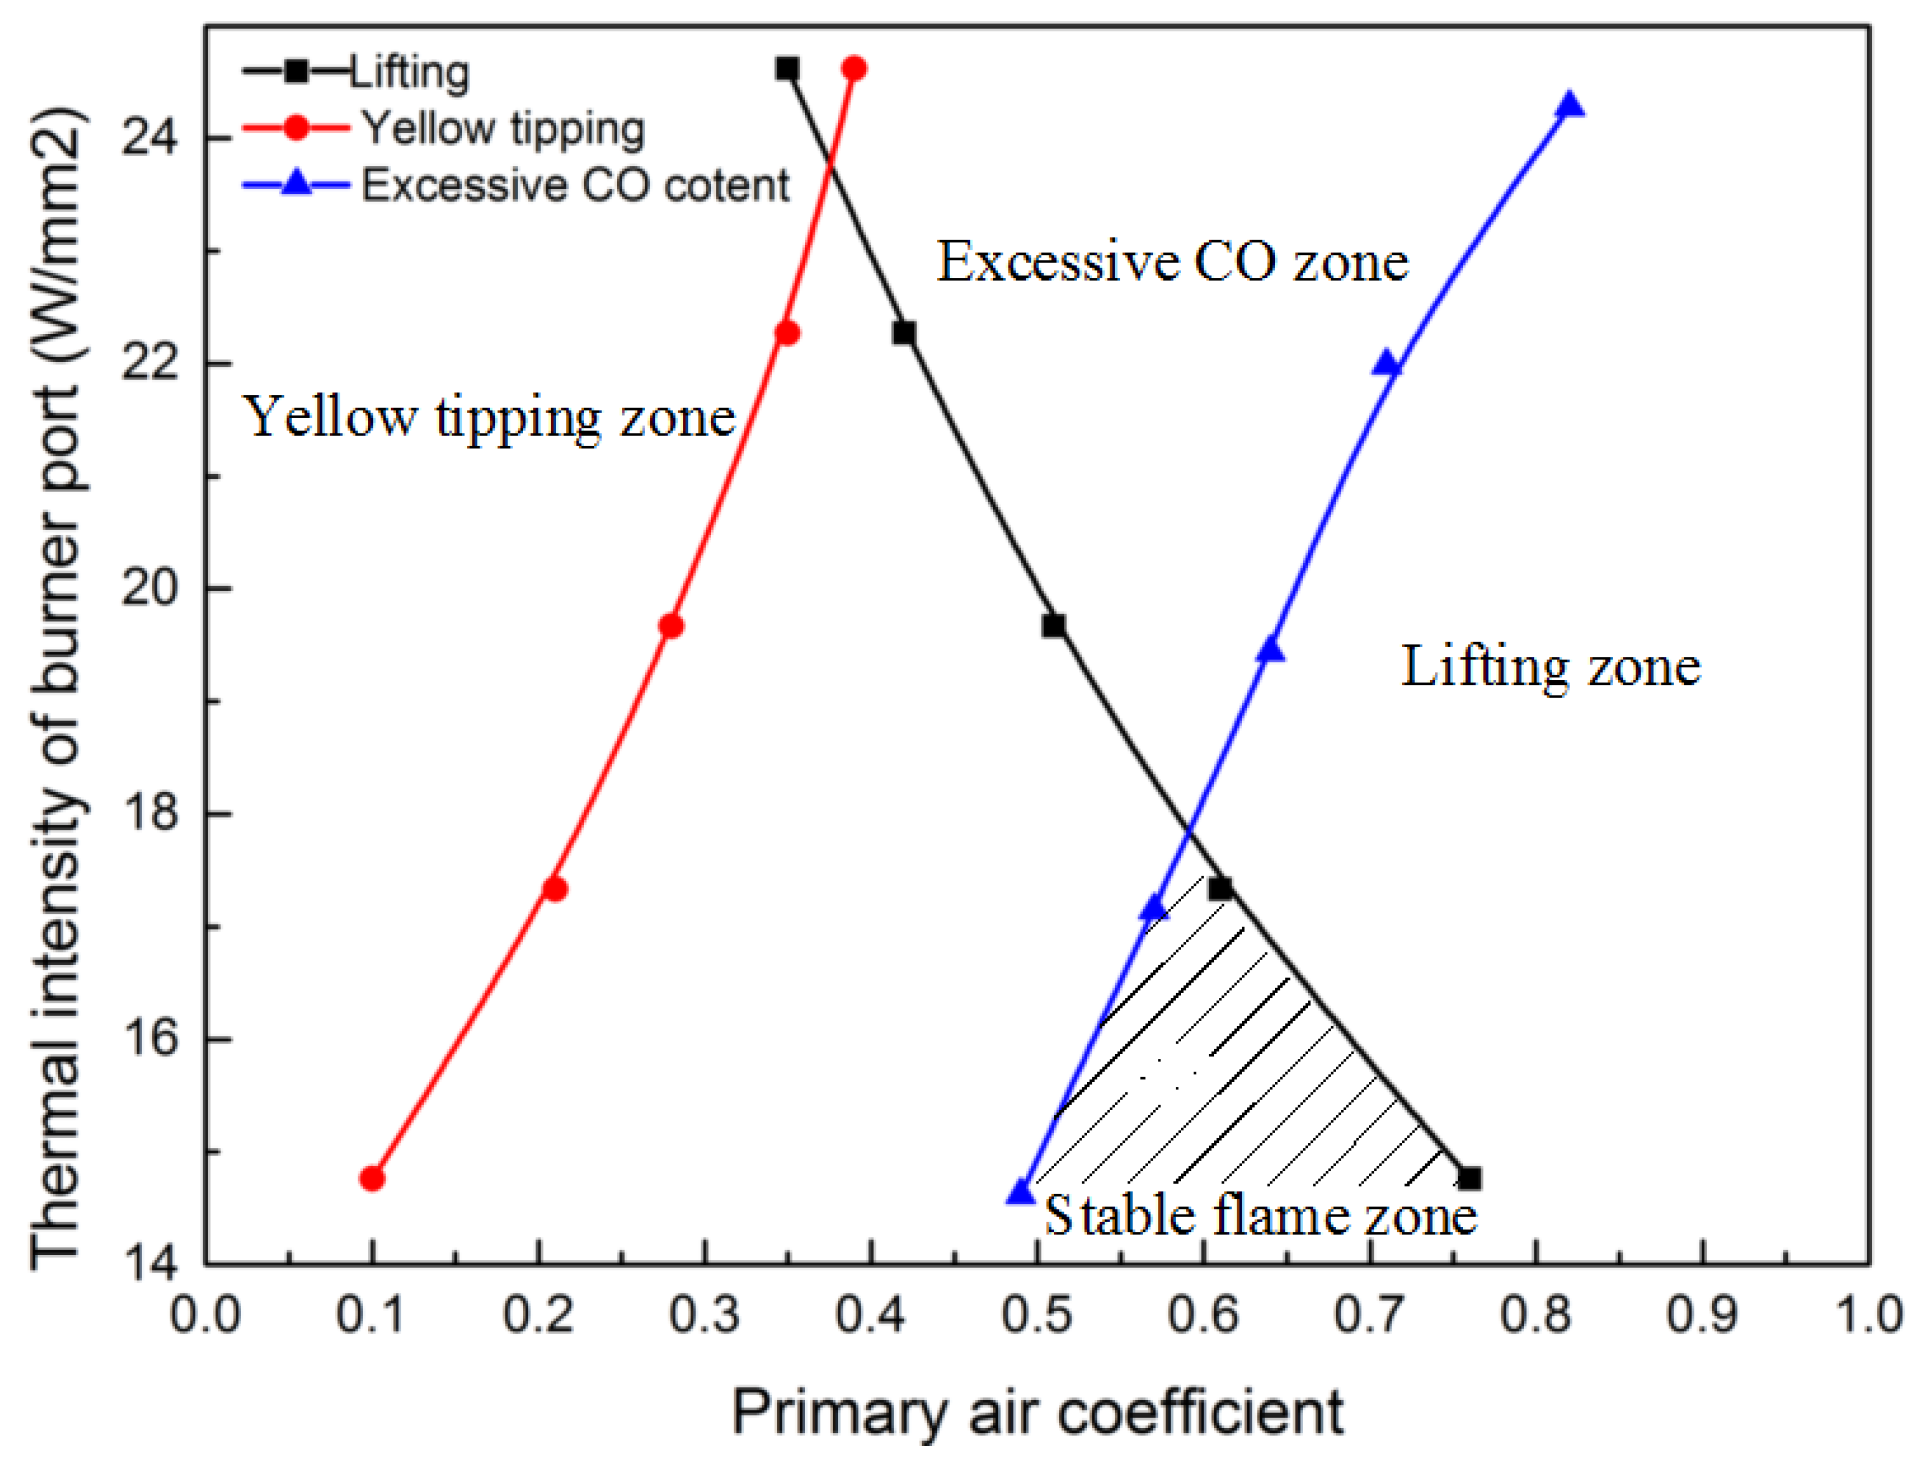
To investigate the combustion performance and flame stability limits, the oven former pressure and primary air coefficient were adjusted properly until foregoing flame appearances occurred, thus recording the accurate limits data. Table 5, Table 6, Table 7 and Table 8 reveal the testing profiles obtained in this comparative experiment, and Figure 9 and Figure 10 display the graphical flame-stability limits of the two test fuel gases (namely the substitute gas and comparative gas with a methane/air equivalence ratio of 53/47 and 59/41, respectively).
Table 5, Table 6, Table 7 and Table 8 indicate that the increase in oven former gas pressure favored a promotion of the actual heat input, as well as the thermal intensity of the burner port. This is because the heat input refers to the heat amount taken into the gas burner in the unit time, which is in direct proportion to the oven former pressure. Once the appliance’s structure is defined, the thermal intensity of its burner port only depends on heat input (i.e., oven former pressure). The deviation of the actual heat input and the converted heat input of these two mixtures applied to the experimental stove was within ±10%, which is in compliance with the standard regulation [31].
As illustrated in Figure 9 and Figure 10, the stable flame zone was comprised of a family of critical boundary curves including lifting limits, yellow-tipping limits, and excessive CO content limits. For the substitute gas, the limit curves of yellow-tipping and excessive CO content appeared at a low primary air coefficient, and a lifting flame limit curve appeared at a high primary air coefficient. Unlike the former, the limit curve of excessive CO content for the comparative gas appeared at a high primary air coefficient. These curves of the flame-stability diagram separated four regions of combustion performance on burners: one where the flames were stable, one where the flames were lifting, one where the CO emissions were exceeded, and another where the flames were yellow-tipping.
It is noteworthy that variations in the methane/air equivalence ratio had a remarkable and distinct effect on limit data. In general, yellow-tipping and excessive CO-content critical curves trend upward with the primary air coefficient, while the lifting curves trend downward. In yellow-tipping and excessive CO emission cases, the increase of the primary air coefficient and oven former pressure introduces more oxidants and reductants into the reaction mixture, which contributes to more sufficient combustion, and gives rise to heat release. Therefore, the yellow-tipping and excessive CO-emission limits increase with the primary air ratio. In lifting cases, however, the increase of oven former pressure improves fuel gas flow velocity until the mean jet velocity exceeds the flame propagation velocity at which the flame length becomes significantly long. Meanwhile, the higher primary air ratio means a lower fuel concentration in the gas pre-mixture, indicating less methane diffusion. When the mixture flows across the flame port, the excessive ambient secondary air is inhaled into the flame base to further dilute the mixture. Therefore, the average temperature of the exhaust flue gas reduces, and the flame becomes lifted above the jet exit rim which leads to lift-off. When the jet velocity reaches the blow-out velocity, the combustion reaction cannot be sustained and the flame will be extinguished.
Compared to the substitute gas, all curves of the comparative gas had a steeper slope. In particular, the equivalence ratio of methane/air strongly affected the CO emission critical curve and moved it towards the right with an increase of methane, which clearly shrunk the stable flame region. At the lowest actual heat input setting, the corresponding primary air coefficient range of the substitute gas and comparative gas were 0.25–0.93 and 0.49–0.76, respectively. Hence, the substitute gas where the equivalent methane/air ratio was calculated by theoretical methods could interchange with the 6T biogas and also achieve a good combustion performance on the burner.
5. Conclusions
In this study, an approach mixing LNG with air was developed to supplement biogas supply when it is inadequate. An experimental investigation of the combustion performance and emission behaviors on a typical atmospheric-induction biogas stove was conducted to assess the interchangeability between the LNG–air mixture and 6T biogas. Based on our results and discussion, the following conclusions were reached:
- According to the interchangeability analysis of the WI and CP indices, the security assessment on the total mixture explosion limits, as well as the adaptability analysis of combustion performance, an optimum gas mixing scheme with a methane/air ratio in the range of 49:51–53:47 was obtained.
- The mixer–ejector exhaust experiment indicated that the methane/air ratio increased with a decrease in the inlet pressure and an increase in the outlet pressure. In addition, a minimum injection pressure of 0.25 MPa was recommended to ensure that the oven former pressure met the regulation requirements. Under the same injection pressure, the pressure difference between the mixer–ejector declined with the outlet pressure, which led to less pressure energy being devoted to air entrainment. Conversely, the air fraction in the mixture rose with increasing inlet pressure.
- Similar yellow-tipping and lifting limits were observed regardless of the methane/air ratio. The lifting critical curve decreased with the primary air coefficient, but the yellow-tipping curve increased with the primary air ratio. However, there was an obvious difference between the excessive CO content curves of the two tested gases. The CO content limits of the comparative gas moved right versus the substitute gas, so that a smaller stable flame zone was obtained.
- The methane/air mixture could be fully interchanged with the 6T biogas due to the wide flame limits of stability under which perfect combustion performance and emission behavior were achieved.
Acknowledgments
This work was funded by China 12th Five-year Plan Key R & D Program (2013BAJ11B05) and the China Scholarship Council. The authors deeply appreciate this support.
Author Contributions
Xiaomei Huang and Shini Peng conceived and designed the experiments; Yang Zhou and Jing Zhang performed the experiments; Yang Zhou and Jing Zhang analyzed the data; Chang Wu contributed reagents/materials/analysis tools; and Yang Zhou wrote the paper.
Conflicts of Interest
The authors declare no conflicts of interest.
References
- Bond, T.; Templeton, M.R. History and future of domestic biogas plants in the developing world. Energy Sustain. Dev. 2011, 15, 347–354. [Google Scholar] [CrossRef]
- Cheng, S.K.; Li, Z.F.; Shih, J.; Du, X.L.; Xing, J.J. A field study on acceptability of 4-in-1 biogas systems in Liaoning Province, China. Energy Procedia 2011, 5, 1382–1387. [Google Scholar] [CrossRef]
- Wang, X.H.; Di, C.L.; Hu, X.Y.; Wu, W.M.; Jiang, X.P.; Jiang, S.Y. The influence of using biogas digesters on family energy consumption and its economic benefit in rural areas-comparative study between Liangshui and Guichi in China. Renew. Sustain. Energy Rev. 2007, 11, 1382–1387. [Google Scholar]
- Deng, Y.F.; Xu, J.P.; Liu, Y.; Mancl, K. Biogas as a sustainable energy source in China: Regional development strategy application and decision making. Renew. Sustain. Energy Rev. 2014, 35, 294–303. [Google Scholar] [CrossRef]
- Willem, V.G.; Wang, G.H. Microanalysis of the benefits of China’s family-size bio-digesters. Energy 2010, 35, 4457–4466. [Google Scholar]
- Han, J.Y.; Mol, A.P.J.; Lu, T.L.; Zhang, L. Small-scale bioenergy projects in rural China: Lessons to be learnt. Energy Policy 2008, 36, 2154–2162. [Google Scholar] [CrossRef]
- Wang, X.; Lu, X.; Yang, G.; Feng, Y.; Ren, G.; Han, X. Development process and probable future transformations of rural biogas in China. Renew. Sustain. Energy Rev. 2016, 55, 703–712. [Google Scholar] [CrossRef]
- Wu, B.; Zhang, X.; Bao, D.; Zhang, S.; Zheng, T. Energetic-environmental-economic assessment of the biogas system with three utilization pathways: Combined heat and power, biomethane and fuel cell. Bioresour. Technol. 2016, 214, 722–728. [Google Scholar] [CrossRef] [PubMed]
- Ontario Large Herd Operators. European Anaerobic Digestion Tour Report. 2006. Available online: http://www.lho-ontario.ca (accessed on 17 December 2017).
- Lantz, M. The economic performance of combined heat and power from biogas produced from manure in Sweden-A comparison of different CHP technologies. Appl. Energy 2012, 98, 502–511. [Google Scholar] [CrossRef]
- Advantage West Midlands. An Introduction to the Production of Biomethane Gas and Injection to the National Grid. 2011. Available online: www.advantagewm.co.uk (accessed on 17 January 2017).
- Pazera, A.; Slezak, R. Biogas in Europe: Food and beverage waste potential for biogas production. Energy Fuels 2015, 29, 4011–4021. [Google Scholar] [CrossRef]
- Chan, W.N.; Fu, Z.H.; Holtzapple, M.T. Co-digestion of swine manure and corn stove for bioenergy production in MixAlco consolidated bioprocessing. Biomass Bioenergy 2011, 35, 4134–4144. [Google Scholar] [CrossRef]
- Börjesson, M.; Ahlgren, E.O. Cost-effective biogas utilization-A modeling assessment of gas infrastructural options in a regional energy system. Energy 2012, 48, 212–226. [Google Scholar] [CrossRef]
- Dimpl, E. Small-scale Electricity Generation from Biomass, Part II: Biogas; Deutsche Gesellschaft für Technische Zusammenarbeit (GTZ)-HERA: Eschborn, Germany, 2010. [Google Scholar]
- Sun, Q.; Li, H.L.; Yan, J.Y.; Liu, L.C.; Yu, Z.X.; Yu, X.H. Selection of appropriate biogas upgrading technology—A review of biogas cleaning, upgrading and utilization. Renew. Sustain. Energy Rev. 2015, 51, 521–532. [Google Scholar] [CrossRef]
- Ruane, J.; Sonnino, A.; Agostini, A. Bioenergy and the potential contribution of agricultural biotechnologies in developing countries. Biomass Bioenergy 2010, 34, 1427–1439. [Google Scholar] [CrossRef]
- Gosens, J.; Lu, Y.L.; He, G.Z.; Bluemling, B.; Beckers, T.A.M. Sustainability effects of household-scale biogas in rural China. Energy Policy 2013, 54, 273–287. [Google Scholar] [CrossRef]
- Kulišić, B.; Par, V.; Metzler, R. Calculation of on-farm biogas potential: A Croatian case study. Biomass Bioenergy 2015, 74, 66–78. [Google Scholar] [CrossRef]
- Zhang, T.; Yang, Y.H.; Liu, L.L.; Han, Y.Y.; Ran, G.X.; Yang, G.H. Improved biogas production from chicken manure anaerobic digestion using cereal residues as co-substraces. Energy Fuels 2014, 28, 2490–2495. [Google Scholar] [CrossRef]
- Blesgen, A.; Hass, V.C. Efficient biogas production through process simulation. Energy Fuels 2010, 24, 4721–4727. [Google Scholar] [CrossRef]
- Hang, C.; Li, Y.; Bu, D.; Yang, G. Biogas yield and its relations with the duration and temperature of mixed anaerobic fermentation of livestock dungs and wheat straw. Chin. J. Appl. Ecol. 2008, 19, 1817–1822. [Google Scholar]
- Dong, F.Q.; Lu, J.B. Using solar energy to enhance biogas production from livestock residue-A case study of the Tongren biogas engineering pig farm in South China. Energy 2013, 57, 759–765. [Google Scholar] [CrossRef]
- Wang, X.H.; Feng, Z.M. Common factors and major characteristics of household energy consumption in comparatively well-off rural China. Renew. Sustain. Energy Rev. 2003, 7, 545–552. [Google Scholar]
- BP Gas; International Gas Union. Guidebook to Gas Interchangeability and Gas Quality. August 2011. Available online: http://www.igu.org (accessed on 20 July 2017).
- Tumwesige, V.; Fulford, D.; Davidson, G.C. Biogas appliances in Sub-Sahara Africa. Biomass Bioenergy 2014, 70, 40–50. [Google Scholar] [CrossRef]
- Standardization Administration of China. Classification and Essential Property of City Gas; Standard No. GB/T 13611-2006; Standardization Administration of China: Beijing, China, 12 September 2006. (In Chinese)
- Abeysekera, M.; Wu, J.; Jenkins, N.; Rees, M. Steady state analysis of gas networks with distributed injection of alternative gas. Appl. Energy 2011, 64, 991–1002. [Google Scholar] [CrossRef]
- American Gas Association. Interchangeability of Other Fuel Gases with Natural Gas; American Gas Association Research Bulletin No. 36; American Gas Association, Testing Laboratories: Cleveland, OH, USA, 1946. [Google Scholar]
- Budzianowski, W.M. A review of potential innovations for production, conditioning and utilization of biogas with multiple-criteria assessment. Renew. Sustain. Energy Rev. 2016, 54, 1148–1171. [Google Scholar] [CrossRef]
- Standardization Administration of China. Domestic Gas Cooking Appliances; Standard No. GB 16410-2007; Standardization Administration of China: Beijing, China, 21 June 2007. (In Chinese)
- Zhou, Y.; Huang, X.M.; Peng, S.N.; Li, L. Comparative study on the combustion characteristics of an atmospheric induction stove in the plateau and plain regions of China. Appl. Therm. Eng. 2017, 111, 301–307. [Google Scholar] [CrossRef]
Figure 1.
Possible methane ratio range of LNG with air for biogas substitution.

Figure 2.
Explosive limits of biogas/methane/air mixture at different substitutions and supply ratios.
Figure 2.
Explosive limits of biogas/methane/air mixture at different substitutions and supply ratios.

Figure 3.
Experimental system diagram of the mixer-ejector operating characteristics.

Figure 4.
3D model figure of mixer-ejector.

Figure 5.
Picture of the domestic swirl burner.

Figure 6.
Schematic diagram of the test rigs and instrumentation.

Figure 7.
Methane/air ratio as the function of inlet and outlet pressure of the mixer–ejector.

Figure 8.
Visible flame appearances of CH4:air mixture combustion.

Figure 9.
Flame stability diagram for the substitute gas.

Figure 10.
Flame stability diagram for the comparative gas.


Table 1.
Comparison of compositions and characteristics of various gases. Concentrations recalculated to conditions: 293.15 K, 101.325 kPa, and dry basis.
Table 1.
Comparison of compositions and characteristics of various gases. Concentrations recalculated to conditions: 293.15 K, 101.325 kPa, and dry basis.
| Fuel Properties | 12T Reference Gas | 6T Reference Gas | Biogas | LNG |
|---|---|---|---|---|
| Methane (vol-%) | 100 | 53.40 | 60 | 99.70 |
| Ethane (vol-%) | 0 | 0 | 0 | 0.07 |
| Propane (vol-%) | 0 | 0 | 0 | 0.01 |
| C4 (vol-%) | 0 | 0 | 0 | 0 |
| C5 (vol-%) | 0 | 0 | 0 | 0 |
| Hydrogen (vol-%) | 0 | 0 | 0 | 0 |
| Nitrogen (vol-%) | 0 | 46.60 | 0 | 0.15 |
| Oxygen (vol-%) | 0 | 0 | 0 | 0.02 |
| Carbon monoxide (vol-%) | 0 | 0 | 0 | 0 |
| Carbon dioxide (vol-%) | 0 | 0 | 40 | 0.05 |
| Helium (vol-%) | 0 | 0 | 0 | 0 |
| High heating value (MJ/m3) | 37.7680 | 20.1800 | 22.6610 | 37.7110 |
| Low heating value (MJ/m3) | 34.0331 | 18.1600 | 20.4198 | 35.8487 |
| Relative density | 0.5548 | 0.7470 | 0.9445 | 0.5560 |
| Higher Wobbe Index (MJ/m3) | 50.7040 | 23.3500 | 23.3167 | 50.5744 |
| Combustion Potential | 40.2754 | 18.5000 | 18.5210 | 40.2146 |
Table 2.
Explosive limits of several kinds of gas mixture.
| Gas Specification | Explosive Limits of Methane/Air Mixture | |
|---|---|---|
| LEL | UEL | |
| Methane (60%) + CO2 (40%) | 8.22 | 24.18 |
| Methane (49%) + air (51%) | 10.41 | 30.61 |
| Methane (53%) + air (47%) | 9.62 | 28.30 |
Table 3.
Specifications of the mixer-ejector.
| Items | Value |
|---|---|
| Injection pressure ratio | 0.2 |
| Critical pressure ratio | 0.5 |
| Nozzle mouth area (mm2) | 2.6 |
| Emanation entrance diameter (mm) | 6.2 |
| Nozzle diameter (mm) | 1.8 |
| Cited emanation entrance diameter (mm) | 10.9 |
| Area of nozzle throat (mm) | 8.3 |
| Ejector diameter(mm) | 16.7 |
| Diffuser outlet cross section diameter (mm) | 13.2 |
| Distance of nozzle mouth section to throat section (mm) | 14.7 |
| Mixing length (mm) | 50.0 |
| Diffuser length (mm) | 39.5 |
| Mixer gas supply pressure (Pa) | 113278.7 |
| Recovery static pressure in diffuser (Pa) | 10817.9 |
| Static pressure recovery coefficient in diffuser | 1.9 |
Table 4.
Detailed specifications of the 6T gas stove used for the experiments.
| Parameters | Figure |
|---|---|
| Type | JZZ-Double ring burner |
| Nominal working pressure | 1.6 kPa |
| Nominal heat load | 3.26 kW |
| Thermal efficiency | ≥57% |
| Pipe interface size | 9.5 mm |
| Port width (mm) | 0.56 mm |
| Number of ports | Inner ring cap: 14 Outer ring cap: 31 |
| Area of single port (mm2) | Inner ring cap: 4.48 Outer ring cap: 5.83 |
Table 5.
Flame stability testing data of the substitute gas.
| Test Items | Value | |||||
|---|---|---|---|---|---|---|
| Atmospheric pressure (kPa) | 99.27 | |||||
| Relative humidity (%) | 77.00 | |||||
| Gas components (vol-%) | 47% air + 53% methane | |||||
| Oven former pressure (kPa) | 0.80 | 1.00 | 1.20 | 1.40 | 1.60 | |
| Gas temperature (°C) | 12.00 | 12.00 | 12.00 | 12.00 | 12.00 | |
| Saturated steam pressure (kPa) | 1.07 | 1.07 | 1.07 | 1.07 | 1.07 | |
| Gas volume flow (m3/h) | 0.58 | 0.68 | 0.77 | 0.87 | 0.96 | |
| Actual heat input (kW) | 3.18 | 3.74 | 4.24 | 4.80 | 5.31 | |
| Thermal intensity of burner port (W/mm2) | 13.07 | 15.35 | 17.42 | 19.72 | 21.80 | |
| Lifting | O2 content in mixed gas (%) | 18.96 | 18.75 | 18.58 | 18.34 | 18.11 |
| Primary air coefficient | 0.93 | 0.82 | 0.74 | 0.66 | 0.59 | |
| Yellow tipping | O2 content in mixed gas (%) | 15.63 | 16.89 | 17.37 | 17.72 | 17.94 |
| Primary air coefficient | 0.22 | 0.35 | 0.42 | 0.49 | 0.54 | |
Table 6.
Testing data of CO content in the fume gas of the substitute gas.
| Test Items | Value | ||||
|---|---|---|---|---|---|
| Atmospheric pressure (kPa) | 99.35 | ||||
| Relative humidity (%) | 66.00 | ||||
| Gas components (vol-%) | 47% air + 53% methane | ||||
| CO2 content in air (%) | 0 | ||||
| Oven former pressure (kPa) | 0.80 | 1.00 | 1.20 | 1.40 | 1.60 |
| Gas temperature (°C) | 13.40 | 13.50 | 13.90 | 13.80 | 14.00 |
| Saturated steam pressure (kPa) | 1.02 | 1.02 | 1.05 | 1.04 | 1.06 |
| Gas volume flow (m3/h) | 0.58 | 0.68 | 0.77 | 0.87 | 0.96 |
| Actual heat input (kW) | 3.14 | 3.69 | 4.17 | 4.73 | 5.22 |
| Thermal intensity of burner port(W/mm2) | 12.89 | 15.14 | 17.15 | 19.42 | 21.45 |
| O2 content in mixed gas (%) | 16.02 | 17.09 | 17.65 | 18.02 | 18.24 |
| Primary air coefficient | 0.25 | 0.38 | 0.47 | 0.56 | 0.62 |
| CO2 content in dry flue gas (%) | 6.21 | 6.54 | 6.92 | 7.06 | 7.19 |
| CO content in dry flue gas (ppm) | 3.00 | 3.00 | 3.00 | 3.00 | 3.00 |
| CO content in dry flue gas (%, primary air coefficient is 1) | 0.0567 | 0.0538 | 0.0509 | 0.0499 | 0.0490 |
Table 7.
Flame stability testing data of the comparative gas.
| Test Items | Value | |||||
|---|---|---|---|---|---|---|
| Atmospheric pressure (kPa) | 99.03 | |||||
| Relative humidity (%) | 64.00 | |||||
| Gas components (vol-%) | 41% air + 59% methane | |||||
| Oven former pressure (kPa) | 0.80 | 1.00 | 1.20 | 1.40 | 1.60 | |
| Gas temperature (°C) | 12.70 | 12.70 | 12.70 | 12.70 | 12.70 | |
| Saturated steam pressure (kPa) | 0.95 | 0.95 | 0.95 | 0.95 | 0.95 | |
| Gas volume flow (m3/h) | 0.58 | 0.68 | 0.77 | 0.87 | 0.96 | |
| Actual heat input (kW) | 3.59 | 4.22 | 4.79 | 5.42 | 5.99 | |
| Thermal intensity of burner port (W/mm2) | 14.76 | 17.33 | 19.67 | 22.27 | 24.62 | |
| Lifting | O2 content in mixed gas (%) | 18.57 | 18.11 | 17.69 | 17.25 | 16.73 |
| Primary air coefficient | 0.76 | 0.61 | 0.51 | 0.42 | 0.35 | |
| Yellow tipping | O2 content in mixed gas (%) | 12.86 | 15.27 | 16.13 | 16.71 | 17.05 |
| Primary air coefficient | 0.10 | 0.21 | 0.28 | 0.35 | 0.39 | |
Table 8.
Testing data of CO content in the flue gas of the comparative gas.
| Test Items | Value | ||||
|---|---|---|---|---|---|
| Atmospheric pressure (kPa) | 99.52 | ||||
| Relative humidity (%) | 79.00 | ||||
| Gas components (vol-%) | 41% air + 59% methane | ||||
| CO2 content in air (%) | 0 | ||||
| Oven former pressure (kPa) | 0.80 | 1.00 | 1.20 | 1.40 | 1.60 |
| Gas temperature (°C) | 13.20 | 13.50 | 13.80 | 14.00 | 14.30 |
| Saturated steam pressure (kPa) | 1.17 | 1.20 | 1.23 | 1.25 | 1.28 |
| Gas volume flow (m3/h) | 0.58 | 0.68 | 0.77 | 0.87 | 0.96 |
| Actual heat input (kW) | 3.56 | 4.18 | 4.73 | 5.35 | 5.91 |
| Thermal intensity of burner port (W/mm2) | 14.62 | 17.15 | 19.44 | 21.99 | 24.28 |
| O2 content in mixed gas (%) | 17.59 | 17.98 | 18.21 | 18.43 | 18.69 |
| Primary air coefficient | 0.49 | 0.57 | 0.64 | 0.71 | 0.82 |
| CO2 content in dry flue gas (%) | 8.12 | 8.26 | 8.41 | 8.58 | 8.67 |
| CO content in dry flue gas (ppm) | 4.00 | 4.00 | 4.00 | 4.00 | 4.00 |
| CO content in dry flue gas (%, primary air coefficient is 1) | 0.0578 | 0.0568 | 0.0558 | 0.0547 | 0.0542 |
© 2017 by the authors. Licensee MDPI, Basel, Switzerland. This article is an open access article distributed under the terms and conditions of the Creative Commons Attribution (CC BY) license (http://creativecommons.org/licenses/by/4.0/).
Share and Cite
MDPI and ACS Style
Zhou, Y.; Peng, S.; Huang, X.; Wu, C.; Zhang, J. LNG–Air Mixture as a Supplementary Energy Injection into a Biogas Distribution Network. Energies 2017, 10, 1902. https://doi.org/10.3390/en10111902
AMA Style
Zhou Y, Peng S, Huang X, Wu C, Zhang J. LNG–Air Mixture as a Supplementary Energy Injection into a Biogas Distribution Network. Energies. 2017; 10(11):1902. https://doi.org/10.3390/en10111902
Chicago/Turabian StyleZhou, Yang, Shini Peng, Xiaomei Huang, Chang Wu, and Jing Zhang. 2017. "LNG–Air Mixture as a Supplementary Energy Injection into a Biogas Distribution Network" Energies 10, no. 11: 1902. https://doi.org/10.3390/en10111902
Note that from the first issue of 2016, this journal uses article numbers instead of page numbers. See further details here.