Performance and Reliability of Wind Turbines: A Review


Fraunhofer Institute for Wind Energy and Energy System Technology—IWES, Königstor 59, 34119 Kassel, Germany
*
Author to whom correspondence should be addressed.
Energies 2017, 10(11), 1904; https://doi.org/10.3390/en10111904
Submission received: 29 September 2017
/
Revised: 22 October 2017
/
Accepted: 9 November 2017
/
Published: 19 November 2017
(This article belongs to the Section F: Electrical Engineering)
Abstract
:Performance (availability and yield) and reliability of wind turbines can make the difference between success and failure of wind farm projects and these factors are vital to decrease the cost of energy. During the last years, several initiatives started to gather data on the performance and reliability of wind turbines on- and offshore and published findings in different journals and conferences. Even though the scopes of the different initiatives are similar, every initiative follows a different approach and results are therefore difficult to compare. The present paper faces this issue, collects results of different initiatives and harmonizes the results. A short description and assessment of every considered data source is provided. To enable this comparison, the existing reliability characteristics are mapped to a system structure according to the Reference Designation System for Power Plants (RDS-PP®). The review shows a wide variation in the performance and reliability metrics of the individual initiatives. Especially the comparison on onshore wind turbines reveals significant differences between the results. Only a few publications are available on offshore wind turbines and the results show an increasing performance and reliability of offshore wind turbines since the first offshore wind farms were erected and monitored.
Keywords:
wind turbines; capacity factor; availability; reliability; failure rate; down time; RDS-PP®1. Introduction
The installation of wind turbines (WT) is booming. During 2016 more than 54 GW of wind capacity was erected worldwide. All new WT as well as the existing ones (about 486 GW in total) have to be operated and maintained carefully [1]. According to recent studies, operation and maintenance (O&M) accounts for a share between 25% and almost 40% of levelized cost of energy (LCOE) [2,3,4].
The energy yield itself is also heavily affected by the success of O&M-strategies. Thus, optimization of O&M is of high importance for a further reduction of LCOE. Before an optimization can start, one has to know the current status and prioritize further actions. In recent years, several initiatives have begun to collect data on the performance and reliability of WT onshore and offshore and to publish the results in various journals and conferences. Although the objectives of the various initiatives are similar, each initiative follows a different approach and the results are hence difficult to compare. This paper addresses this issue, gathers the results of various initiatives and harmonizes the results. An overview on all considered initiatives is supplemented by a short description and evaluation of the single data sources.
This paper tries to lead the reader to the best source of information for his or her specific needs and prepares all information in such a way that it is easily accessible, analyses the relevance of the initiatives considered and looks for fundamental trends. The overall aim is to provide an extensive overview on available knowledge on performance and reliability of WT to support future research and emphasize the need to make use of existing standards and recommendations. For doing so the paper starts with a presentation of the most important definitions (Section 2). Section 3 introduces different approaches to gather and analyze O&M data followed by an overview of the considered initiatives, which is supplemented by detailed descriptions of the sources. Results on the performance and reliability of WT are presented in Section 4 and Section 5. Finally, Section 6 discusses the results and gives an outlook on future developments.
Looking backwards at many years of operational experience from various WT, required to use a consistent set of data from the first till the last observation and intended to provide an elemental view on the gained experience rather than exploring innovative approaches to analyze data, most initiatives focus on well know and frequently used metrics. Such innovative approaches are, of course, intensively considered in current research. For example, Astolfi et al. [5] in their paper among other data mining techniques introduce Malfunctioning Indexes intended to replace or supplement technical availability. Jia et al. [6] applied a new approach on the Supervisory Control and Data Acquisition (SCADA)-Data and compared it to further methods in order to evaluate the health of a WT and forecast upcoming failures by identifying significant changes in the power curve. Dienst and Beseler [7] applied different methods for anomaly detection on SCADA-Data of offshore WT.
2. Definitions
This section provides definitions for the different performance indicators used in the following overview on performance and reliability of WT. For this purpose, definitions for the capacity factor (Section 2.1), time-based (Section 2.2), technical (Section 2.3) and energetic availability (Section 2.4) as well as for the failure rate (Section 2.5) and mean down time (Section 2.6) are provided. It has to be noted that the provided definitions do not necessarily match the definitions used by the single initiatives and publications introduced in Section 3.
2.1. Capacity Factor
An easy and commonly used indicator to describe the performance of a WT is the capacity factor (CF), which is the ratio of the turbines actual power output over a period of time to its theoretical (rated) power output [8,9]. For the calculation of the capacity factor the average power output is divided by the rated power of the WT, as described in Equation (1). The average power output has to be calculated including all operational states. Due to physical principles, the capacity factor heavily depends on the available wind conditions.
where
2.2. Time-Based Availability
Time-based availability (At) provides information on the share of time where a WT is operating or able to operate in comparison to the total time. Various definitions for the calculation of time based availability exist in the wind sector. Standardized definitions are provided by the IEC 61400-25-1 [10]. The definition used in this paper follows the “System Operational Availability” of the IEC-Standard where all down time except for low wind is considered as not available. Time-based availability can be calculated according to Equation (2).
where
2.3. Technical Availability
Technical availability (Atech) is a variation of the time-based availability (Section 2.2) and provides information on the share of time where a WT is available from a technical perspective. For this purpose, e.g., down time with external causes like grid failures or lightning is considered as available. Further cases like scheduled maintenance or force majeure are excluded from the calculation. In addition to a large number of different definitions in the wind industry, IEC 61400-25-1 [10] also offers uniform definitions in this case. The definition provided in Equation (3) aligns to the IEC definition.
where
2.4. Energetic Availability
Energetic availability (AW), also known as production based availability, gives an indication about the turbines energy yield compared to the potential output and thereby highlights long down time during high wind speed phases and derated operation. Standard definitions are published within the IEC 61400-26-2 [8]. Like for time-based availability (Section 2.2), the “System Operational Availability” is used as definition for energetic availability in this paper. Thus, all differences between potential and actual production are assumed to be losses. Solely data gaps are excluded from the calculation, see Equation (4). When calculating the energetic availability, the determination of the potential power is a special challenge where plausible wind speed measurements and power curves are required to obtain reasonable results.
where
2.5. Failure Rate
Taking the existing ISO [11,12] and IEC [13] guidelines strictly, the failure rate () is the probability of a non-repairable system to fail within a specific period of time. If an object is as good as new after repair, it can be considered in the failure rate calculation as well. Being a frequency (failures per time) the failure rate can be provided in different resolutions (year, day, hour...). In case of a constant failure rate, the relationship between the mean time to failure (MTTF) and the failure rate is described by Equation (5).
where
For repairable items—that can not be restored to a state as good as new—MTTF is only applicable for the first failure of an item. Subsequent failures are considered in the mean time between failures (MTBF). According to ISO/TR 124899:2013 [12] MTBF includes mean up time (MUT) as well as mean down time (MDT) (Section 2.6) whereas mean operating time between failures (MOTBF) is a synonym for MUT. Both definitions are often confused in the literature.
A differentiation between MTTF and MTBF requires detailed maintenance information especially on the fact whether a measure was a repair or replacement. Within this paper, such details are not or only partially available, which is why no distinction is made and all failures per system are considered in a general failure or maintenance event rate.
2.6. Mean Down Time
Mean down time is the expected or average down time after a system fails and stops operation. Consistent definitions are provided by different ISO [11,12] and IEC [13] guidelines. Down time is defined as the total time between stop and restart of operation of a considered unit while the unit is in a down state [14]. This period of time includes all subcategories as for example waiting time, administrative delays, transportation time, failure detection and finally repair time. In most cases failures and the related down times are assigned to the causative system or component to gain detailed results for further use.
3. Data Collections on WT Performance and Reliability
To increase the knowledge on operational behavior respectively performance and reliability of WT it is necessary to learn from the experience gained during operation of existing WT. To this end, many initiatives and projects have collected or continue to collect data and perform analyses to obtain figures as described in Section 2. Such statistics are of interest to manufacturers, operators, service providers, investors, insurance companies, governmental agencies and research institutes. This section aims to provide an overview and description on existing and publicly known initiatives. Internal company initiatives as well as initiatives lacking any publications are not considered.
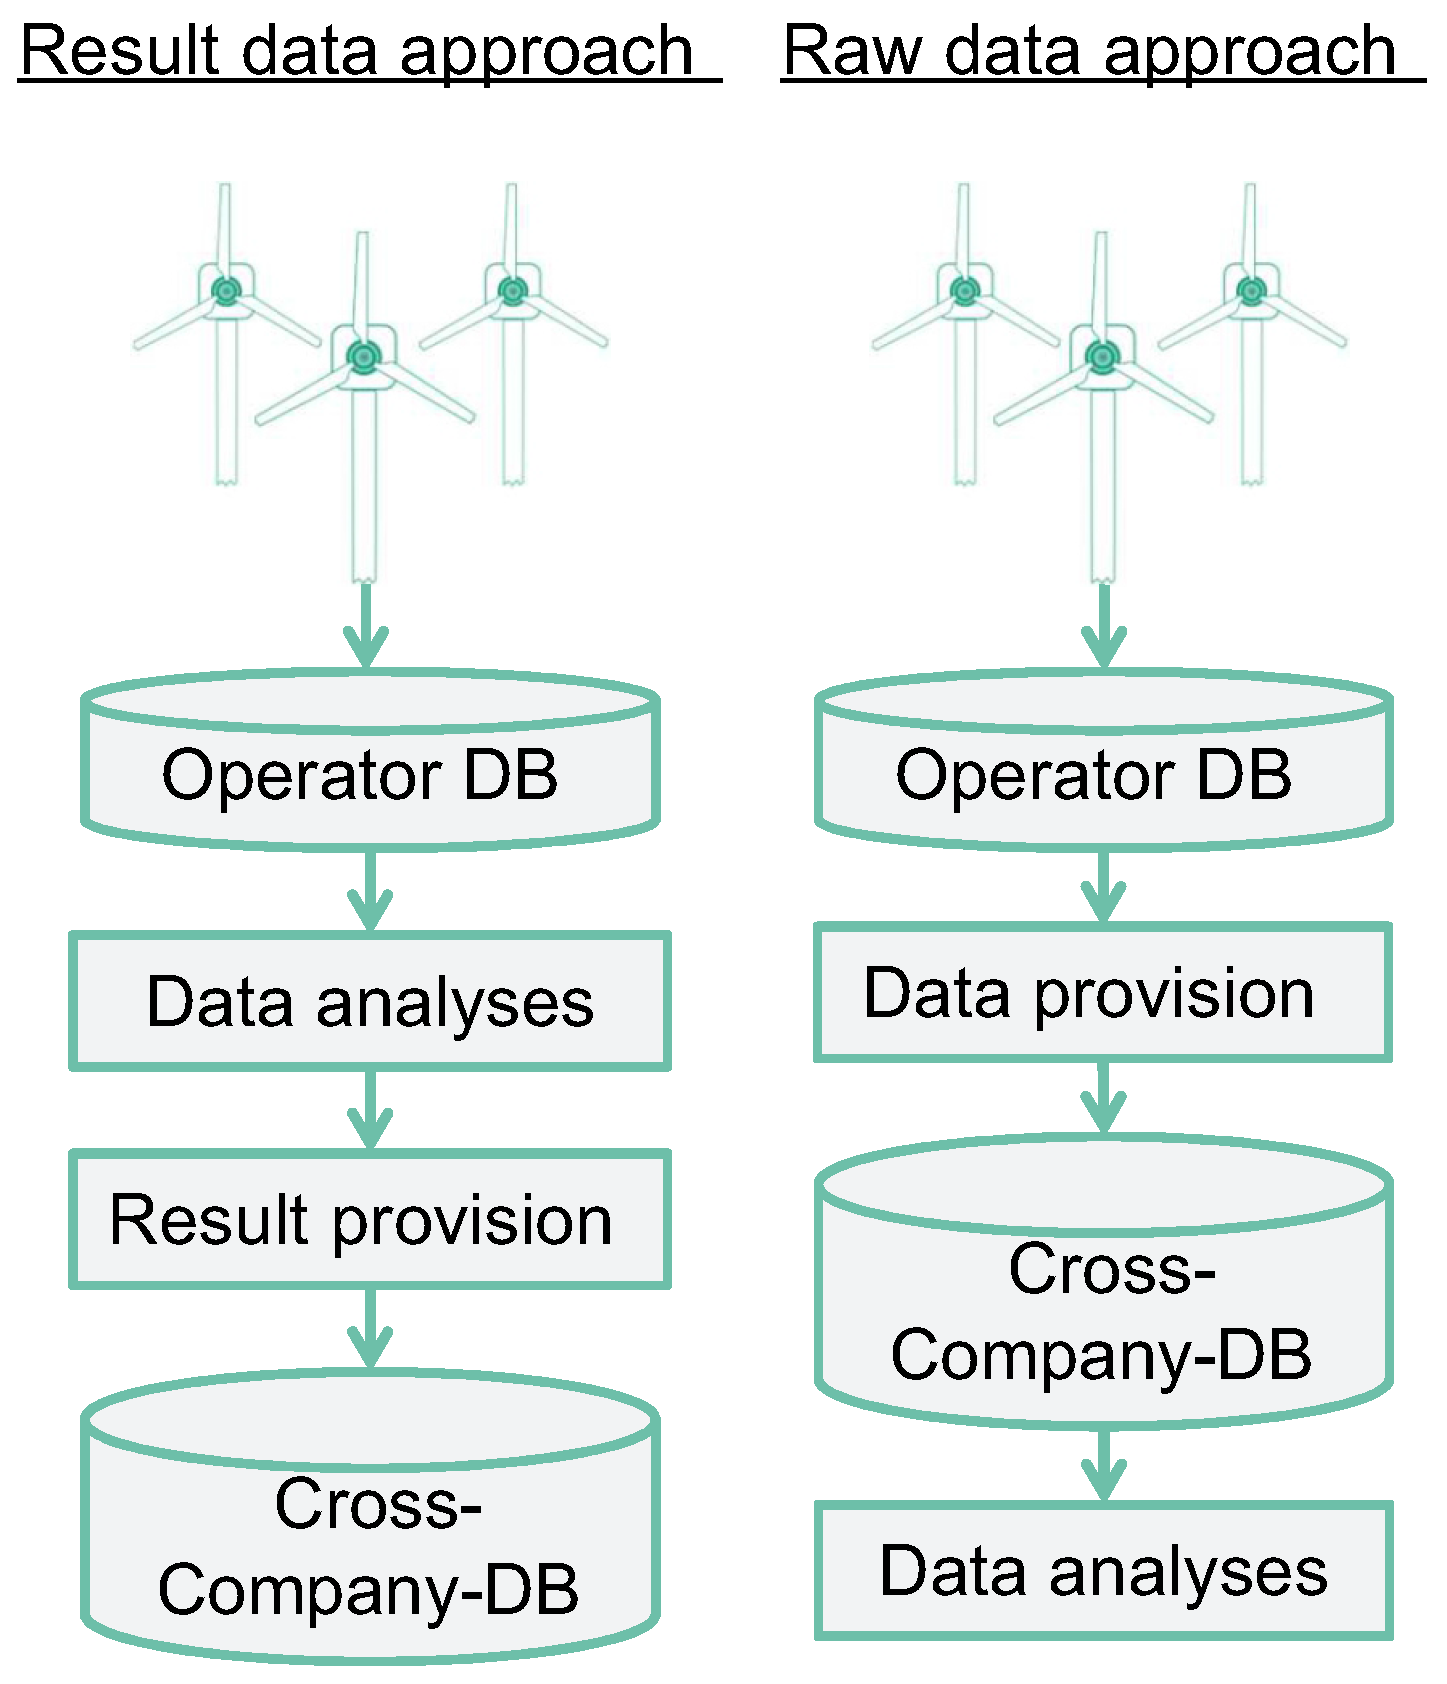
Many initiatives are designed as collaborative or cross-company databases to achieve a statistically relevant amount of data or to be able to make sound statements earlier. In principle, there are two approaches to design and operate such a common database as Figure 1 shows. In the first case (result data approach) the operator gathers all data in an internal database, analyses the data regarding performance and reliability and sends the results in a third step to the cross-company-database. The data trustee aggregates the results provided by the single operators. Main advantage is the small amount of data that needs to be transferred, handled and analyzed. On the other hand there are also disadvantages. It has to be ensured that all operators analyze their data in the same unique way, while various data analysts and multiple software systems are involved. In case that additional analyses shall be added, all operators have to carry these analyses out and to provide the results (also historic) to the data trustee.
In the second case (raw data approach) all analyses are conducted by the data trustee. For this purpose the operators still collect all data from the WT and forward a predefined data set of raw data to the cross-company-database. Analyses carried out by the operators are used only for internal purposes and for alignment. The rest of the process remains the same. In this approach consistent results can be assured and additional analyses added. The main advantage is the more detailed knowledge on the single turbine failures. By combining failure information and operational data, detailed reliability characteristics (e.g., failure distribution) can be derived while the first approach enables only basic results (e.g., failure rates). On the other hand this approach requires a larger and more powerful database and leads to higher effort in data transfer and standardization of the raw data.
Although this paper is intended to provide the most comprehensive overview and comparison of initiatives and publications that present information on the performance and reliability of WT, there are already some overviews that have also been used in literature research. During its work on the “Recommended Practices on Data Collection and Reliability Assessment” [15] members of IEA Wind Task 33 “Reliability Data” created the to date most extensive overview on initiatives concerning reliability data [16] which is still unpublished. Furthermore the work of Sheng [17], Pettersson et al. [18], Branner & Ghadirian [19], Pérez et al. [20] and Ribrant [21] have to be mentioned.
3.1. Overview on Initiatives and Publications
Table 1 gives an overview on the initiatives reviewed in this paper. A short description of the single initiatives can be found in Section 3.2. The table includes the subsequently listed information. In fact, the individual initiatives contain further master data on the WT technology and composition of the data sets, which cannot be compared at this point due to their heterogeneity.
- Initiative: Short name of the initiative, in some cases derived by authors of the present paper
- Country: Observation area of the initiative and in most cases location of the responsible institution
- Number of WT: Number of individual WT included in the initiative
- Onshore: Includes data on onshore WT if flagged up
- Offshore: Includes data on offshore WT if flagged up
- Operational turbine years: Summed number of operational years of all included turbines
- Start-Up of survey: Start of work on the initiative, data can also comprise previous years
- End of survey: End of work on the initiative and latest possible data
- Source: Sources considered in the present paper to describe the single initiative
The present paper considers only initiatives where information on the initiative is publicly available and first results are already available or will be published in the future. Internal company initiatives or commercial initiatives like the Greensolver Index [22] or webs [23] without an intention to publish results are not part of the review. Furthermore this paper focuses on a holistic view on WT and does not include initiatives dealing with single systems of the turbine like the “Wind Turbine Gearbox Reliability Database” [24] of the National Renewable Energy Laboratory or the “Blade Reliability Collaborative” [25] of the Sandia National Laboratories. At the same time, balance-of-plant equipment (BOP) is not part of the present review and ignored when existing in the single initiatives. Although every initiative has its own data collection, there is always the possibility of overlapping data sets. A detailed description on the sites, turbine types and manufacturers included in the single data collections is missing in most cases. Thus, an in-depth evaluation of the data sources to ensure independence of the single results is not possible. However, it is possible to differentiate between a likely and unlikely data overlap between the initiatives. An overlap is likely between LWK (Section 3.2.9) and WMEP (Section 3.2.23) as well as between SPARTA (Section 3.2.18), Strathclyde (Section 3.2.19) and WInD-Pool (Section 3.2.22) (offshore). In all other cases overlapping data is unlikely. This expert guess is based on the considered period of time and country/region of the data collection as well as on the author’s experience.
3.2. Description of Considered Sources
The following subsections provide a basic description of the initiatives listed in Table 1.
3.2.1. CIRCE-Universidad de Zaragoza (Spain)
Researchers of the CIRCE-Universidad de Zaragoza collected SCADA- and Failure-Data of various wind farms (WF), turbine manufacturers and types. The data set comprises data of about 4300 WT belonging to 230 WF. Rated capacity of the included turbines ranges between 300 kW and 3 MW. Data for a period of about three years is considered, likely to be around the year 2013. In total 7000 failure events/shut downs are analyzed, failures due to external causes are excluded. Failure information is structured according to a system structure originally defined by the ReliaWind project, which was adapted to the project needs and is thus unique. First analyses based on this data collection were published during the Torque Conference 2016 by Gonzalez, Reder and Melero. Failure rates are differentiated by the turbine concept (direct drive or gearbox) and the rated capacity (below or above 1 MW). Furthermore, the system specific frequency of SCADA alarms is compared to the share on down time events [26,27].
3.2.2. CREW-Database (USA)
The CREW-Database (Continuous Reliability Enhancements for Wind (CREW) Database and Analysis Program) was initiated by Sandia National Laboratories in 2007 to collect operational data and status information on onshore WT. The first annual benchmark report was published on year 2011 [28] and the last available results can be dated to 2013 [29]. Due to the fact that alarm codes instead of maintenance reports were gathered and analyzed, the results regarding event frequencies and average down times were not comparable to other initiatives [16,28,29].
In 2016 the CREW program was updated and Sandia changed the approach from collecting raw SCADA-Data to a collection of summarized data, provided by the participating operators. Participating operators provide master data on the included WT, summarized SCADA based availability data according to definitions of the IEC 61400-26 [8,10], summarized SCADA based maintenance data as well as data of the single maintenance records. Based on this data the CREW-Initiative compiles reports on different levels of detail. A proprietary and project specific taxonomy is used to describe components and event details. In addition to a partner specific report, a publicly available national baseline report is planned. Yet, no new results were published since the new updated program is in place [30].
3.2.3. CWEA-Database (China)
Lin et al. present in their paper reliability and performance results based on the 2010–2012 Quality Report of the China Wind Turbine Facilities by the Chinese Wind Energy Association (CWEA). In collaboration with 47 Chinese WT manufacturers, component suppliers and developers, CWEA gathered performance and failure data for the years 2010–2012 comprising between 111 WT in 2010 and 640 WT in 2012. It is mentioned, that most turbines are included right after their erection and thus suffer from early failures in many cases. Lin et al. solely provide information on the total number of failures per technical system of the WT, thus failure rates have to be calculated based on the provided data. Missing details regarding the included portfolio (e.g., direct drive or gearbox) make the results fuzzy. Furthermore no information on the system structure used or the severity and down time of failures is provided [31].
3.2.4. Elforsk/Vindstat (Sweden)
The report/initiative evaluating the reliability of Swedish WT basically consists of two data sources. A report on performance and availability is issued annually by Vindstat [32]. This information is supplemented by a database on reported failures operated by Vattenfall. Both databases consist of almost the same WT portfolio. The last public available reliability analysis based on this data set was published by Ribrant and Bertling [33] in 2007 and covers the years 2000–2004. In maximum the reliability analysis covers 723 WT while the whole database includes 786 WT. The collection of detailed maintenance data ended in 2005 [33,34].
3.2.5. EPRI-Database (USA)
This data set was collected by the Electric Power Research Institute (EPRI) during the years 1986 and 1987 and comprises output data and failure information on 290 WT (40 to 600 kW). All of these WT where located in the state of California. The authors of [35] assumed the old turbine technology to be the cause for the high failure frequency of the monitored turbines. For the sake of completeness, the results are added to the comparison. In addition to the failure rate also information on the mean time to repair (MTTR) is provided. In the present report MDT instead of MTTR is compared, thus only failure rates are added to the comparison [35].
3.2.6. EUROWIN, EUSEFIA (Europe)
The EUROWIN and EUSEFIA projects were an European initiative to collect data on installed WT throughout Europe, analyze their operational success and to evaluate the technical reliability. The first data was gathered in 1986 and results were published in several reports e.g., [36]. In 1994 the last report (1992–1993) was compiled [37]. Although diagrams of the failure frequency of the entire turbine are available, it was not possible to obtain any information on the failure frequency during the literature search. Thus no information can be added to the comparison in this section [36].
3.2.7. Garrad Hassan (Worldwide)
In 2008 Harman et al. presented their findings regarding availabilities of operational WF at the European Wind Energy Conference in Brussels. The evaluation is based on data sets, which were originally gathered by Garrad Hassan for different purposes. About 14,000 MW installed capacity is covered, including data between one and 15 years per WT. The total number of WT is not provided; the authors state that the data set includes more than 250 WF located in Europe, US and Asia consisting of turbines with a rated capacity between 300 kW and 3 MW [38]. Failure rates and down times are not covered, thus only availabilities are added to the present comparison.
3.2.8. Huadian New Energy Company (China)
In their paper, Chai et al. present reliability statistics based on the WT portfolio of the Huadian new energy company. The analyzed data set consists of 26 WF and 1313 WT of various types and manufacturers. In total, information on 482 failures representing 65,786 hours of down time were collected between January and May 2012. Information on the share of failures and down time belonging to single WT systems are provided, the used system structure seems to be unique. No failure rates or down times per failure are provided, thus failure rates and down times have to be derived from the provided percentage values which were rounded to whole numbers and thus lead to imprecise results [39].
3.2.9. LWK (Germany)
The LWK-Database is a data collection initiated by the Schleswig-Holstein Chamber of Agriculture (LWK). Schleswig-Holstein being the most northern state of Germany with the highest percentage of coastline, WT included in this data collection face comparatively high wind speeds. Between 1993 and 2009 a maximum of 643 WT reported data (output and failures) to the LWK-Database. This is equivalent to an experience of 5719 operational years. Results of the data collection were published in an annual report [16,40].
3.2.10. Lynette (USA)
The paper of Robert Lynette published in 1988 discusses the availability and reliability of small scale WT mainly erected in the State of California. While the paper discusses bad availability of most WT types and specifies about 8% of the total WT as total losses between 1981 and 1985, no information regarding failure frequencies and average down times is provided [41,42].
3.2.11. MECAL (Netherlands)
Based on the data of MECAL, a Dutch consulting company, Kaidis et al. combine in their paper operational SCADA-Data and SCADA alarms to obtain reliability figures on the single turbine systems and subsystems. Events requiring manual intervention by a service technician are categorized using the ReliaWind system structure. The data set consists of 63 WT belonging to three WF and an average observation period of 705 days per turbine. Solely the relative share of single systems of the WT on the total down time and the total number of failures respectively is provided. Due to missing failure rates or average down times, the results can’t be added to the present comparison [43].
3.2.12. Muppandal Wind Farm (India)
In 2010 Herbert et al. published a paper presenting analyses on the performance, availability and reliability of the Muppandal wind farm. The data collection consists of 15 stall controlled WT (225 kW) and comprises data of five years (2000–2004). Results on the technical availability, on the time-based availability from an operator’s perspective and on the capacity factor are provided. Furthermore information on failure frequencies and in some cases also on the repair time is presented. Event data is collected using a proprietary system structure/taxonomy [44].
3.2.13. NEDO-Database (Japan)
The Japanese New Energy and Industrial Technology Development Organization (NEDO) collected failure data of WT for the fiscal year 2004 (April 2004 to March 2005). For this purpose a request to provide failure information using a predefined report format was sent to Japanese WF operators. A total of 924 WT are represented by 139 reports on failures/breakdowns. In some cases multiple systems failed at the same time. This results in a total count of 161 failed systems. The low number of failures is caused by a minimum down time of at least 72 h for an event to be considered. While the available publication includes an assignment of the failure rate to different systems of a WT, information on the down time is solely provided as a cumulated value [45].
3.2.14. ReliaWind (Europe)
Between 2008 and 2011 the ReliaWind research project, funded by the European Union, collected and analyzed SCADA-Data, fault/alarm logs, work orders and service reports. In total the ReliaWind Database consists of 35,000 down time events of about 350 WT. On this basis the failure rate and mean time to repair is evaluated for the most important systems. For confidentiality reasons reliability characteristics are not published as absolute values but as relative (percentage) value of the total failure rate/down time. Thus, results of ReliaWind can provide insights on the impact of single systems/components but can’t be directly compared to other initiatives [46,47].
3.2.15. Robert Gordon University - RGU (UK)
During his PhD at the Robert Gordon University, Jesse Agwandas Andrawus gathered and analyzed failure data of 27 WF. All WF are located in the same geographical region and Andrawus focused on WT of the 600 kW class. According to the single incident reports, data was gathered at least between year 1997 and the end of year 2006. The provided reliability characteristics are based on event reports of 77 WT, all of 600 kW rated power. Published results consist of two parametric weibull distributions and MTBF values for the main shaft, main bearing, gearbox (gears, hss bearings, ims bearings and key way) and the generator (bearings, windings). No data regarding average down times is available [48].
3.2.16. Round 1 Wind Farms (UK)
UK round 1 offshore WF had to report their operational results according to the “Offshore wind capital grants scheme” for the years 2004–2007. Feng et al. [49] analyze and condense these operational reports to learn from the early experiences in offshore wind. Results such as capacity factors, availabilities and cost of energy are presented. Failures and down times are described as well, but no failure statistics are performed. Thus, solely capacity factors and availabilities are added to the present comparison. The data set includes 4 WF, 120 WT, representing 300 MW and 270 years of operational experience [49].
3.2.17. Southeast University Nanjing (China)
Su et al. present results of a reliability analysis carried out for a WF in the Jiangsu Province of China. The WF consists of 108 WT which were constructed in two individual projects. Thus, the data set includes two different turbine types (1.5 MW and 2 MW) and two different manufacturers. All turbines were commissioned between 2009 and 2011. The analyzed data was gathered between 2009 and 2013 as well as between 2011 and 2013 respectively. According to an unique system structure, the study differentiates 11 different systems of the WT. Failure information is extracted from the SCADA-System and the authors state that WT are simply restarted in many cases. Hence, failure rates are high and average down times are low compared to other statistics [50]. To enable a comparison, partial results of the single WF projects are aggregated.
3.2.18. SPARTA (UK)
The SPARTA (System Performance, Availability and Reliability Trend Analysis) initiative was formed in 2013 by operators of offshore WF in the UK. Initiated by The Crown Estate, the Initiative is managed by ORE Catapult. SPARTA is following the result data approach and gathers Key Performance Indicators (KPI) from participating operators, which are used as a basis for monthly benchmark reports. All KPIs are provided as aggregated values on WF level. Reliability figures (repair rate instead of failure rate) are reported on the subsystem level according to Reference Designation System for Power Plants (RDS-PP®) (Section 5.1). To date, the latest available results were published in March 2017 and are based on 14 months of data (April 2015–May 2016) belonging to 1045 WT (19 WF, 3.55 GW) [51]. All results are presented as figures and lacking detailed labels. Thus, all values have to be estimated to add them to the present comparison and are somewhat imprecise. Values are calculated as weighted average based on the number of WF if needed.
3.2.19. Strathclyde (UK)
A recent publication by Carroll et al. (University of Strathclyde) provides reliability characteristics of modern offshore WF. The analyzed data set consists of about 350 WT, representing an operational experience of 1768 turbine years. For confidentiality reasons, no turbine type is named. Nevertheless the considered turbine type is described to have a rated power between 2 MW and 4 MW as well as a rotor diameter between 80 m and 120 m. It is differentiated between minor and major repair and major replacements. In addition to failure rates, further results like material costs or required technicians per subassembly are provided. The publication includes an average repair time instead of the commonly used MDT. Thus only failure rates can be compared [52]. Further publications [53,54] of Carroll et al. also make use of the described data source and furthermore include results on onshore WT. These publications focus on differences between drive train concepts and are thus not considered in the present comparison.
3.2.20. VTT (Finland)
Finnish WT are reporting their performance and failure reports to the Finnish research center VTT [55,56]. Data collection is ongoing since 1991 and comprises almost all Finnish WT. Since there are only a few published results in an accessible language, the present report does probably not include the latest available results. The comparison considers results published by Ribrant [21] in 2006. His analysis is based on a data set of in total 92 WT and the reporting period between year 2000 and year 2004 [21,55,56].
3.2.21. WindStats (Germany/Denmark)
The WindStats Newsletter/WindStats Report is published since 1988 as a commercial product which is currently owned by the Haymarket Media Group. Today the WindStats Report is published on a quarterly basis and comprises performance data as well as information on WT failures and down time. For this comparison the original WindStats Reports were not available. Thus already existing analyses are taken into account. The last results were publicly published in 2013 by Sheng [17]. Due to missing information on absolute failure frequencies, this publication cannot be considered. Thus, results published in 2007 by Tavner et al. [57] are added to the comparison. The publication differentiates between Danish and German WT. While the data collection started in 1988 and is still ongoing, the analyzed data set comprises the years 1994–2004 and 4500 (Ger) respectively 2500 (DK) WT. No down time for the subassemblies is included in the publication, thus only failure rates will be added to the comparison [17,40,57].
3.2.22. WInD-Pool (Germany/Europe)
WInD-Pool (Wind-Energy-Information-Data-Pool) is an initiative of Fraunhofer IWES to gather and analyze operational and maintenance data according to industry standards like RDS-PP® and ZEUS. The WInD-Pool can be named as the indirect successor of WMEP. Based on the research projects EVW [61] and Offshore~WMEP [60], the initiative started to gather data in 2013. Also historic data is accepted, thus first data sets date back to 2002. The most recent publication [59] is based on operational data of 456 WT (onshore and offshore) and event data of 630 WT. To date, published event frequencies and average down times are solely based on operational data (SCADA). Because of a the missing assignment to a system structure, results cannot yet be added to the comparison [58,59,60,61].
3.2.23. WMEP (Germany)
In 1989 the “Wissenschaftliches Mess- und Evaluierungsprogramm”—short WMEP—was initiated and funded by the German government. Fraunhofer IWES (formerly ISET e.V.) carried out this continuous monitoring project and gathered data till 2008. More than 1500 WT participated in the initiative and reported operational performance as well as failures for a period of at least 10 years each. In total around 63,000 reports on maintenance and repair measures were collected and form one of the most significant collections of reliability data. Failure rates and average down times are added to the comparison. Further information like O&M costs and technical data were also collected but are not of relevance in the present report [62,63,64].
4. Performance of Wind Turbines
This section provides an overview of the performance of WT as published by different initiatives. KPI are ordered according to the definitions in Section 2.
4.1. Capacity Factor
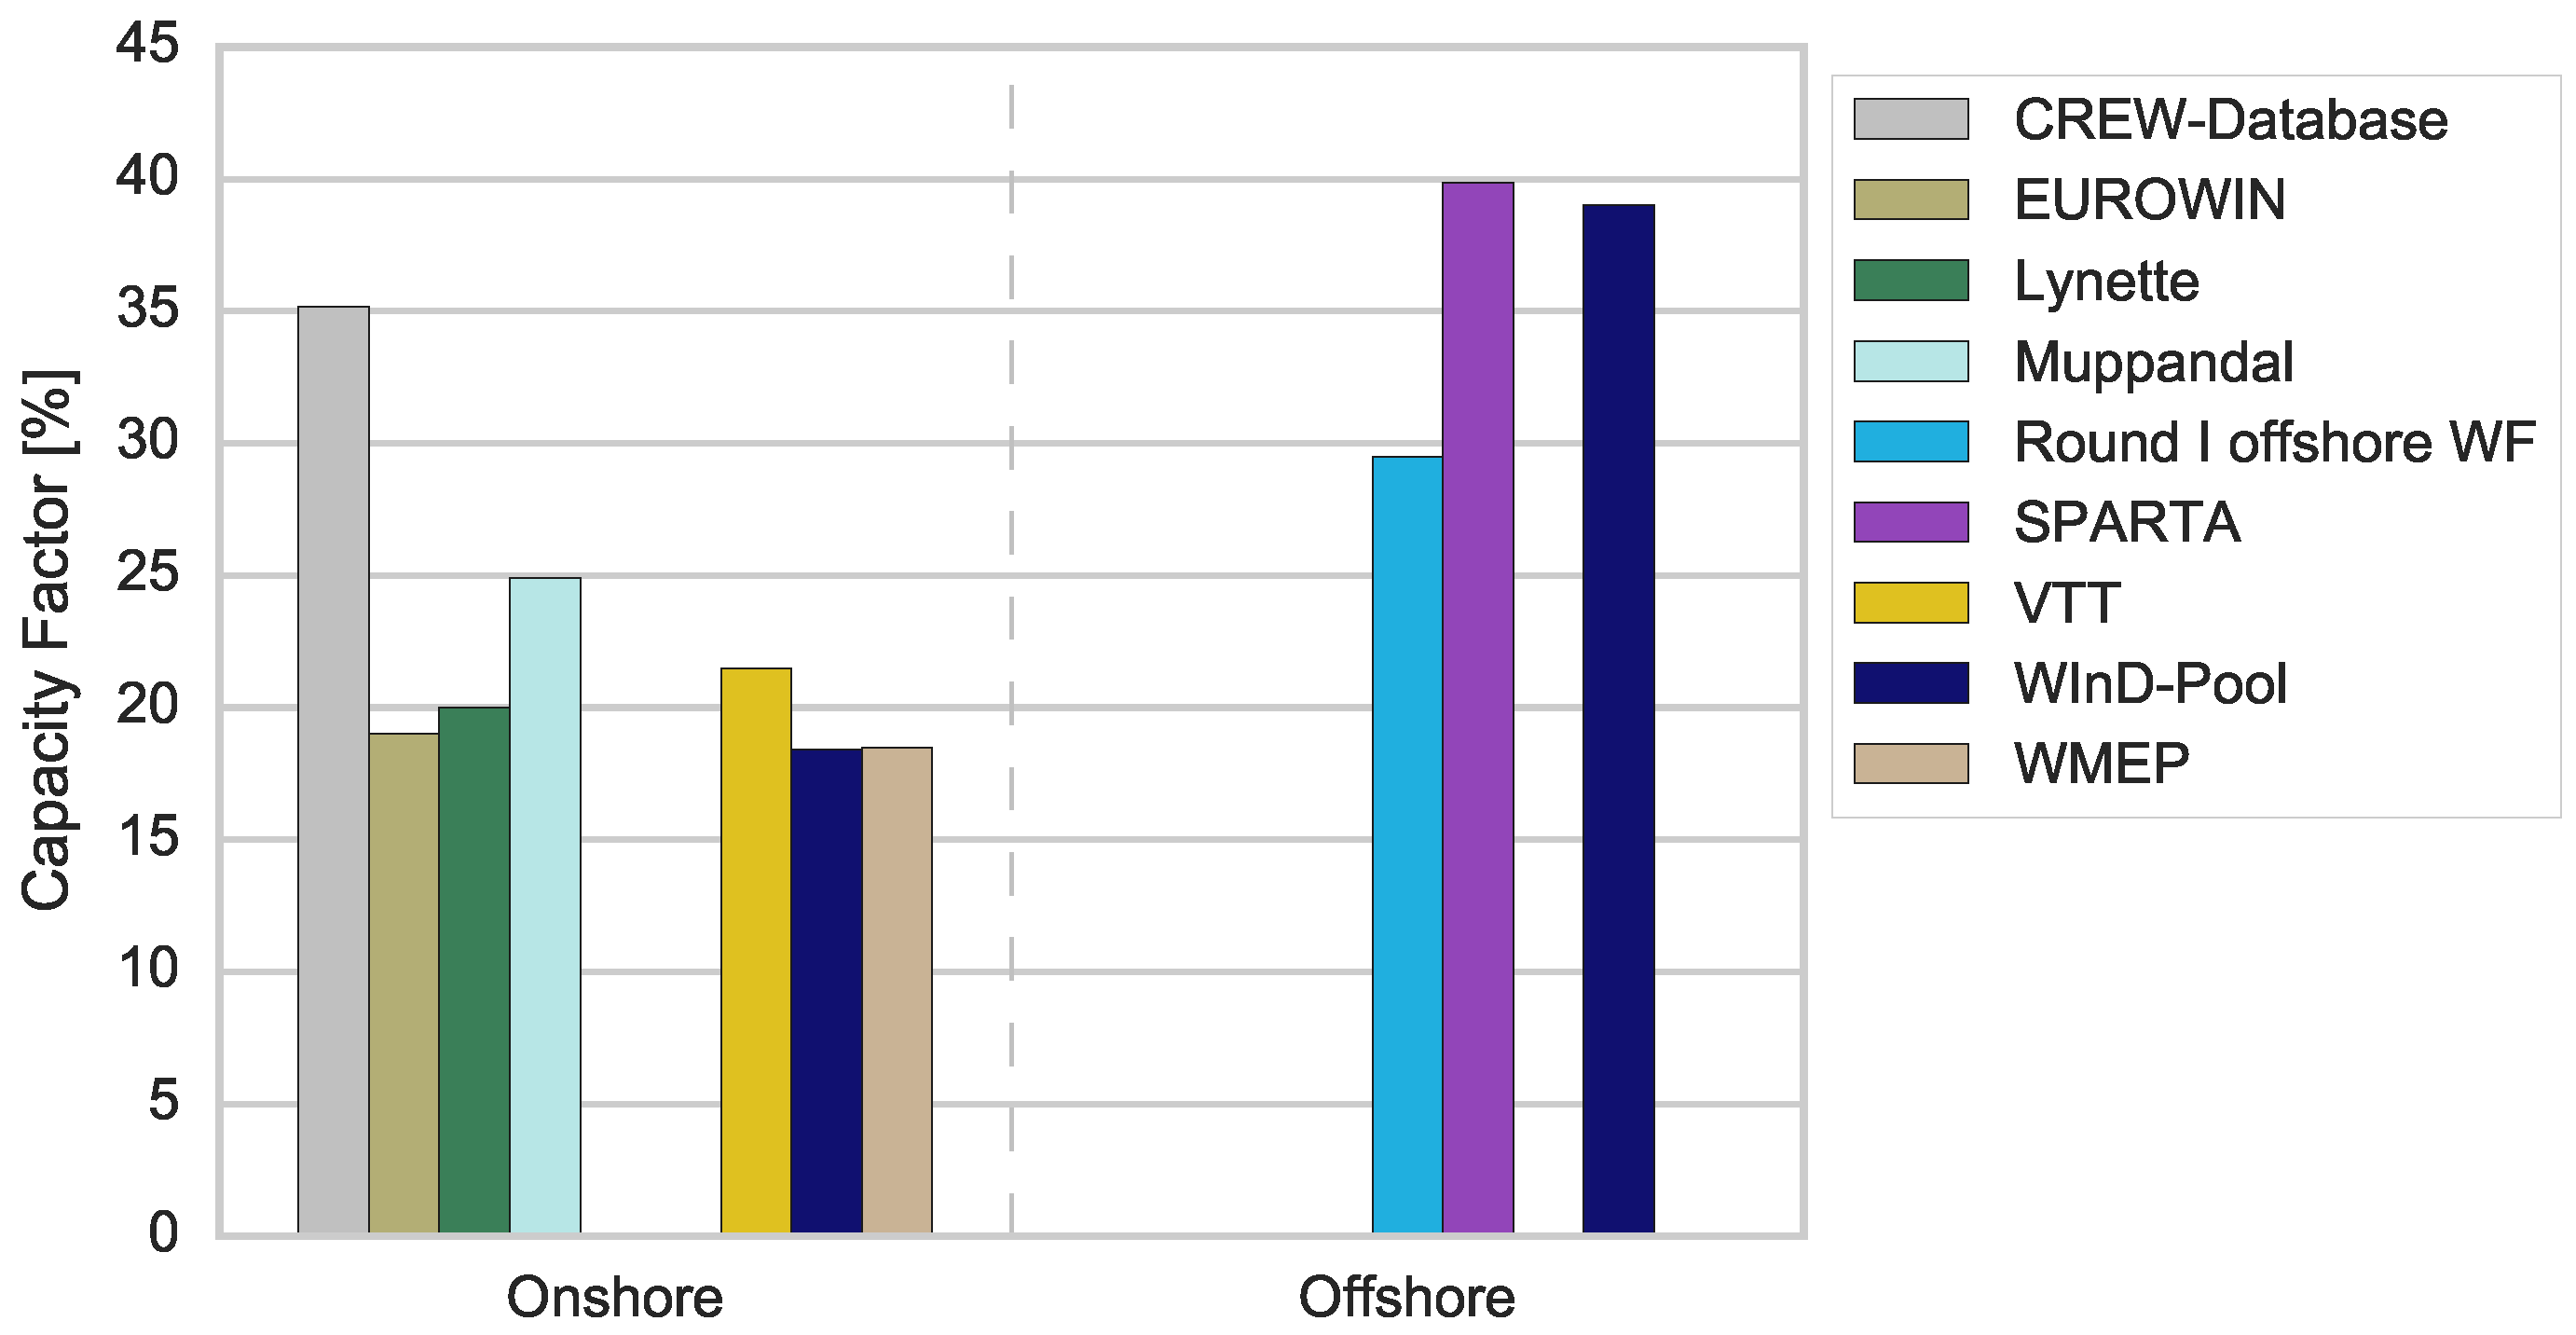
Out of the 24 initiatives considered in this paper, nine initiatives have provided figures on the capacity factor. Three initiatives provided information on offshore WT whereas seven initiatives investigated the capacity factor of onshore WT. As Table 2 and Figure 2 show, there are great differences between onshore and offshore WT and even between the different sources in each category. Due to the clear and unmistakable definition of the capacity factor, the presented numbers are likely to be reliable.
Both, SPARTA and WInD-Pool show capacity factors of almost 40% for offshore WT. An overlap between the data basis of the two initiatives is likely. Nevertheless, a capacity factor of 40% can be considered as a good estimation for modern offshore WF. Substantially lower capacity factors were observed during the first operational years of round 1 WF in UK. Low results were caused, for example, by low availability (Section 4.2).
Results on onshore WT seem to be heavily depending on the respective country. Capacity factors recorded by the CREW-Database for onshore WT in the US are almost as high as offshore in Europe, most likely due to beneficial site conditions. VTT, WInD-Pool and WMEP show capacity factors of about 20% for European locations. The data set consist in all cases mainly of older WT, still the portfolio of WInD-Pool is the most up-to-date and a value of about 19% seems to be a good assumption for the existing asset in Germany. This assumption is supported by the 10-year average value (18.9%) stated in the Wind Energy Report Germany 2016 [65]. Nevertheless, modern WT are likely to reach significantly higher capacity factors.
4.2. Availability
A total of 11 initiatives, nine on onshore and three on offshore WT, published results on the availability of WT, see Table 3. All the different availability definitions described in Section 2 are used by at least one of the considered initiatives. Detailed information on the actual calculation procedures are only available in a few cases. In some cases the detailed designation of the availability type was missing, thus the authors of the present paper had to categorize the value based on their experience. These limitations make the comparison somewhat fuzzy, but general statements are nevertheless possible.
As Figure 3 shows, the time-based availability of onshore WT is with a few exceptions close to 95%. Lynette shows a low availability of only 80% but this result is already 30 years old. Nowadays, according to the CREW-Database, WT in the US are performing much better. Results from the Muppandal WF are a perfect example for the significance of availability definitions. While the time-based availability is only 82.9%, the technical availability is at 94%. This result is still lower than in comparison to modern European WT but already close. Failures of the grid connection mainly caused the large difference between both results. An energetic availability was solely provided by the WInD-Pool initiative. Depending on the application, the results of the CREW-Database, CWEA-Database, Garrad Hassan, WInD-Pool and still WMEP can be considered most relevant.
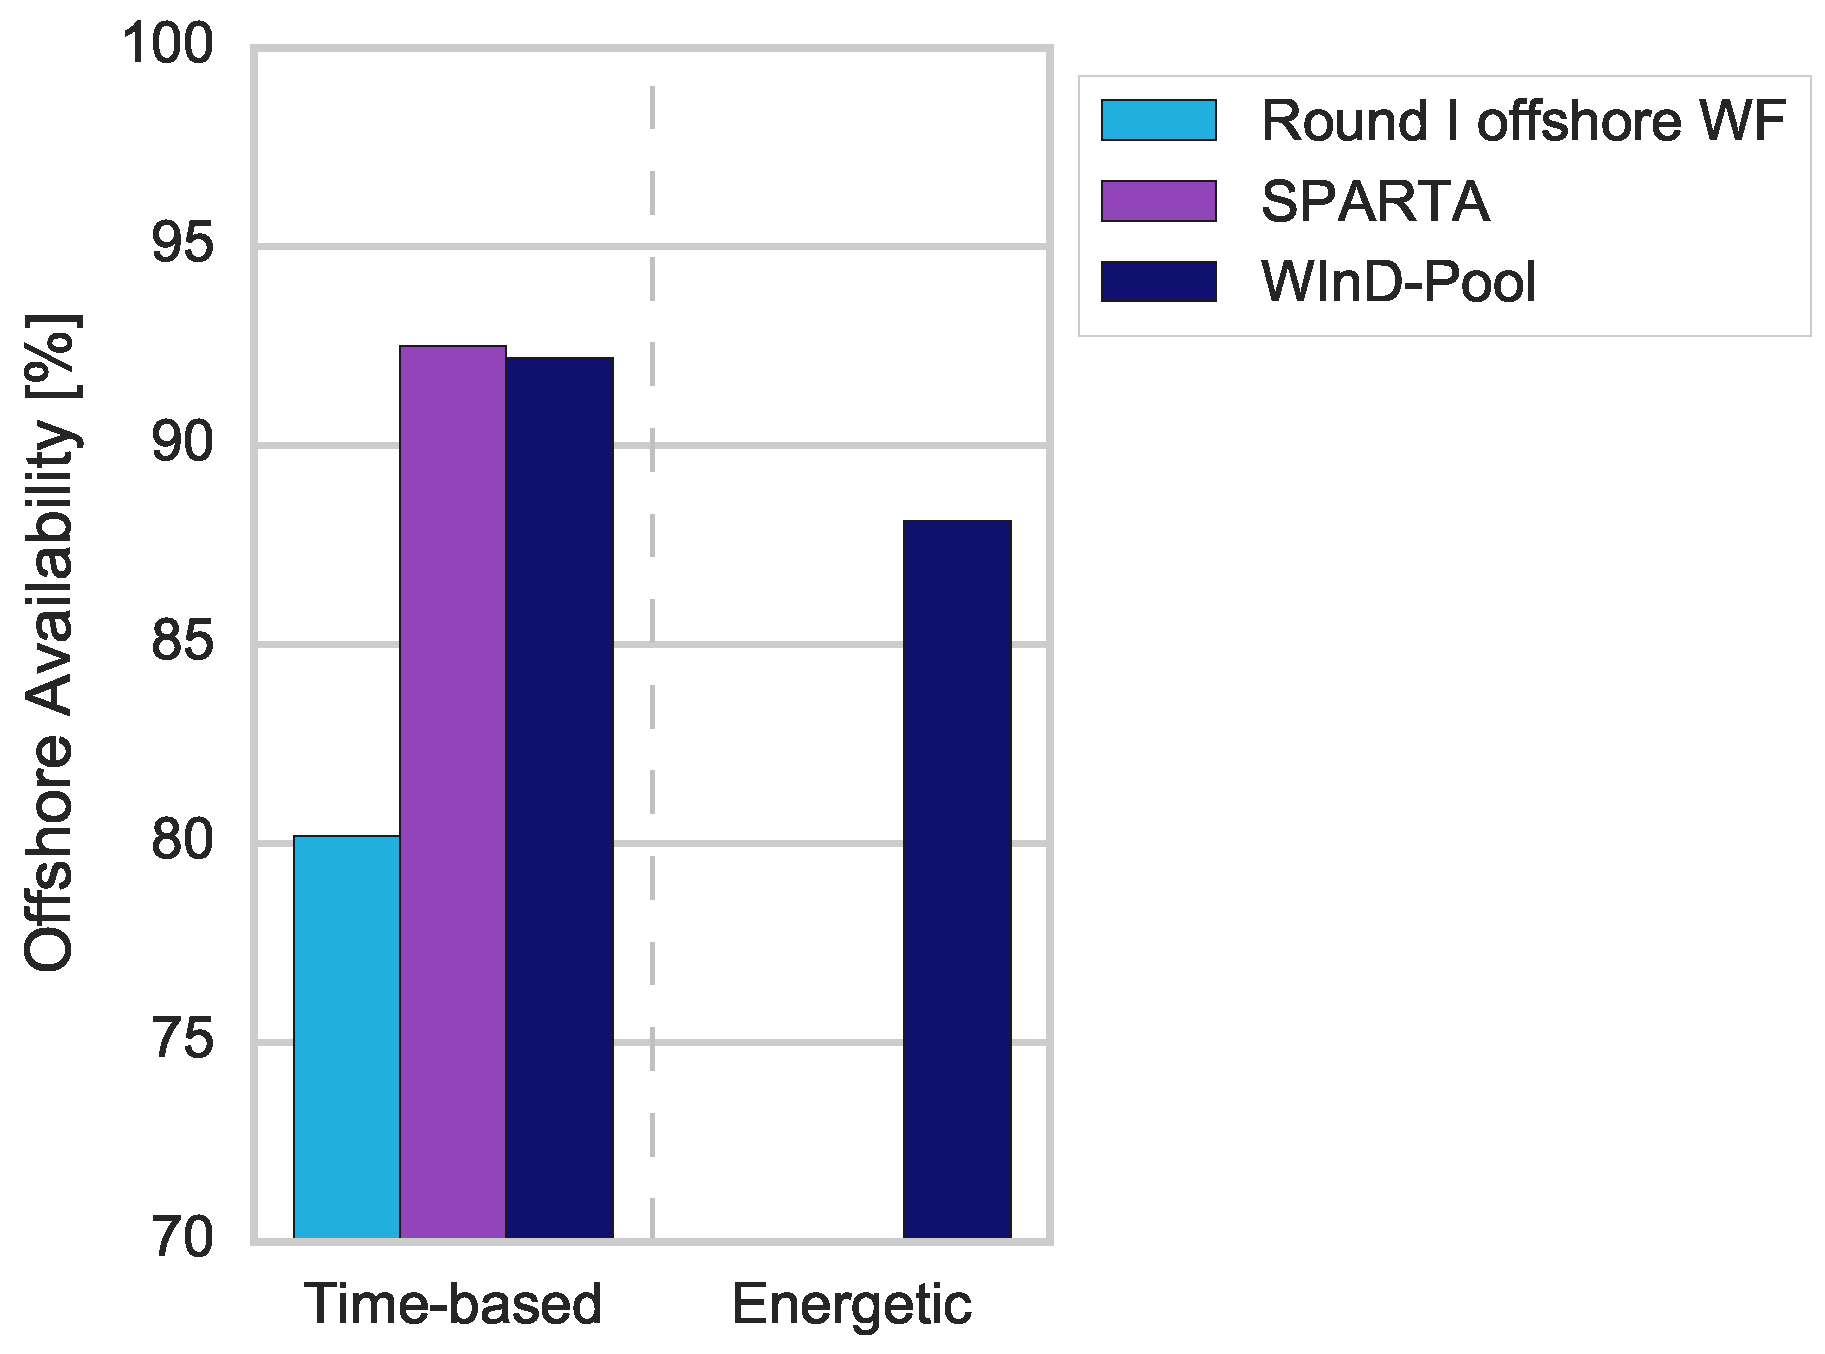
Due to harsh environmental conditions and more complicated accessibility, offshore WT tend to lower availability when compared to onshore WT, as Figure 4 shows. As for the capacity factor, the results of SPARTA and WInD-Pool regarding the time-based availability are almost on the same level. WF of the first offshore tender in the UK had major technical problems in the first years of operation, which led to an average availability as low as 80%. It can be assumed that these problems have now been overcome and the results of WInD-Pool and Sparta should be used as preferred.
5. Reliability of Wind Turbines and Subsystems
This section provides an overview and tries to give a cautious comparison on reliability characteristics published by 15 different initiatives. While all 15 initiatives provide results on the failure rate (two on offshore WT), only seven initiatives (none on offshore WT) supplement their publication by information on down times. Thus, failure rates and down times are discussed in individual sub sections. The comparative presentation of reliability characteristics of WT in this chapter should be considered with caution for several reasons:
- The single initiatives make use of multiple, in most cases individual, poorly documented designation systems to differentiate between functions/components of WT. The authors of this paper mapped the applied categories to the best of their knowledge to RDS-PP® to enable a comparison of results. A proper mapping was not possible in many cases, that is why the category “Other” has a high share in the results.
- There are big differences in the definition of an event considered as “failure” between the single initiatives. Some consider only events with a down time of at least three days (NEDO) while others (Southeast University Nanjing) count remote resets as well, which leads to high failure frequencies and low average down times. In many cases a sufficient description of a “failure” is not provided.
- It stays in most cases unclear whether repairs, replacements or both are considered in the results. The same is valid for different failure causes (external vs. internal) or the differentiation between preventive and corrective maintenance. Whenever possible, regular maintenance is excluded from the comparison (e.g., EPRI).
For the aforementioned reasons, it is not reasonable to calculate average values for the reliability of WT. The circumstances and assumptions in the individual publications are simply to different. It is therefore advisable to use the most suitable source for each application. This paper is intended to support this and provide recommendations.
5.1. Industry Standards on Data Collection
When analyzing data from different sources or comparing results from different initiatives it is indispensable to make use of standards to enable sound results. In early 2017, a working group (Task 33) of IEA Wind published recommended practices [15] to collect and analyze data on the reliability of WT. The authors differentiate between “Equipment Data”, “Operating data/measurement values”, “Failure/fault data” and “Maintenance & inspection data”. Furthermore, they compare existing guidelines/standards providing taxonomies for unique designations within the data groups. Definitions of KPIs used in this paper are provided in Section 2.
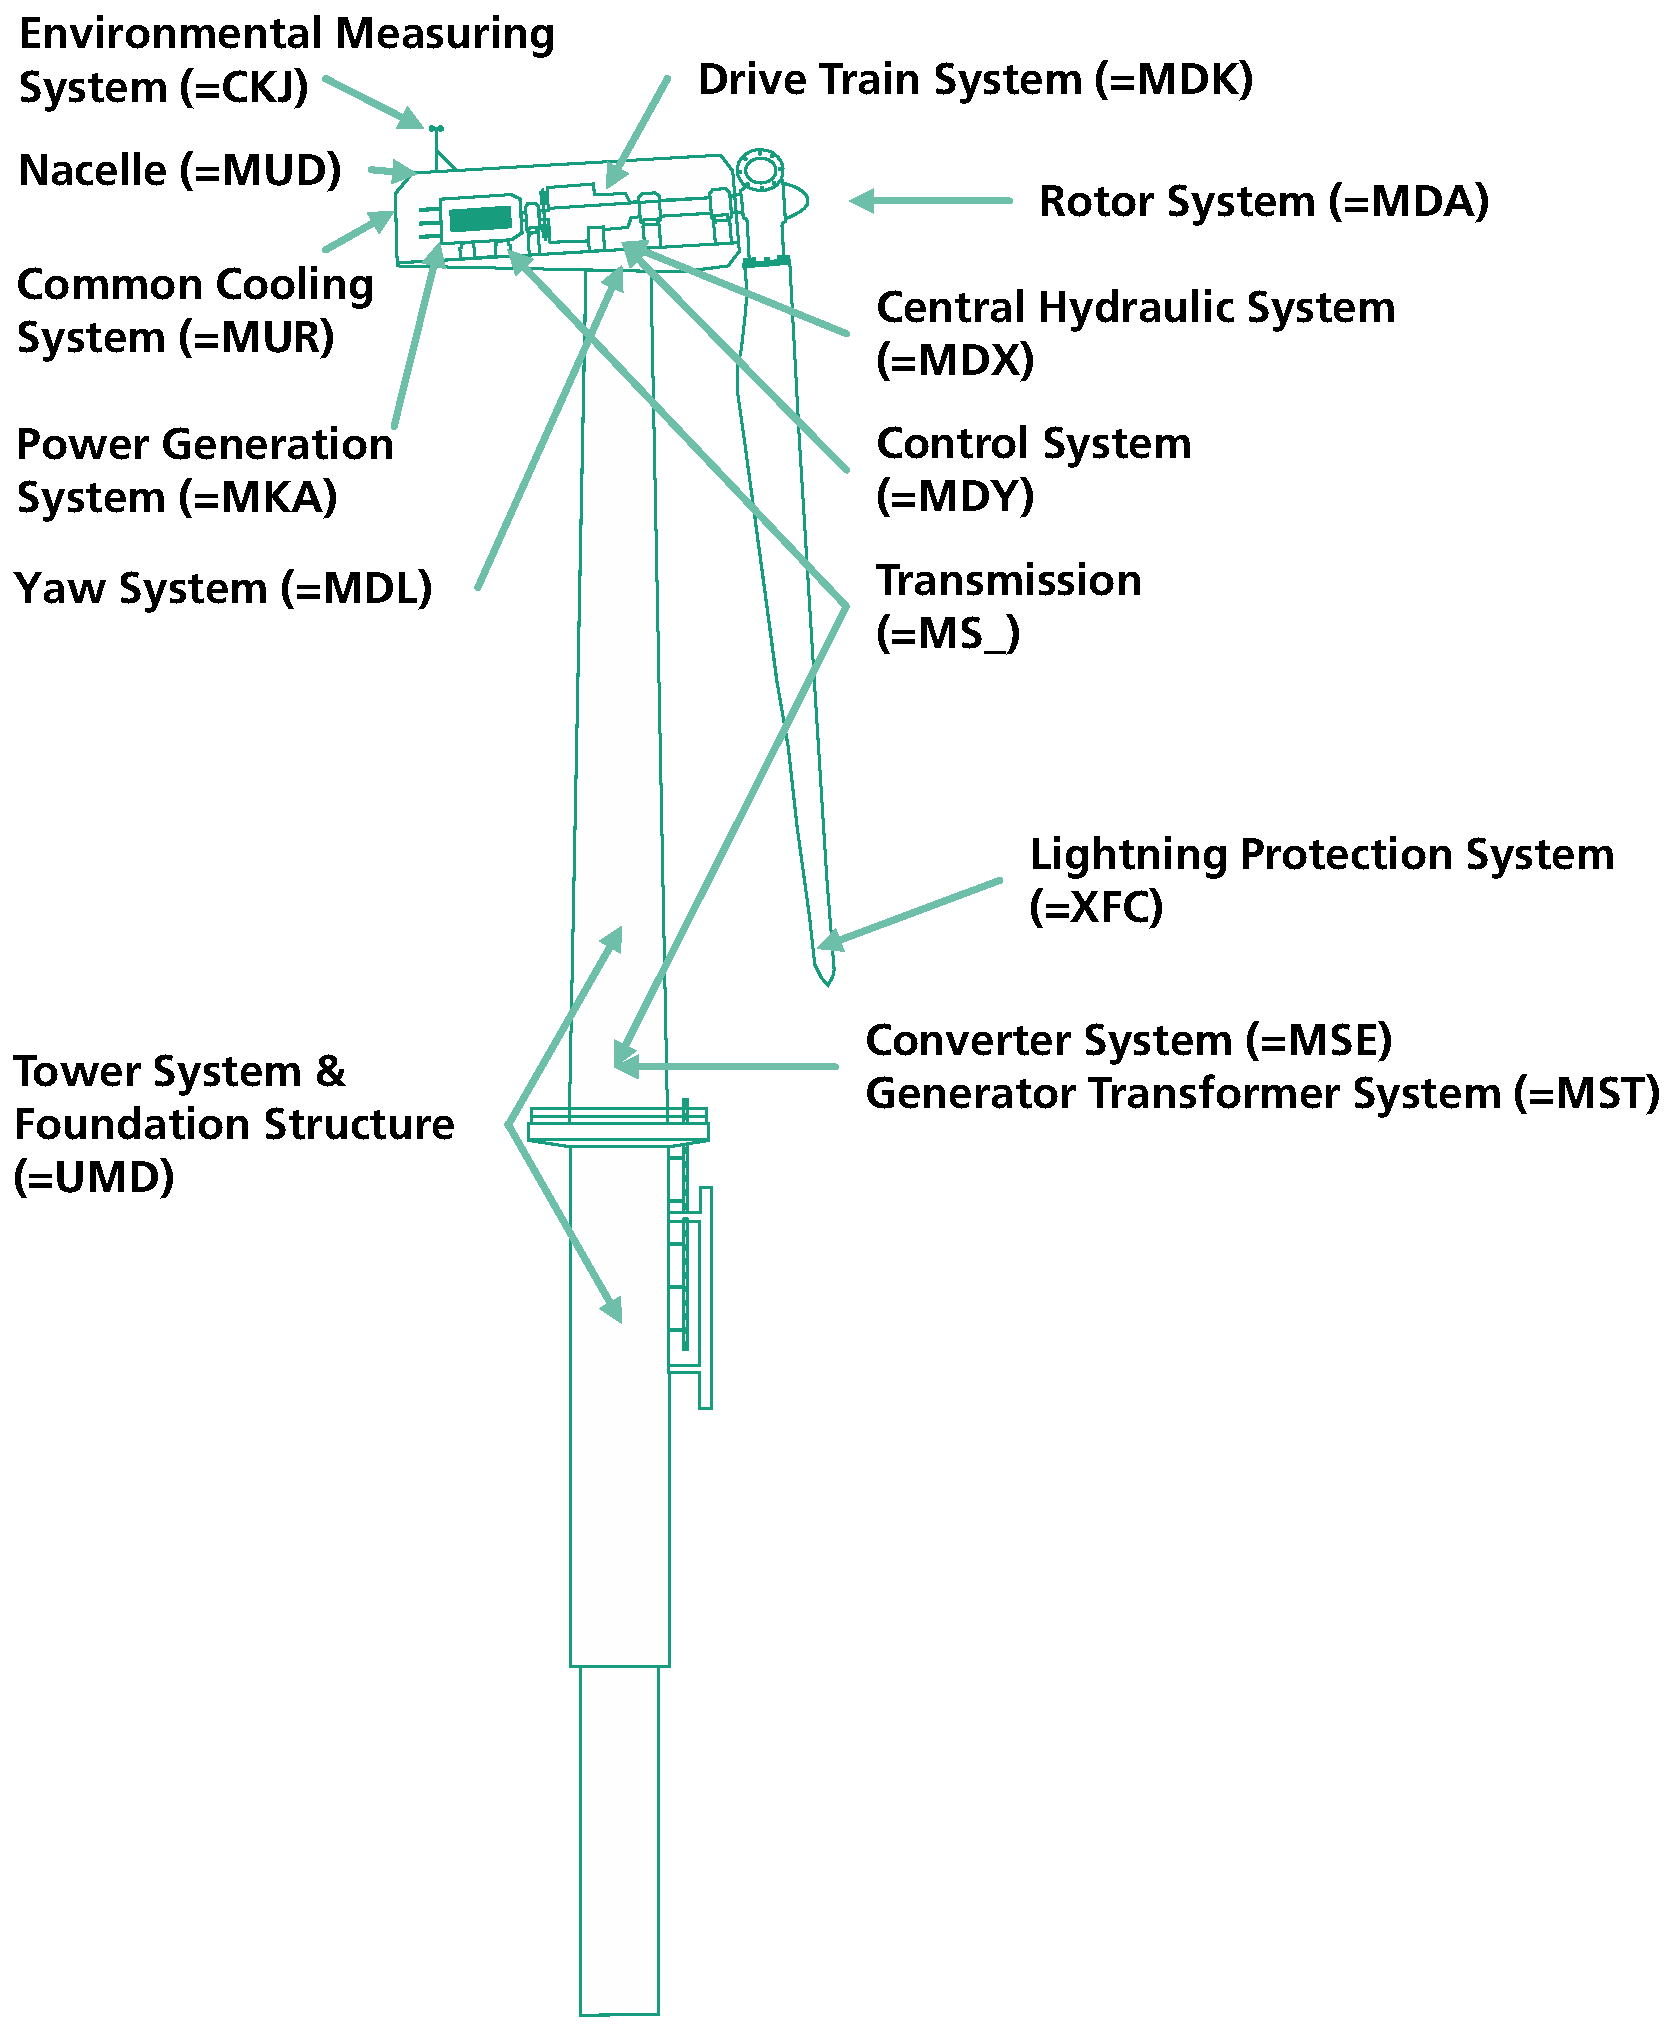
The present paper applies RDS-PP® [66] to designate single components (“Equipment data”) and to assign them to main- or subsystems of the WT. RDS-PP® is based on international standards (e.g., IEC 81346 and ISO/TS 16952-10). Figure 5 shows the basic breakdown of the WT system structure according to RDS-PP®. Because RDS-PP® divides a WT into several subsystems based on the purpose of the single system/component, the location of the single systems as implied in Figure 5 is not necessarily the same for different WT types. In some cases (e.g., Yaw System) the location of a system can be clearly determined, in other cases (e.g., Lightning Protection System) the different subsystems are spread over the whole turbine. The application of RDS-PP® enables a joint analysis of maintenance data from different manufacturers and turbine types. Even if the location of some systems is completely different—the converter system might be located in the nacelle or at the tower base—the functional designation stays the same. If necessary, the location (point or site of installation) can also be described using the additional location aspect of RDS-PP®. For practical reasons, the authors of this paper have decided to deviate from RDS-PP® in one specific case. Due to its design principals, RDS-PP® does not include a specific subsystem for components responsible to pitch the rotor blades of a WT. Instead, the components are distributed across different subsystems. As almost all considered initiatives do, the present paper also includes a “pitch system” which is not conform to RDS-PP® and was allocated as a subsystem of the rotor system.
Even though further taxonomies like NERC-GADS [67], the ReliaWind [26,46] system structure and ISO 14224 [11] are available, RDS-PP® is the most comprehensive and up-to-date standard. First European manufacturers and operators of WT already make use of RDS-PP® and were also involved in the development of the guideline [66]. IEA Wind states NERC-GADS and RDS-PP® to be the most promising designation systems for equipment data in the wind industry [15]. Due to missing details in the underlying publications, taxonomies for further data groups are not used in the present paper. Nevertheless it can be recommended to make use of the “State-Event-Cause-System” (ZEUS) [68] developed by a working group at FGW to enable a unified description of all important WT states and related maintenance measures. ZEUS allows for example the important differentiation between repair and replacement.
5.2. Overview on Failure Rate and Mean Down Time
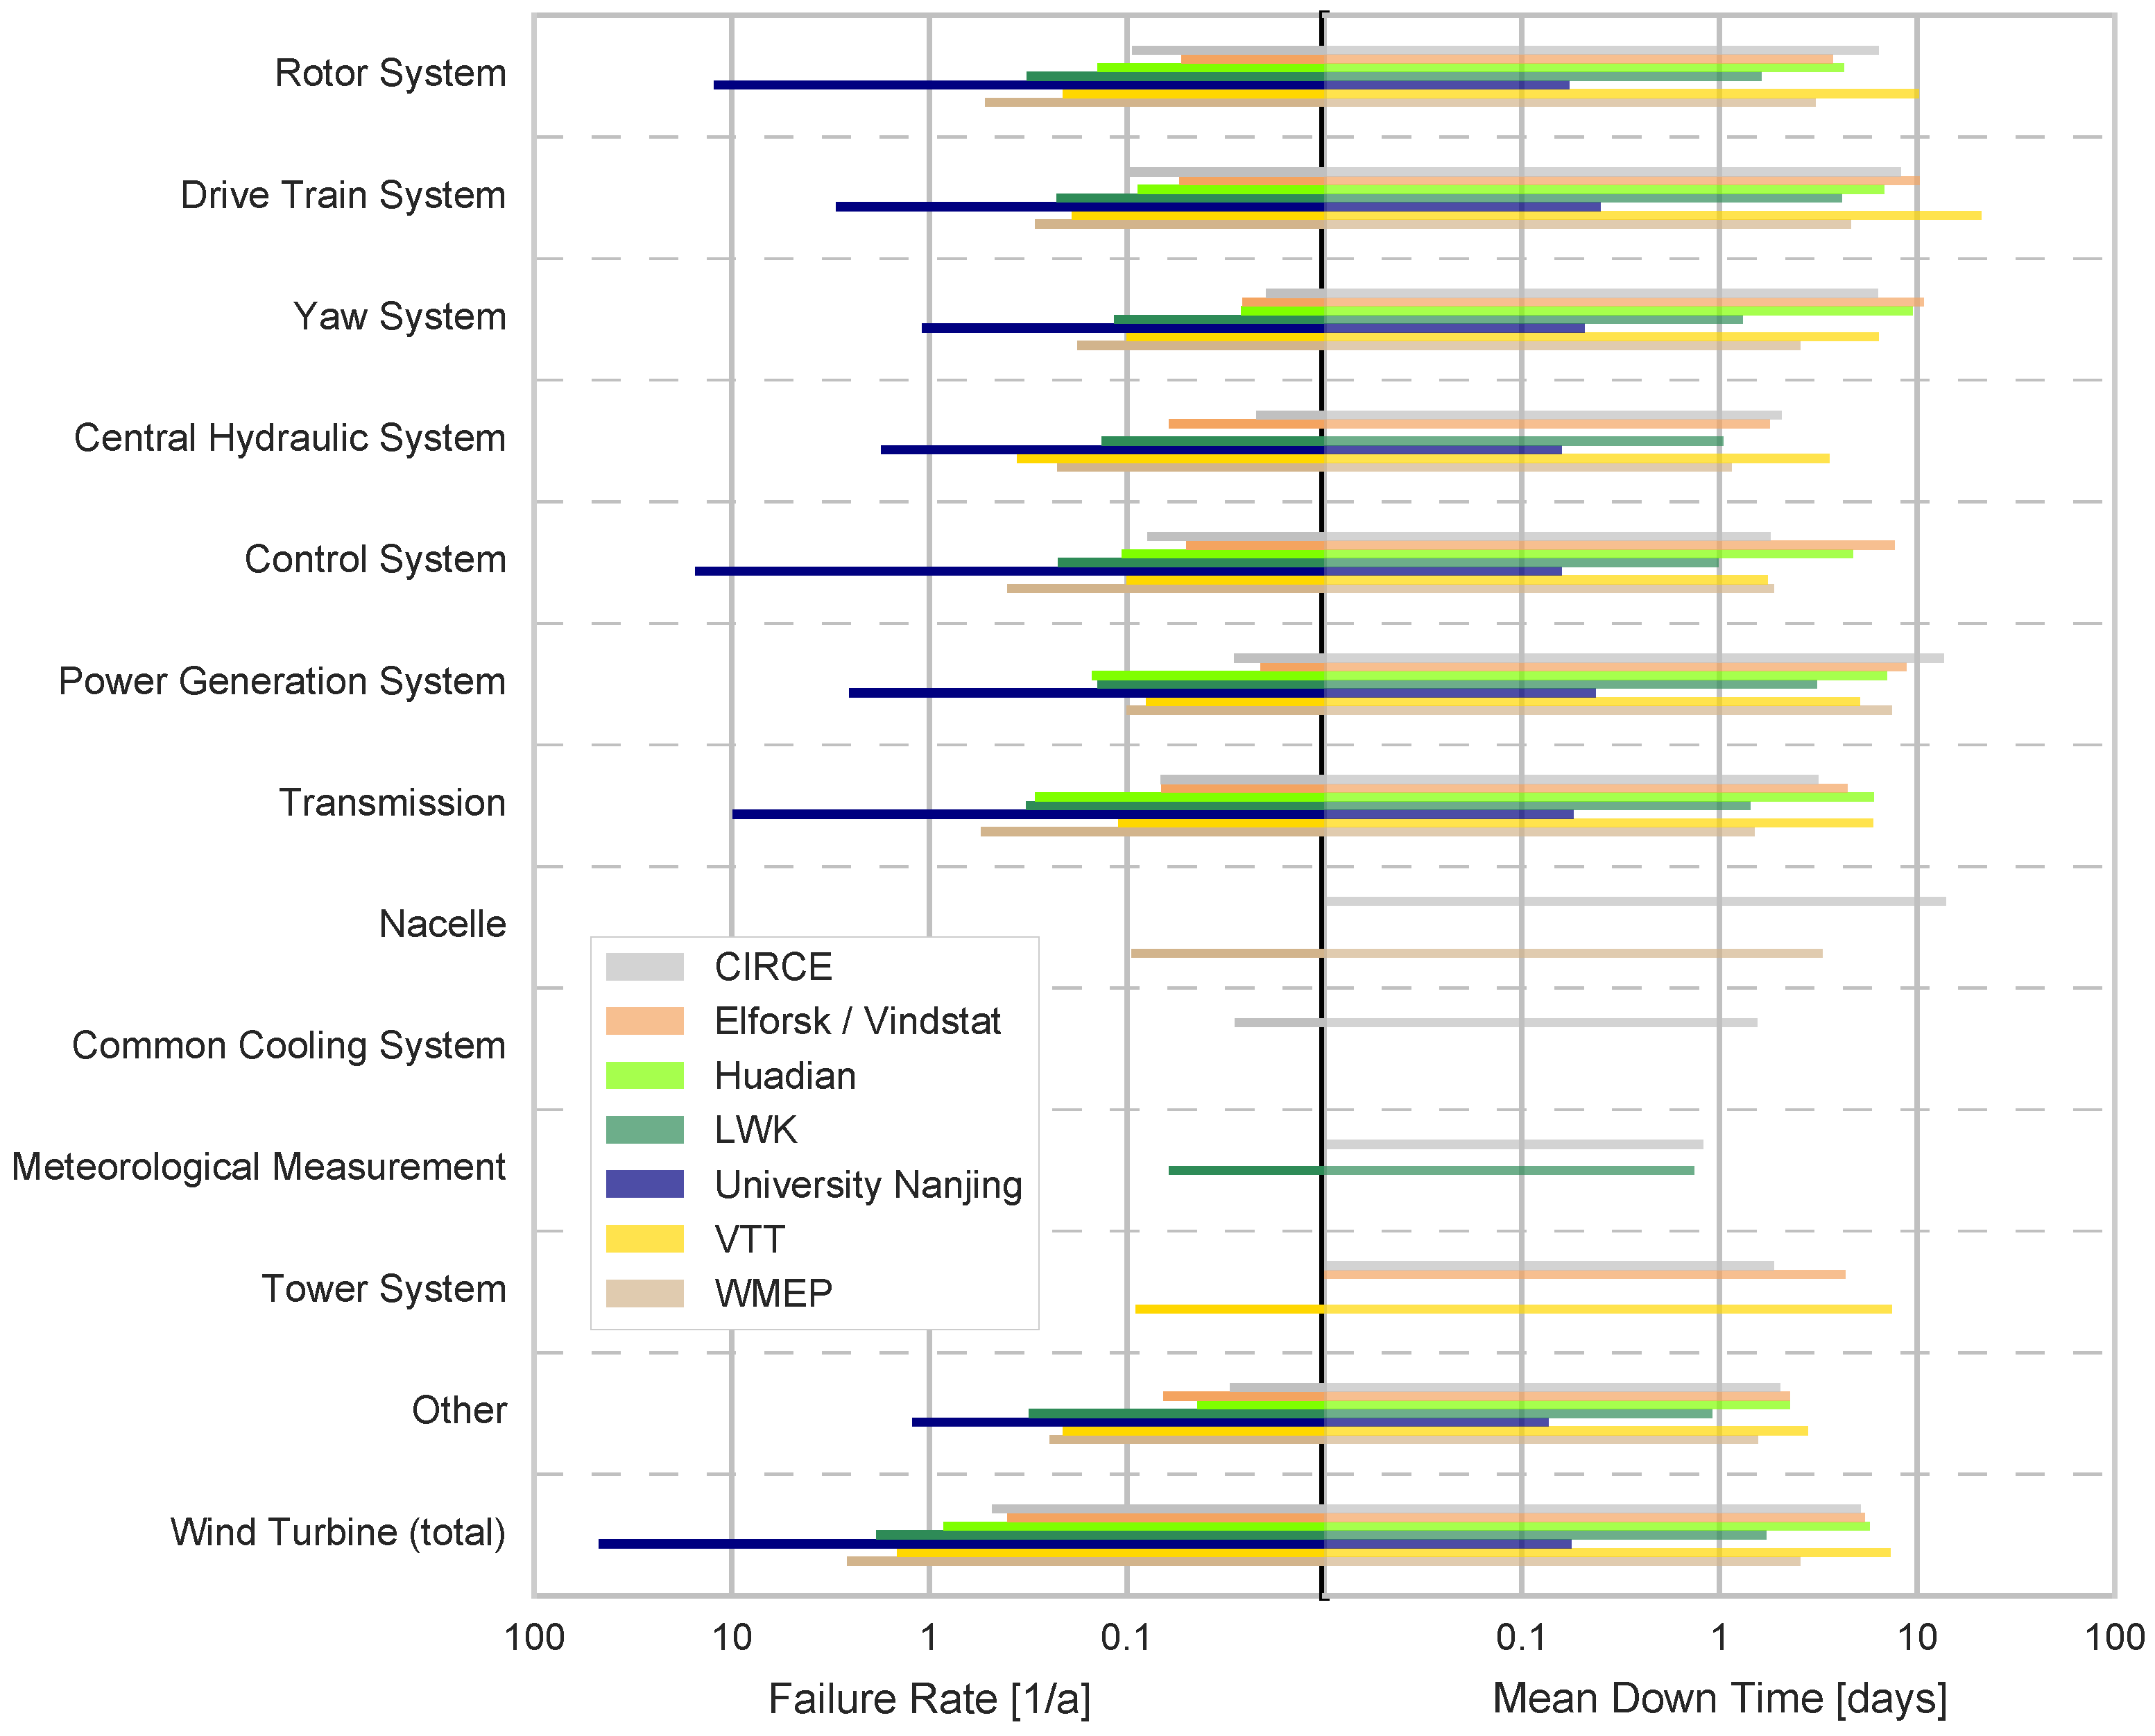
Figure 6 gives an overview on the results of those seven initiatives that provide information on both, failure rate and mean down time. The single results are discussed in Section 5.3 and Section 5.4. The figure shows the failure frequency (failures per WT and year) of the individual systems compared to the respective mean down time per failure. Additionally a cumulated value for the whole WT is displayed. Mean down times are weighted according to their occurrence. For reasons of presentation, both metrics are plotted logarithmically.
The high failure rate (46.9 failures per WT and year) of Southeast University Nanjing directly catches the readers attention and is more than 100 times as high as the lowest considered failure rate (0.4) of Elforsk/Vindstat. On the other hand it shows the lowest mean down time per failure (0.18 days per failure) which is just 3.3% of the Elforsk/Vindstat mean down time (5.42 days per failure). These differences are mainly due to the previously mentioned different sources and consideration of events of the single initiatives. Comparing the total yearly down time as the product of failure rate and mean down time, numbers vary between 2.2 and 10.6 days per year. Large differences exist, but taking the different approaches into account all values are within a reasonable range.
5.3. Failure Rate/Event Rate
Failure rates of 15 different Initiatives are listed in Table 4 and Table 5. Due to the large number of initiatives, the table has been sorted and split in alphabetical order. The tables provide failure rates on the main systems as well as on subsystems the authors considered to be relevant and of sufficient data quality. In this presentation, failure rates of main systems do not necessarily match the summed failure rate of the associated subsystems because in some cases a mapping to subsystems was not possible and some data was directly mapped to the main system.
As stated in Section 5.2, there are tremendous differences in the absolute failure rates of the single initiatives. To enable an easier comparison between the results, Figure 7 shows the failure rate per system normalized to the total failure rate of the corresponding initiative. Before taking a closer look on the single systems, it is important to note the high share of “Other” failures on the total failure rate. Especially Windstats-DK, SPARTA, EPRI and Strathclyde have a high share of more than 30% uncategorized failures. While Windstats-DK and SPARTA already used “other” as a category in their publications, EPRI and Strathclyde included categories that could not be matched to specific RDS-PP® categories as for example “Sensors” (EPRI) and “Pumps/Motors” (Strathclyde).
The “Rotor System” has in many cases the highest share on the failure rate which is mainly due to frequent failures of the “Pitch System”, see Table 4 and Table 5. Thus, the lower share of EPRI and Windstats-DK could be due to an old turbine portfolio including many stall turbines. “Transmission” and “Control System” are following closely and show high failure rates as well. This high share of electrical components supports similar results of Faulstich et al. [64] in a previous study.
Failure rates of onshore WT are provided by various initiatives. The selection of a preferred source should be based on the type of application. For the Chinese market all three initiatives, CWEA, Huadian and University Nanjing, can be of use. The failure definitions seem to be quite different but are not described in detail in the available publications. The most recent relevant publication on European (Spanish) onshore WT was published by CIRCE. A strict focus on internally caused component failures and the exclusion of unknown failures leads to low failure rates. To obtain a holistic view, it can be necessary to consider older initiatives like the WMEP. Publications on the US (EPRI) and Japan (NEDO) are outdated and should be at least supplemented by European results.
Regarding the reliability of offshore WT results are provided by SPARTA and Strathclyde, most likely having a partial overlap in the considered WT. While the results of Strathclyde are based on offshore WT from a single manufacturer and located all over Europe, SPARTA focuses on WF in the UK no matter which manufacturer. While failure rates of Strathclyde are based on a detailed failure definition, including only failures requiring a visit to a turbine and material usage outside regular maintenance, no failure definition is provided in the publication of SPARTA. Most of the big difference between the two initiatives is probably due to different definitions. Wherever information on failures as defined by Strathclyde are sufficient, this source should be preferred until further details are published by SPARTA. Still, both initiatives show high failure rates for offshore WT when compared to results of onshore WT. This finding is supported by results of the WInD-Pool initiative, even though no system specific results are available, event frequencies tend to be higher offshore than onshore [59].
5.4. Mean Down Time
Information on the mean down time per failure are provided by seven initiatives, all on onshore WT. All results on systems and subsystems are presented in Table 6. As for the failure rate, the presented subsystems are not a complete breakdown of the corresponding systems. In all cases of aggregation, a weighted average based on the failure rate is used. The mean down time per failure on the WT level strongly varies between 0.18 and 7.29 days per failure. This difference is mainly caused by diverse failure definitions and the resulting big differences in the failure rates as discussed in Section 5.3.
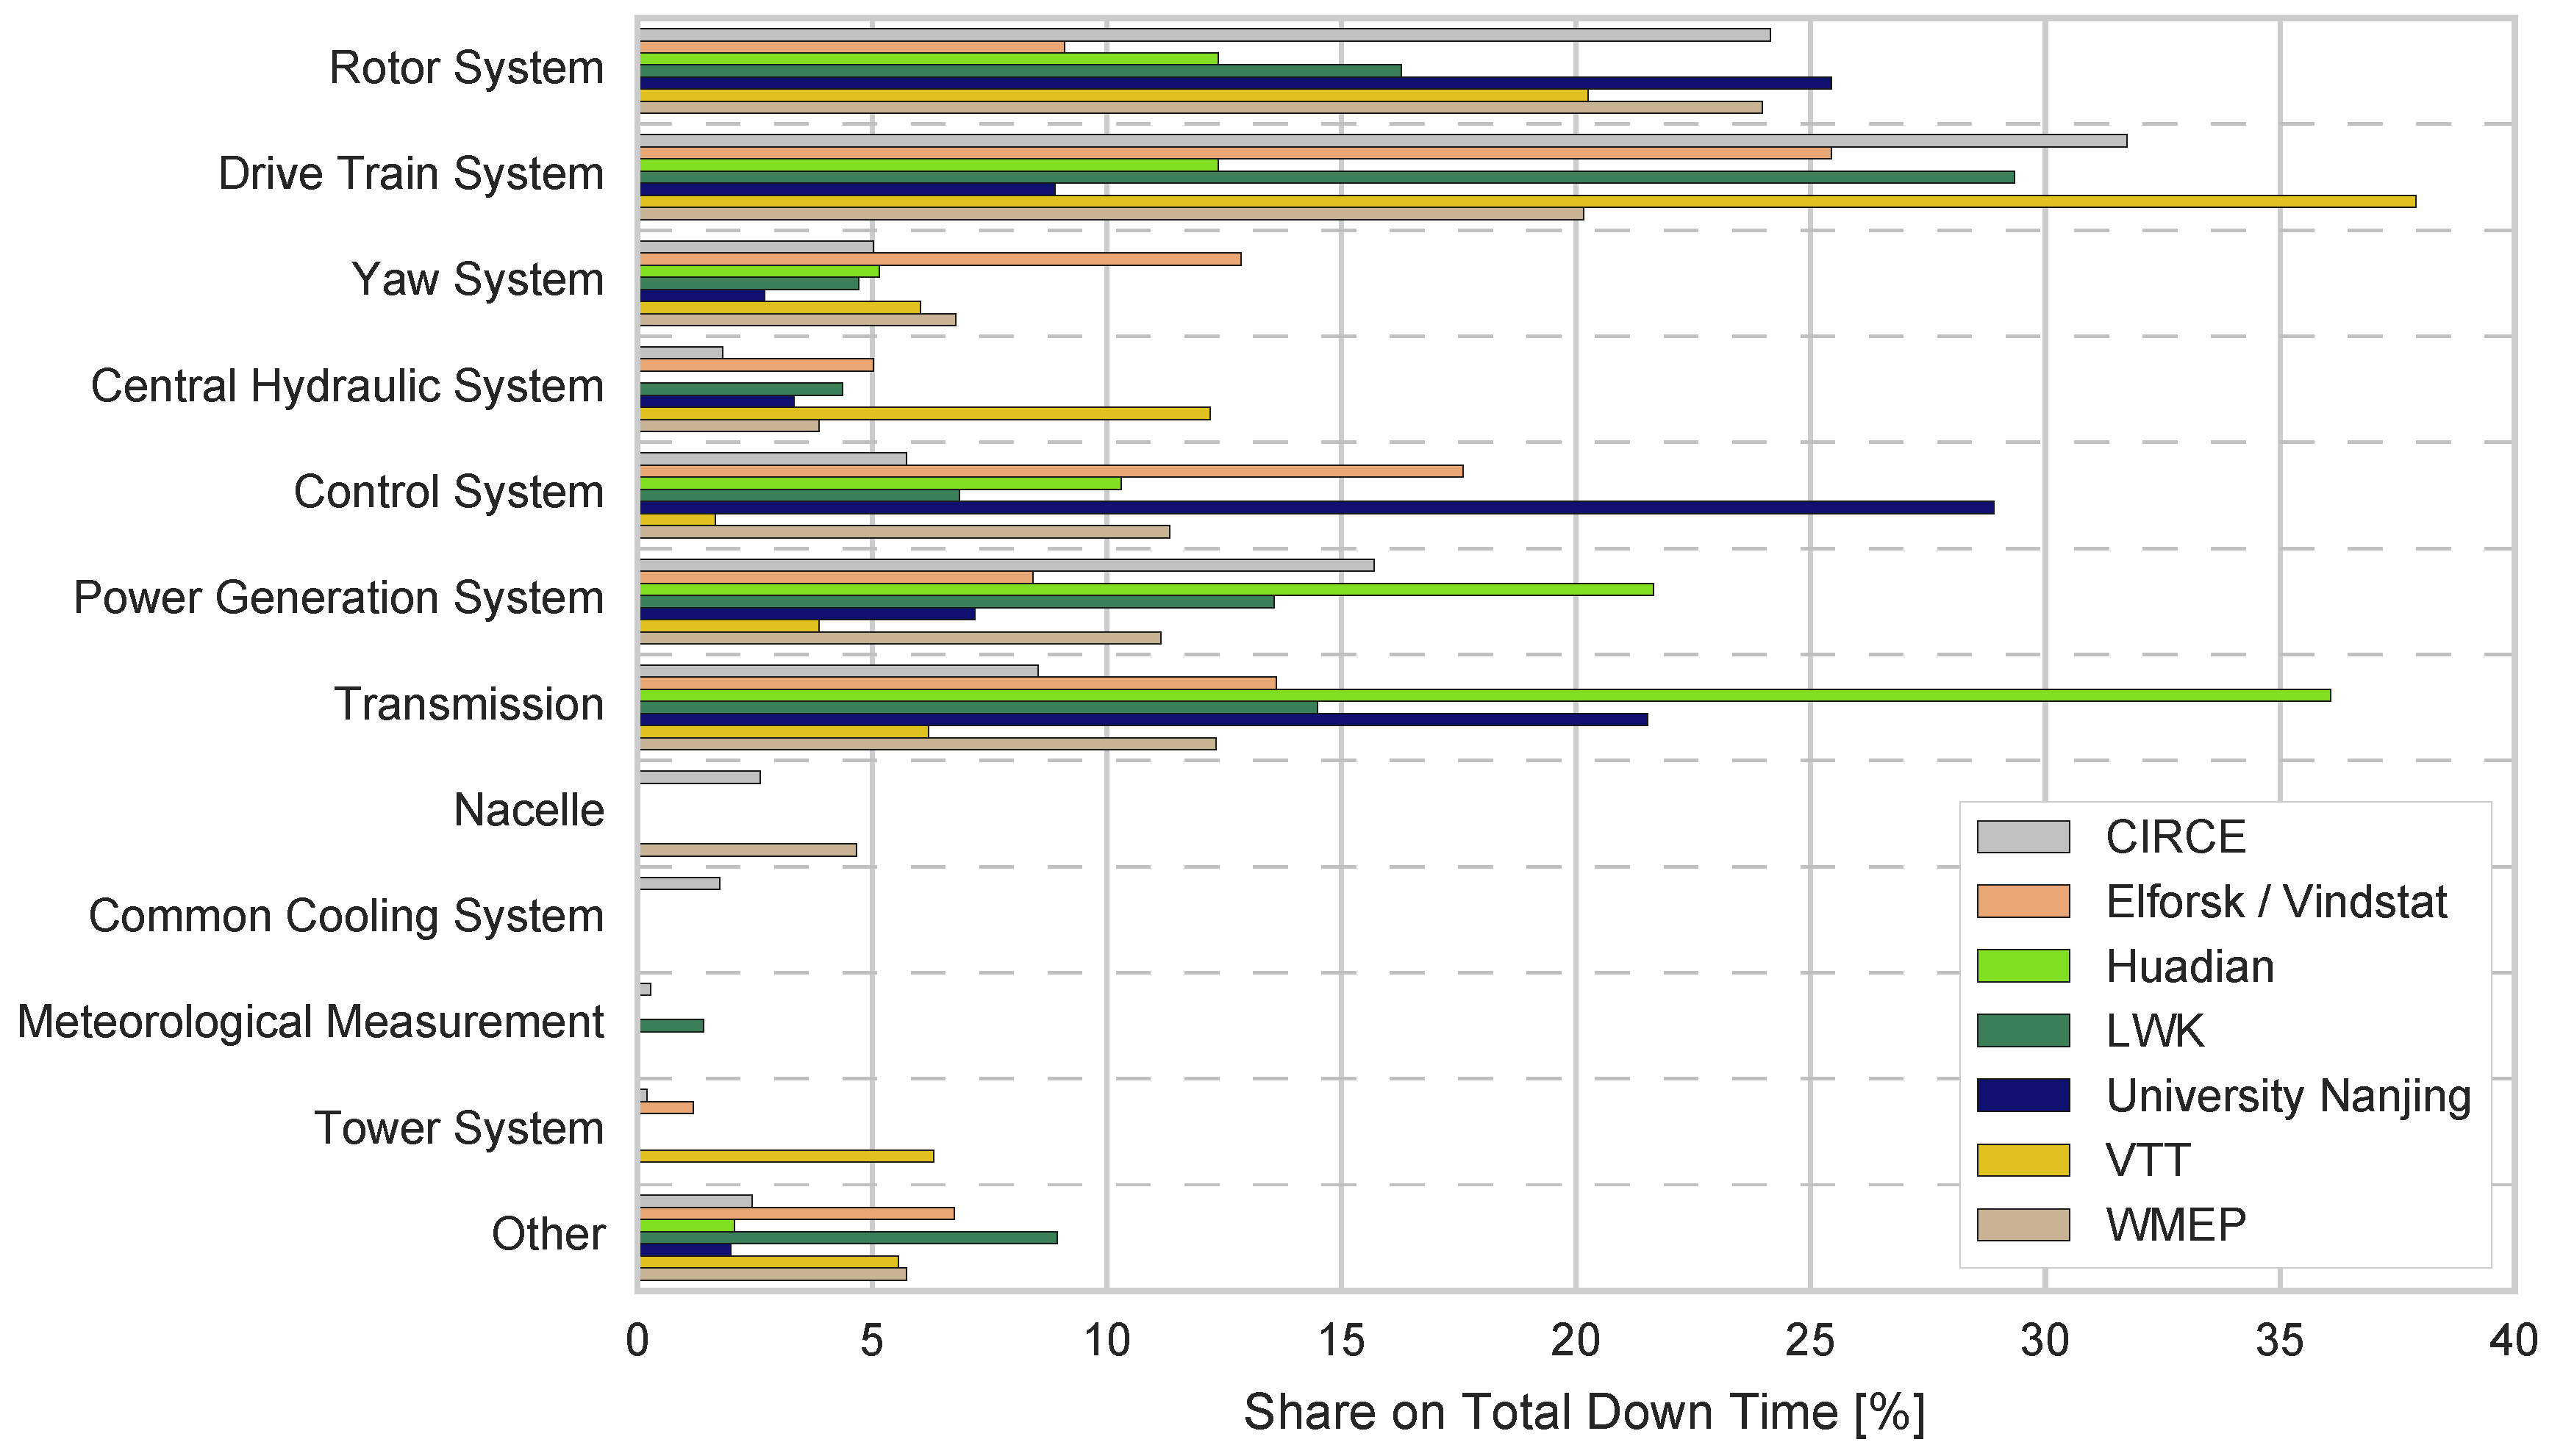
However, a comparison between initiatives can still be made by comparing the total annual down time per system with the total annual down time of the entire WT. Figure 8 shows the described share per system on the total down time of onshore WT and highlights the importance of single systems for the availability of WT. First point to be noted is the low importance of “Other” failures compared to its relevance regarding the failure rate. Of course, it needs to be mentioned that the initiatives with the largest share of “Other” failures in the failure rate do not provide any results on down times at all. Still, “Other” failures are underproportionally short. While failure rates of the “Drive Train System” did not stick out, this system is responsible for about a fourth of the total down time. This proves failures in the “Drive Train System” to be severe, as could be expected. Failures on electrical components (“Transmission”, “Control System”) show on the other hand a lower share than on the failure rate. Previous publications [57,69] based on single or selected data bases came to the same result.
As already stated in Section 5.3, CIRCE provides the latest results of high relevance for European WT and should be the preferred source for further applications. Depending on the application, the results can be supplemented by results of the WMEP.
6. Discussion
The present paper provides a comprehensive review of present and past initiatives gathering holistic information on O&M of WT. Future research can be based on the information collected and prepared for this paper. It can be of particular interest to prioritize or motivate future research work.
Results on the performance of WT can be considered to be reliable. There is no reason to doubt the comparison of capacity factors which shows a high location dependency. Offshore WT reach the highest capacity factors closely followed by onshore WT in the US. When it comes to availability, the situation is a bit more ambiguous. Publications lack detailed definitions of the availability calculation which weakens the significance of the comparison. Still, it should be easy to choose the right source for specific applications and basic statements can also be made. For example, the time of very low availability in offshore wind energy seems to be overcome.
Regarding the reliability of WT, results of 15 different initiatives are presented. Due to different approaches in the categorization of components and failures and the large resulting differences between the single initiatives, a comparison is hardly possible. Results of the initiatives were normalized to the total failure rate respectively the total yearly down time to enable at least basic insights. As discussed in Section 5.4, the drive train, despite its comparably low failure rate, has the largest share of down time while electrical components cause more failures but lower total down time. Several different actions are possible and under research on this specific point. Carroll et al. [54] evaluated different WT concepts (DFIG vs. PMG), different condition monitoring systems [70] are available or under research [71,72,73] to detect failures at an early stage and keep costs low. All presented failure rates can be of help to choose a suitable maintenance strategy [74] and to prioritize future research. In any case, users should choose their data source for further applications very carefully. Recommendations and descriptions of this paper can help you to do so.
Even though performance and reliability are reviewed independently in this paper, in reality they are of course not. On the one hand, low reliability leads to low availability which lowers the capacity factor. On the other hand, high capacity factors represent high wind speeds and higher mechanical and electrical loads leading to increased failure rates [75]. Higher failure rates at offshore locations support this assumption although many more factors have to be considered [76]. Still, a serious evaluation of the connection between wind speed and reliability requires a better comparability between the different initiative.
To enable comparability, future initiatives and publications should make use of standards and recommendations. Basic definitions for performance metrics are already existing for several years but especially when it comes to reliability characteristics, a uniform approach is indispensable. The publication of “Recommended Practices on Data Collection and Reliability Assessment” [15] in spring 2017 by IEA Wind was a milestone towards this goal. Thus it is likely to see improved results and better comparability in the future. WInD-Pool is a first initiative that follows these recommendations and uses RDS-PP® and ZEUS already during data collection.
Acknowledgments
The work on this article was made possible by two publicly funded projects. Initial literature review was carried out within work package seven of IRPWIND. The project has received funding from the European Union’s Seventh Programme for research, technological development and demonstration under grant agreement No. 609795. Further work was funded by the German Federal Ministry for Economic Affairs and Energy through the WInD-Pool (grant No. 0324031A) project. Costs to publish in open access where covered by the Fraunhofer-Gesellschaft.
Author Contributions
Sebastian Pfaffel, Stefan Faulstich and Kurt Rohrig designed the literature review and structure of the paper; Sebastian Pfaffel performed the literature review and analyzed the data; Sebastian Pfaffel and Stefan Faulstich wrote the paper
Conflicts of Interest
The authors declare no conflict of interest.
Abbreviations
The following abbreviations are used in this manuscript:
| Failure Rate | |
| Time-based Availability | |
| Atech | Technical Availability |
| Energetic Availability | |
| BOP | Balance-Of-Plant |
| CF | Capacity Factor |
| CREW | Continuous Reliability Enhancements for Wind |
| CWEA | Chinese Wind Energy Association |
| EPRI | Electric Power Research Institute |
| FGW e.V. | Fördergesellschaft Windenergie und andere Dezentrale Energien |
| GW | Gigawatts |
| IEA | International Energy Agency |
| IEC | International Electrotechnical Commission |
| ISO | International Organization for Standardization |
| KPI | Key Performance Indicators |
| kW | kilowatt |
| LCOE | Levelized Cost of Energy |
| LWK | Chamber of Agriculture |
| MDT | Mean Down Time |
| MOTBF | Mean Operating Time Between Failures |
| MTBF | Mean Time Between Failures |
| MTTF | Mean Time To Failures |
| MTTR | Mean Time To Repair |
| MUT | Mean Up Time |
| MW | Megawatt |
| NEDO | New Energy Industrial Technology Development Organization |
| O&M | Operation and Maintenance |
| Average Power Output | |
| Rated Power | |
| RDS-PP® | Reference Designation System for Power Plants |
| SPARTA | System Performance, Availability and Reliability Trend Analysis |
| SCADA | Supervisory Control and Data Acquisition |
| Available Time | |
| Unavailable Time | |
| Average Actual Power Output | |
| Average Potential Power Output | |
| WT | Wind Turbine |
| WF | Wind Farm |
| WMEP | Wissenschaftliches Mess- und Evaluierungsprogramm |
| ZEUS | Stat-Event-Cause-System |
References
- World Wind Energy Association (WWEA). World Wind Market Has Reached 486 GW from Where 54 GW Has Been Installed Last Year; World Wind Energy Association: Bonn, Germany, 2017. [Google Scholar]
- Lüers, S.; Wallasch, A.K.; Rehfeldt, K. Kostensituation der Windenergie an Land in Deutschland: Update. 2015. Available online: http://publikationen.windindustrie-in-deutschland.de/kostensituation-der-windenergie-an-land-in-deutschland-update/54882668 (accessed on 26 June 2017).
- Hobohm, J.; Krampe, L.; Peter, F.; Gerken, A.; Heinrich, P.; Richter, M. Kostensenkungspotenziale der Offshore-Windenergie in Deutschland: Kurzfassung; Fichtner: Stuttgart, Germany, 2015. [Google Scholar]
- Arwas, P.; Charlesworth, D.; Clark, D.; Clay, R.; Craft, G.; Donaldson, I.; Dunlop, A.; Fox, A.; Howard, R.; Lloyd, C.; et al. Offshore Wind Cost Reduction: Pathways Study; The Crown Estate: London, UK, 2012. [Google Scholar]
- Astolfi, D.; Castellani, F.; Garinei, A.; Terzi, L. Data mining techniques for performance analysis of onshore wind farms. Appl. Energy 2015, 148, 220–233. [Google Scholar] [CrossRef]
- Jia, X.; Jin, C.; Buzza, M.; Wang, W.; Lee, J. Wind turbine performance degradation assessment based on a novel similarity metric for machine performance curves. Renew. Energy 2016, 99, 1191–1201. [Google Scholar] [CrossRef]
- Dienst, S.; Beseler, J. Automatic anomaly detection in offshore wind SCADA data. In Proceedings of the WindEurope Summit 2016, Hamburg, Germany, 27–29 September 2016. [Google Scholar]
- International Electrotechnical Commission. Production Based Availability for Wind Turbines; International Electrotechnical Commission: Geneva, Switzerland, 2013. [Google Scholar]
- Burton, T.; Jenkins, N.; Sharpe, D.; Bossanyi, E. Wind Energy Handbook, 2nd ed.; John Wiley & Sons: Hoboken, NJ, USA, 2011. [Google Scholar]
- International Electrotechnical Commission. Time Based Availability for Wind Turbines (IEC 61400-26-1); International Electrotechnical Commission: Geneva, Switzerland, 2010. [Google Scholar]
- International Organization for Standardization. Petroleum, Petrochemical and Natural Gas Industries—Collection and Exchange of Reliability and Maintenance Data for Equipment (ISO 14224:2016); International Organization for Standardization: Geneva, Switzerland, 2016. [Google Scholar]
- International Organization for Standardization. Petroleum, Petrochemical and Natural Gas Industries—Reliability Modelling and Calculation of Safety Systems (ISO/TR 12489); International Organization for Standardization: Geneva, Switzerland, 2013. [Google Scholar]
- Deutsche Elektrotechnische Kommission. Internationales Elektrotechnisches Wörterbuch: Deutsch-Englisch-Französisch-Russisch = International Electrotechnical Vocabulary, 1st ed.; Beuth: Berlin, Germany, 2000. [Google Scholar]
- DIN Deutsches Institut für Normung e.V. Instandhaltung—Begriffe der Instandhaltung (DIN EN 13306); DIN Deutsches Institut für Normung: Berlin, Germany, 2010. [Google Scholar]
- Hahn, B. Wind Farm Data Collection and Reliability Assessment for O&M Optimization: Expert Group Report on Recommended Practices, 1st ed.; Fraunhofer Institute for Wind Energy and Energy System Technology—IWES: Kassel, Germany, 2017. [Google Scholar]
- IEA WIND TASK 33. Reliability Data Standardization of Data Collection for Wind Turbine Reliability and Operation & Maintenance Analyses: Initiatives Concerning Reliability Data (2nd Release), Unpublished report. 2013.
- Sheng, S. Report on Wind Turbine Subsystem Reliability—A Survey of Various Databases; National Renewable Energy Laboratory: Golden, CO, USA, 2013.
- Pettersson, L.; Andersson, J.-O.; Orbert, C.; Skagerman, S. RAMS-Database for Wind Turbines: Pre-Study. Elforsk Report 10:67. 2010. Available online: http://www.elforsk.se/Programomraden/El--Varme/Rapporter/?download=reportrid=10_67_ (accessed on 8 February 2016).
- Branner, K.; Ghadirian, A. Database about Blade Faults: DTU Wind Energy Report E-0067; Technical University of Denmark: Lyngby, Denmark, 2014. [Google Scholar]
- Pinar Pérez, J.M.; García Márquez, F.P.; Tobias, A.; Papaelias, M. Wind turbine reliability analysis. Renew. Sustain. Energy Rev. 2013, 23, 463–472. [Google Scholar] [CrossRef]
- Ribrant, J. Reliability Performance and Maintenance—A Survey of Failures In Wind Power Systems; KTH School of Electrical Engineering: Stockholm, Sweden, 2006. [Google Scholar]
- Greensolver, SASU. Greensolver Index: An Innovatice Benchmark solution to improve your wind and solar assets performance. Available online: http://greensolver.net/en/ (accessed on 10 June 2017).
- Wind Energy Benchmarking Services Limited. Webs: Wind Energy Benchmarking Services. Available online: https://www.webs-ltd.com (accessed on 11 June 2017).
- Sheng, S. Wind Turbine Gearbox Reliability Database: Condition Monitoring, and Operation and Maintenance Research Update; National Renewable Energy Laboratory: Golden, CO, USA, 2016.
- Blade Reliability Collaborative: Reliability, Operations & Maintenance, and Standard; Sandia National Laboratories: Albuquerque, NM, USA, 2017.
- Reder, M.D.; Gonzalez, E.; Melero, J.J. Wind turbine failures—Tackling current problems in failure data analysis. J. Phys. Conf. Ser. 2016, 753, 072027. [Google Scholar] [CrossRef]
- Gonzalez, E.; Reder, M.; Melero, J.J. SCADA alarms processing for wind turbine component failure detection. J. Phys. Conf. Ser. 2016, 753, 072019. [Google Scholar] [CrossRef]
- Peters, V.; McKenney, B.; Ogilvie, A.; Bond, C. Continuous Reliability Enhancement for Wind (CREW) Database: Wind Turbine Reliability Benchmark U.S. Fleet; Public Report October 2011; Sandia National Laboratories: Albuquerque, NM, USA, 2011.
- Hines, V.; Ogilvie, A.; Bond, C. Continuous Reliability Enhancement for Wind (CREW) Database: Wind Plant Reliability Benchmark; Sandia National Laboratories: Albuquerque, NM, USA, 2013.
- Carter, C.; Karlson, B.; Martin, S.; Westergaard, C. Continuous Reliability Enhancement for Wind (CREW): Program Update: SAND2016-3844; Sandia National Laboratories: Albuquerque, NM, USA, 2016.
- Lin, Y.; Le, T.; Liu, H.; Li, W. Fault analysis of wind turbines in China. Renew. Sustain. Energy Rev. 2016, 55, 482–490. [Google Scholar] [CrossRef]
- Carlstedt, N.E. Driftuppföljning av Vindkraftverk: Arsrapport 2012: >50 kW. 2013; Available online: http://www.vindstat.nu/stat/Reports/arsrapp2012.pdf (accessed on 27 August 2017).
- Ribrant, J.; Bertling, L. Survey of failures in wind power systems with focus on Swedish wind power plants during 1997–2005. In Proceedings of the 2007 IEEE Power Engineering Society General Meeting, Tampa, FL, USA, 24–28 June 2007; pp. 1–8. [Google Scholar]
- Carlsson, F.; Eriksson, E.; Dahlberg, M. Damage Preventing Measures for Wind Turbines: Phase 1—Reliability Data. Elforks Report 10:68. 2010. Available online: http://www.elforsk.se/Programomraden/El--Varme/Rapporter/?download=reportrid=10_68_ (accessed on 8 February 2016).
- Estimation of Turbine Reliability Figures within the DOWEC Project. 2002. Available online: https://www.ecn.nl/fileadmin/ecn/units/wind/docs/dowec/10048_004.pdf (accessed on 9 February 2016).
- Schmid, J.; Klein, H.P. Performance of European Wind Turbines: A Statistical Evaluation from the European Wind Turbine Database EUROWIN; Elsevier Applied Science: London, UK; New York, NY, USA, 1991. [Google Scholar]
- Schmid, J.; Klein, H. EUROWIN. The European Windturbine Database. Annual Reports. A Statistical Summary of European WEC Performance Data for 1992 and 19932; Fraunhofer Institute for Solar Energy Systems: Freiburg, Germany, 1994. [Google Scholar]
- Harman, K.; Walker, R.; Wilkinson, M. Availability trends observed at operational wind farms. In Proceedings of the European Wind Energy Conference, Brussels, Belgium, 31 March–3 April 2008. [Google Scholar]
- Chai, J.; An, G.; Ma, Z.; Sun, X. A study of fault statistical analysis and maintenance policy of wind turbine system. In International Conference on Renewable Power Generation (RPG 2015); Institution of Engineering and Technology: Stevenage, UK, 2015; p. 4. [Google Scholar]
- Tavner, P.; Spinato, F. Reliability of different wind turbine concepts with relevance to offshore application. In Proceedings of the European Wind Energy Conference, Brussels, Belgium, 31 March–3 April 2008. [Google Scholar]
- Lynette, R. Status of the U.S. wind power industry. J. Wind Eng. Ind. Aerodyn. 1988, 27, 327–336. [Google Scholar] [CrossRef]
- Koutoulakos, E. Wind Turbine Reliability Characteristics and Offshore Availability Assessment. Master’s Thesis, TU Delft, Delft, The Netherlands, 2010. [Google Scholar]
- Uzunoglu, B.; Amoiralis, F.; Kaidis, C. Wind turbine reliability estimation for different assemblies and failure severity categories. IET Renew. Power Gener. 2015, 9, 892–899. [Google Scholar]
- Herbert, G.J.; Iniyan, S.; Goic, R. Performance, reliability and failure analysis of wind farm in a developing Country. Renew. Energy 2010, 35, 2739–2751. [Google Scholar] [CrossRef]
- Commitee for Increase in Availability/Capacity Factor of Wind Turbine Generator System and Failure/Breakdown Investigation of Wind Turbine Generator Systems Subcommittee; Summary Report; New Energy Industrial Technology Development Organization: Kanagawa, Japan, 2004.
- Gayo, J.B. Final Publishable Summary of Results of Project ReliaWind; Gamesa Innovation and Technology: Egues, Spain, 2011. [Google Scholar]
- Wilkinson, M. Measuring Wind Turbine Reliability—Measuring Wind Turbine Reliability Results of the Reliawind Project; WindEurope: Brussels, Belgium, 2011. [Google Scholar]
- Andrawus, J.A. Maintenance Optimisation for Wind Turbines; Robert Gordon University: Aberdeen, UK, 2008. [Google Scholar]
- Feng, Y.; Tavner, P.J.; Long, H. Early experiences with UK round 1 offshore wind farms. Proc. Inst. Civ. Eng. Energy 2010, 163, 167–181. [Google Scholar] [CrossRef] [Green Version]
- Su, C.; Yang, Y.; Wang, X.; Hu, Z. Failures analysis of wind turbines: Case study of a Chinese wind farm. In Proceedings of the 2016 Prognostics and System Health Management Conference (PHM-Chengdu), Chengdu, China, 19–21 October 2016; pp. 1–6. [Google Scholar]
- Portfolio Review 2016; System Performance, Availability and Reliability Trend Analysis (SPARTA): Northumberland, UK, 2016.
- Carroll, J.; McDonald, A.; McMillan, D. Failure rate, repair time and unscheduled O&M cost analysis of offshore wind turbines. Wind Energy 2015, 19, 1107–1119. [Google Scholar] [Green Version]
- Carroll, J.; McDonald, A.; Dinwoodie, I.; McMillan, D.; Revie, M.; Lazakis, I. Availability, operation and maintenance costs of offshore wind turbines with different drive train configurations. Wind Energy 2017, 20, 361–378. [Google Scholar] [CrossRef]
- Carroll, J.; McDonald, A.; McMillan, D. Reliability comparison of wind turbines with DFIG and PMG drive trains. IEEE Trans. Energy Convers. 2015, 30, 663–670. [Google Scholar] [CrossRef]
- Stenberg, A. Analys av Vindkraftsstatistik i Finland. 2010. Available online: http://www.vtt.fi/files/projects/windenergystatistics/diplomarbete.pdf (accessed on 22 February 2016).
- Turkia, V.; Holtinnen, H. Tuulivoiman Tuotantotilastot: Vuosiraportti 2011; VTT Technical Research Centre of Finland: Espoo, Finland, 2013. [Google Scholar]
- Tavner, P.J.; Xiang, J.; Spinato, F. Reliability analysis for wind turbines. Wind Energy 2007, 10, 1–18. [Google Scholar] [CrossRef]
- Fraunhofer IWES. The WInD-Pool: Complex Systems Require New Strategies and Methods; Fraunhofer IWES: Munich, Germany, 2017. [Google Scholar]
- Stefan, F.; Sebastian, P.; Berthold, H. Performance and reliability benchmarking using the cross-company initiative WInD-pool. In Proceedings of the RAVE Offshore Wind R&D Conference, Bremerhaven, Germany, 14 October 2015. [Google Scholar]
- Pfaffel, S.; Faulstich, S.; Hahn, B.; Hirsch, J.; Berkhout, V.; Jung, H. Monitoring and Evaluation Program for Offshore Wind Energy Use—1. Implementation Phase; Fraunhofer-Institut für Windenergie und Energiesystemtechnik: Kassel, Germany, 2016. [Google Scholar]
- Jung, H.; Pfaffel, S.; Faulstich, S.; Bübl, F.; Jensen, J.; Jugelt, R. Abschlussbericht: Erhöhung der Verfügbarkeit von Windenergieanlagen EVW-Phase 2; FGW eV Wind Energy and Other Decentralized Energy Organizations: Berlin, Germany, 2015. [Google Scholar]
- Faulstich, S.; Durstewitz, M.; Hahn, B.; Knorr, K.; Rohrig, K. Windenergy Report Germany 2008: Written within the Research Project Deutscher Windmonitor; German Federal Ministry for the Environment Nature Conversation and Nuclear Safety: Bonn, Germany, 2009. [Google Scholar]
- Echavarria, E.; Hahn, B.; van Bussel, G.J.W.; Tomiyama, T. Reliability of wind turbine technology through time. J. Sol. Energy Eng. 2008, 130, 031005. [Google Scholar] [CrossRef]
- Faulstich, S.; Lyding, P.; Hahn, B. Component reliability ranking with respect to WT concept and external environmental conditions: Deliverable WP7.3.3, WP7 Condition monitoring: Project UpWind “Integrated Wind Turbine Design”. 2010. Available online: https://www.researchgate.net/publication/321148748_Integrated_Wind_Turbine_Design_Component_reliability_ranking_with_respect_to_WT_concept_and_external_environmental_conditions_Deliverable_WP733_WP7_Condition_monitoring (accessed on 15 June 2017).
- Berkhout, V.; Bergmann, D.; Cernusko, R.; Durstewitz, M.; Faulstich, S.; Gerhard, N.; Großmann, J.; Hahn, B.; Hartung, M.; Härtel, P.; et al. Windenergie Report Deutschland 2016; Fraunhofer: Munich, Germany, 2017. [Google Scholar]
- VGB PoweTech e.V. VGB-Standard RDS-PP: Application Guideline Part 32: Wind Power Plants: VGB-S823-32-2014-03-EN-DE; Verlag Technisch-Wissenschaftlicher Schriften: Essen, Germany, 2014. [Google Scholar]
- GADS Wind Turbine Generation: Data Reporting Instructions: Effective January 2010; NERC: Atlanta, GA, USA, 2010.
- FGW. Technische Richtlinie für Energieanlagen Teil 7: Betrieb und Instandhaltung von Kraftwerken für Erneuerbare Energien Rubrik D2: Zustands-Ereignis-Ursachen-Schlüssel für Erzeugungseinheiten (ZEUS); FGW eV Wind Energy and Other Decentralized Energy Organizations: Berlin, Germany, 2014. [Google Scholar]
- Faulstich, S.; Hahn, B.; Tavner, P.J. Wind turbine downtime and its importance for offshore deployment. Wind Energy 2011, 14, 327–337. [Google Scholar] [CrossRef]
- Giebhardt, J. Wind turbine condition monitoring systems and techniques. In Wind Energy Systems; Elsevier: Amsterdam, The Netherlands, 2011; pp. 329–349. [Google Scholar]
- Sheng, S. Wind Turbine Gearbox Condition Monitoring Round Robin Study—Vibration Analysis: Technical Report NREL/TP-5000-54530; National Renewable Energy Laboratory: Golden, CO, USA, 2012.
- Yang, W.; Tavner, P.J.; Crabtree, C.J.; Feng, Y.; Qiu, Y. Wind turbine condition monitoring: Technical and commercial challenges. Wind Energy 2014, 17, 673–693. [Google Scholar] [CrossRef] [Green Version]
- Kusiak, A.; Zhang, Z.; Verma, A. Prediction, operations, and condition monitoring in wind energy. Energy 2013, 60, 1–12. [Google Scholar] [CrossRef]
- Puglia, G.; Bangalore, P.; Tjernberg, L.B. Cost efficient maintenance strategies for wind power systems using LCC. In Proceedings of the 2014 International Conference on Probabilistic Methods Applied to Power Systems (PMAPS), Durham, UK, 7–10 July 2014; pp. 1–6. [Google Scholar]
- Xie, K.; Jiang, Z.; Li, W. Effect of wind speed on wind turbine power converter reliability. IEEE Trans. Energy Convers. 2012, 27, 96–104. [Google Scholar] [CrossRef]
- Van Bussel, G.J.W. Offshore wind energy, the reliability dilemma. In Proceedings of the First World Wind Energy Conference, Berlin, Germany, 2–6 July 2002. [Google Scholar]
Figure 1.
Possible architectures to gather and analyze cross-company performance and reliability data.
Figure 1.
Possible architectures to gather and analyze cross-company performance and reliability data.

Figure 2.
Capacity factors of onshore and offshore WT as published by different initiatives.

Figure 3.
Availability of onshore WT as published by different initiatives.

Figure 4.
Availability of offshore WT as published by different initiatives.

Figure 5.
System structure of a WT according to the Reference Designation System for Power Plants (RDS-PP®) published by VGB PowerTech [66]. The figure does not provide a complete overview on the system structure but highlights the most important systems considered in this paper.
Figure 5.
System structure of a WT according to the Reference Designation System for Power Plants (RDS-PP®) published by VGB PowerTech [66]. The figure does not provide a complete overview on the system structure but highlights the most important systems considered in this paper.

Figure 6.
Overview on failure rate and mean down time per WT as published by different initiatives.

Figure 7.
Normalized failure rates per system as published by different initiatives.
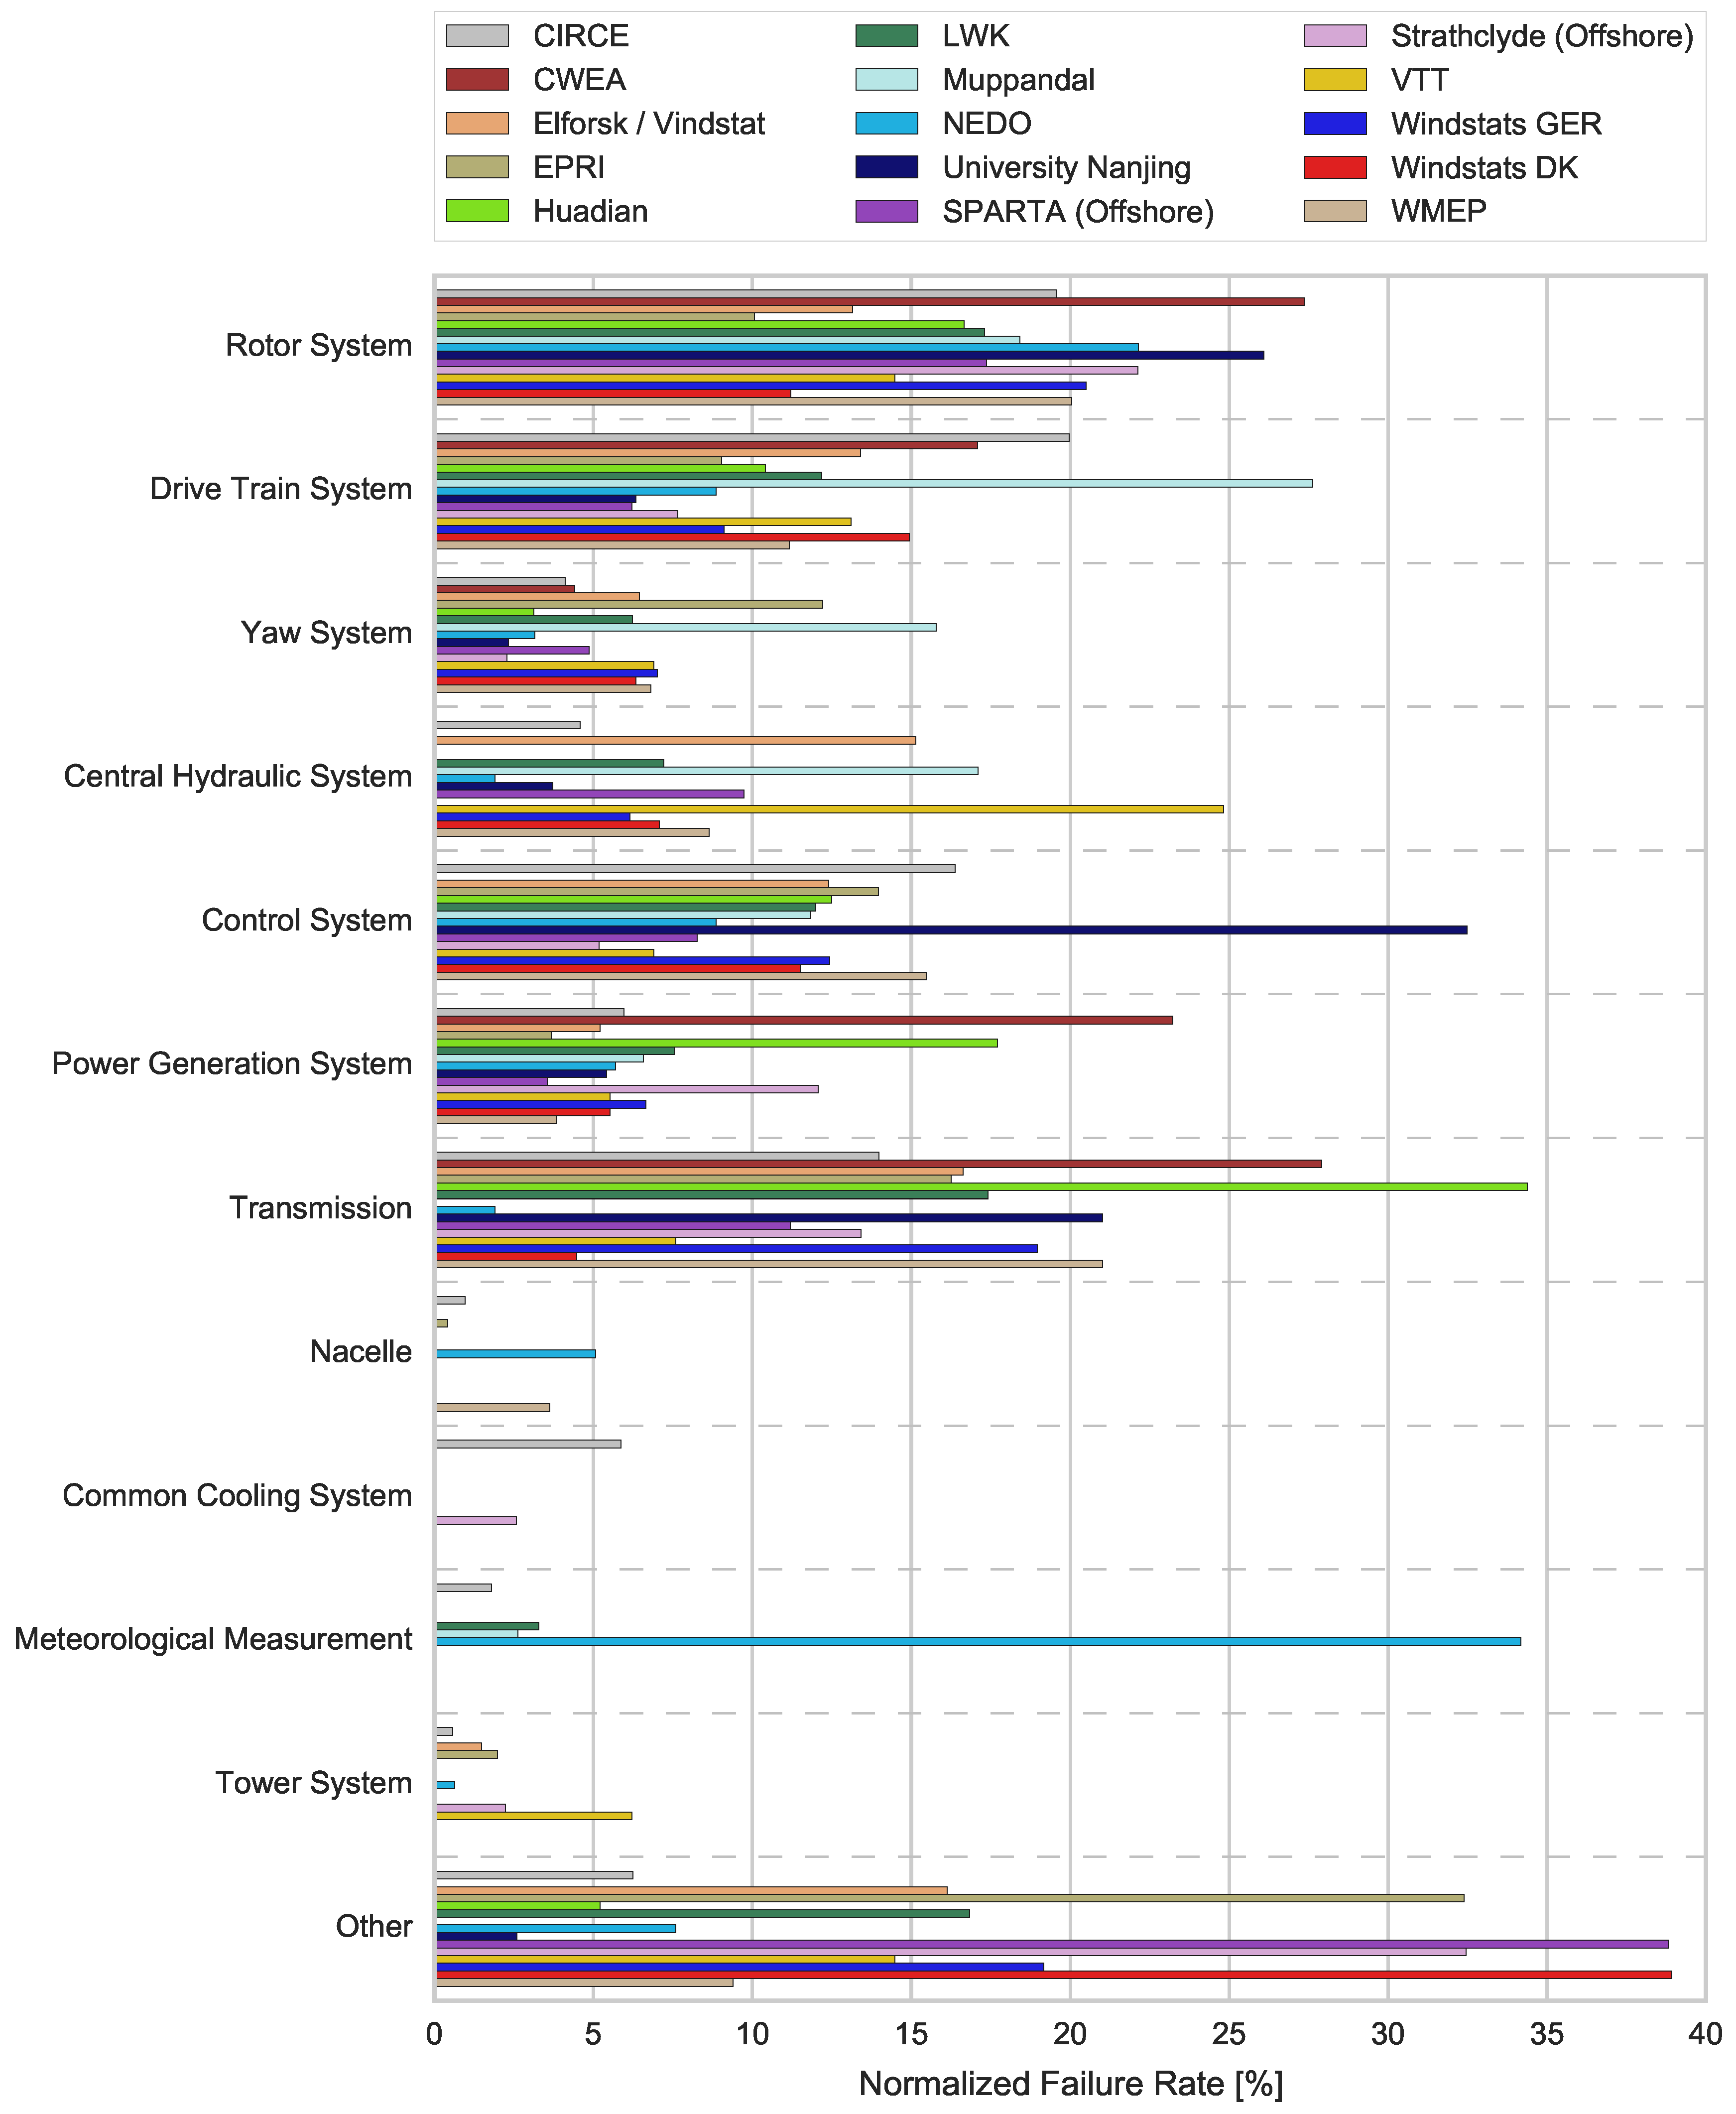
Figure 8.
Share on total down time per system of onshore WT as published by different initiatives.


Table 1.
Past and ongoing initiatives collecting and analyzing data regarding performance and reliability of wind turbines (WT).
Table 1.
Past and ongoing initiatives collecting and analyzing data regarding performance and reliability of wind turbines (WT).
| Initiative | Country | Number of WT | Onshore | Offshore | Operational Turbine Years | Start-Up of Survey | End of Survey | Source |
|---|---|---|---|---|---|---|---|---|
| CIRCE | Spain | 4300 | ✓ | ~13,000 | ~3 years (about 2013) | [26,27] | ||
| CREW-Database | USA | ~900 | ✓ | ~1800 | 2011 | ongoing | [16,28,29,30] | |
| CWEA-Database | China | ? (640 WF) | ✓ | ? | 2010 | 2012 | [31] | |
| Elforsk/Vindstat | Sweden | 786 | ✓ | ~3100 | 1989 | 2005 | [32,33,34] | |
| EPRI | USA | 290 | ✓ | ~580 | 1986 | 1987 | [35] | |
| EUROWIN | Europe | ~3500 | ✓ | ? | 1986 | ~1995 | [36,37] | |
| Garrad Hassan | Worldwide | ? (14,000 MW) | ✓ | ? | ~1992 | ~2007 | [38] | |
| Huadian | China | 1313 | ✓ | 547 | 01/2012 | 05/2012 | [39] | |
| LWK | Germany | 643 | ✓ | >6000 | 1993 | 2006 | [16,40] | |
| Lynette | USA | ? | ✓ | ? | 1981 | 1986 | [41,42] | |
| MECAL | Netherlands | 63 | ✓ | 122 | ~2 years (about 2010) | [43] | ||
| Muppandal | India | 15 | ✓ | 75 | 2000 | 2004 | [44] | |
| NEDO | Japan | 924 | ✓ | 924 | 2004 | 2005 | [45] | |
| ReliaWind | Europe | 350 | ✓ | ? | 2008 | 2010 | [46,47] | |
| Robert Gordon University | UK | 77 | ✓ | ~460 | 1997 | 2006 | [48] | |
| Round 1 offshore WF | UK | 120 | ✓ | 270 | 2004 | 2007 | [49] | |
| University Nanjing | China | 108 | ✓ | ~330 | 2009 | 2013 | [50] | |
| SPARTA | UK | 1045 | ✓ | 1045 | 2013 | ongoing | [51] | |
| Strathclyde | UK | 350 | ✓ | 1768 | 5 years (about 2010) | [52,53,54] | ||
| VTT | Finland | 96 | ✓ | 356 | 1991 | ongoing | [21,55,56] | |
| Windstats Newsletter/Report | Germany | 4500 | ✓ | ~30,000 | 1994 | 2004 | [17,40,57] | |
| Windstats Newsletter/Report | Denmark | 2500 | ✓ | >20,000 | 1994 | 2004 | [17,40,57] | |
| WInD-Pool | Germany/Europe | 456 | ✓ | ✓ | 2086 | 2013 | ongoing | [58,59,60,61] |
| WMEP | Germany | 1593 | ✓ | 15,357 | 1989 | 2008 | [62,63] | |
Table 2.
Capacity factors of onshore and offshore WT as published by different initiatives.
| Initiative | Capacity Factor [%] | |
|---|---|---|
| Onshore | Offshore | |
| CREW-Database | 35.2 | |
| EUROWIN | 19 | |
| Lynette | 20 | |
| Muppandal | 24.9 | |
| Round 1 offshore WF | 29.5 | |
| SPARTA | 39.9 | |
| VTT | 21.5 | |
| WInD-Pool | 18.4 | 39 |
| WMEP | 18.5 | |
Table 3.
Availability metrics of onshore and offshore WT as published by different initiatives.
| Initiative | Onshore Availability [%] | Offshore Availability [%] | ||||
|---|---|---|---|---|---|---|
| Time-Based | Technical | Energetic | Time-Based | Technical | Energetic | |
| CREW-Database | 96.5 | |||||
| CWEA-Database | 97 | |||||
| Elforsk/Vindstat | 96 | |||||
| Garrad Hassan | 96.4 | |||||
| Lynette | 80 | |||||
| Muppandal | 82.9 | 94 | ||||
| Round 1 offshore WF | 80.2 | |||||
| SPARTA | 92.5 | |||||
| VTT | 89 | |||||
| WInD-Pool | 94.1 | 92.0 | 92.2 | 88.1 | ||
| WMEP | 98.3 | |||||
Table 4.
Average failure rate per WT as published by different initiatives (part 1).
| System/Subsystem | CIRCE | CWEA-Database | Elforsk/Vindstat | EPRI | Huadian | LWK | Muppandal | NEDO | |
|---|---|---|---|---|---|---|---|---|---|
| Failure Rate [1/a] | |||||||||
| =MDA | Rotor System | 0.094 | 1.961 | 0.053 | 1.026 | 0.141 | 0.321 | 0.187 | 0.038 |
| =MDA10 … =MDA13 | Rotor Blades | 0.037 | 0.403 | 0.052 | 0.357 | 0.026 | 0.194 | 0.187 | 0.011 |
| =MDA20 | Rotor Hub Unit | 0.006 | / | 0.001 | 0.136 | / | / | / | 0.013 |
| =MDA30 | Rotor Brake System | 0.02 | / | / | 0.195 | / | 0.04 | / | 0.001 |
| - | Pitch System | 0.029 | 1.558 | / | 0.338 | 0.115 | 0.088 | / | 0.013 |
| =MDK | Drive Train System | 0.096 | 1.225 | 0.054 | 0.921 | 0.088 | 0.226 | 0.28 | 0.015 |
| =MDK20 | Speed Conversion System | 0.083 | 1.138 | 0.045 | 0.264 | 0.062 | 0.142 | 0.173 | 0.005 |
| =MDK30 | Brake System Drive Train | 0.002 | 0.087 | 0.005 | 0.452 | 0.018 | 0.053 | 0.107 | 0.003 |
| =MDL | Yaw System | 0.02 | 0.317 | 0.026 | 1.245 | 0.026 | 0.115 | 0.16 | 0.005 |
| =MDX | Central Hydraulic System | 0.022 | / | 0.061 | / | / | 0.134 | 0.173 | 0.003 |
| =MDY | Control System | 0.079 | / | 0.05 | 1.424 | 0.106 | 0.222 | 0.12 | 0.015 |
| =MKA | Power Generation System | 0.029 | 1.665 | 0.021 | 0.374 | 0.15 | 0.14 | 0.067 | 0.01 |
| =MS | Transmission | 0.067 | 2 | 0.067 | 1.657 | 0.291 | 0.323 | / | 0.003 |
| =MSE | Converter System | 0.005 | 2 | / | / | 0.229 | 0.005 | / | / |
| =MST | Generator Transformer System | 0.005 | / | / | / | 0.018 | / | / | / |
| =MUD | Nacelle | 0.005 | / | / | 0.043 | / | / | / | 0.009 |
| =MUR | Common Cooling System | 0.028 | / | / | / | / | / | / | / |
| =CKJ10 | Meteorological Measurement | 0.009 | / | / | / | / | 0.061 | 0.027 | 0.058 |
| =UMD | Tower System | 0.003 | / | 0.006 | 0.203 | / | / | / | 0.001 |
| =UMD10 … =UMD40 | Tower System | 0.002 | / | 0.006 | 0.203 | / | / | / | / |
| =UMD80 | Foundation System | 0.001 | / | / | / | / | / | / | 0.001 |
| - | Other | 0.03 | / | 0.065 | 3.302 | 0.044 | 0.312 | / | 0.013 |
| =G | Wind Turbine (total) | 0.481 | 7.167 | 0.403 | 10.195 | 0.846 | 1.855 | 1.013 | 0.171 |
Table 5.
Average failure rate per WT as published by different initiatives (part 2).
| System/Subsystem | University Nanjing | SPARTA (Offshore) | Strathclyde (Offshore) | VTT | Windstats GER | Windstats DK | WMEP | |
|---|---|---|---|---|---|---|---|---|
| Failure Rate [1/a] | ||||||||
| =MDA | Rotor System | 12.229 | 2.75 | 1.831 | 0.21 | 0.368 | 0.049 | 0.522 |
| =MDA10 … =MDA13 | Rotor Blades | / | 1.353 | 0.52 | 0.2 | 0.223 | 0.035 | 0.113 |
| =MDA20 | Rotor Hub Unit | 0.027 | / | 0.235 | 0.01 | / | / | 0.171 |
| =MDA30 | Rotor Brake System | / | / | / | / | 0.049 | 0.007 | / |
| - | Pitch System | / | 1.397 | 1.076 | / | 0.097 | 0.007 | 0.238 |
| =MDK | Drive Train System | 2.967 | 0.985 | 0.633 | 0.19 | 0.164 | 0.065 | 0.291 |
| =MDK20 | Speed Conversion System | 2.084 | / | 0.633 | 0.15 | 0.1 | 0.04 | 0.106 |
| =MDK30 | Brake System Drive Train | 0.533 | / | / | 0.04 | 0.039 | 0.014 | 0.13 |
| =MDL | Yaw System | 1.089 | 0.77 | 0.189 | 0.1 | 0.126 | 0.027 | 0.177 |
| =MDX | Central Hydraulic System | 1.747 | 1.543 | / | 0.36 | 0.11 | 0.031 | 0.225 |
| =MDY | Control System | 15.223 | 1.31 | 0.428 | 0.1 | 0.223 | 0.05 | 0.403 |
| =MKA | Power Generation System | 2.537 | 0.561 | 0.999 | 0.08 | 0.12 | 0.024 | 0.1 |
| =MS | Transmission | 9.845 | 1.774 | 1.11 | 0.11 | 0.341 | 0.019 | 0.548 |
| =MSE | Converter System | / | 1.318 | 0.18 | / | / | / | / |
| =MST | Generator Transformer System | / | 0.456 | 0.065 | / | / | / | / |
| =MUD | Nacelle | / | / | / | / | / | / | 0.094 |
| =MUR | Common Cooling System | / | / | 0.213 | / | / | / | / |
| =CKJ10 | Meteorological Measurement | / | / | / | / | / | / | / |
| =UMD | Tower System | / | / | 0.185 | 0.09 | / | / | / |
| =UMD10 … =UMD40 | Tower System | / | / | / | / | / | / | / |
| =UMD80 | Foundation System | / | / | / | / | / | / | / |
| - | Other | 1.218 | 6.147 | 2.685 | 0.21 | 0.344 | 0.169 | 0.245 |
| =G | Wind Turbine (total) | 46.856 | 15.84 | 8.273 | 1.45 | 1.796 | 0.434 | 2.606 |
Table 6.
Mean down time per failure of onshore WT as published by different initiatives.
| System/Subsystem | CIRCE | Elforsk/Vindstat | Huadian | LWK | University Nanjing | VTT | WMEP | |
|---|---|---|---|---|---|---|---|---|
| Mean Down Time per Failure [days] | ||||||||
| =MDA | Rotor System | 6.4 | 3.75 | 4.27 | 1.62 | 0.17 | 10.2 | 3.07 |
| =MDA10 … =MDA13 | Rotor Blades | 8.3 | 3.82 | 7.58 | 1.76 | / | 10.67 | 3.42 |
| =MDA20 | Rotor Hub Unit | 6.76 | 0.52 | / | / | 0.14 | 0.83 | 4.13 |
| =MDA30 | Rotor Brake System | 5.54 | / | / | 2.25 | / | / | / |
| - | Pitch System | 4.17 | / | 3.5 | 1.05 | / | / | 2.14 |
| =MDK | Drive Train System | 8.24 | 10.3 | 6.82 | 4.15 | 0.25 | 21.08 | 4.63 |
| =MDK20 | Speed Conversion System | 8.26 | 10.7 | 6.5 | 5.27 | 0.3 | 25.08 | 6.69 |
| =MDK30 | Brake System Drive Train | 4.29 | 5.23 | 8.53 | 0.74 | 0.06 | 6.08 | 2.71 |
| =MDL | Yaw System | 6.35 | 10.81 | 9.48 | 1.31 | 0.21 | 6.38 | 2.56 |
| =MDX | Central Hydraulic System | 2.05 | 1.8 | / | 1.04 | 0.16 | 3.58 | 1.15 |
| =MDY | Control System | 1.81 | 7.69 | 4.74 | 0.99 | 0.16 | 1.75 | 1.88 |
| =MKA | Power Generation System | 13.65 | 8.78 | 7.02 | 3.1 | 0.24 | 5.13 | 7.45 |
| =MS | Transmission | 3.17 | 4.44 | 6.03 | 1.44 | 0.18 | 5.96 | 1.51 |
| =MSE | Converter System | 3.2 | / | 6.34 | 1.24 | / | / | / |
| =MST | Generator Transformer System | 10.68 | / | 11.37 | / | / | / | / |
| =MUD | Nacelle | 13.98 | / | / | / | / | / | 3.31 |
| =MUR | Common Cooling System | 1.55 | / | / | / | / | / | / |
| =CKJ10 | Meteorological Measurement | 0.83 | / | / | 0.74 | / | / | / |
| =UMD | Tower System | 1.88 | 4.34 | / | / | / | 7.42 | / |
| =UMD10 … =UMD40 | Tower System | 0.45 | 4.34 | / | / | / | / | / |
| =UMD80 | Foundation System | 4.69 | / | / | / | / | / | / |
| - | Other | 2.02 | 2.27 | 2.27 | 0.92 | 0.14 | 2.8 | 1.57 |
| =G | Wind Turbine (total) | 5.18 | 5.42 | 5.75 | 1.72 | 0.18 | 7.29 | 2.57 |
© 2017 by the authors. Licensee MDPI, Basel, Switzerland. This article is an open access article distributed under the terms and conditions of the Creative Commons Attribution (CC BY) license (http://creativecommons.org/licenses/by/4.0/).
Share and Cite
MDPI and ACS Style
Pfaffel, S.; Faulstich, S.; Rohrig, K. Performance and Reliability of Wind Turbines: A Review. Energies 2017, 10, 1904. https://doi.org/10.3390/en10111904
AMA Style
Pfaffel S, Faulstich S, Rohrig K. Performance and Reliability of Wind Turbines: A Review. Energies. 2017; 10(11):1904. https://doi.org/10.3390/en10111904
Chicago/Turabian StylePfaffel, Sebastian, Stefan Faulstich, and Kurt Rohrig. 2017. "Performance and Reliability of Wind Turbines: A Review" Energies 10, no. 11: 1904. https://doi.org/10.3390/en10111904
Note that from the first issue of 2016, this journal uses article numbers instead of page numbers. See further details here.