Optimization of the Heating Element in a Gas-Gas Heater Using an Integrated Analysis Model

1
Department of Mechanical Engineering, Yonsei University, Seoul 03722, Korea
2
Korea Midland Power Co., Ltd., Boryeong-si 33439, Korea
*
Author to whom correspondence should be addressed.
Energies 2017, 10(12), 1932; https://doi.org/10.3390/en10121932
Submission received: 15 October 2017
/
Revised: 10 November 2017
/
Accepted: 20 November 2017
/
Published: 23 November 2017
(This article belongs to the Section I: Energy Fundamentals and Conversion)
Abstract
:Gas-gas heaters (GGHs) are used to reheat gases through desulfurization in coal-fired power plants to reduce low-temperature corrosion and white smoke. Wrinkled heating elements are installed inside the GGH to perform effective heat exchange. An optimization study of the heating element shape was conducted to reduce the differential pressure effectively and improve performance. An integrated analysis model was applied. Based on actual operational data, a computational fluid dynamic analysis was conducted on the L-type heating element and GGH system. The experiments applied the optimal latin hypercube sampling method, and numerical analysis was performed for each sample. Based on the response surface, the result of the sample was optimized through the pointer algorithm. For the integrated analysis model, validation was performed by comparison with the actual operational data, and the thermal-fluid characteristics of the heating element and GGH system were analyzed to set three parameters: plate angle, undulated angle, and pitch 1. From the optimization result, increases in the undulated angle and pitch 1 reduce the pressure drop by widening the heating element cross section. By increasing the plate angle, the heat transfer area is secured and the reduced heat transfer coefficient is compensated, improving the GGH performance.
1. Introduction
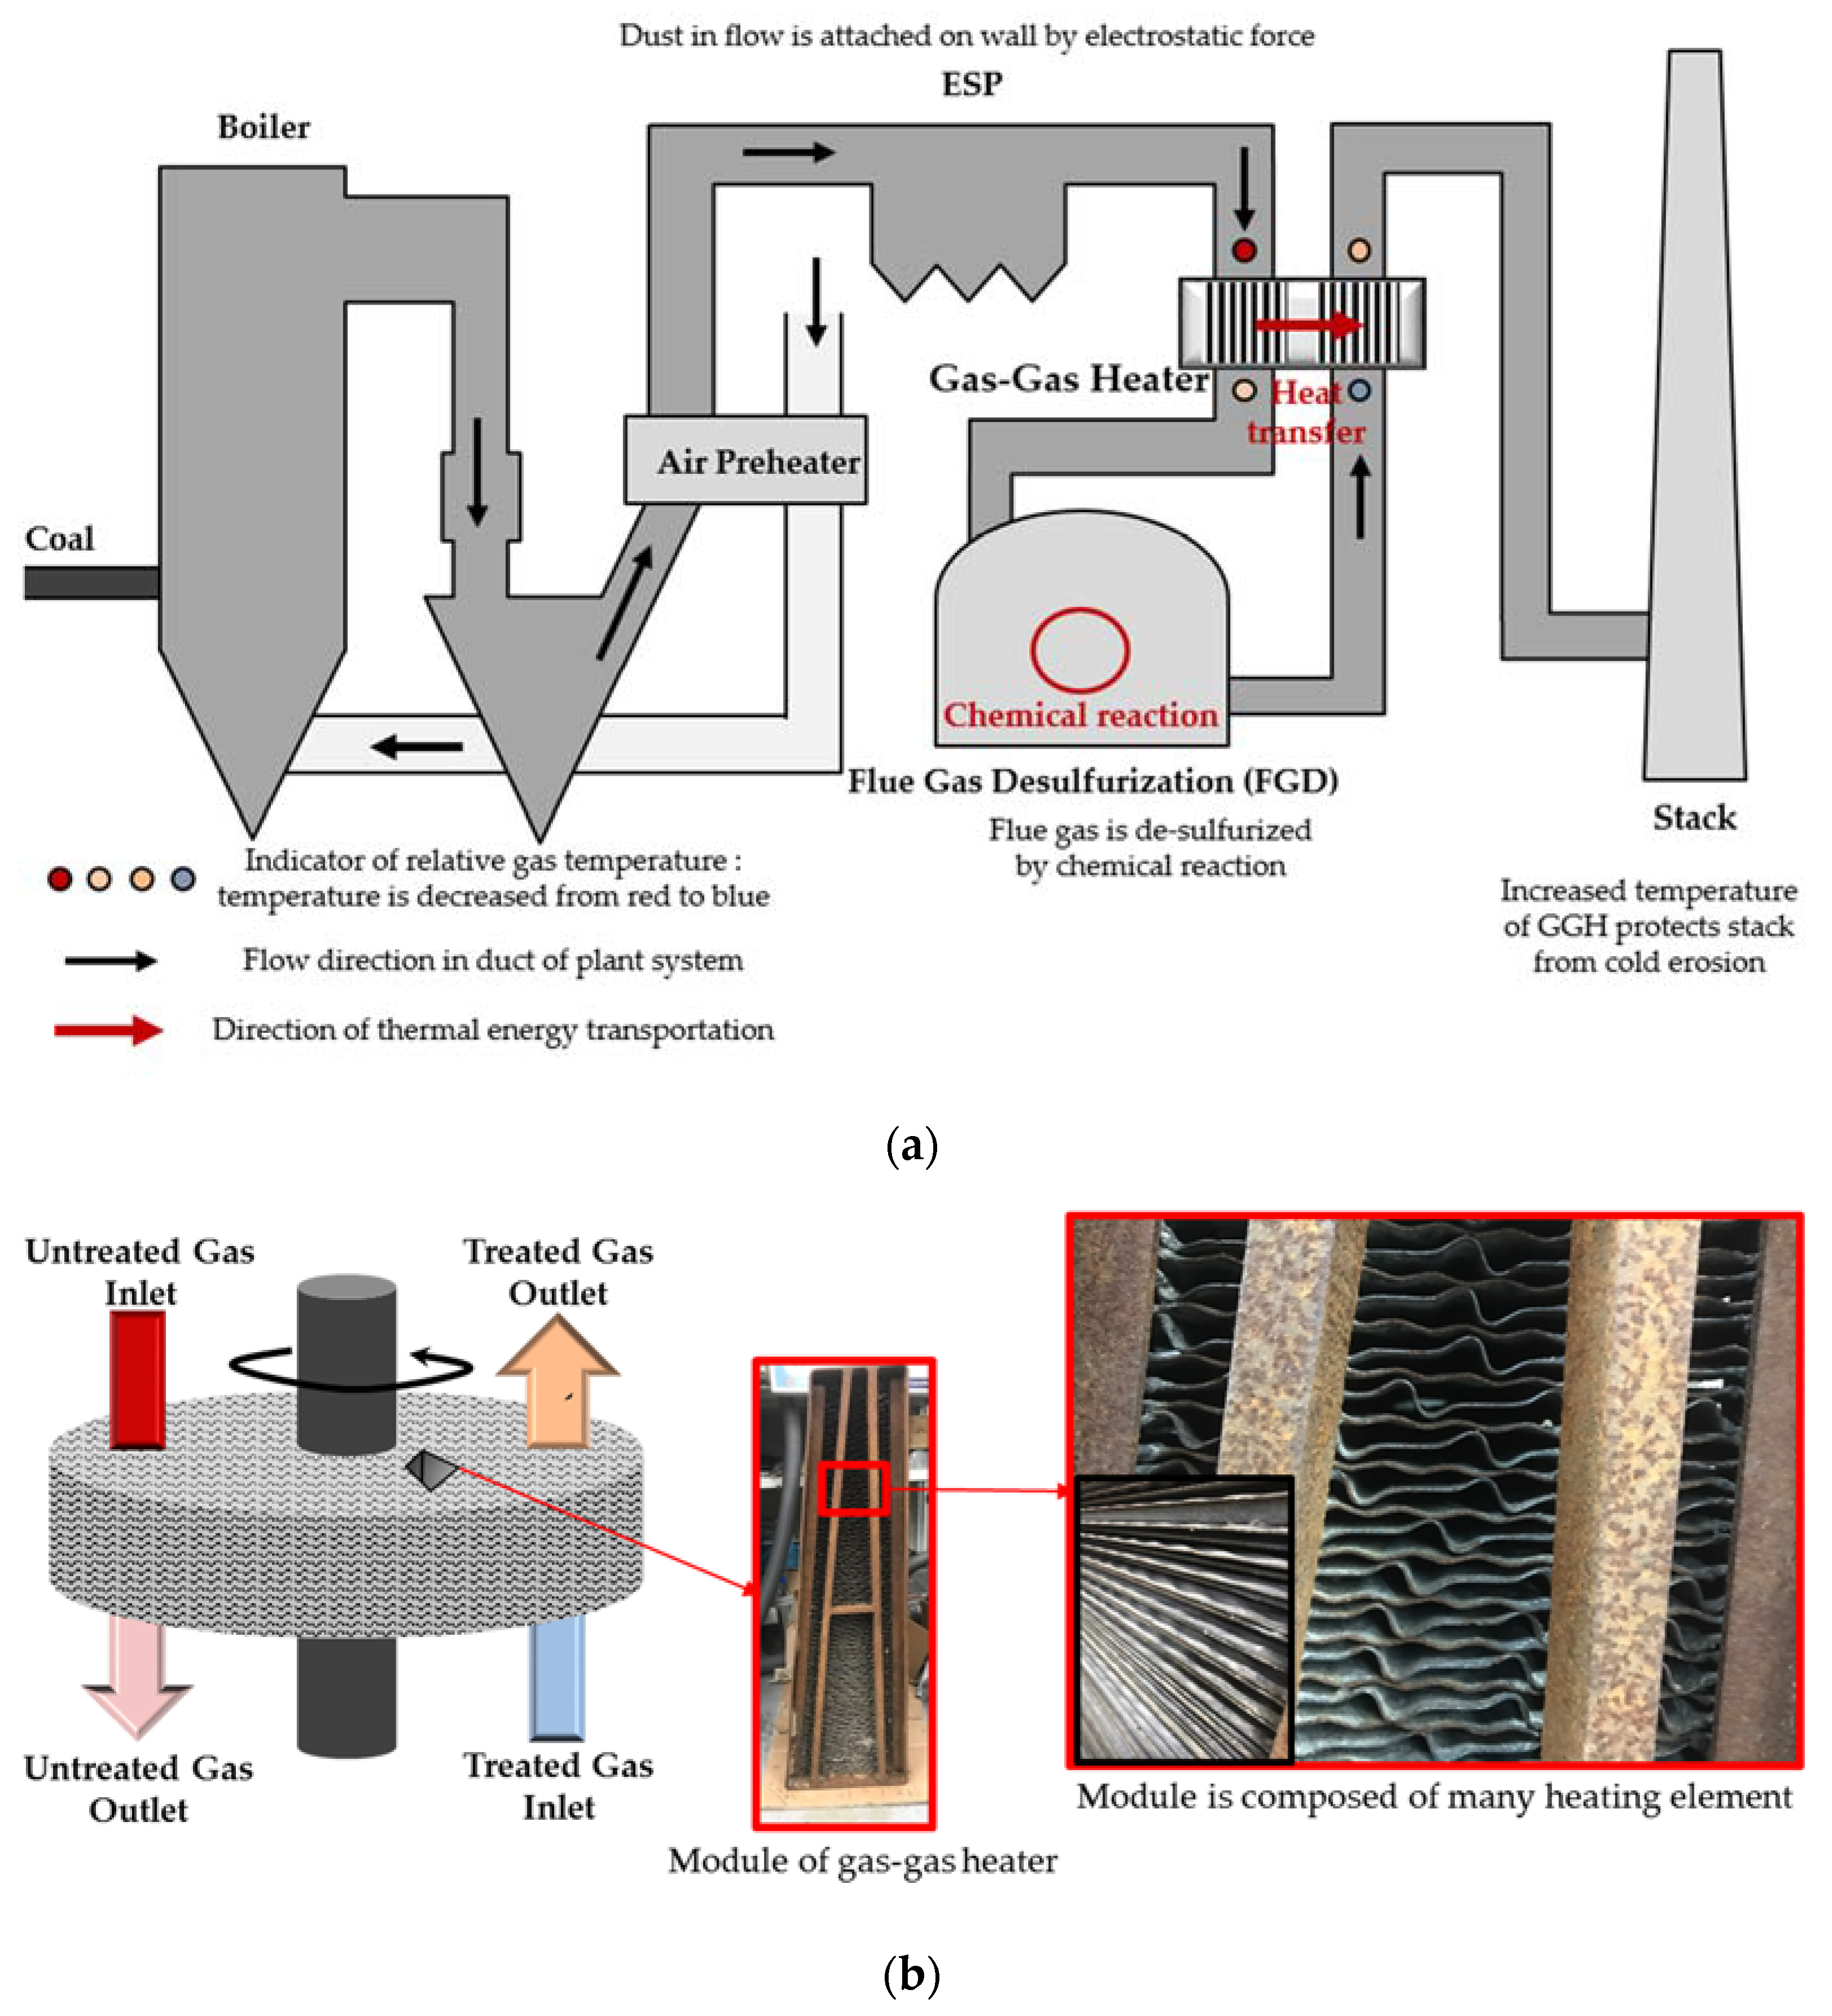
Recently, studies on desulfurization technology have been actively carried out as the regulations on sulfur oxides emitted from coal-fired power plants have become stronger [1]. Accordingly, to remove sulfur oxides effectively, a flue-gas desulfurization system (FGD) was installed in a coal-fired power plant, and related research is underway. There are various types of desulfurization units, but the wet type is the most popular owing to its high efficiency and economy. In a wet desulfurization facility, sulfur oxides from the untreated flue gas can be absorbed by injecting water and an alkali solution [2]. Water and the alkali solution react with sulfur oxides so that a sediment of sulfur is generated and cleaned air is discharged from the reactor. However, the treated gas passing through the absorber has a low temperature and a high water content, resulting in corrosion of the flow duct and reduction of the flue-gas emission effect through the chimney. To prevent this phenomenon, and to effectively discharge the treated gas, most wet desulfurization plants are equipped with a gas-gas heater (GGH) before the stack to raise the temperature of the treated gas and lower its humidity, as shown in Figure 1a. Rotary heat exchangers include the Ljungstrom type, where heat exchange takes place through a fixed duct and a rotor, and the Rothemuhle type, which exchanges heat between a stationary matrix rotor and a rotating hood [3].
Rothemuhle type GGH has less weight and volume than the Ljungstrom type GGH. However, most power plants use the Ljungstrom type GGH than Rothemuhle type GGH, considering the installation cost and operational efficiency [4]. To exchange heat, the Ljungstrom type GGH transfers the untreated and treated gases through separate ducts and through the rotor [5]. To increase the efficiency of heat exchange, a corrugated heating element is inserted, as shown in Figure 1b.
As the power plant starts to operate, water evaporates as the temperature rises, and the ash contained in the gas gradually accumulates on the element, resulting in plugging that blocks the flow path [6,7]. Plugging is a kind of fouling phenomenon, which is different from the slagging caused by the deposition of ash in the boiler [8,9]. Frequent component replacement, owing to pressure drop in the GGH, is caused by plugging and fouling and makes it difficult to operate the power plant. Many related studies have been investigated to avoid the plugging phenomenon, and attempts have been made to reduce plugging by periodically operating a soot blower that uses steam or air in an effective manner [10,11]. However, recently, a case was reported in which the heating element was broken by the strong pressure of the steam or air of the soot blower.
In this study, optimization of the heating element is performed to improve the performance and increase the part replacement cycle. There have been many efforts to prevent ash from adhering to the enamel coating. Stasiek et al. studied corrugated passages by experiments using the thermochromic liquid crystals method and numerical analysis [3,12]. Vulloju carried out a numerical study on the heating element and performed a comparative study on the performance between heating elements [13]. Guo-Yan et al. performed a numerical analysis and an experimental study on heat transfer and pressure drop for cross-corrugated elements [14]. Cho et al. conducted an experimental study on flow and heat transfer inside a corrugated duct and wavy duct [15,16]. Dimple and protrusion arrays have been used to increase heat transfer [17] and to incorporate them into heating element.
In recent years, studies on GGH systems have been carried out with a single heating element. Wang et al. conducted a heat transfer study on a three-dimensional model using a semi-analytical method on a rotary air preheater [18]. The optimal operational conditions of the rotary heat exchanger were found using the genetic algorithm by Sanaye et al. [19]. Moreover, leakage of the GGH system has been studied by several research groups [20,21]. Heidari-Kaydan and Hajidavalloo conducted a 3D simulation of a rotary heat exchanger and analyzed its performance based on the materials and rotating speed [22]. A conceptual optimization of a rotary heat exchanger was performed by Dallaire et al. [23]. Recently, a rotary heat exchanger considering the shape of the heating element was studied [24].
In this study, an integrated analysis model that predicts the performance of the GGH system based on the actual shape of the heating element was built and verified. The shape optimization of the heating element was performed through a proven integrated analysis model. The actual operating condition was applied to a simplified model of the GGH of a Korean coal power plant using the L-type heating element. Based on the integrated analysis model between the heating element and the GGH system, the thermal-fluid characteristics were analyzed and the performance verification performed. The response surface method was used to optimize the geometry of the heating element, satisfy the constraints of the GGH which are maximal pressure drop and minimal temperature change, reduce the pressure drop, and improve its performance. This research article extends the work described in ASTFE (American Society of Thermal and Fluids Engineers) Paper No. TFEC-IWHT2017-18168 of the 2nd Thermal and Fluids Engineering Conference 2017 and 4th International Workshop on Heat Transfer 2017 [25].
2. Research Method
2.1. Numerical Investigation with the Integrated Analysis Model
2.1.1. Integrated Analysis Model
An integrated analysis model was developed to analyze the pressure drop, temperature change, and performance of the GGH with changing heating element geometry, as shown in Figure 2. The integrated analysis model involves combining the numerical simulations of both the heating element and the GGH system.
The numerical analysis of the heating element is performed and the obtained thermal-fluid results can be substituted into the input values of the GGH system to predict the overall system performance. As in the porous media approach of the rotating regenerator studied by Ahmed Alhusseny and Turan, the rotor of the GGH system is assumed to be the porous media, and the input values of the porous elements are replaced by the results of the heating element analysis [24]. Among the diverse types of heating elements, in this study, the L-type heating element was used, owing to its efficient heat transfer rate and low pressure-loss coefficient.
2.1.2. Simulation Setup
In this study, the numerical analysis was performed with the commercial code ANSYS CFX 17.2 (ANSYS, Canonsburg, PA, USA) in both simulations. The flue gas is assumed to be an ideal gas, and the corresponding expressions for temperature, thermal conductivity, dynamic viscosity, and heat capacity are applied. Because the flue gas composition in the untreated and treated regions is different, the fluid property expression according to each composition is constructed using REFPROP. In the flow analysis, the Reynolds number is defined as follows:
where are the density, average velocity of main flow, hydraulic diameter, and viscosity, respectively. All numerical analyses are interpreted as a steady flow, and the Reynolds number of the heating element is over 2300, so that the flow in the heating element can be treated as turbulent. For the turbulence model, the RANS k-ε SST model is applied and the turbulence intensity is 5%. The unstructured meshes are constructed due to accuracy when used in combination with inflation at the wall as well as simplicity in grid creation of a complex geometry. As presented in result of grid test, showing the results of grid tests in the heating element and GGH, 20 million and 2 million meshes were placed in the heating element and GGH, respectively. For the heating element simulation, the average y plus of the heating element is less than 1. Because the heating element has periodicity, it is assigned periodic conditions on both sides, as shown in Figure 2. For the top and bottom of the undulated plate and sides of the corrugated profile, constant wall temperature conditions are assigned. The temperature values are calculated as the average temperature calculated from the mean values of the inlet and outlet temperatures of untreated and treated regions. Based on the actual operating data of a Korean coal power plant, information about the operating conditions and minimum allowable condition for normal operation can be obtained. The inlet and outlet conditions of the heating element are set based on the operating conditions of the untreated region. The total pressure and temperature are inputs to the inlet and the mass flow rate is set at the outlet. As the mass flow rate through the untreated region of the GGH passes through its heating element by an amount relative to the area, the mass flow rate to be assigned to the outlet of the heating element can be defined by the following equation:
where are mass flow rates of the untreated region in the GGH, area of the element’s outlet, and cross section of the GGH. The mass flow rate for the untreated region can be obtained from operating conditions, and the cross sectional area of the flow through the outlet and GGH can be easily obtained from the geometry. The rotor of the GGH, which is considered a porous medium, requires four input parameters: friction coefficient, heat transfer coefficient, volume porosity, and interfacial area density. The following two values can be obtained through numerical analysis using the equation of pressure drop and heat transfer:
where Sm, , , and U are the momentum source, linear resistance coefficient (viscosity over permeability), quadratic resistance coefficient (pressure drop loss term), and fluid velocity, respectively; γ, ρ, h, K, Ht, Γe, and S are the volume porosity, density, overall heat transfer coefficient between fluid and solid, area porosity tensor, mean total enthalpy, effective diffusivity, and source term, respectively. As the flow in the GGH can be assumed to occur in a direction parallel to the axis of rotation of the rotor, the pressure loss occurs directionally. In this study, is negligible because momentum loss is more dominant than pressure loss owing to the viscous effect because the entire flow is turbulent. Therefore, only is used as the friction coefficient. The expression for is as follows:
where , , , and are the friction coefficient, pressure drop, length of heating element, and average velocity of fluid at the inlet, respectively. Because steady flow is considered, the term related to time in the energy equation is deleted and the calculation for the remaining terms is performed. The heat transfer coefficient is defined as follows:
where are the heat transfer coefficient, heat flux, and temperature, respectively. The upper bar indicates the mean value. is the bulk mean inlet fluid temperature. The interfacial area density and volume porosity are determined by the following equations related to the geometry of the heating element:
where , , , , and are the interfacial area density, volume porosity, area of the solid part in the single heating element, volume of the fluid part in the single heating element, and sum of the fluid and solid volumes in the element. The friction coefficient and heat transfer coefficient vary depending on the flow, and the interfacial area density and volume porosity are values that vary depending on the shape of the element. The rotating speed of the GGH is set at 1.52 rpm. The rotating speed is used only in the GGH simulation, and it does not apply to the heating element simulation because the rotor rotates slowly. The performance of the GGH was calculated as follows:
where are the heat transfer rate and pumping power, respectively.
where and are the mass flow rate through the rotor, heat capacity of fluid, and volume flow rate of gas, respectively.
2.2. Optimization of Heating Element
Designing optimization techniques is an important engineering process. In this study, the response surface method (RSM) is effective for setting several variables. Therefore, a thermal-fluid analysis is performed using ANSYS CFX to generate the response surface, and the optimization program Isight (Dassault systemes, Vélizy-Villacoublay, France) is used to design the experiment and optimization process. According to Myers and Montgomery, a polynomial is used to generate the response surface using the approximation [26]. To generate samples, there are many types of experimental designs. According to Lautenschlager et al., there are various types of experimental designs, such as the full factorial design and orthogonal array [27]. In the past, the center composite design (CCD) technique, which mainly captures the samples at the endpoint of boundary and midpoint of them, was often used. Myers et al. have recently used latin hypercube sampling (LHS), an efficient method [26]. The LHS is a method proposed by Mckay, which is efficient in that the parameters of the multi-objective optimization are sampled so that they do not overlap with each other [28]. In this study, the design of the experiment was set up using the optimal latin hypercube sampling method (OLHS), which is an advanced LHS. Because there are three variables, a total of 27 samples were set up, and numerical simulations were performed for each sample to generate the response surface from the obtained results. The response surface type is set to kriging, which is a method of creating a response surface by interpolating through random values generated by the experiment design. The optimum value search uses a pointer algorithm that is easy to handle because there are several values to be found in the result and there are many types of inputs for each value [29]. In the GGH, a constraint was set to reduce the temperature change by less than 1% while generating a loss of 4%, less than the existing pressure drop. The overall optimization procedure is outlined in Figure 3.
The heating element module is a periodic regular array of plates and profiles made of steel in an intersecting fashion. As shown in Figure 4, the angle between the flow direction and the corrugation direction of the plate is defined as α, the interval between the pleating period of the plate is defined as pitch 1, P1, and the distance from one undulated plate to another undulated plate is defined as pitch 2, P2. The perpendicular distance from the profile center line at the 0.5 P2 position between the plate to the profile outer edge is designated as height, H. The height varies according to geometry, and it can be expressed as follows:
In the case of the heating element, the plate thickness is almost uniform to reduce the cost. To achieve a thickness of 0.9 mm in the manufacturing process and to prevent scale formation, the enamel coating is of 0.3 mm thickness. Therefore, the total thickness t of the test piece was set at 1.2 mm.
Further, it is assumed that the thickness is constant during operation without considering the effect of fouling. To optimize the heating element as presented in Table 1, the bound values of each parameter are given in consideration of the fabrication process, and the initial values are set as the base values. The inlet and outlet areas of the flow were added for the heating element analysis. The width of the element was 43 mm, the length of the element was 525 mm, and the length of the fluid area added to the inlet and outlet was set to 100 mm.
The GGH is designed by simplifying the shape using a rotor, which has a diameter of approximately 13 m, and a duct system, as shown in Figure 2. As a flue gas, the untreated gas passing through the boiler and electrostatic precipitator (ESP) as presented in Figure 1a enters from the lower part of the duct, passes through the rotor, which is the rotating area, loses heat, and escapes to the pink outlet. The gas that has escaped goes to the absorber, passes through the absorbent, becomes a low-temperature treated gas, and enters the sky blue GGH inlet through the blower. The treated gas passes through the rotor again and receives heat from the untreated gas and is exhausted to the treated gas outlet having a yellow color.
3. Results and Discussion
3.1. Thermal-Fluid Characteristics
For the numerical analysis, a grid test was performed on the heating element and the GGH system. Table 2 presents the result of the grid test for the heating element and GGH system. The number of grids is increased, and the difference from the previous value is less than 1%.
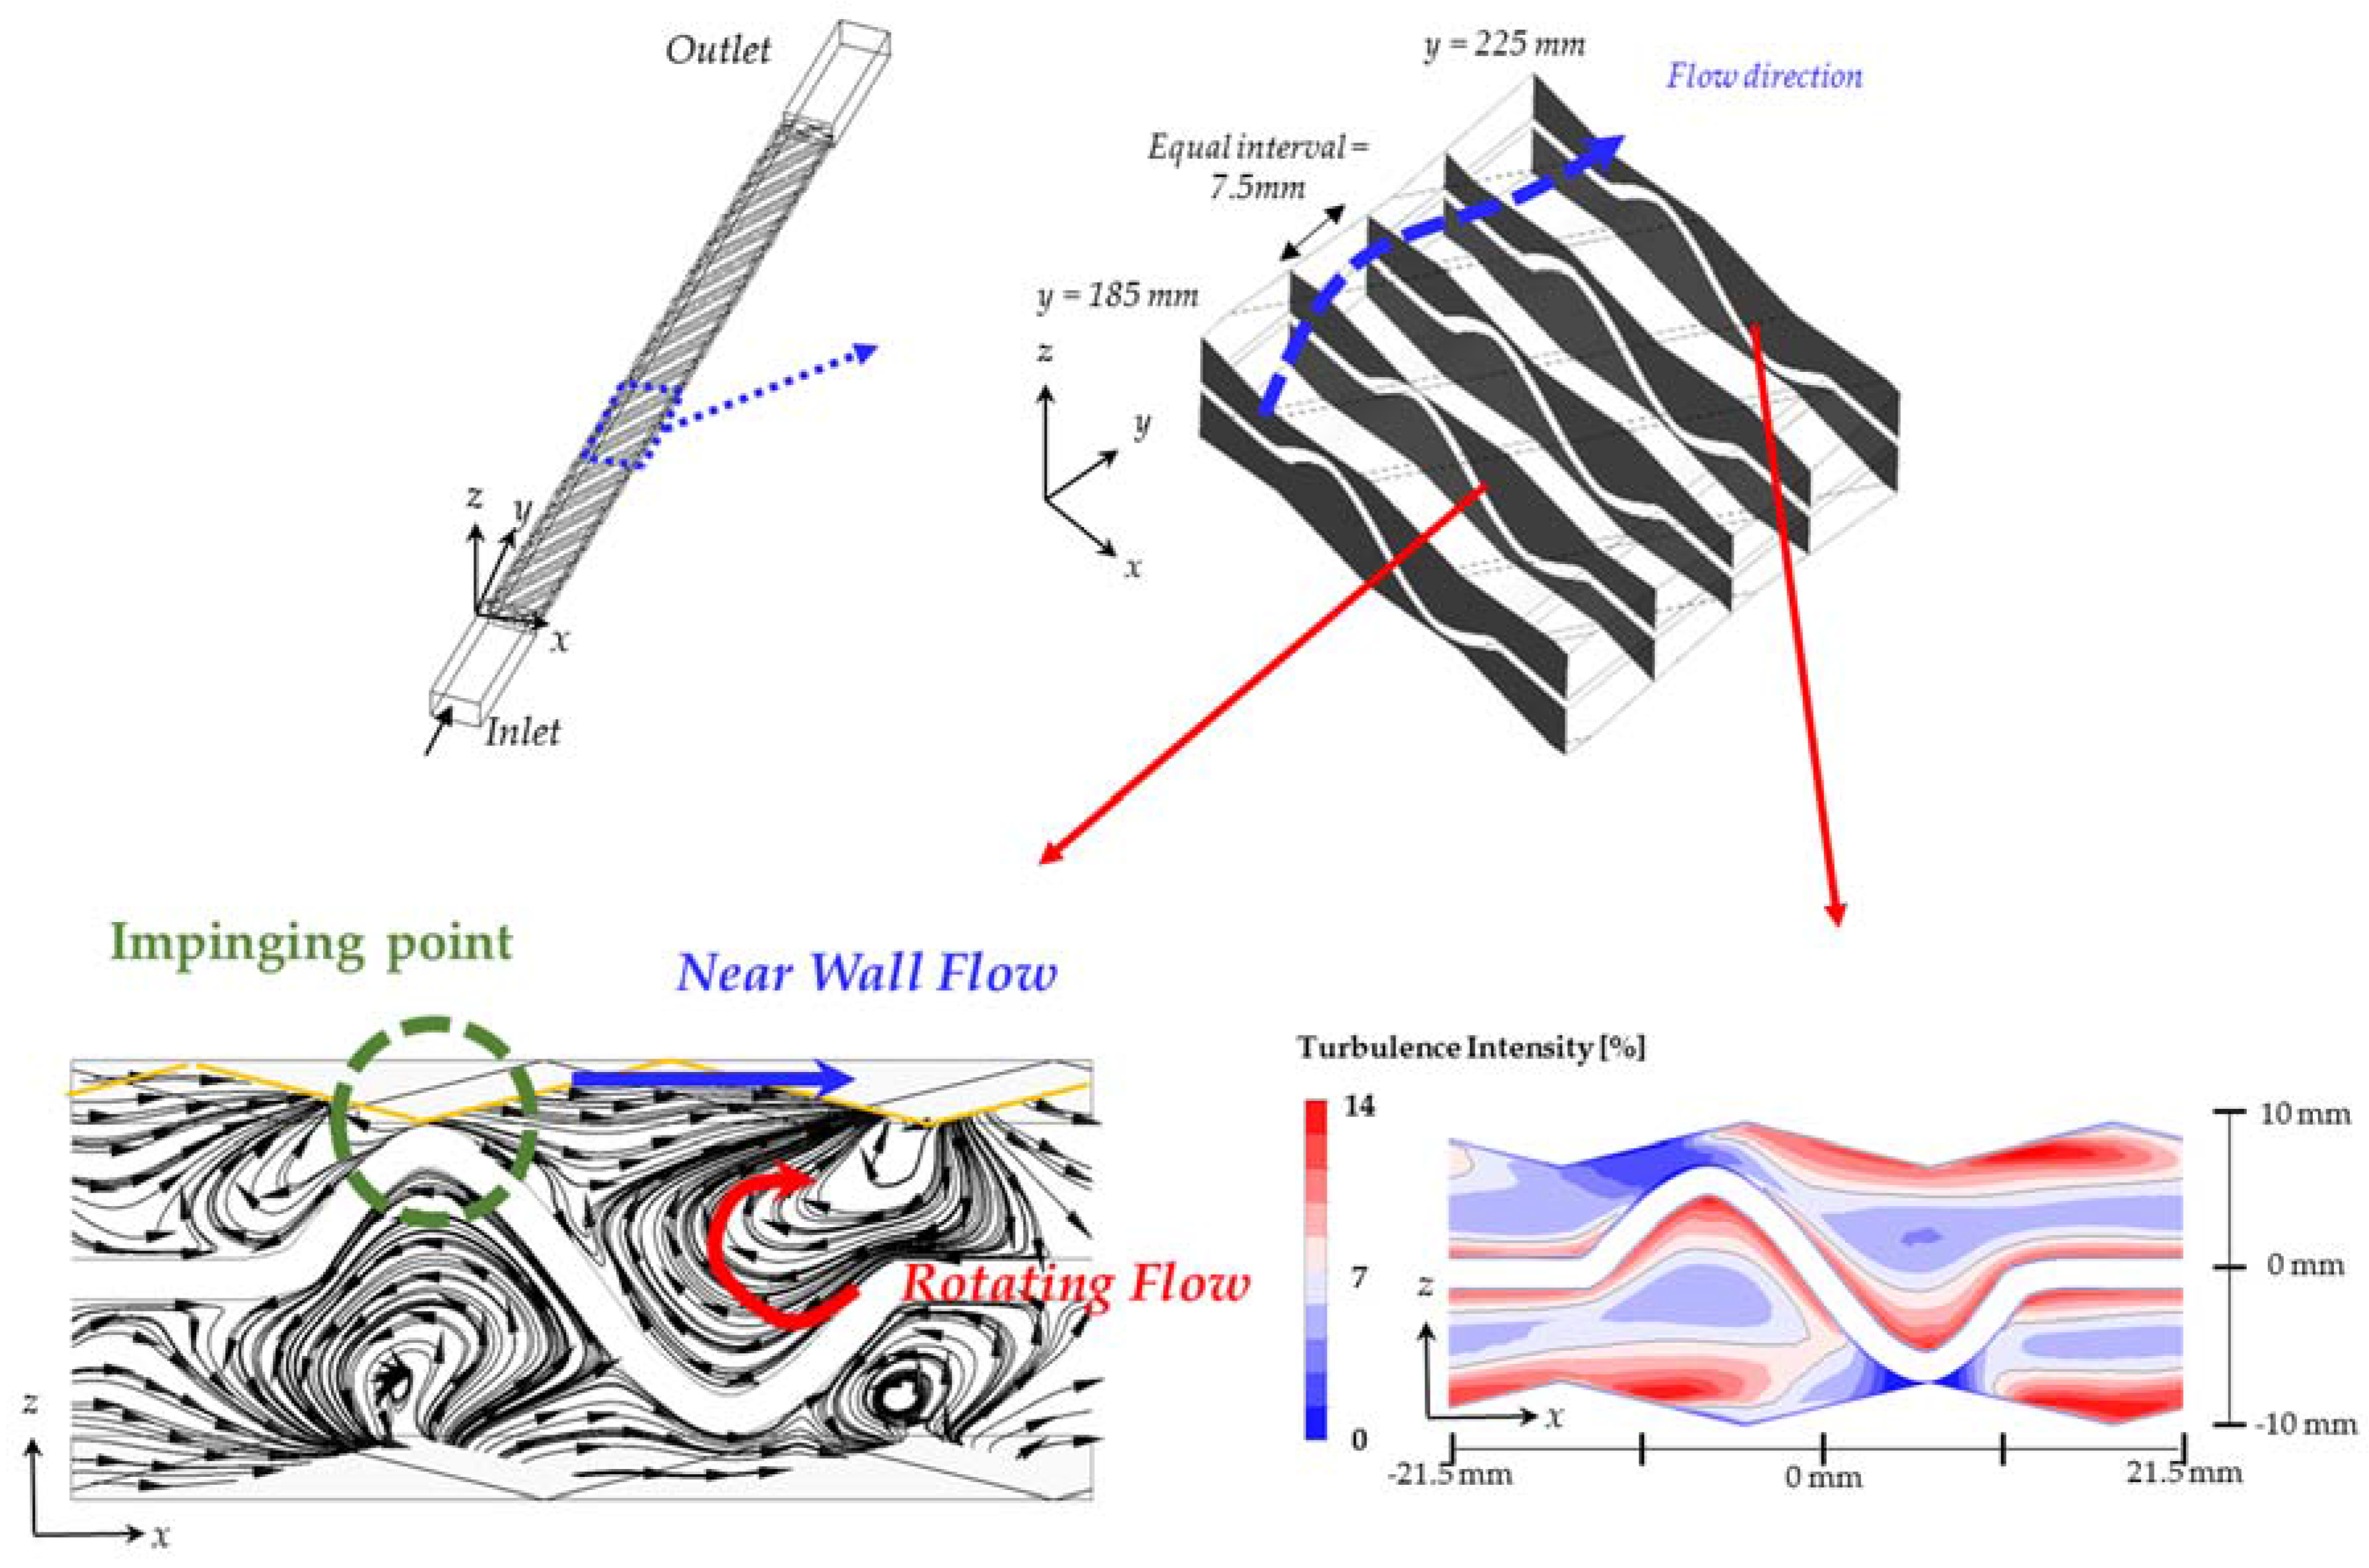
Figure 5 shows the results of the heating element analysis for the section cut at regular intervals (7.5 mm) within y = 185 mm to y = 225 mm. Figure 5 shows the flow characteristics of the heating element with a cross sectional streamline and turbulence intensity at a specific location. Near the wall, the velocity is low owing to the boundary layer caused by the no-slip condition, and the flow part far from the wall has a high velocity. The near wall flow is formed by the geometry of the undulated plate, which causes the rotating flow. The near wall flow and the rotating flow show that the turbulence intensity is high on the wall of the plate and profile. The equation of turbulence intensity is as follows:
where , , , , and upper bar are the velocity of the fluid, fluctuation of velocity, initial time, final time, and mean value of the specific parameter, respectively.
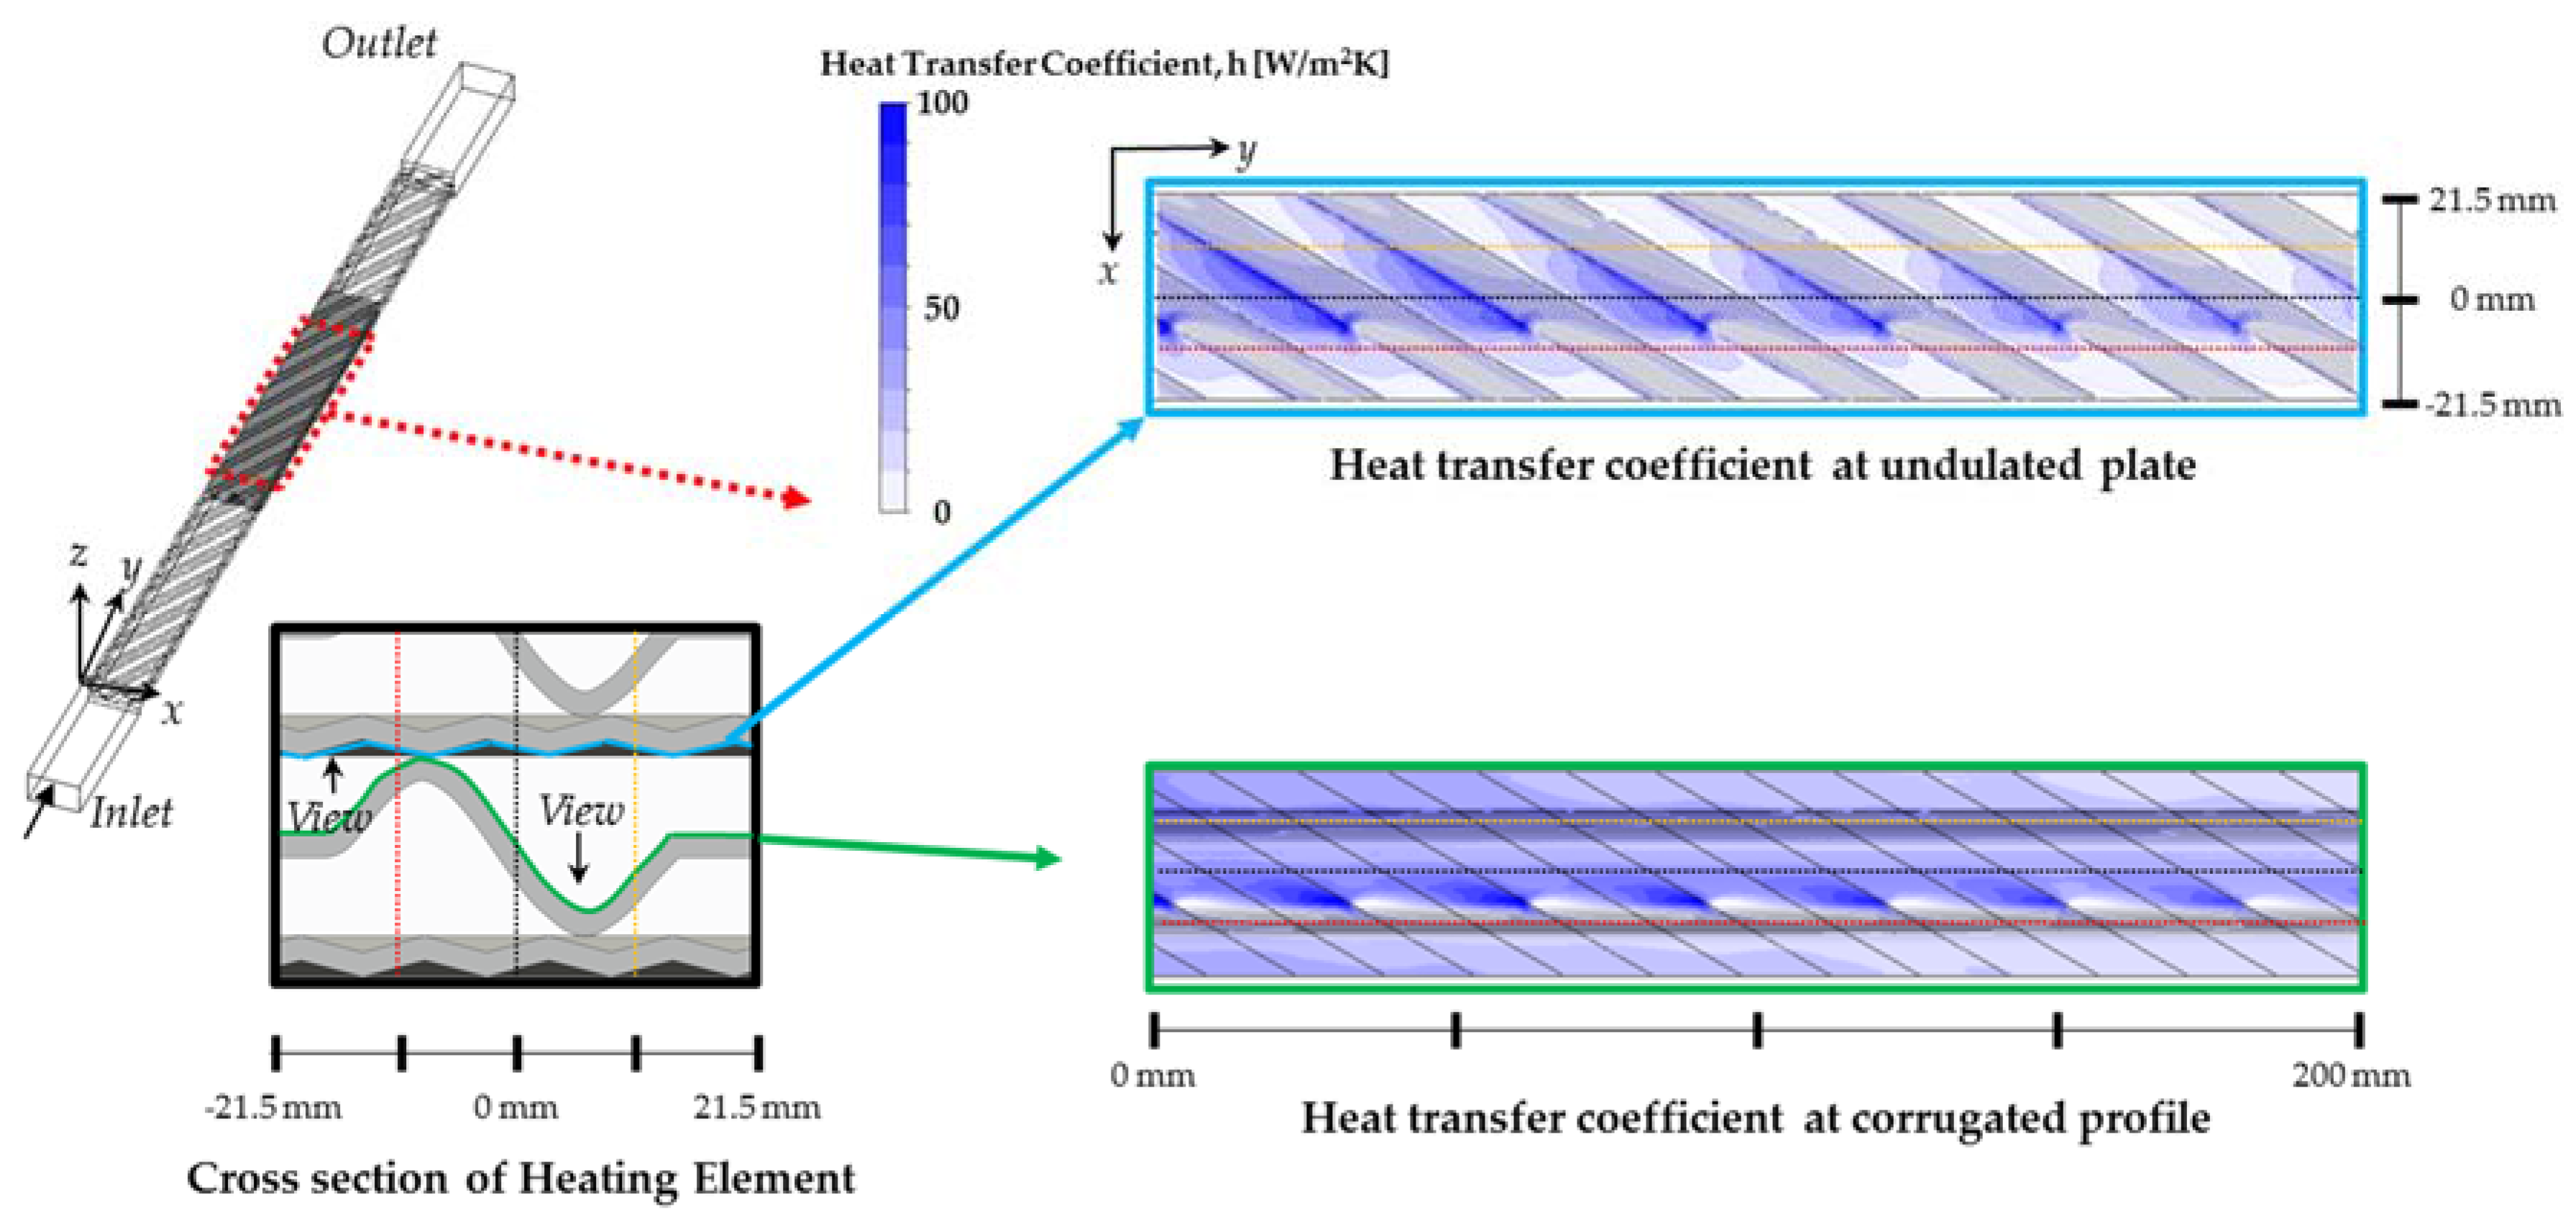
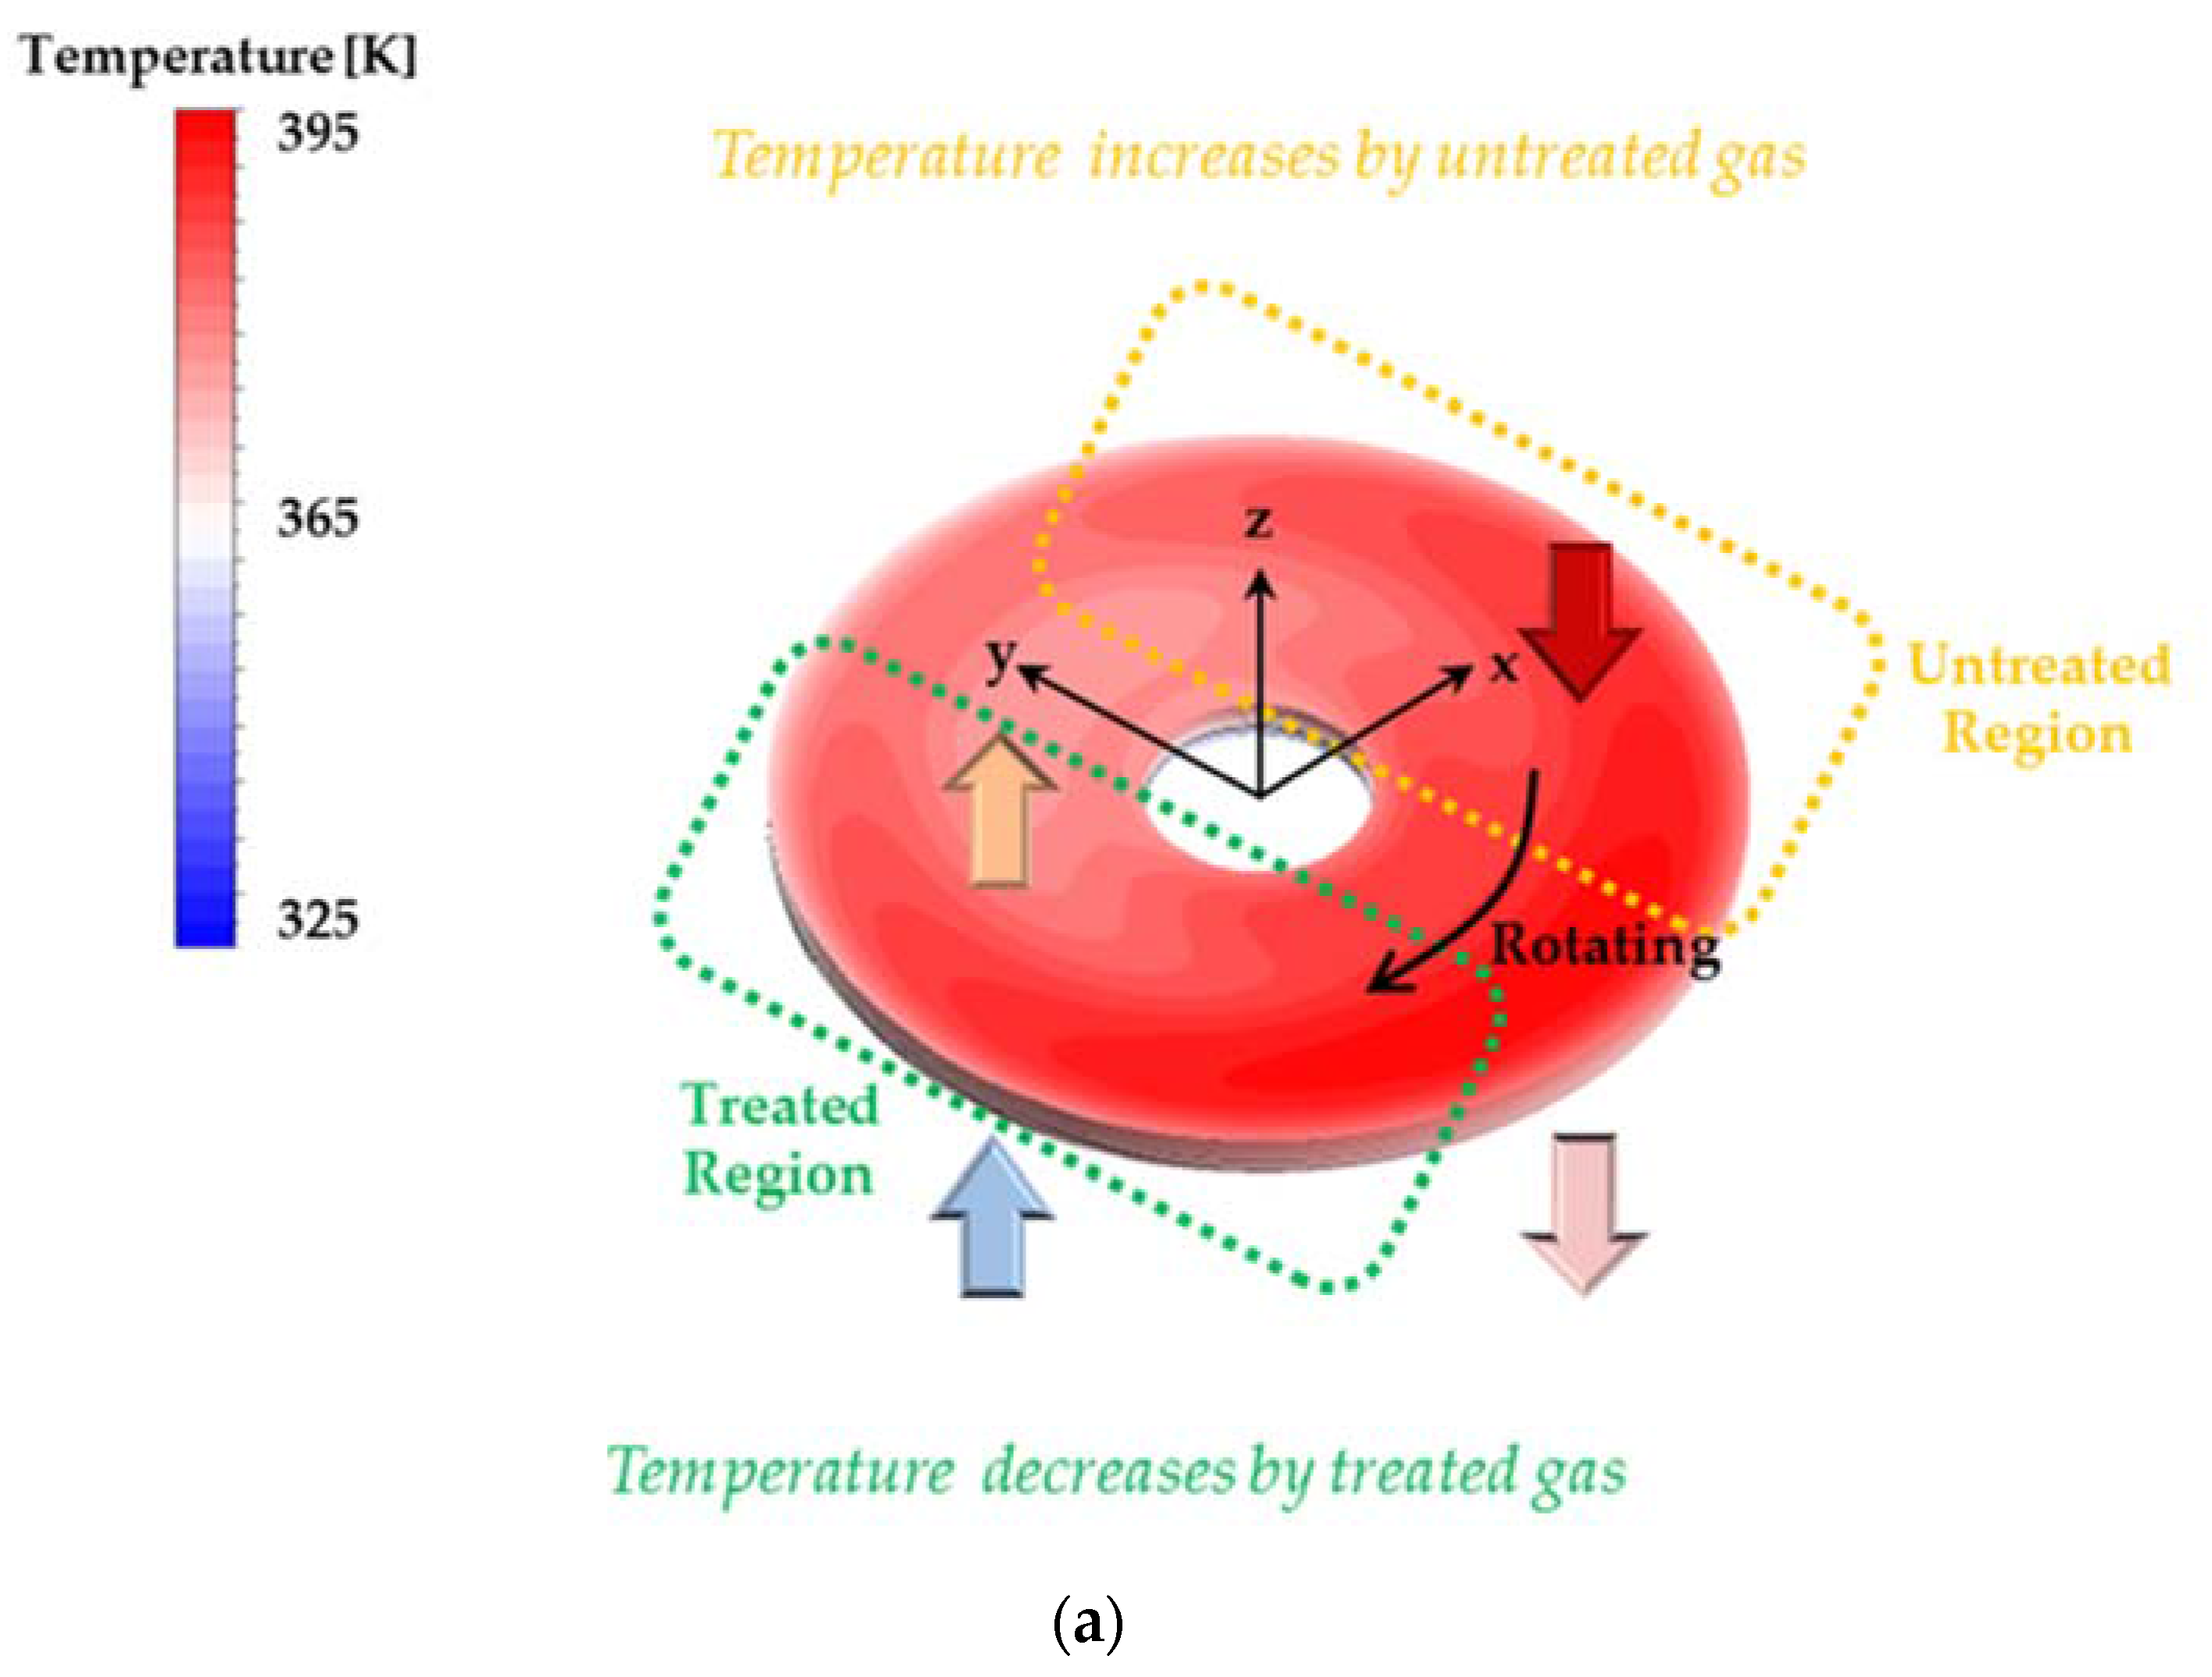
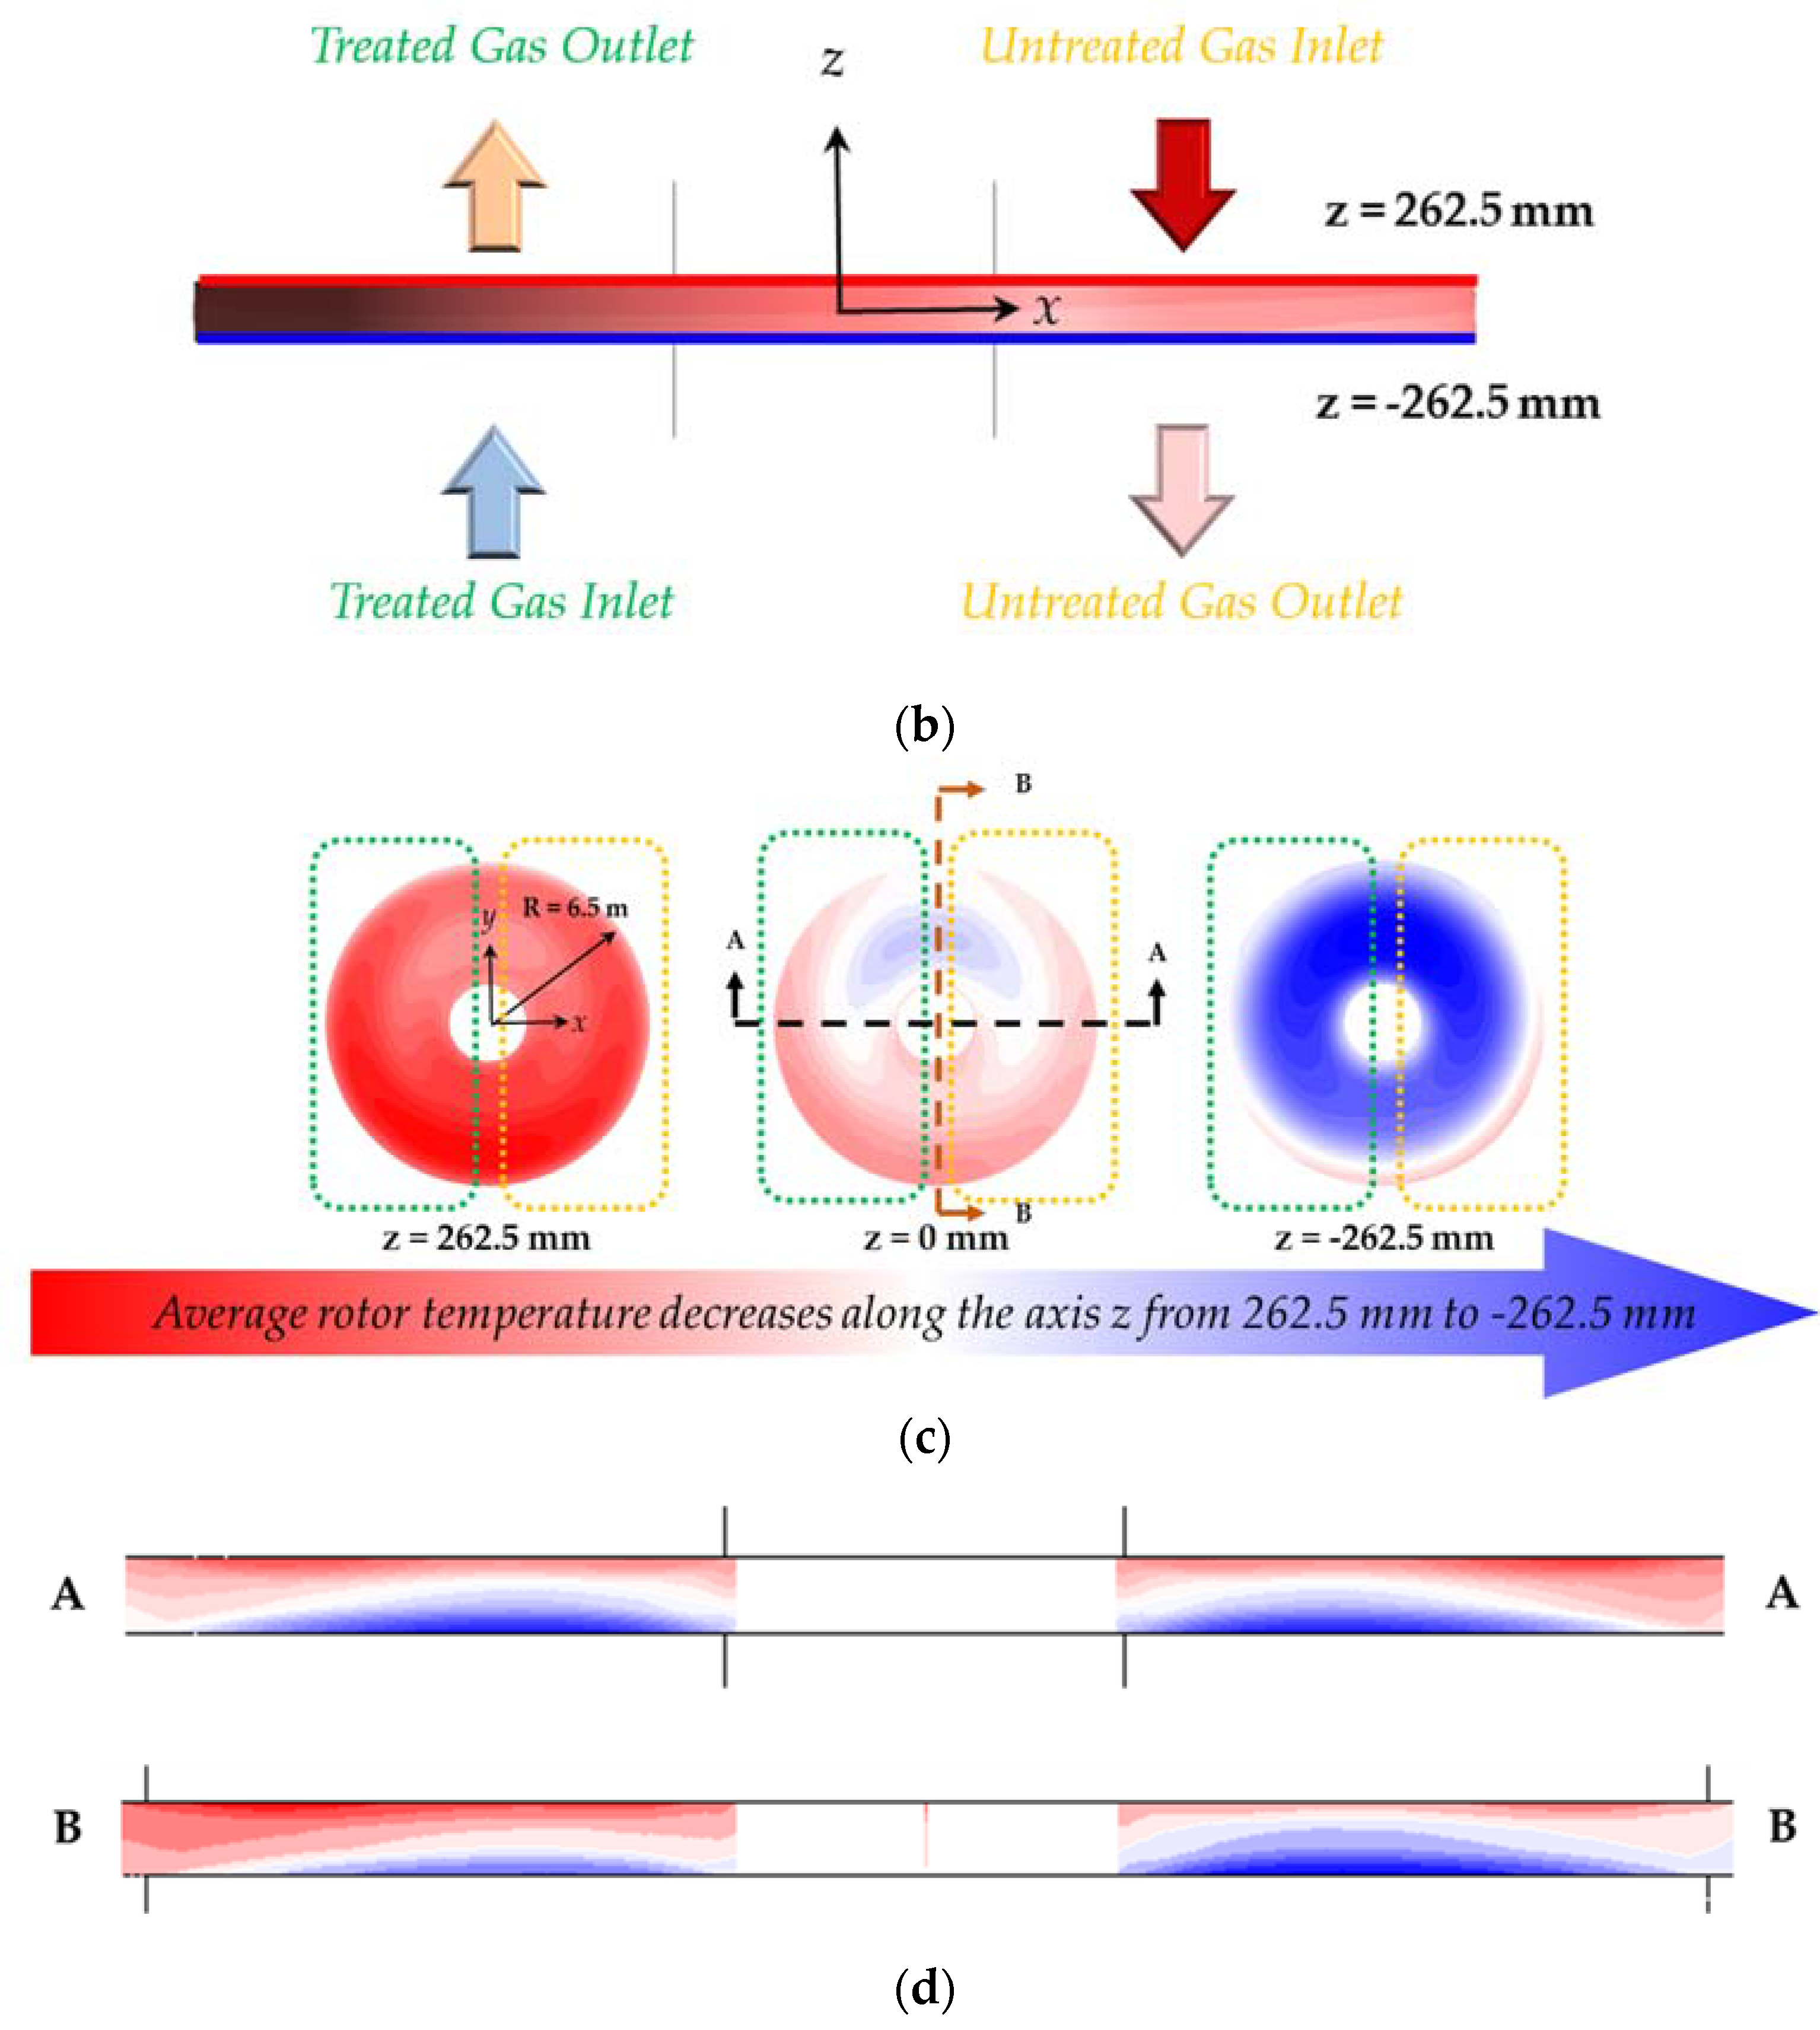
The distribution of the heat transfer coefficient can be deduced from the turbulence intensity analysis, as shown in Figure 5. Figure 6 shows the heat transfer coefficient distribution for some areas of the heating element. The above contour shows the heat transfer coefficient distribution on the wall surface of the undulated plate and the contour below shows the heat transfer coefficient distribution on the wall surface of the corrugated profile. The distribution of the heat transfer coefficient depends on the shape of the undulated plate, plate angle, and pitch 1. In the geometry of undulated plate, a combination of plate angle and undulation angle functions as a rib in a channel. These results are similar to those of previous studies conducted by Cho et al. [30,31,32,33,34,35]. The high value can be understood by analyzing the turbulence intensity in Figure 5. The heat transfer coefficient is high at the point where the turbulence intensity is strong, which depends on the shape. In addition, the impinging point shown in Figure 5 results in a locally high heat transfer coefficient. After the impinging point formation, the flow is turned back, and this also depends on the shape of the plate. It is found that the geometry of the undulated plate is important in parameter setting when optimization is performed. Therefore, the plate angle, undulation angle, and pitch 1, which influenced the flow of the undulated plate, were influenced by the heat transfer coefficient. Figure 7a shows the overall temperature distribution of the GGH rotor. The untreated inlet with hot air and the lower surface with the heated outlet where the cold air is reheating have a relatively higher temperature than the upper surface with the flow of cold air. This can be seen from the analysis according to the height direction, as shown in Figure 7b. The left side of Figure 7b shows the treated region and treated gas flows from the bottom to the upper of the rotor. The blue arrow is a treated gas inlet flow direction and the yellow arrow is a treated gas outlet flow direction. The right side of Figure 7b shows the untreated region and untreated gas flows from the upper to the bottom of the rotor. The red arrow is an untreated gas inlet flow direction and the pink arrow is an untreated gas outlet flow direction. Moreover, the temperature gradient according to the position of the rotation direction is generated according to the rotation direction, as shown in Figure 7c. Solids in the rotor heated in the untreated region gradually cool down to the treated region. The average temperature of the rotor decreases along the axis z from 262.5 mm to −262.5 mm because the outlet gases of both regions are colder than the inlet gases. The lower region near the FGD shows a low temperature distribution owing to the influence of the heat taken by the reheating, the wet desulfurization in the FGD, and the influx of moisture and cold gas. For a more specific analysis, cross sections of the middle span of the rotor are shown, such as A to A and B to B. The A–A plane shows identical temperature contours for both the untreated and treated regions. At the B–B plane, the right side of the figure is cooler than the left side, owing to the change of flow region. The hot gas of the untreated region makes the rotor warm, while the cooled, treated gas decreases the rotor temperature. Figure 7d shows the temperature gradient inside the rotor. Overall, the temperature at the top is hot because the hot flue gas enters the untreated region, is reheated, and then the heated gas exits the duct outlet. It can also be seen that the heat exchange rate is greater inside the rotor than outside of it.
In the inner region, the temperature gradient in the z direction is large, but the temperature difference becomes smaller as the temperature increases toward the outer region. Therefore, it can be deduced that most of the heat exchange takes place in the inner region of the rotor.
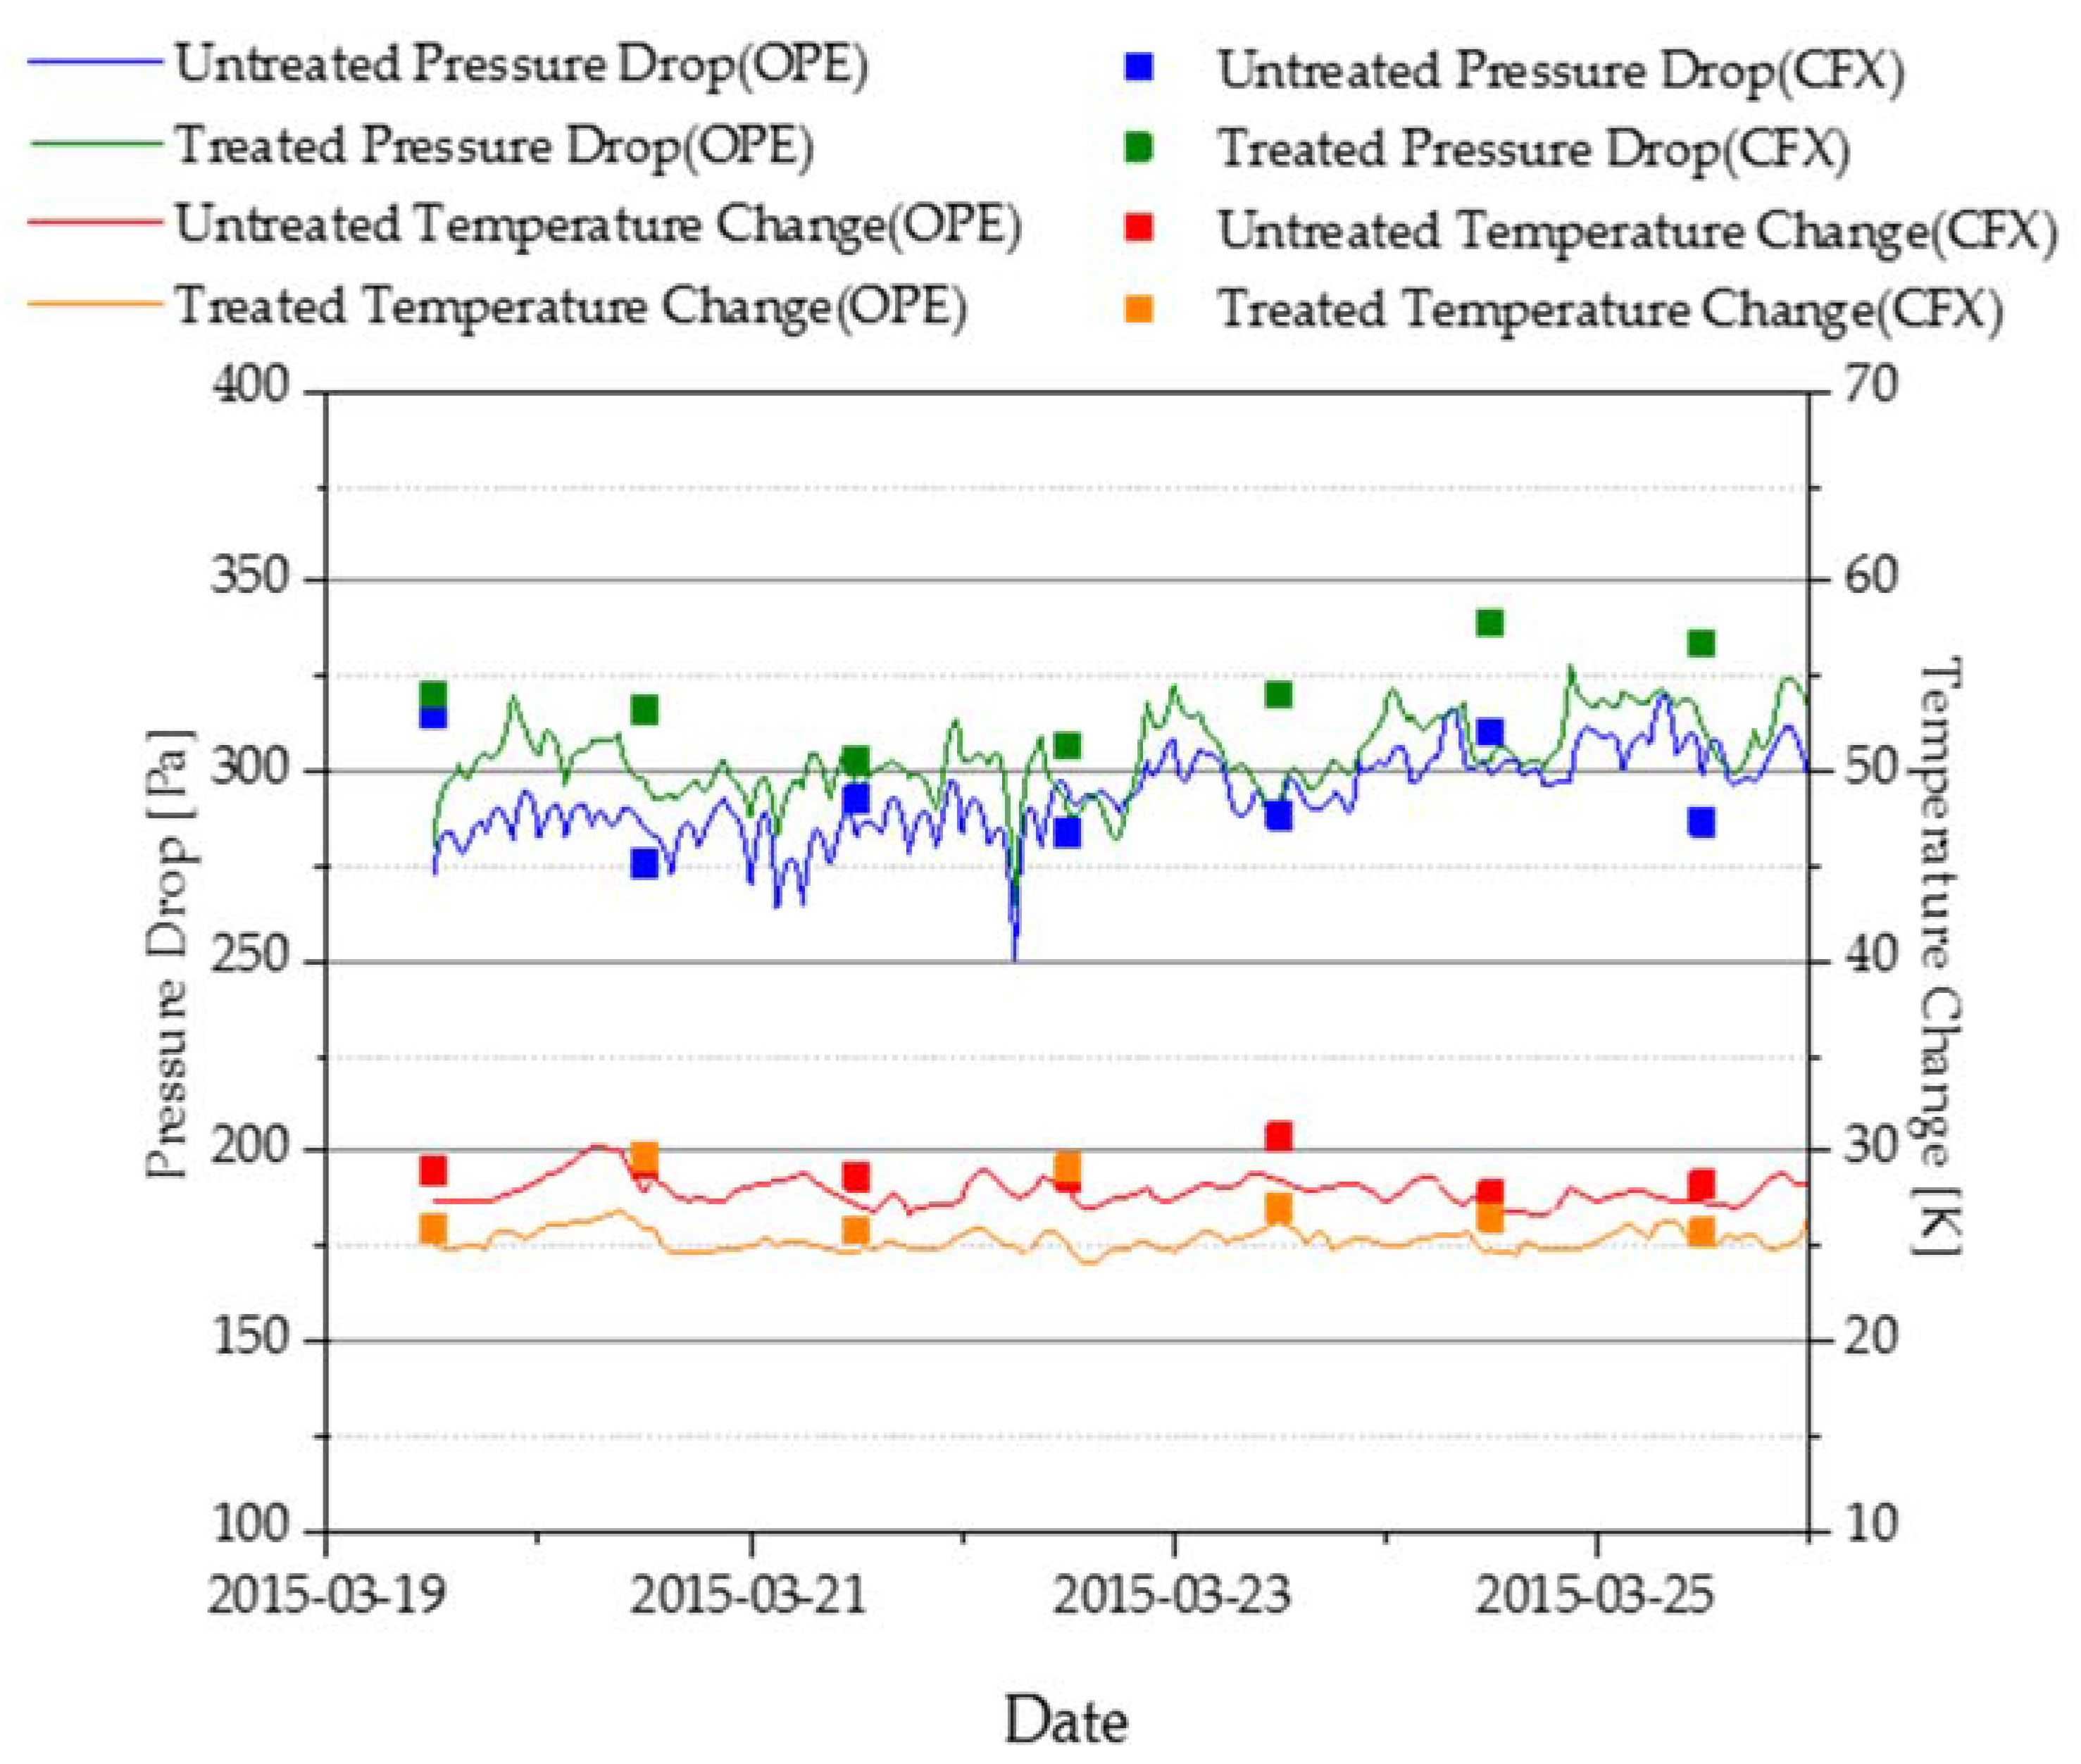
The validation of the GGH system performance using the integrated analysis model was performed with the actual operational data of a Korean coal-fired power plant, as shown in Figure 8. In the validation, the actual operational data of pressure drop and temperature change in the untreated and treated regions, from 20 to 26 March 2015, was utilized. In that period, the measuring equipment stabilized immediately after the heating element replacement owing to overhaul. OPE means the operational data and CFX means the result of numerical analysis.
Because of the validation, it can be seen that the pressure difference does not vary significantly and the temperature variation also follows the same trend. This is because the heat transfer coefficients used in the single heating element analysis are the result of using the average value, which is analyzed as an error caused by the porous analysis. Therefore, it can be solved if the heat transfer coefficient is multiplied by the same value for validation, and it is confirmed that the temperature change is well suited to the actual performance. Therefore, the integrated simulation between the heating element and GGH proposed in this study shows performance prediction capability.
3.2. Optimal Design
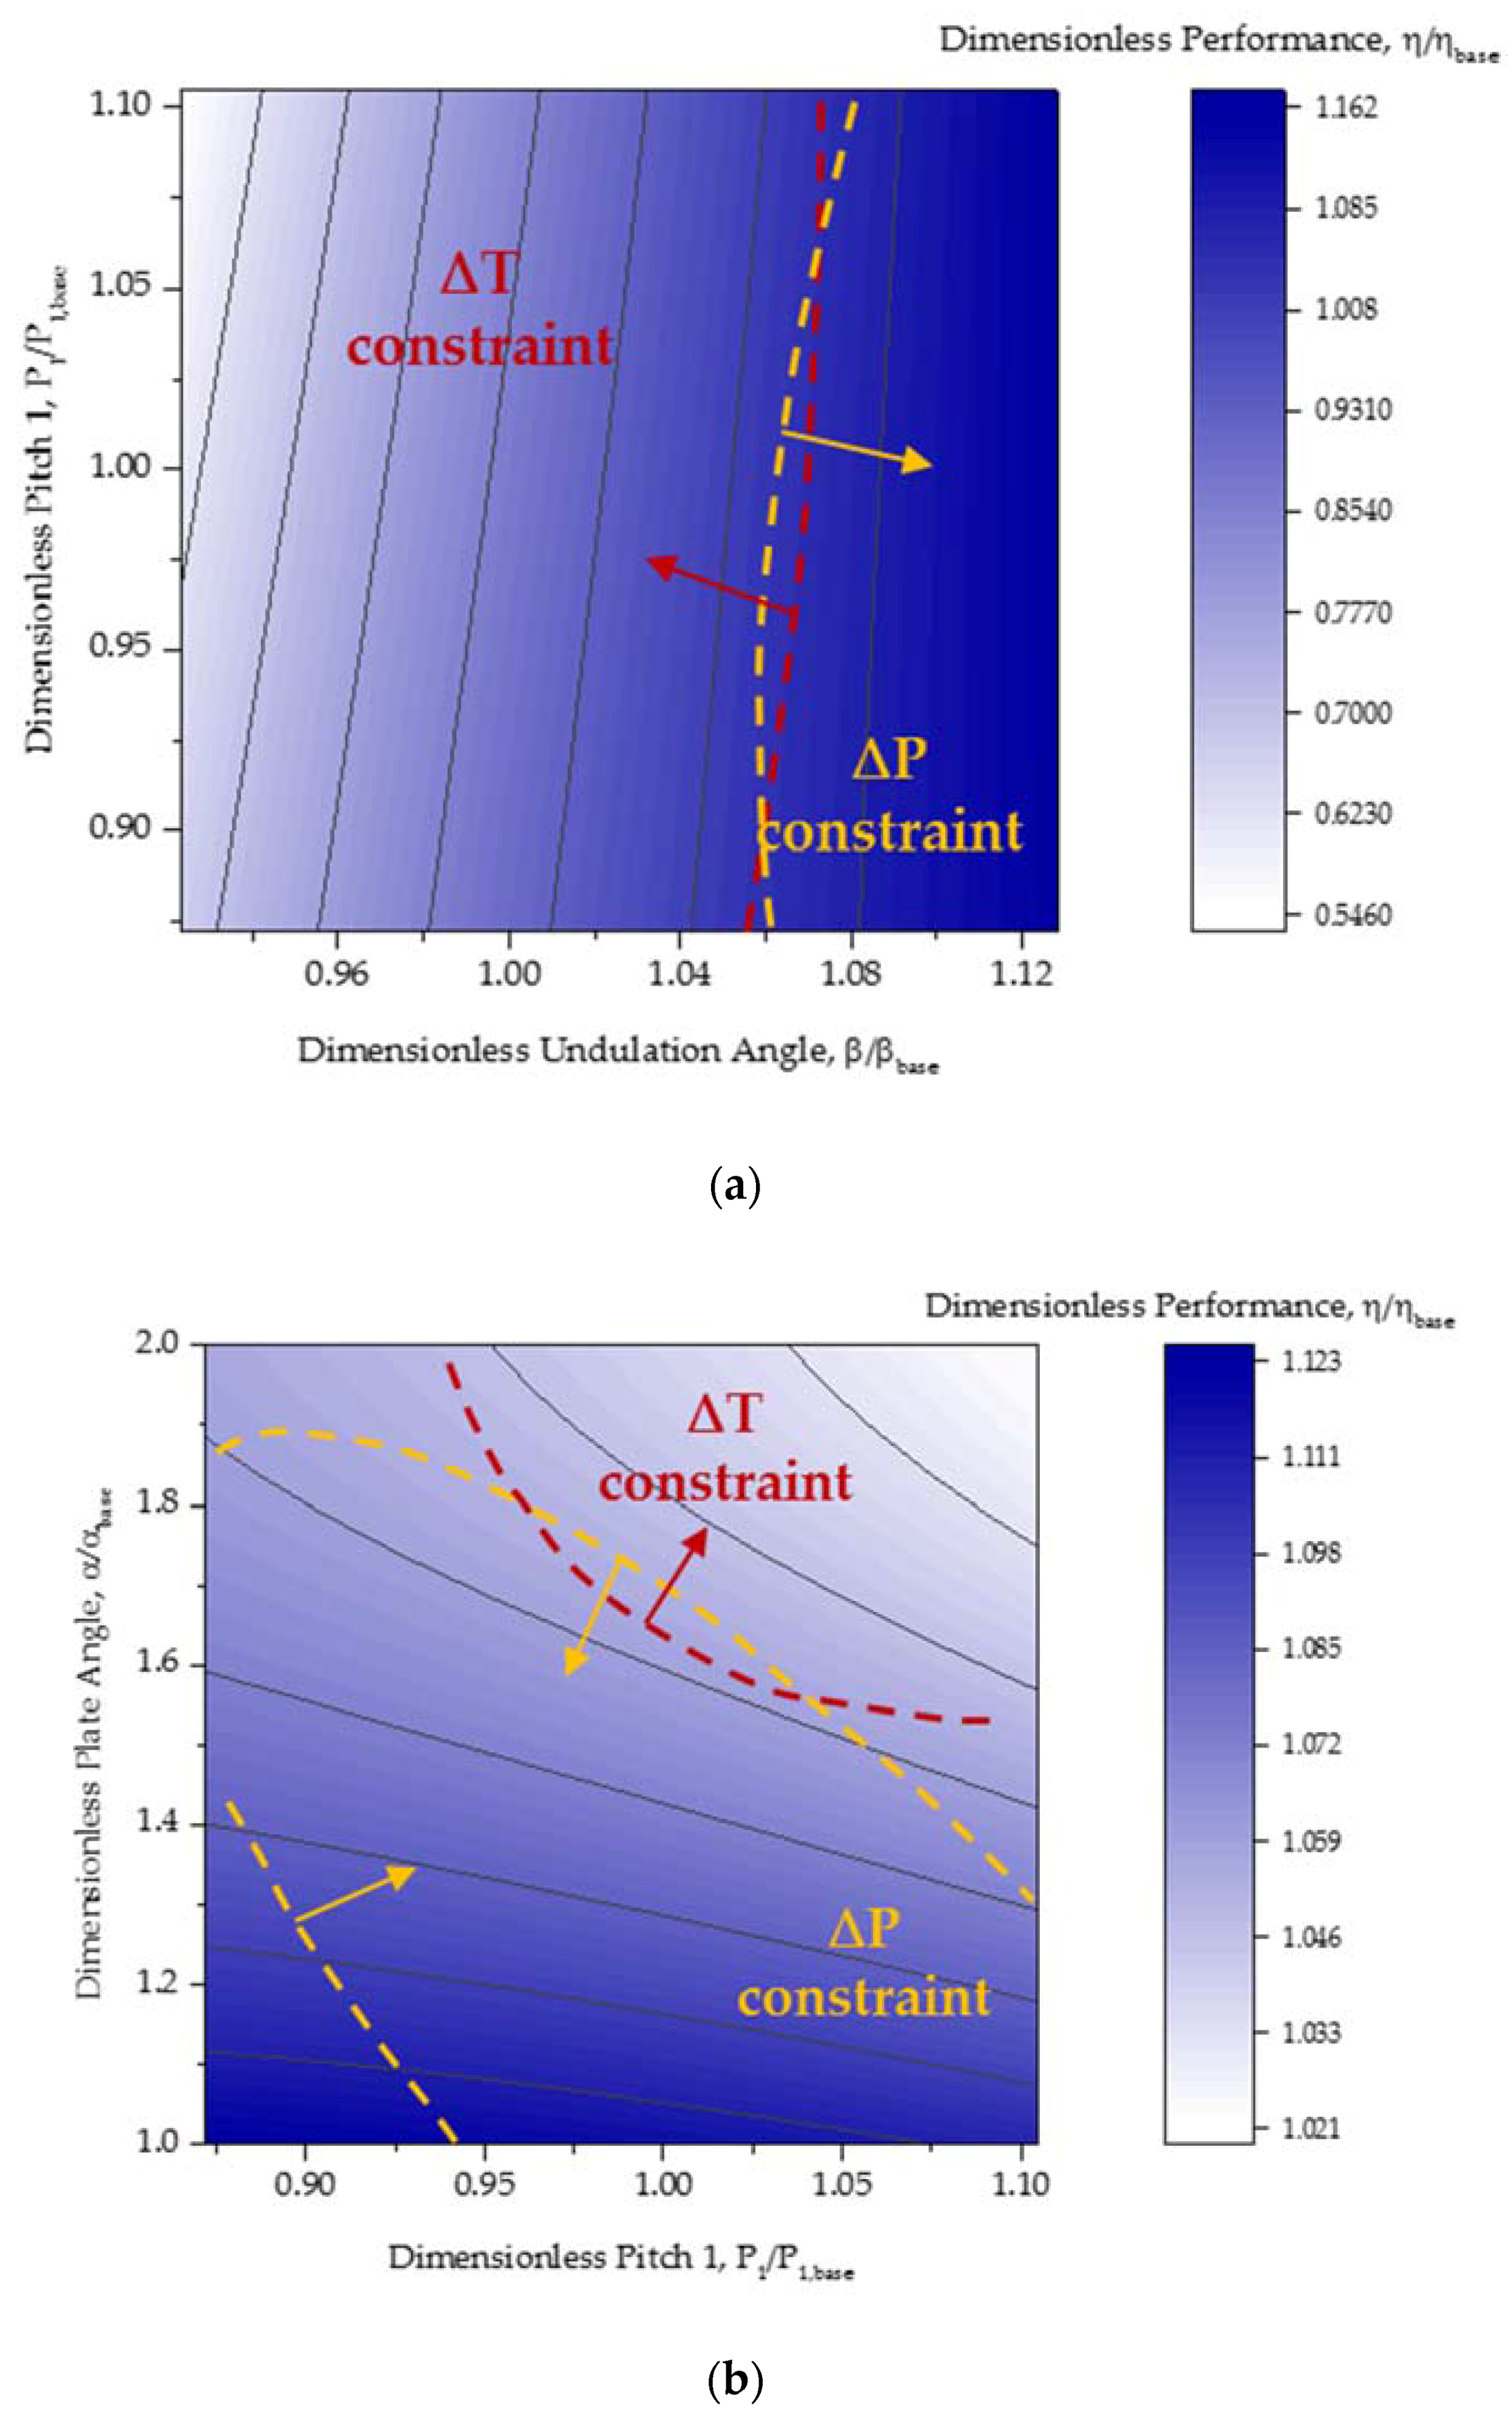
As shown in Figure 9, response surfaces can be drawn from the optimization procedure. The figure shows the dimensionless parameter of the heating element for the GGH performance with constraints of pressure drop and temperature change. Figure 9a shows that the increase of the undulation angle improves the GGH performance but the influence of pitch 1 is relatively insignificant. Figure 9b shows that decreasing pitch 1 and the plate angle improves the GGH performance. Figure 9c shows that increasing the undulation angle and plate angle improves the GGH performance. The polynomial equations for the dimensionless parameters can be obtained by combining the cases as below.
The optimal design of the heating element was obtained from the polynomial equation by considering the constraints of pressure drop and temperature change. All variables were increased, and especially the plate angle was increased by approximately 66%. The undulation angle was increased by approximately 7%, and pitch 1 was increased by 0.6%.
Figure 10 and Figure 11 compare the distribution of heat transfer coefficients and pressure in the undulated plate and corrugated profile for the base and the optimal designs of the heating element. In Figure 10a, the heat transfer coefficient is distributed according to the shape of the plate angle of the undulated plate. In the contour of the corrugated profile, a high heat transfer coefficient occurs near the stagnation point caused by the contact surface of the undulated plate and the corrugated profile, respectively.
Figure 10b shows the pressure distribution in the base and optimal heating element designs. In both cases, the pressure tends to decrease along the y-direction. The pressure drop of the base heating element was found to be larger than that of the optimal heating element.
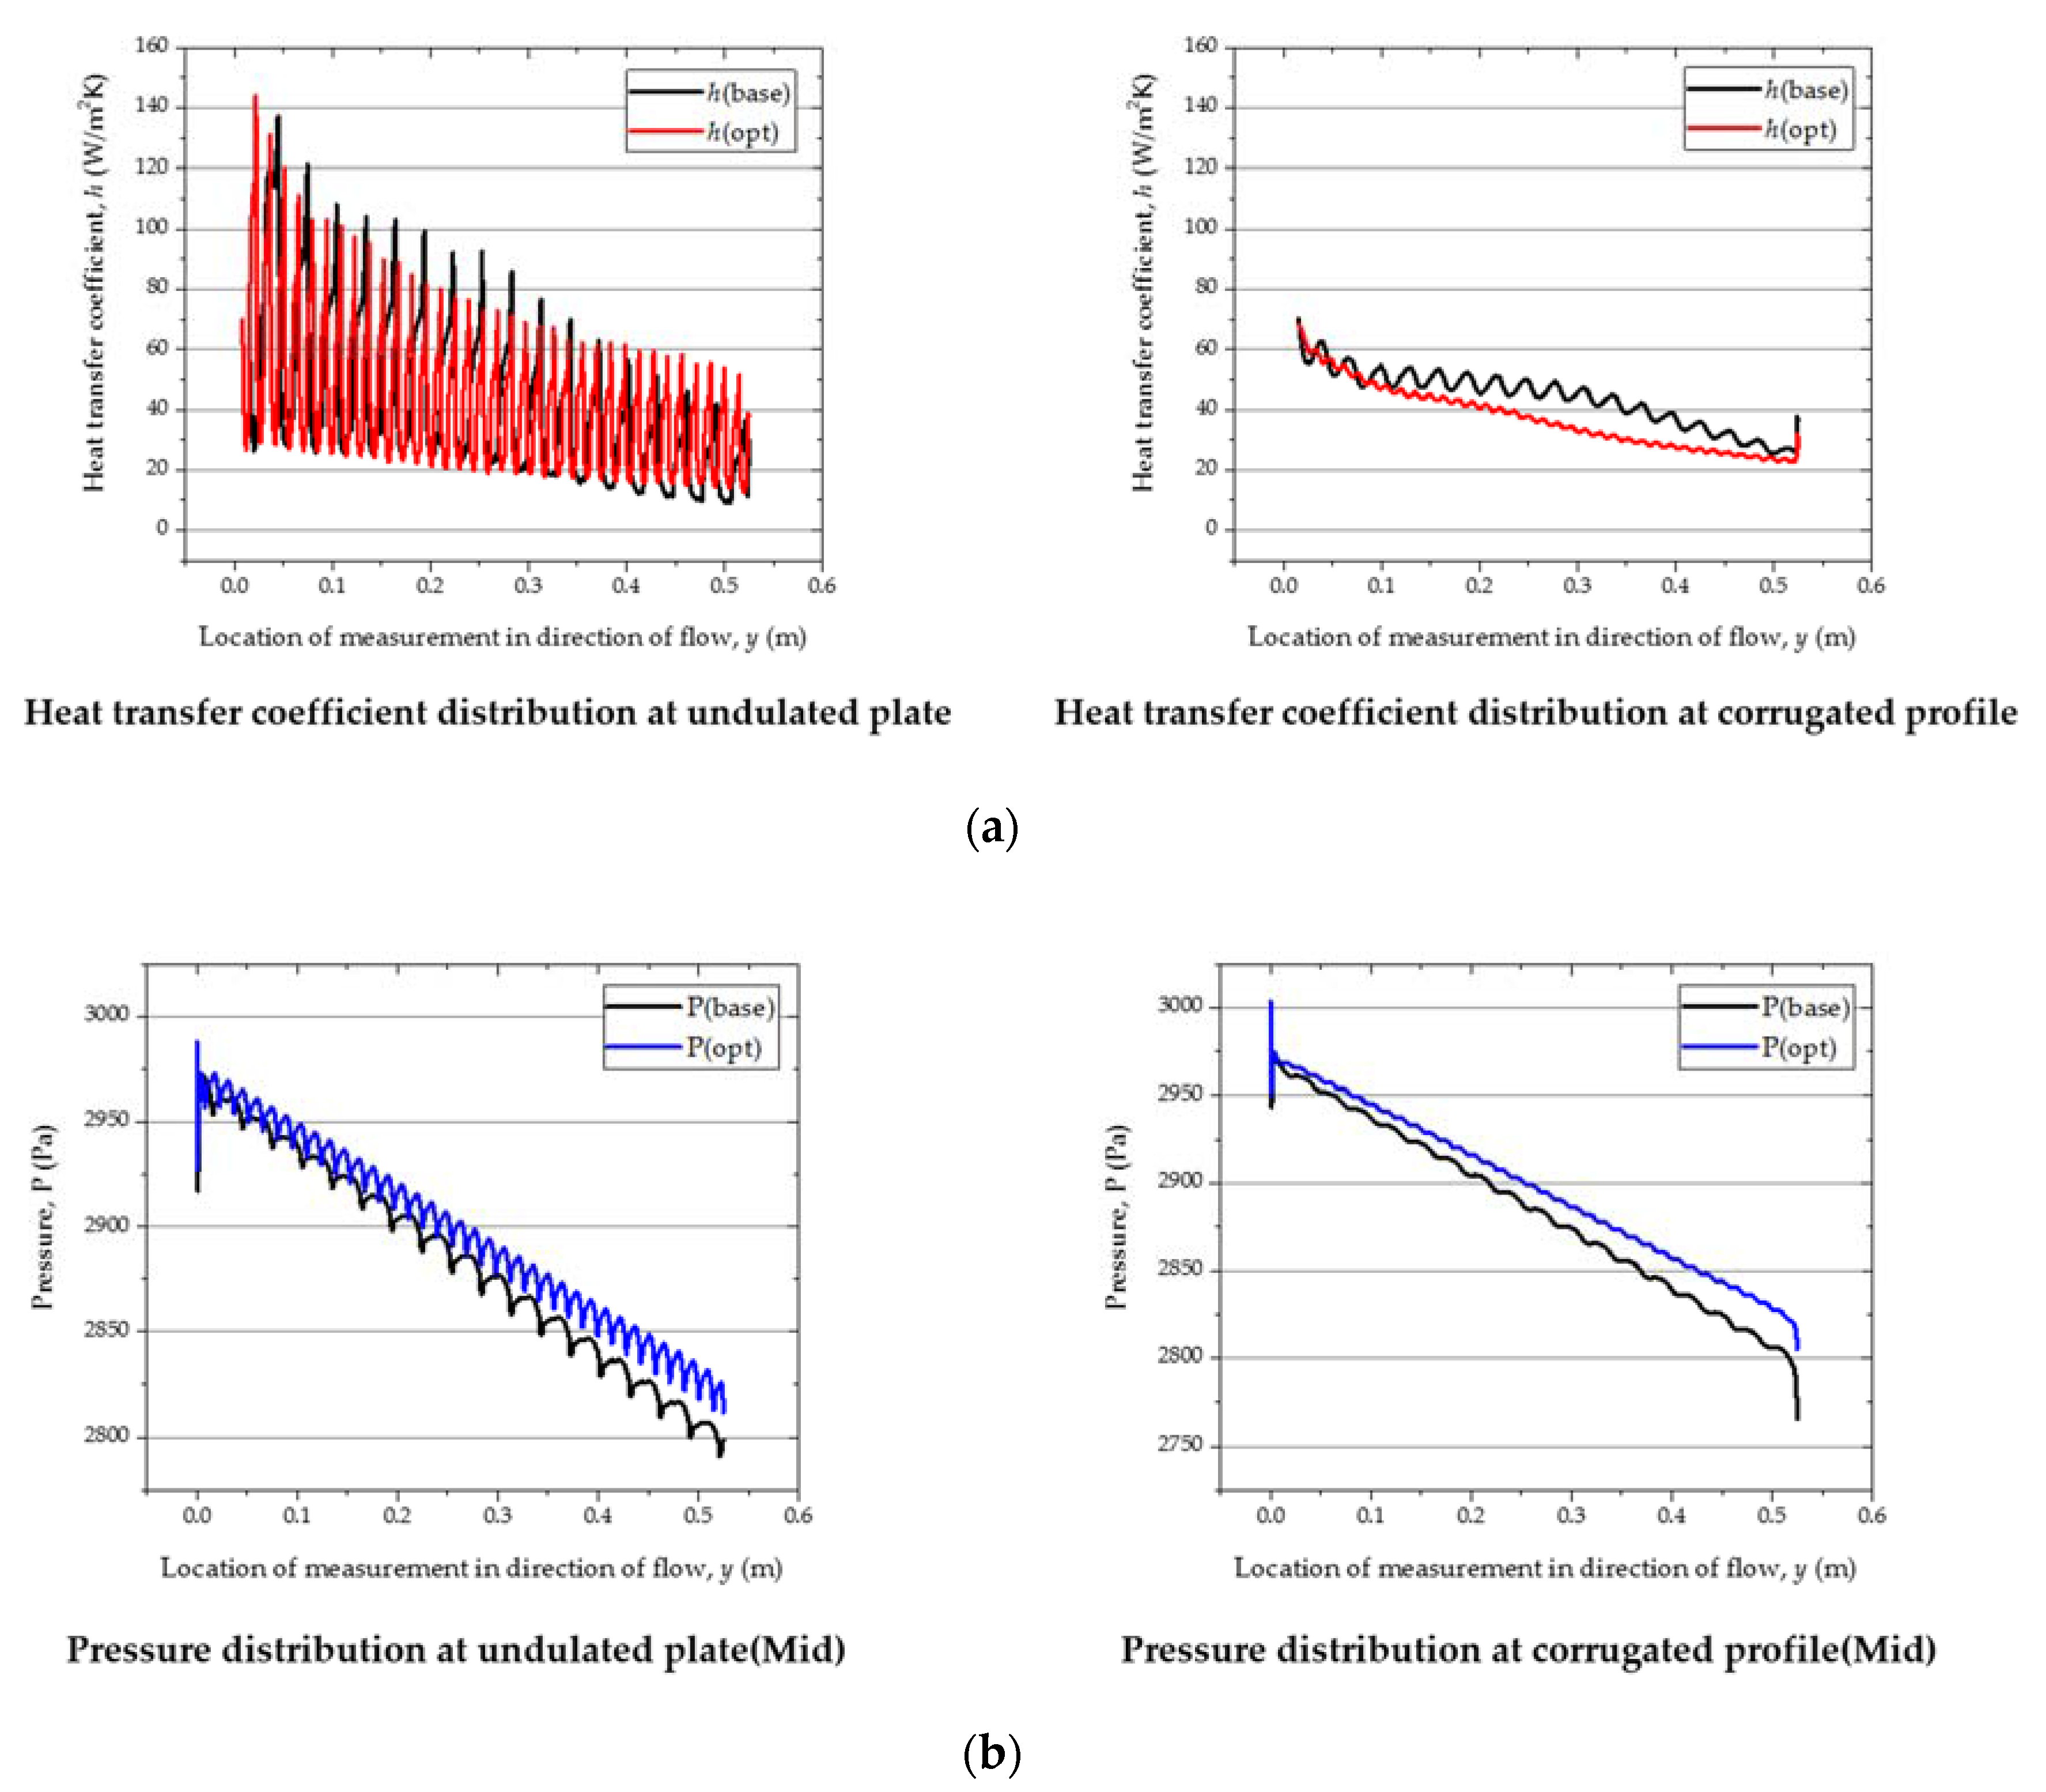
For the quantitative comparison of the heat transfer coefficient and pressure, the local data about the central point of the flow direction of the heating element can be obtained as shown in Figure 11. Figure 11a shows that the heat transfer coefficient tends to oscillate according to the measurement position x in the flow direction. This oscillation is due to the influence of the undulated plate and a result of the complex interaction between the near-wall and rotating flows. The heat transfer coefficient in the optimal design appears to vibrate more than the base design. This is because the plate angle of the optimal design is larger than that of the base design, which causes more undulation and more flow disturbance. Both the base and optimal designs of the heating element have generally a higher heat transfer coefficient on the undulated plate than on the corrugated profile. This is because the turbulence intensity near the undulated plate is higher than that in the corrugated profile, as shown in Figure 5. Owing to the increase of the undulation angle in the optimal design, the flow cross-sectional area becomes wider and the intensity of the rotating flow caused by the near-wall flow becomes weaker. As a result, the heat transfer coefficient of the optimal design is reduced overall compared to the base design. However, the expanded cross-sectional area owing to the change in undulation angle and pitch 1 benefits from the pressure drop because of smooth flow, as shown in Figure 11b. It also shows an oscillation in pressure owing to the effect of the undulated plate. The larger pressure oscillation in the optimal design is owing to the plate angle being larger than the base design, resulting in additional undulation.
Table 3 gives the results of the GGH system using the base heating element and the GGH system using the optimal heating element. Analysis of the thermal-fluid characteristics of the heating element showed that the area-average heat transfer coefficient decreased in the optimal design versus the base design. Moreover, as the pressure drop decreases, the friction coefficient in the optimal design also decreases. Additionally, as the plate angle increases, the heat transfer area increases, and the optimal design of the Interfacial Area Density, IAD and Volume Porosity, VP becomes larger than that of the base design. Because of substituting the single element simulation results of the optimal heating element into the GGH rotor, the differential pressure decreased in both the untreated and treated regions.
This is because the friction coefficient of the optimal design is smaller. In terms of pressure drop, it is better to use the optimal design, but it is better to use the base design in terms of temperature change. It can be seen that the temperature change is larger in the GGH using the base design than when using the optimal design. This is because the heat transfer coefficient of the base design is larger. However, the difference in temperature change is not large because the heat transfer area is increased in the optimal design, which reduces the heat transfer coefficient reduction effect owing to the decrease in the heat transfer coefficient. Consequently, the performance of the GGH system using the optimal design was improved by approximately 7.7%, because of the reduction effect of the pressure drop.
4. Conclusions
In this study, optimization of heating element shape was performed to improve the performance of the GGH system. For this purpose, an integrated analysis model was used to build a GGH system performance prediction method considering the heating elements, and verification with the actual operational data of a coal power plant was carried out. The four input variables, namely the friction coefficient, heat transfer coefficient, interfacial area density, and volume porosity of the porous GGH system rotor were obtained from the single channel simulation result of the heating element, with specific variables under constraints. The four variables were inputs to the GGH rotor, and a simulation was performed on the GGH to calculate the performance. The plate angle, undulation angle, and pitch 1 were selected as the parameters of the heating element. The four input variables including friction coefficient, heat transfer coefficient, interfacial area density, and volume porosity were changed according to the geometrical parameters which are the plate angle, undulation angle, and pitch 1. Then, the performance of the GGH system changed accordingly. A total of 27 samples was constructed and a numerical analysis was performed for each sample. We optimized the response surface through kriging and found an optimal heating element with a pitch 1 similar to the base, with a plate angle 66% larger, and an undulation angle 7% larger than the base design. The GGH system with the optimal design showed a 10% decrease in pressure drop, relative to the base design, on the untreated region and a 2% decrease in temperature change. We also showed a 6% reduction in pressure drop versus the base design in the treated region and a 1% decrease in the temperature change. From this, we determined that the performance of the GGH system improved by approximately 7%.
By increasing the plate angle of the heating element, it is possible to improve the performance of the GGH system, by reducing the undulation angle while increasing the heat transfer area, and by increasing pitch 1 to increase the cross-sectional area of the flow. Using the procedure employed in this study, it is possible to optimize the GGH system performance with a different type of heating element and duct system for both Ljungstrom and Rothemuhle type GGH.
Acknowledgments
This work was supported by the Korea South-East Power Co., Ltd. (KOEN). This work was also supported by the human resources development program of the Korea Institute of Energy Technology Evaluation and Planning grant funded by the Korean government Ministry of Trade, Industry and Energy (No. 20174030201720).
Author Contributions
Young Mun Lee, Heeyoon Chung, Seon Ho Kim, and Hyeng Sub Bae designed and conducted numerical analysis. Hyung Hee Cho guided writing the manuscript and contributed to analysis. All authors analyzed the numerical results. All authors discussed the data and commented on the manuscript.
Conflicts of Interest
The authors declare no conflict of interest.
Nomenclature
| FGD | flue gas desulfurization system |
| GGH | gas-gas heater |
| Re | Reynolds number |
| u | average velocity of main flow (m/s) |
| hydraulic diameter (m) | |
| RANS | Reynolds averaged Navier-Stokes equations |
| mass flow rate (kg/s) | |
| mass flow rate of untreated region in GGH (kg/s) | |
| the area of heating element’s outlet (m2) | |
| cross section of GGH (m2) | |
| Sm | momentum source (Pa/m) |
| CR1 | linear resistance coefficient (kg/m3) |
| CR2 | quadratic resistance coefficient (kg/m4) |
| U | fluid velocity (m/s) |
| ℎ | heat transfer coefficient between fluid and solid (W/m2 K) |
| K | area porosity tensor (m2/K s) |
| mean total enthalpy (J) | |
| Γe | effective diffusivity (m2/s) |
| S | source term (kg W/m K s) |
| pressure drop (Pa) | |
| length of heating element (mm) | |
| average velocity of fluid at inlet (m/s) | |
| heat flux (W/m2) | |
| temperature (K) | |
| bulk mean temperature (K) | |
| interfacial area density (1/m) | |
| volume porosity | |
| area of solid part in single heating element (m2) | |
| volume of fluid part in single heating element (m3) | |
| sum of the volume for fluid and solid in element(m3) | |
| heat transfer rate (W) | |
| pumping power (W) | |
| mass flow rate through the rotor (kg/s) | |
| heat capacity of fluid (J/kg K) | |
| volume flow rate (m3/s) | |
| RSM | response surface method |
| CCD | center composite design |
| LHS | latin hypercube sampling method |
| OLHS | optimal latin hypercube sampling method |
| P1 | pitch 1 (mm) |
| P2 | pitch 2 (mm) |
| t | thickness (mm) |
| H | height of corrugated profile (mm) |
| fluctuation of velocity (m/s) | |
| initial time (s) | |
| final time (s) | |
| non-dimensional plate angle | |
| non-dimensional undulation angle | |
| non-dimensional pitch 1 | |
| area average heat transfer coefficient | |
| average performance | |
| x | coordinate in the x-direction |
| y | coordinate in the y-direction |
| z | coordinate in the z-direction |
| Greek Symbols | |
| density (kg/m3) | |
| viscosity (Pa s) | |
| γ | volume porosity |
| performance of GGH | |
| α | plate angle (°) |
| β | undulation angle (°) |
References
- Han, Y.; Xu, C.; Xu, G.; Zhang, Y.; Yang, Y. An Improved Flexible Solar Thermal Energy Integration Process for Enhancing the Coal-Based Energy Efficiency and NOx Removal Effectiveness in Coal-Fired Power Plants under Different Load Conditions. Energies 2017, 10, 1485. [Google Scholar] [CrossRef]
- Nolan, P.S. Flue gas desulfurization technologies for coal-fired power plants. In Proceedings of the Coal-Tech 2000 International Conference, Jakarta, Indonesia, 13 November 2000; Jiang, M.X., Ed.; The Babcock & Wilcox Company: Barberton, OH, USA, 2000. [Google Scholar]
- Stasiekn, J.; Collins, M.W.; Ciofalo, M.; Chew, P.E. Investigation of flow and heat transfer in corrugated passages-1. Experimental results. Int. J. Heat Mass Transf. 1996, 39, 149–164. [Google Scholar] [CrossRef]
- Mallikarjuna, V.; Jashuva, N.; Reddy, B. Improving boiler efficiency by using air preheater. Int. J. Adv. Res. Eng. Appl. Sci. 2014, 3, 11–24. [Google Scholar]
- Choi, S.; Park, J.; Sohn, H.-S.; Kim, S.; Cho, H. Thermal Characteristics of Tube Bundles in Ultra-Supercritical Boilers. Energies 2016, 9, 779. [Google Scholar] [CrossRef]
- Pan, P.; Chen, H.; Liang, Z.; Zhao, Q. Experimental study on corrosion of steels for flue gas reheaters in a coal-fired power plant. Appl. Therm. Eng. 2016. [Google Scholar] [CrossRef]
- Chen, H.; Pan, P.; Shao, H.; Wang, Y.; Zhao, Q. Corrosion and viscous ash deposition of a rotary air preheater in a coal-fired power plant. Appl. Therm. Eng. 2017, 113, 373–385. [Google Scholar] [CrossRef]
- Massoudi, M.; Kim, J.; Wang, P. On the Heat Flux Vector and Thermal Conductivity of Slags: A Brief Review. Energies 2016, 9, 27. [Google Scholar] [CrossRef]
- Wang, P.; Massoudi, M. Slag Behavior in Gasifiers Part I: Influence of Coal Properties and Gasification Conditions. Energies 2013, 6, 784–806. [Google Scholar] [CrossRef]
- Yan, M.; Fu, P.; Chen, Q.; Wang, Q.; Zeng, M.; Pandit, J. Electrical Performance and Carbon Deposition Differences between the Bi-Layer Interconnector and Conventional Straight Interconnector Solid Oxide Fuel Cell. Energies 2014, 7, 4601–4613. [Google Scholar] [CrossRef]
- Kazi, S.N. Fouling and Fouling Mitigation on Heat Exchanger Surfaces; INTECH Open Access Publisher: Rijeka, Croatia, 2012. [Google Scholar]
- Ciofalo, M.I.; Stasiek, J.; Collins, M.W. Investigation of flow and heat transfer in corrugated passages-2. Numerical simulations. Int. J. Heat Mass Transf. 1996, 39, 165–192. [Google Scholar] [CrossRef]
- Vulloju, S. Analysis of Performance of Ljungstrom Air Preheater Elements. Int. J. Curr. Eng. Technol. 2013, 2501–2505. [Google Scholar] [CrossRef]
- Guo-Yan, Z.; Shan-Tung, T.; Hu-Gen, M. Numerical and Experimental Study on the Heat Transfer and Pressure Drop of Compact Cross-Corrugated Recuperators. J. Heat Transf. 2014, 136, 071801. [Google Scholar] [CrossRef]
- Hwang, S.D.; Jang, I.H.; Cho, H.H. Experimental study on flow and local heat/mass transfer characteristics inside corrugated duct. Int. J. Heat Fluid Flow 2006, 27, 21–32. [Google Scholar] [CrossRef]
- Kwon, H.G.; Hwang, S.D.; Cho, H.H. Flow and heat/mass transfer in a wavy duct with various corrugation angles in two dimensional flow regimes. Heat Mass Transf. 2008, 45, 157–165. [Google Scholar] [CrossRef]
- Hwang, S.D.; Kwon, H.G.; Cho, H.H. Heat transfer with dimple/protrusion arrays in a rectangular duct with a low Reynolds number range. Int. J. Heat Fluid Flow 2008, 29, 916–926. [Google Scholar] [CrossRef]
- Wang, H.Y.; Zhao, L.L.; Xu, Z.G.; Chun, W.G.; Kim, H.T. The study on heat transfer model of tri-sectional rotary air preheater based on the semi-analytical method. Appl. Therm. Eng. 2008, 28, 1882–1888. [Google Scholar] [CrossRef]
- Sanaye, S.; Jafari, S.; Ghaebi, H. Optimum operational conditions of a rotary regenerator using genetic algorithm. Energy Build. 2008, 40, 1637–1642. [Google Scholar] [CrossRef]
- Cai, M.; Hui, S.E.; Wang, X.; Zhao, S.; He, S. A study on the direct leakage of rotary air preheater with multiple seals. Appl. Therm. Eng. 2013, 59, 576–586. [Google Scholar] [CrossRef]
- Maharaj, A.; Schmitz, W.; Naidoo, R.; Jestin, L.; Fuls, W.; Pronobis, M. A numerical study of air preheater leakage. Energy 2015, 92, 87–99. [Google Scholar] [CrossRef]
- Heidari-Kaydan, A.; Hajidavalloo, E. Three-dimensional simulation of rotary air preheater in steam power plant. Appl. Therm. Eng. 2014, 73, 399–407. [Google Scholar] [CrossRef]
- Dallaire, J.; Gosselin, L.; da Silva, A.K. Conceptual optimization of a rotary heat exchanger with a porous core. Int. J. Therm. Sci. 2010, 49, 454–462. [Google Scholar] [CrossRef]
- Alhusseny, A.; Turan, A. An effective engineering computational procedure to analyse and design rotary regenerators using a porous media approach. Int. J. Heat Mass Transf. 2016, 95, 593–605. [Google Scholar] [CrossRef]
- Lee, Y.M.; Chung, H.; Kim, S.H.; Bae, H.S.; Cho, H.H. Optimal Design of Heating Element to Enhance Thermal Performance in Gas-Gas Heater. In Proceedings of the 2nd Thermal and Fluid Engineering Conference and 4th International Workshop on Heat Transfer, Las Vegas, NV, USA, 2–5 April 2017; pp. 3383–3386. [Google Scholar]
- Myers, R.H.; Montgomery, D.C.; Anderson-Cook, C.M. Response Surface Methodology: Process and Product Optimization Using Designed Experiments, 3rd ed.; Wiley Series in Probability and Statistics; Wiley: Hoboken, NJ, USA, 2009; ISBN 978-0-470-17446-3. [Google Scholar]
- Lautenschlager, U.; Eschenauer, H.A.; Mistree, F. Design-of-Experiments Methods and their Application to Robust Multicriteria Optimization Problems. ZAMM-J. Appl. Math. Mech. Z. Angew. Math. Mech. 1999, 79, 71–74. [Google Scholar] [CrossRef]
- McKay, M.D. Latin hypercube sampling as a tool in uncertainty analysis of computer models. In Proceedings of the 24th conference on Winter simulation, New Orleans, LA, USA, 9–12 December 1990; pp. 557–564. [Google Scholar]
- Van der Velden, A.; Koch, P. Isight design optimization methodologies. ASM Handb. 2010, 22, 79. [Google Scholar]
- Cho, H.-H.; Kim, Y.Y.; Rhee, D.-H.; Lee, S.Y.; Wu, S.J.; Choi, C.K. The effects of gap position in discrete ribs on local heat/mass transfer in a square duct. J. Enhanc. Heat Transf. 2003, 10, 287–300. [Google Scholar] [CrossRef]
- Cho, H.H.; Lee, S.Y.; Rhee, D.H. Effects of cross ribs on heat/mass transfer in a two-pass rotating duct. Heat Mass Transf. 2004, 40, 743–755. [Google Scholar] [CrossRef]
- Kim, K.M.; Kim, S.I.; Jeon, Y.H.; Lee, D.H.; Cho, H.H. Detailed Heat/Mass Transfer Distributions in a Rotating Smooth Channel with Bleed Flow. J. Heat Transf. 2007, 129, 1538. [Google Scholar] [CrossRef]
- Kim, K.M.; Lee, D.H.; Cho, H.H. Pressure drop and thermal performance in rotating two-pass ducts with various cross rib arrangements. Heat Mass Transf. 2008, 44, 913–919. [Google Scholar] [CrossRef]
- Park, J.S.; Kim, K.M.; Lee, D.H.; Cho, H.H.; Chyu, M. Heat Transfer in Rotating Channel With Inclined Pin-Fins. J. Turbomach. 2011, 133, 021003. [Google Scholar] [CrossRef]
- Chung, H.; Park, J.S.; Park, S.; Choi, S.M.; Rhee, D.-H.; Cho, H.H. Augmented heat transfer with intersecting rib in rectangular channels having different aspect ratios. Int. J. Heat Mass Transf. 2015, 88, 357–367. [Google Scholar] [CrossRef]
Figure 1.
(a) Overall scheme of coal power plant duct system with flue-gas desulfurization system (FGD) and rotary heat exchanger for gas reheating; (b) detailed composition of gas-gas heater (GGH) and its flow region (untreated region and treated region).
Figure 1.
(a) Overall scheme of coal power plant duct system with flue-gas desulfurization system (FGD) and rotary heat exchanger for gas reheating; (b) detailed composition of gas-gas heater (GGH) and its flow region (untreated region and treated region).

Figure 2.
Integrated analysis method to calculate the performance of the gas-gas heater (GGH) system from the simulation result of the heating element.
Figure 2.
Integrated analysis method to calculate the performance of the gas-gas heater (GGH) system from the simulation result of the heating element.
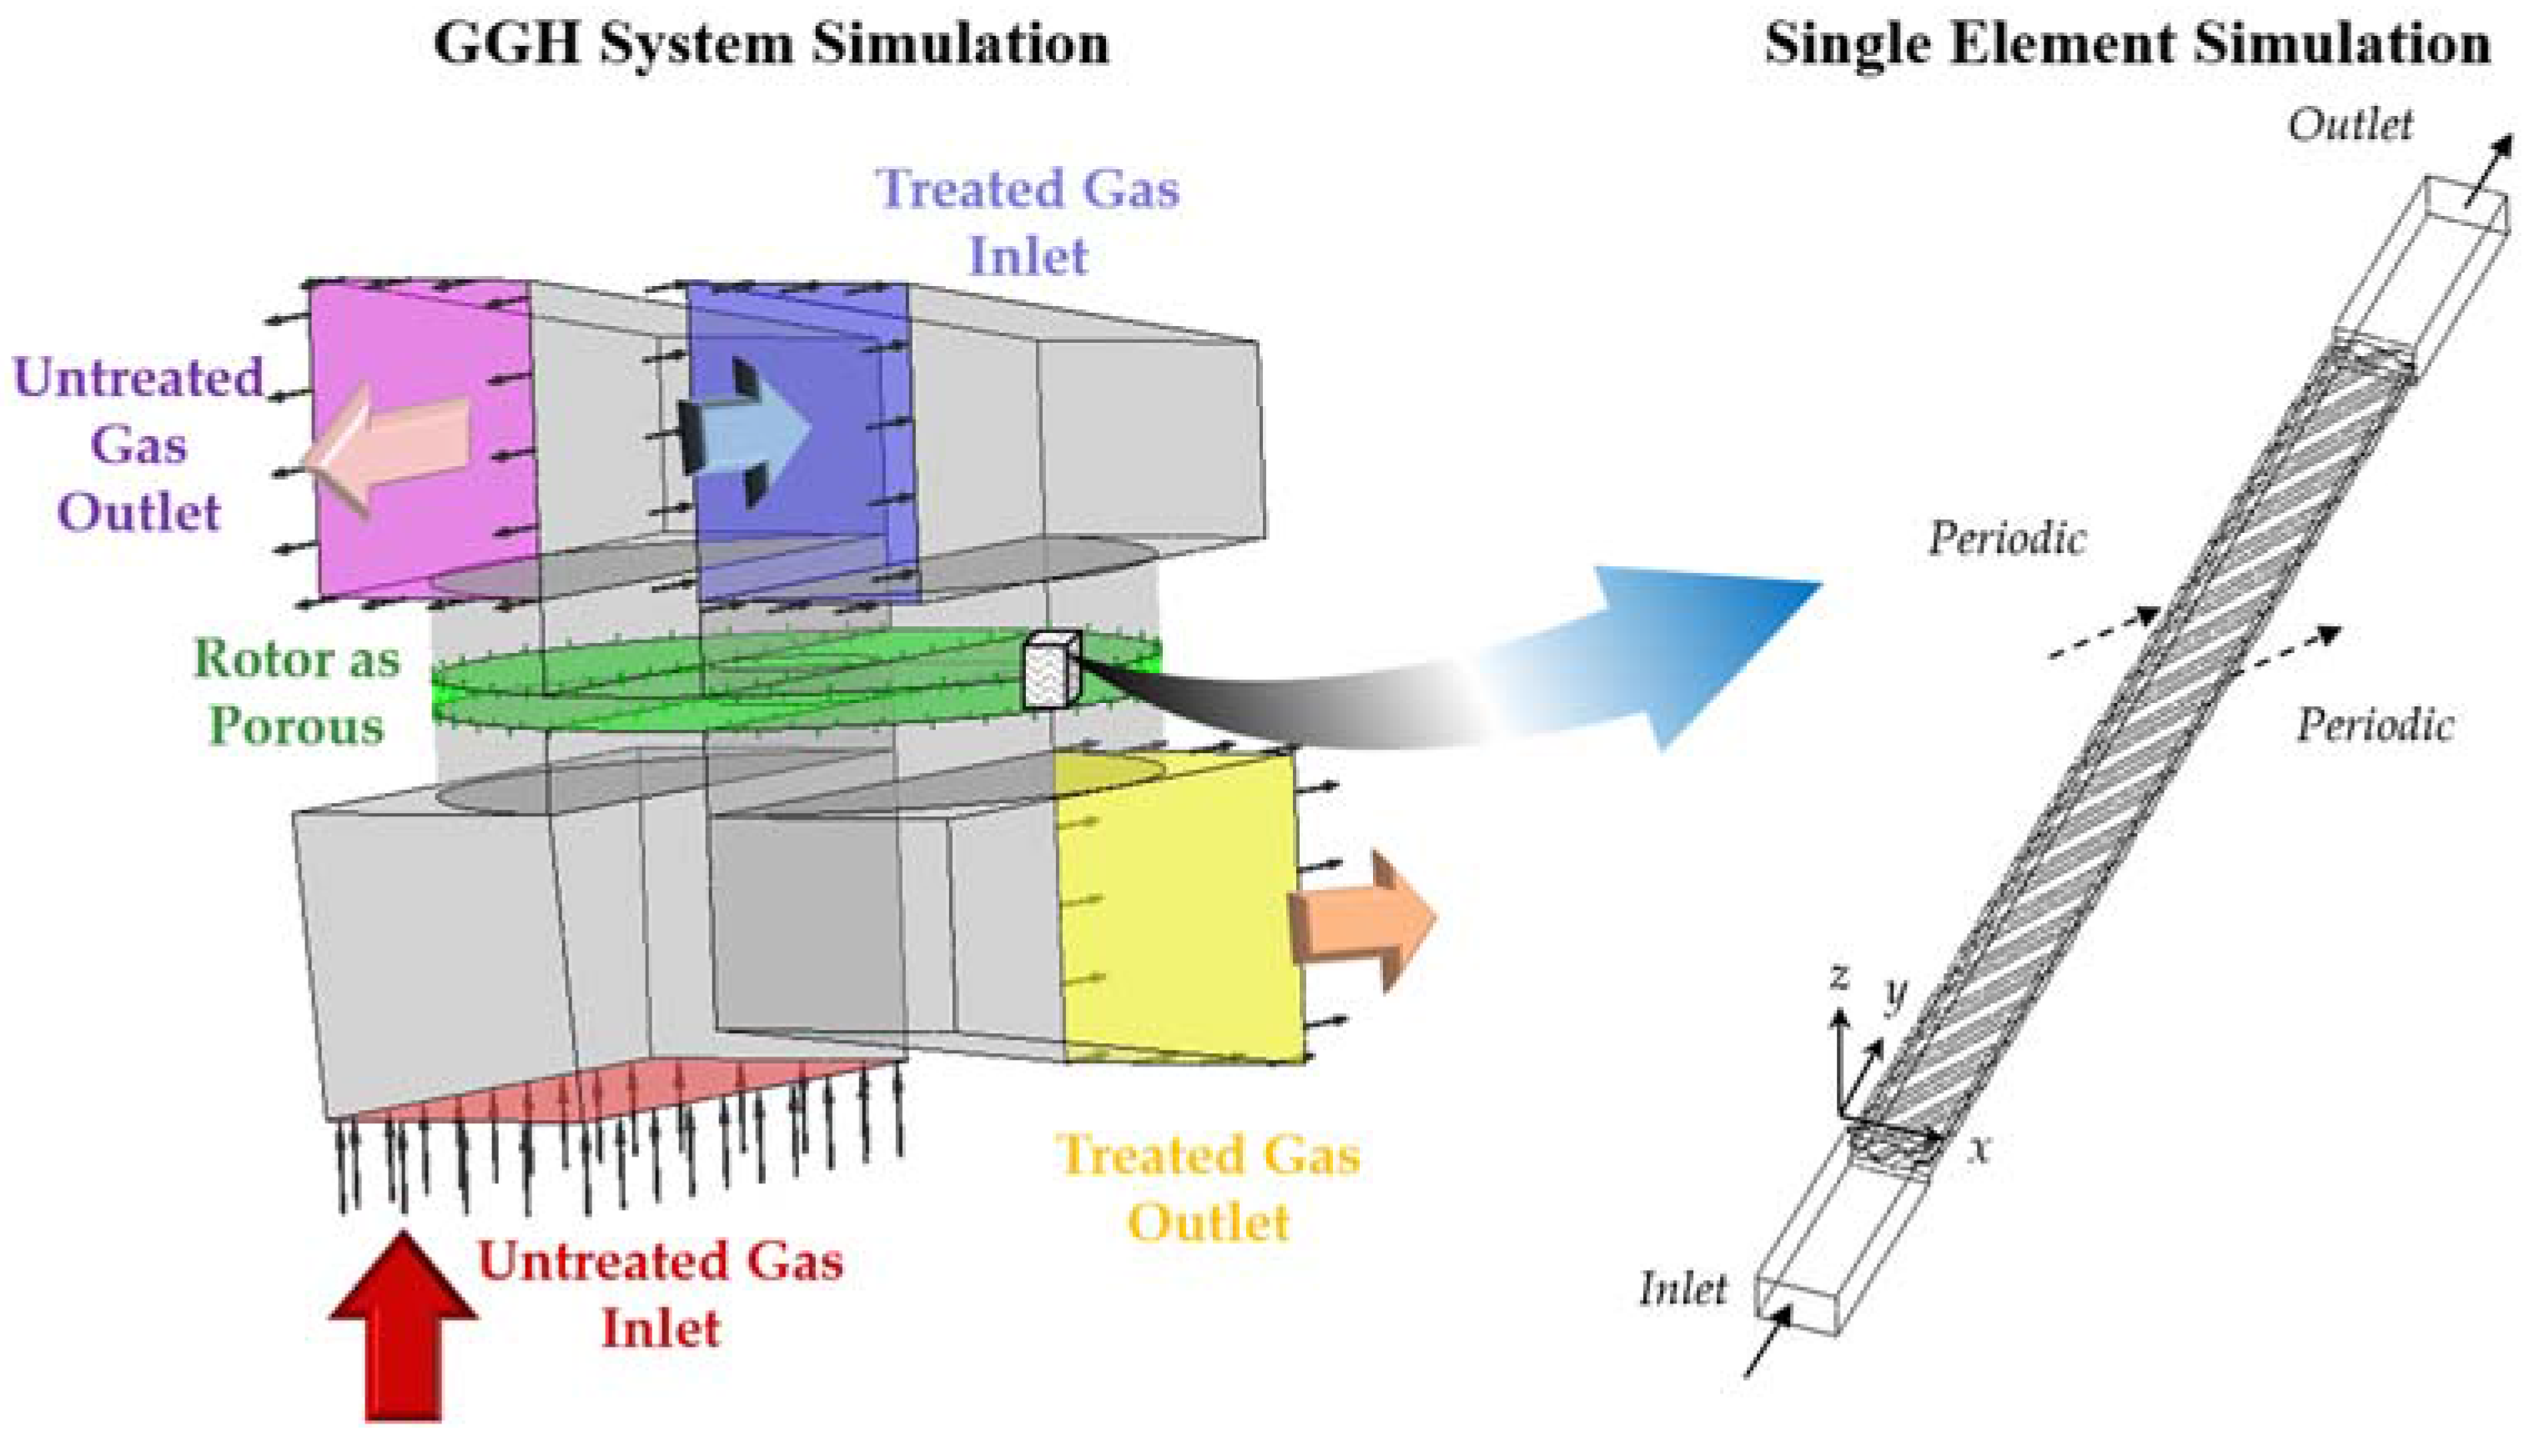
Figure 3.
Optimization procedure with integrated analysis model.
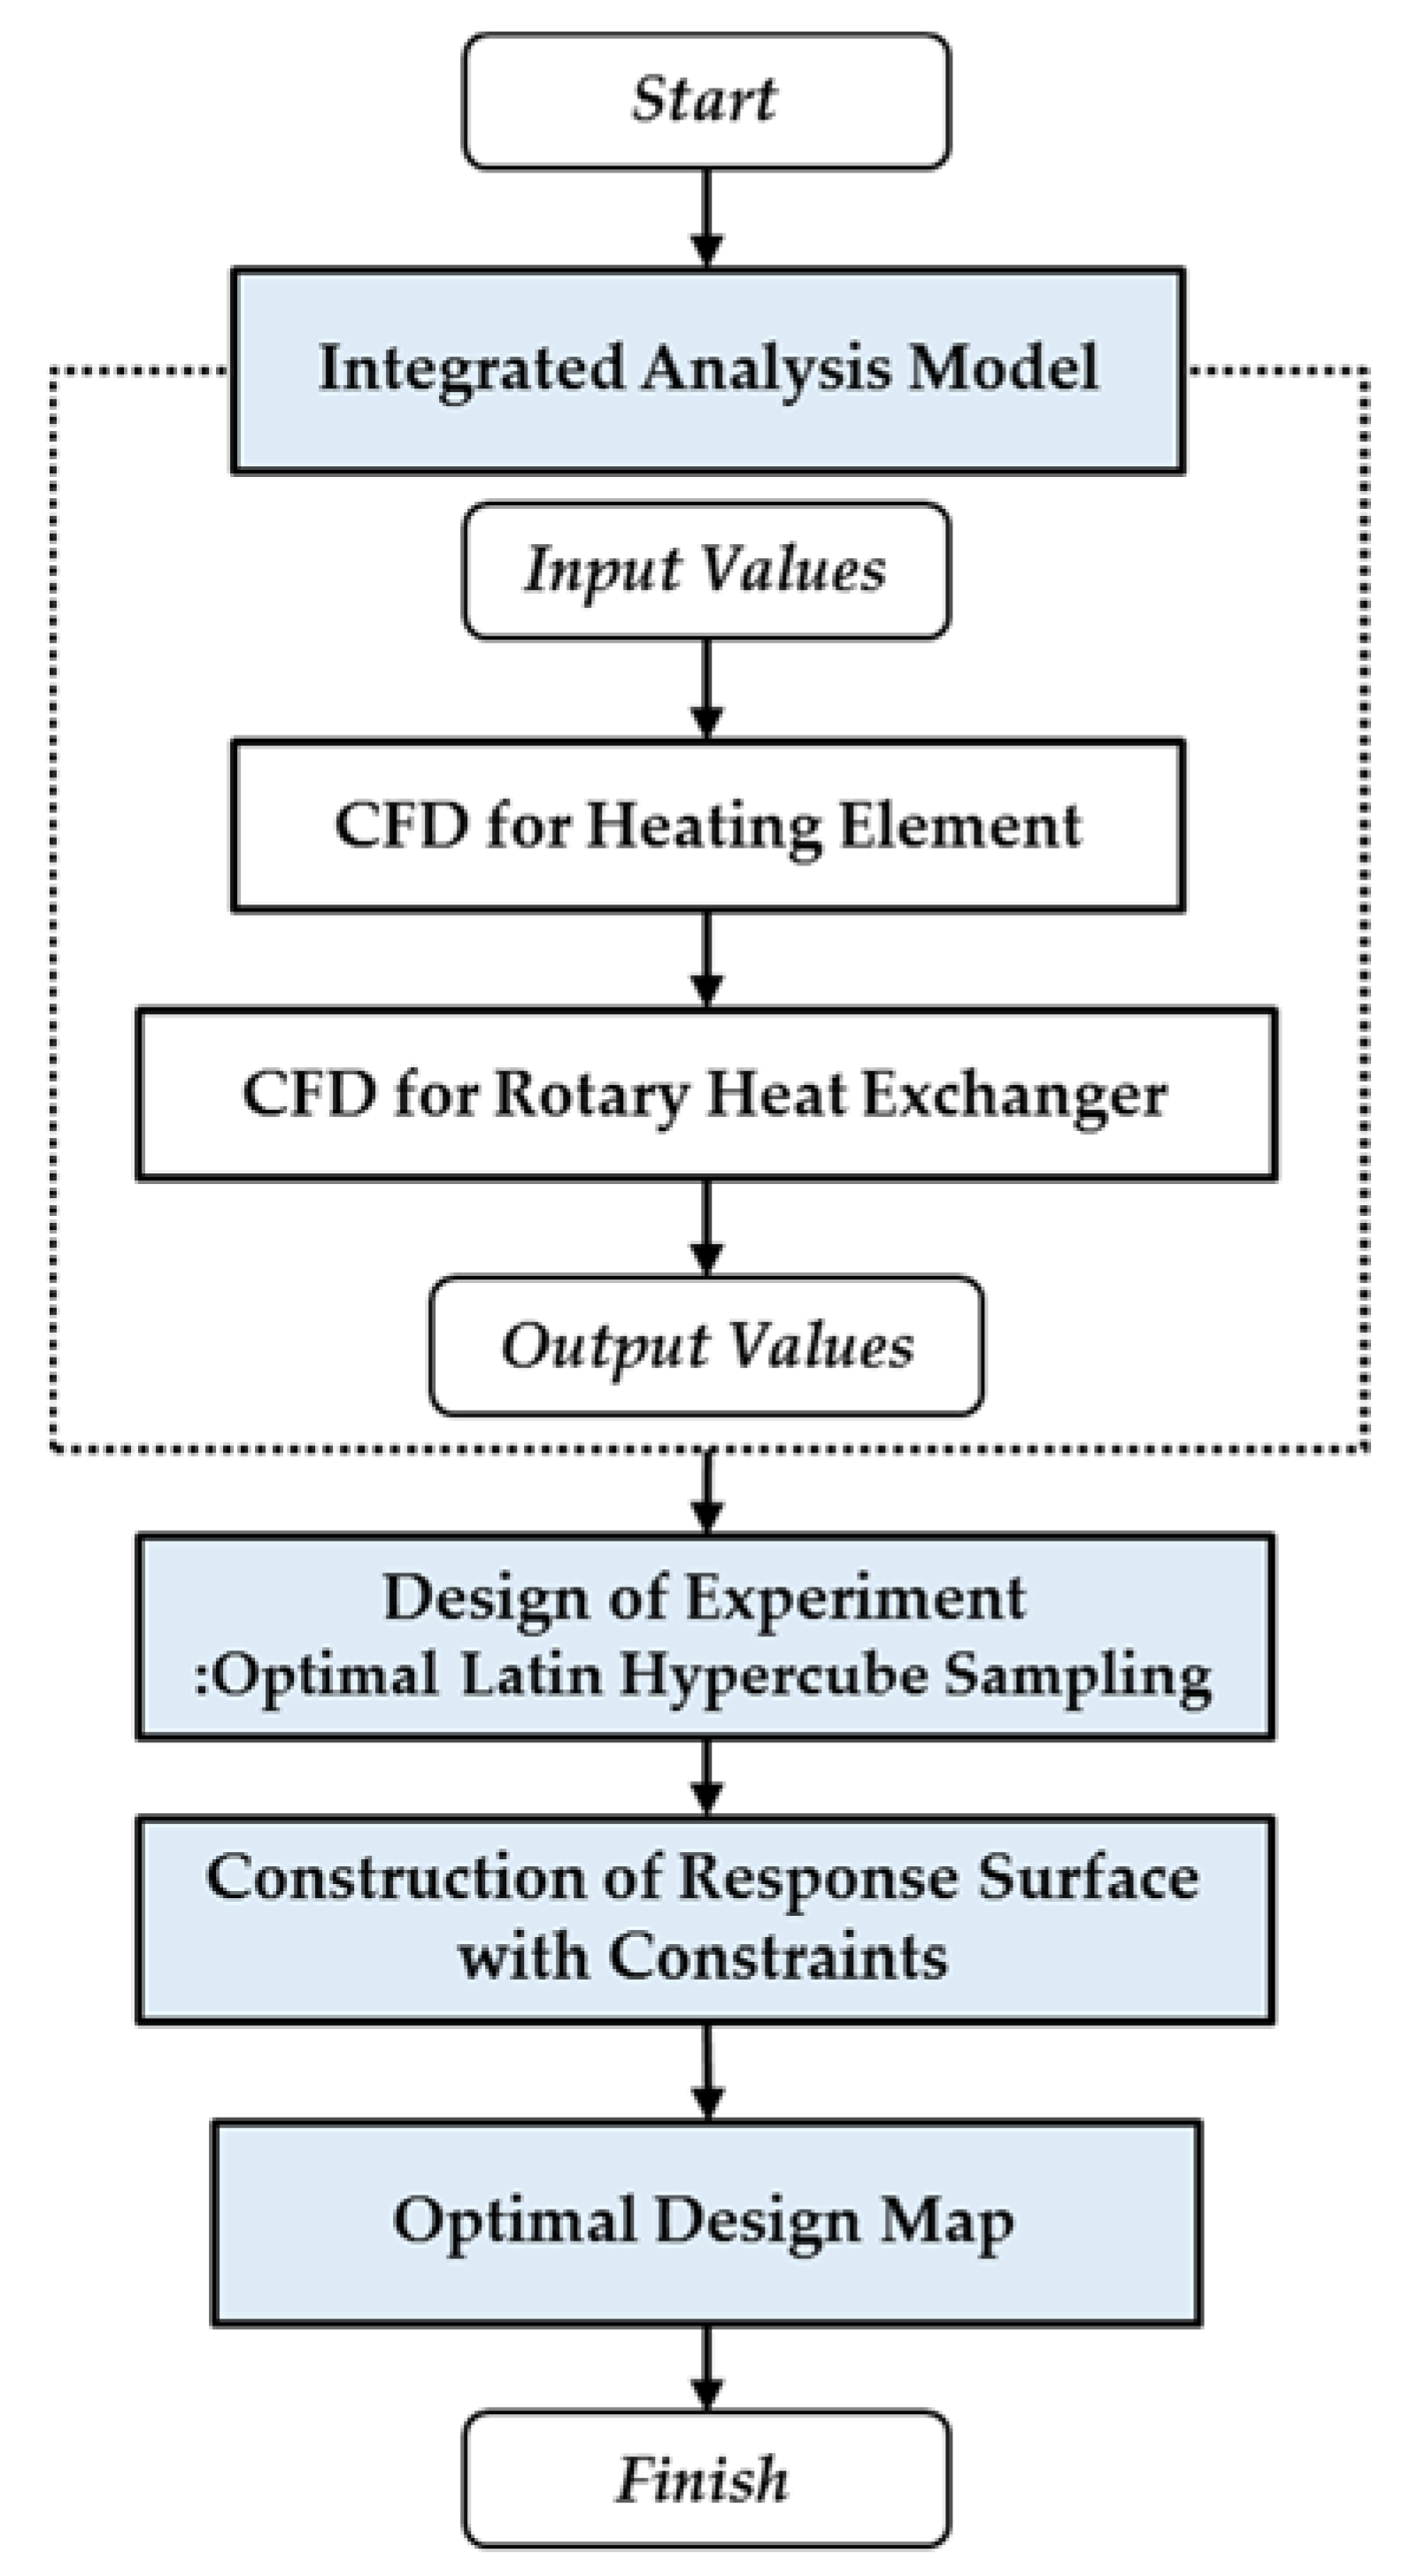
Figure 4.
Geometry and parameters of heating element.
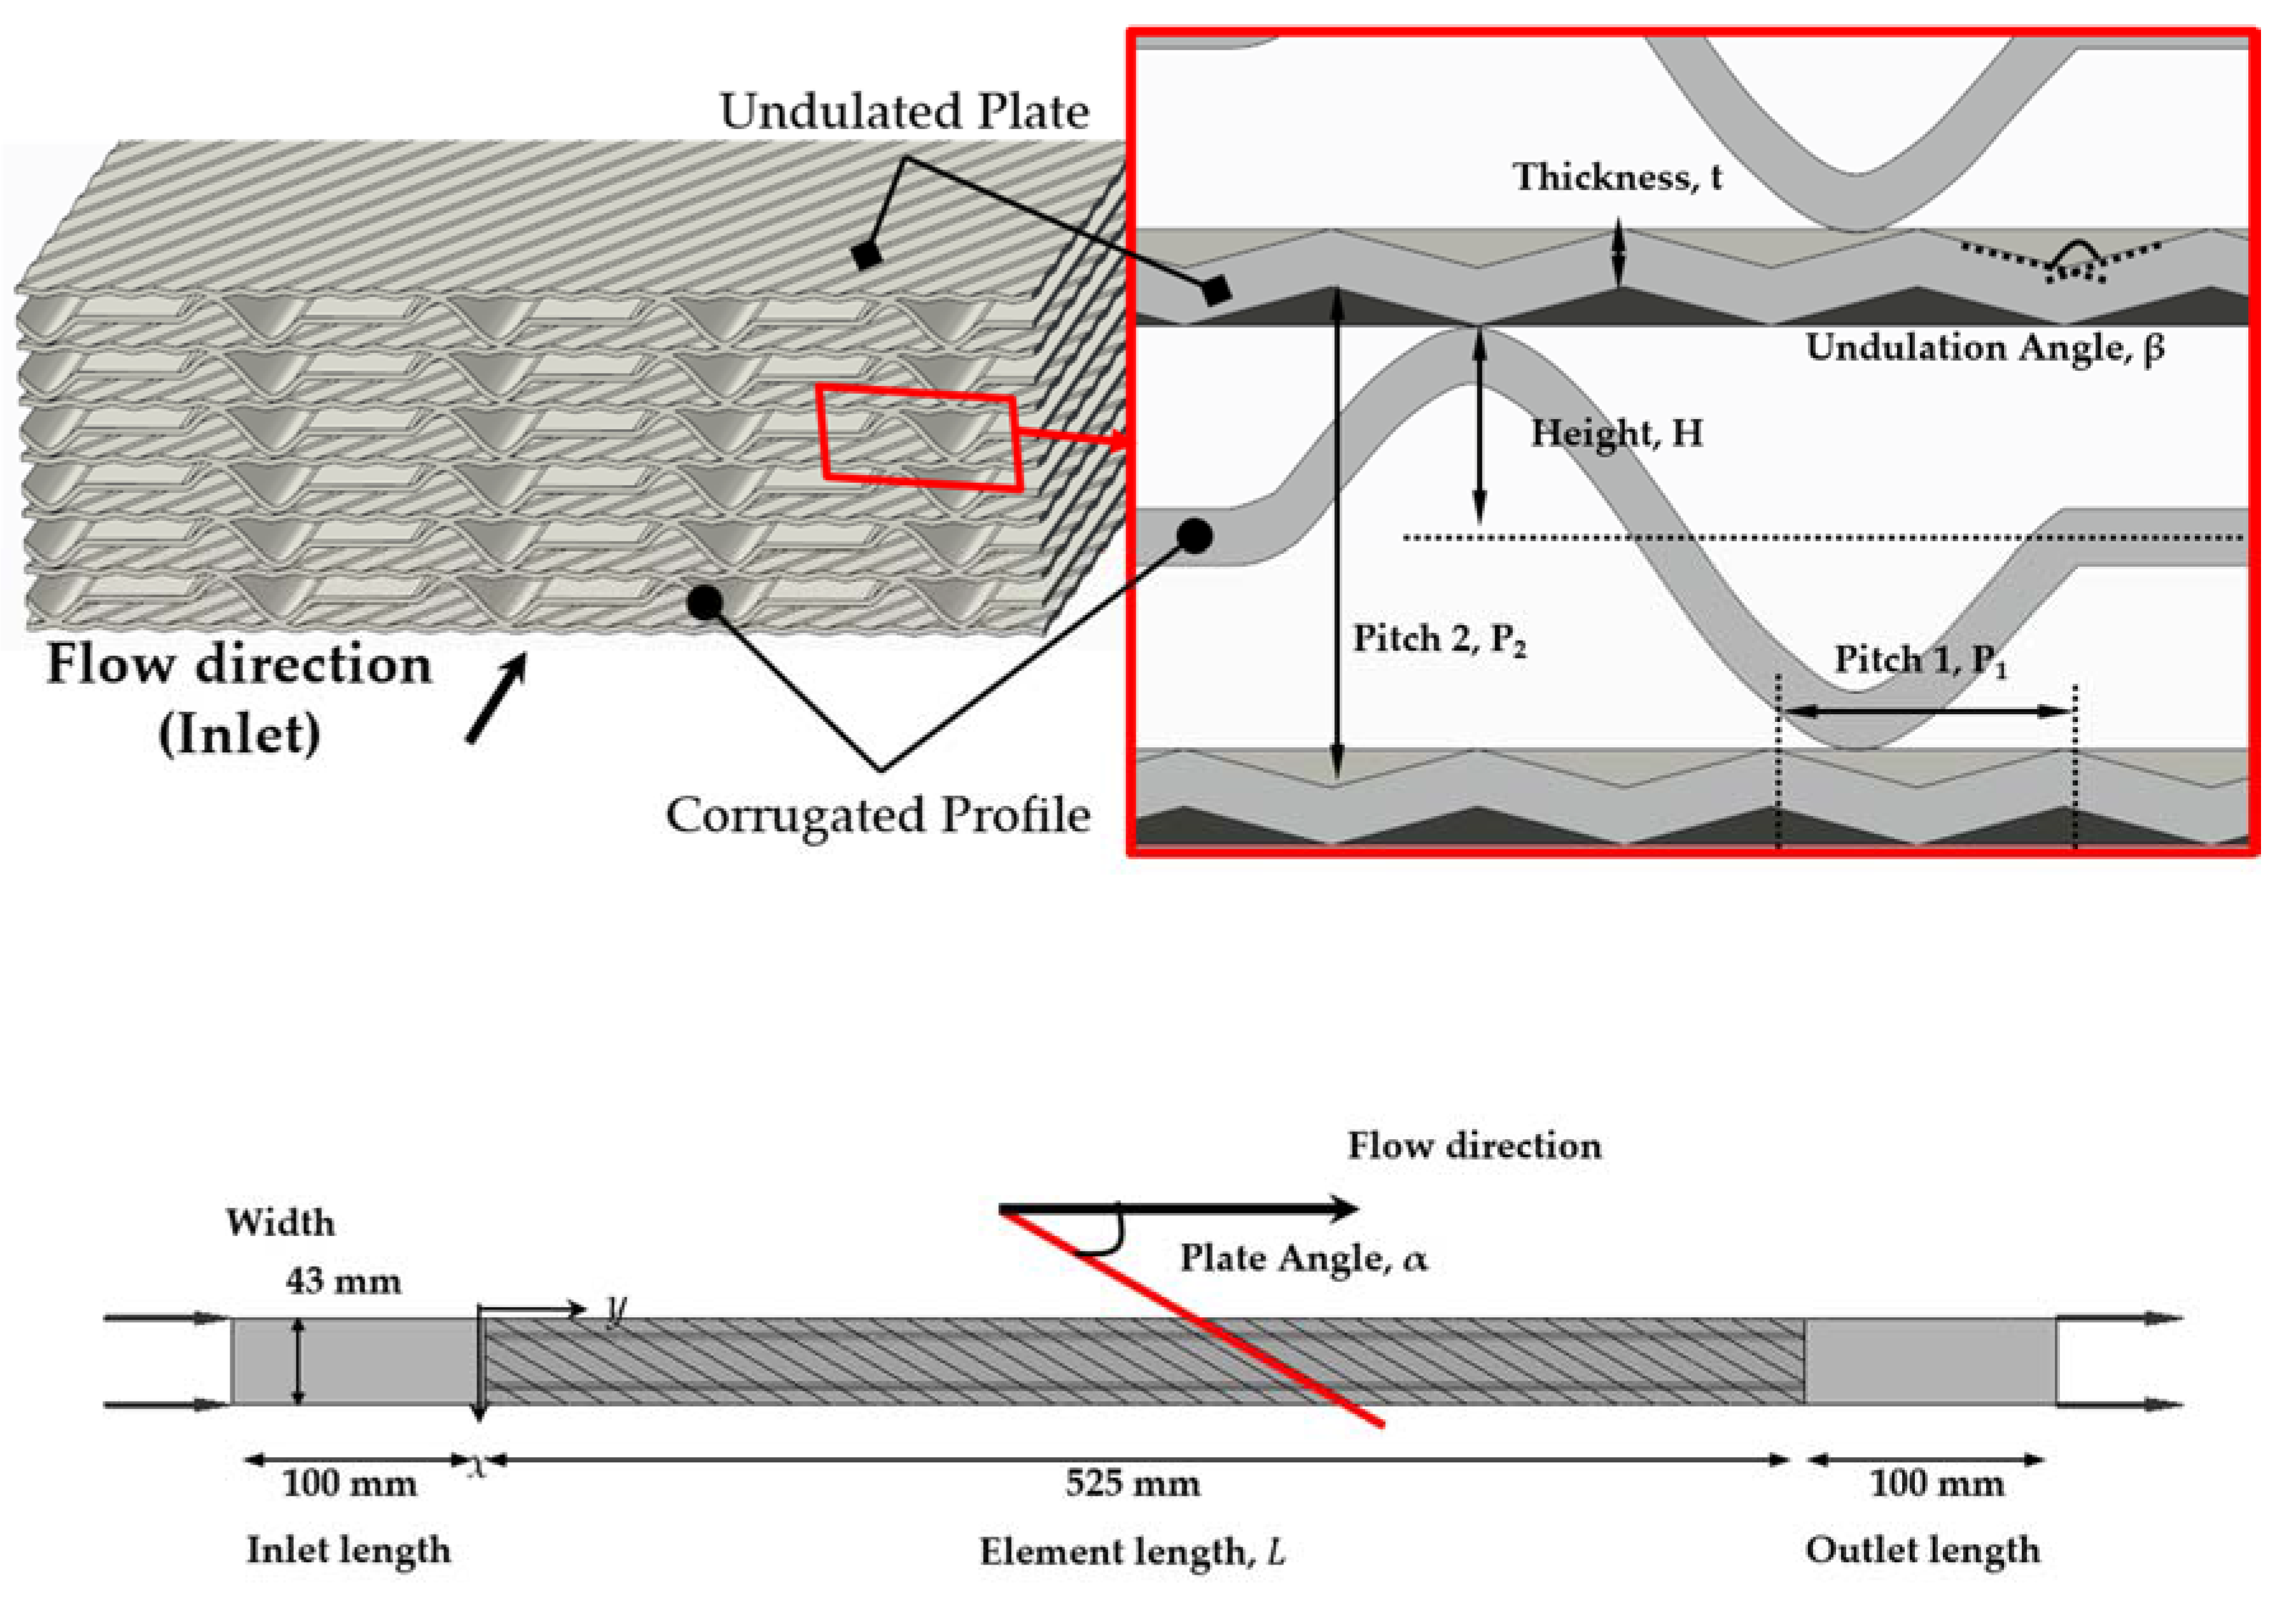
Figure 5.
Flow characteristics of the heating element.

Figure 6.
Heat transfer coefficient of the heating element for undulated plate and corrugated profile.
Figure 6.
Heat transfer coefficient of the heating element for undulated plate and corrugated profile.

Figure 7.
Temperature of rotor with base heating element; (a) overall scheme of rotor temperature; (b) side view of rotor temperature at x–z plane; (c) comparison of rotor temperature along z–direction; (d) cross section view of rotor temperature at A–A plane and B–B plane.
Figure 7.
Temperature of rotor with base heating element; (a) overall scheme of rotor temperature; (b) side view of rotor temperature at x–z plane; (c) comparison of rotor temperature along z–direction; (d) cross section view of rotor temperature at A–A plane and B–B plane.


Figure 8.
Validation of GGH system simulation with actual operational data. OPE means the operational data and CFX means the result of numerical analysis.
Figure 8.
Validation of GGH system simulation with actual operational data. OPE means the operational data and CFX means the result of numerical analysis.

Figure 9.
Response surface of the dimensionless parameter of the heating element for the GGH performance; (a) undulation angle and pitch 1; (b) pitch 1 and plate angle; (c) undulation angle and plate angle.
Figure 9.
Response surface of the dimensionless parameter of the heating element for the GGH performance; (a) undulation angle and pitch 1; (b) pitch 1 and plate angle; (c) undulation angle and plate angle.

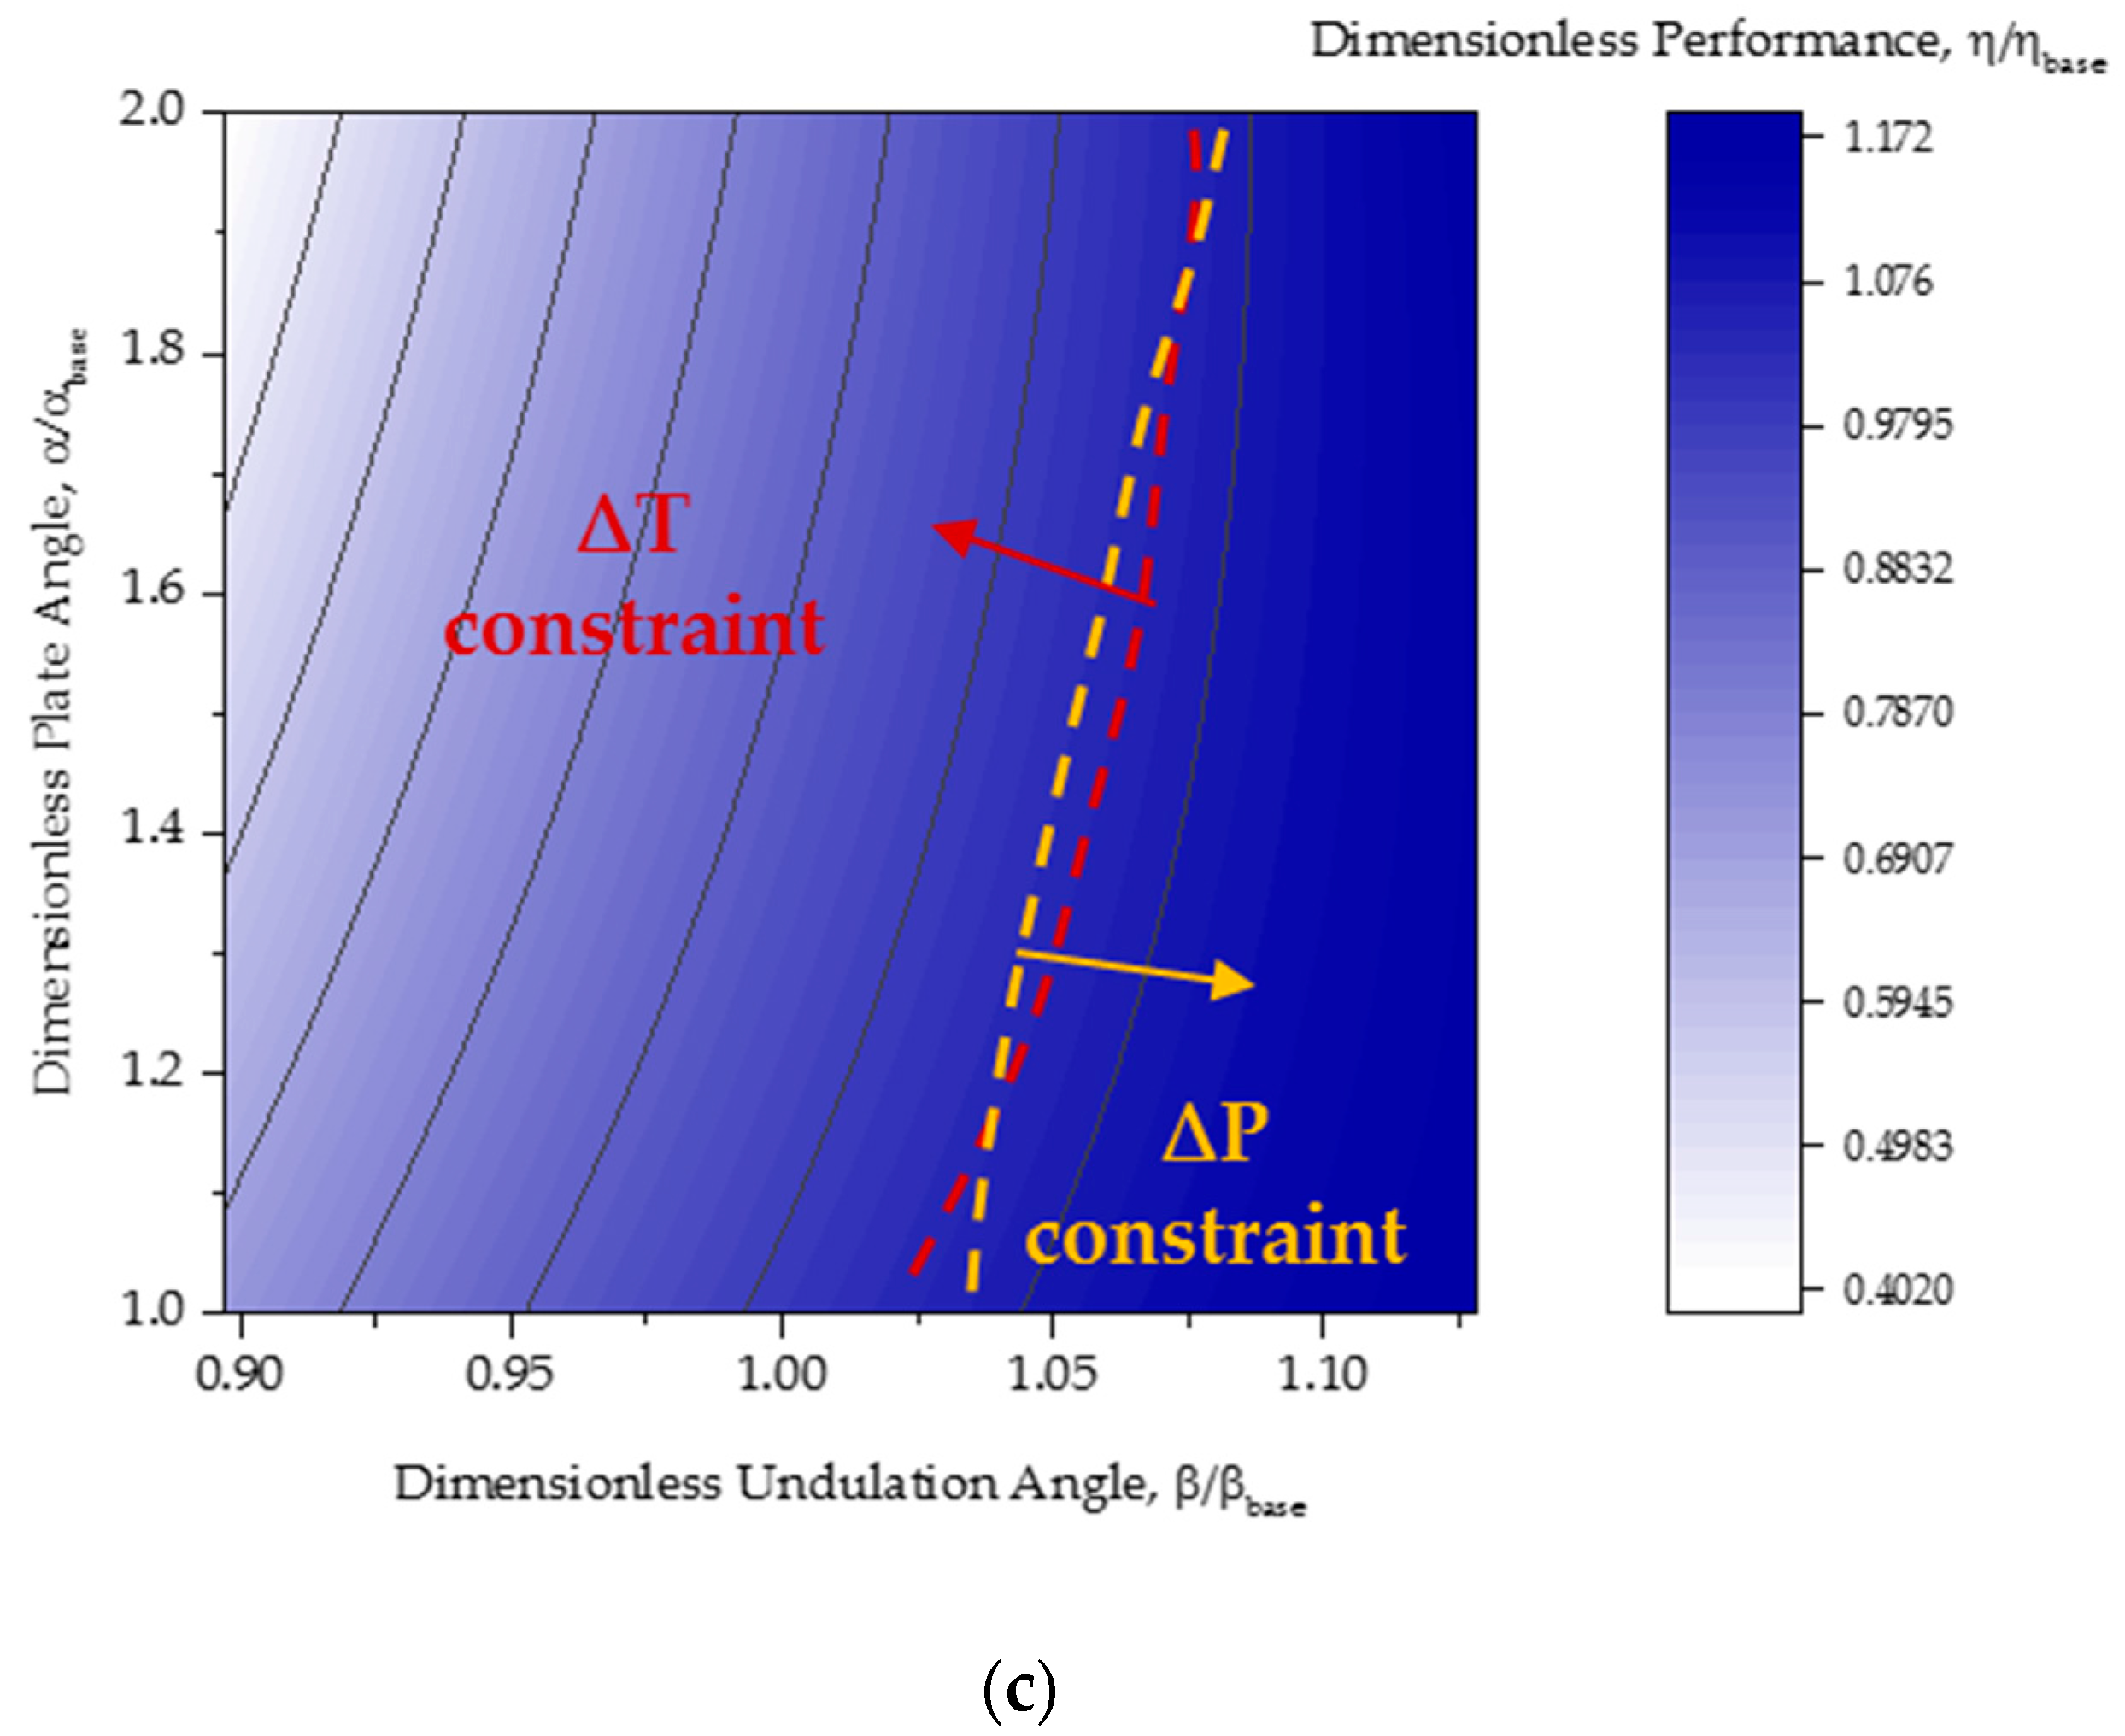
Figure 10.
(a) Distribution of heat transfer coefficient; (b) distribution of pressure in the base and optimal heating element.
Figure 10.
(a) Distribution of heat transfer coefficient; (b) distribution of pressure in the base and optimal heating element.
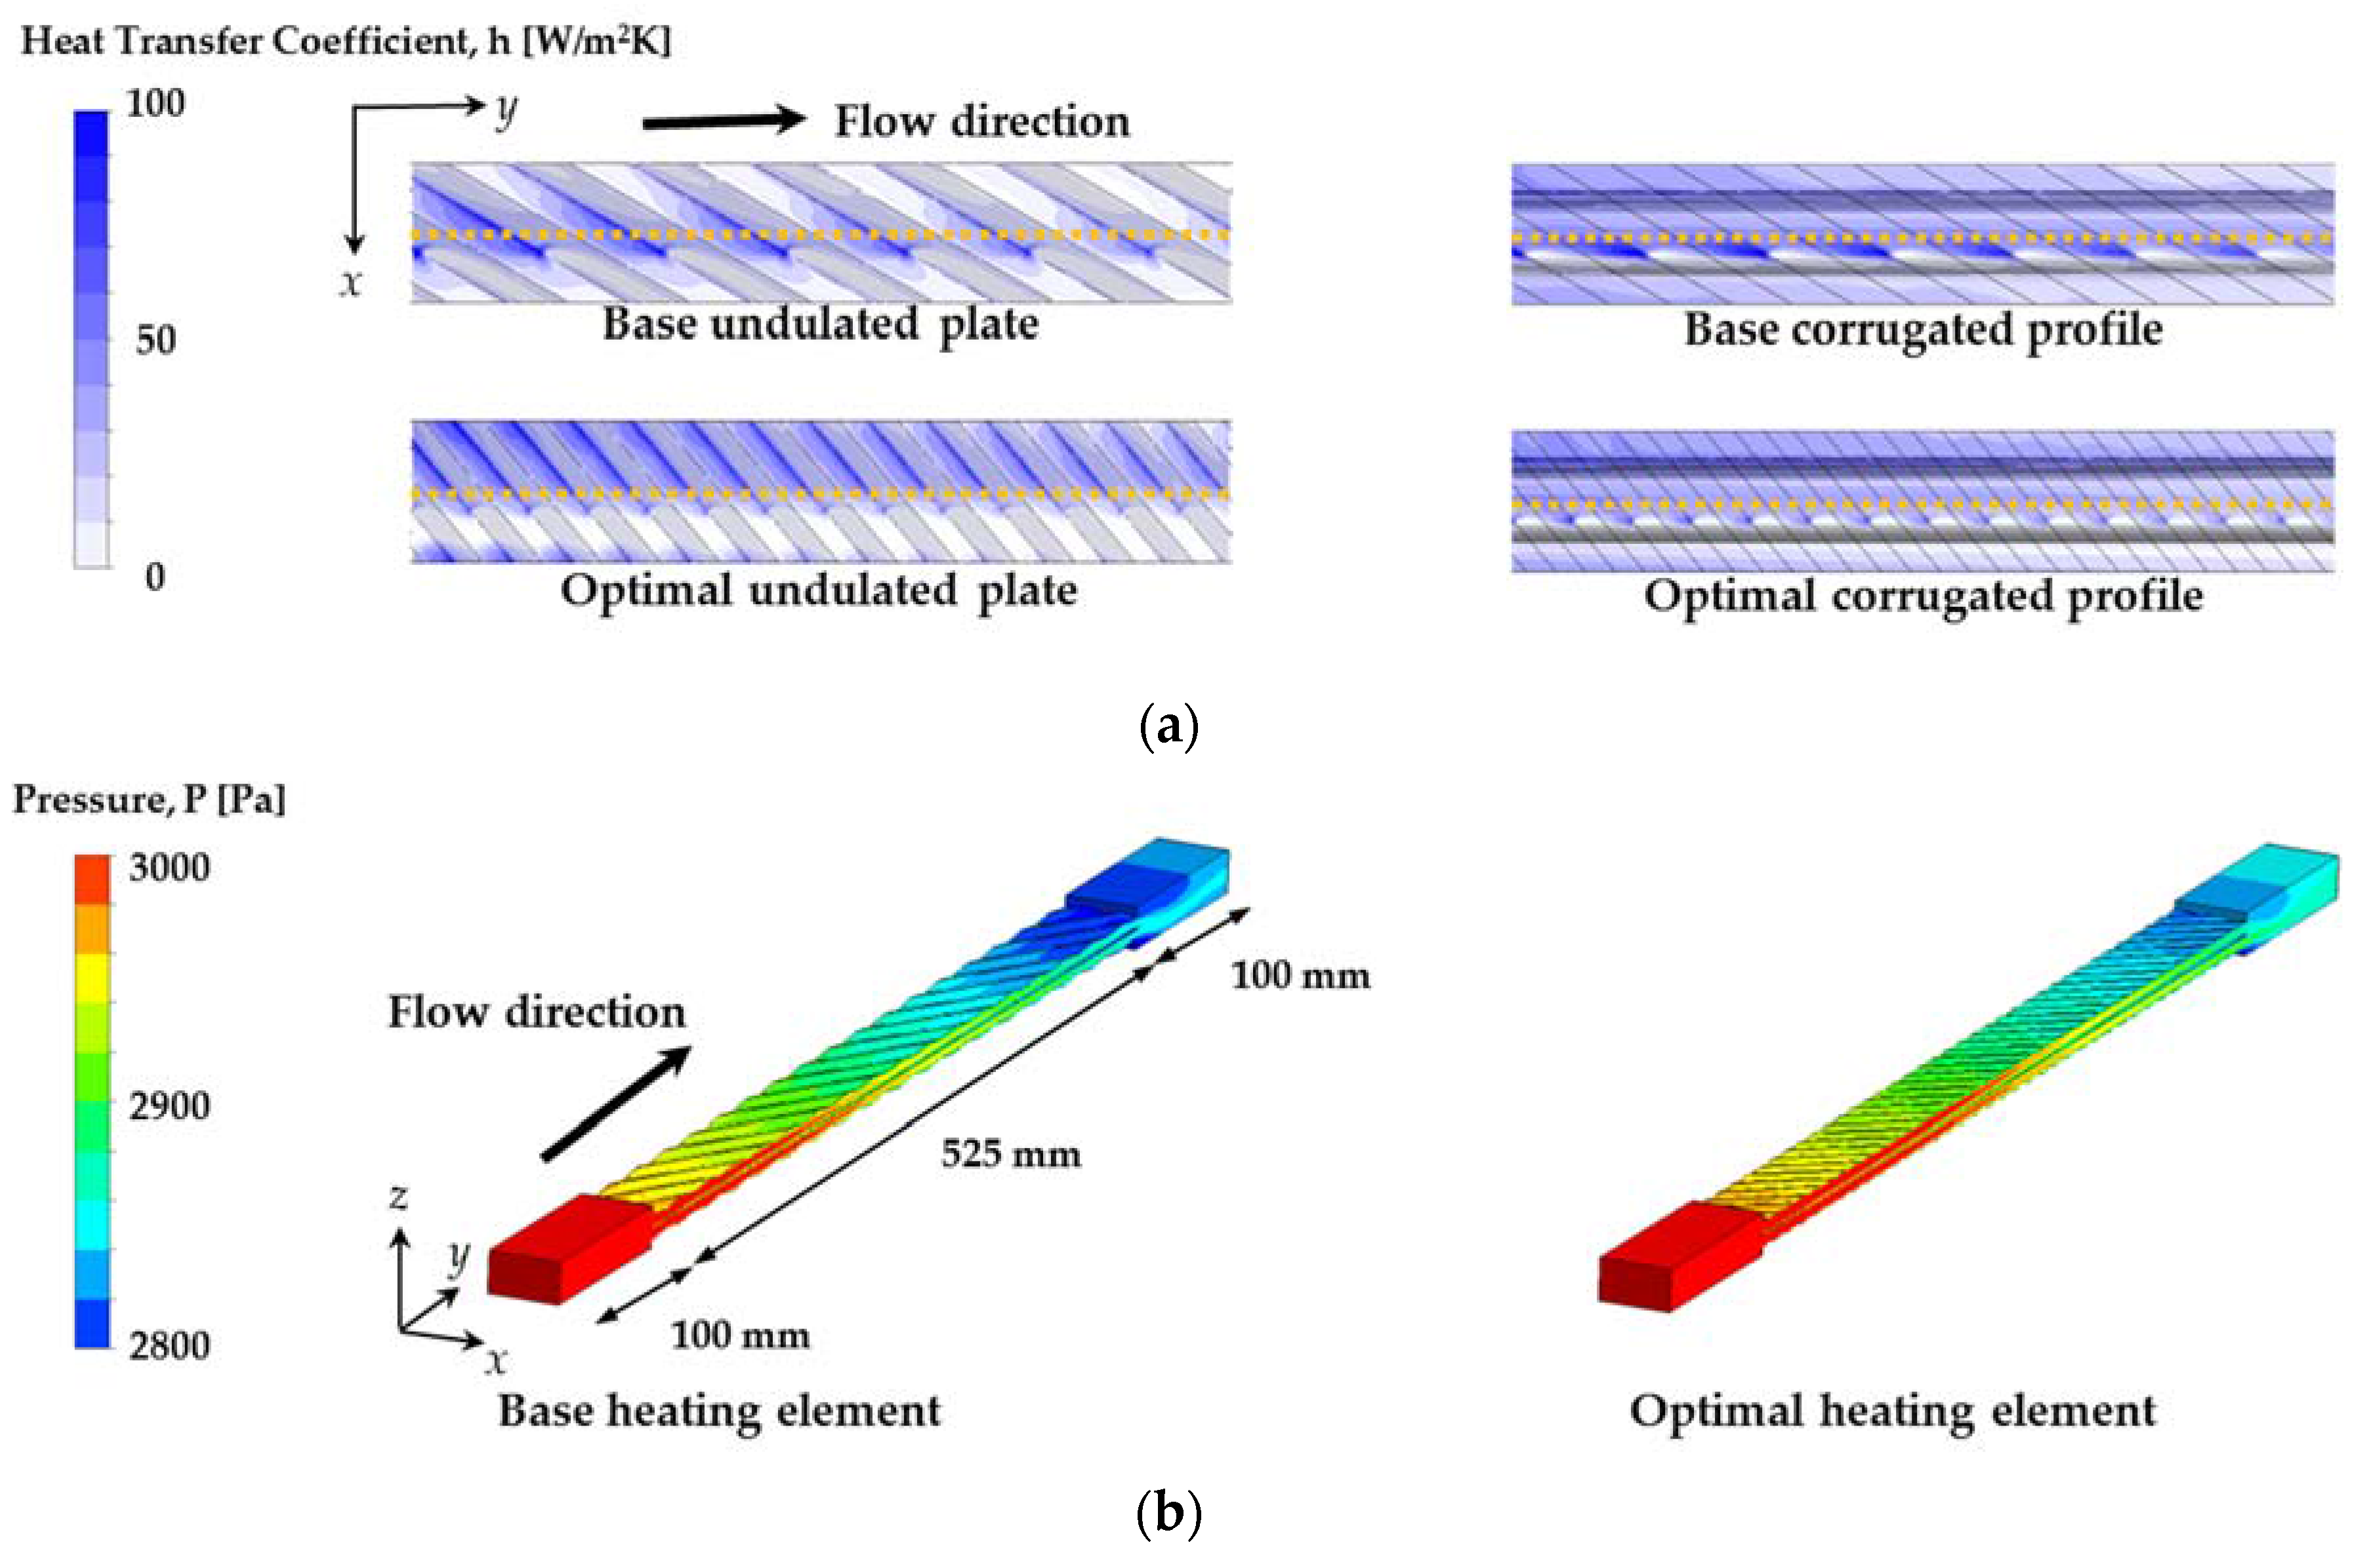
Figure 11.
(a) Local heat transfer coefficient distribution at middle of passages; (b) local pressure distribution at middle of passages for undulated plate and corrugated profile.
Figure 11.
(a) Local heat transfer coefficient distribution at middle of passages; (b) local pressure distribution at middle of passages for undulated plate and corrugated profile.


Table 1.
Parameters of L-type heating element with lower and upper bounds for optimization.
| Parameters | Units | Lower Bound | Base | Upper Bound |
|---|---|---|---|---|
| Plate angle, α | 30 | 30 | 60 | |
| Undulation angle, β | 72 | 78 | 90 | |
| Pitch 1, P1 | mm | 15 | 17.2 | 19 |
| Pitch 2, P2 | mm | - | 12.6 | - |
| Element length, L | mm | - | 525 | - |
| Thickness, t | mm | - | 1.2 | - |
Table 2.
Friction coefficient of heating element and average performance of gas-gas heater (GGH) system in accordance with number of cells.
Table 2.
Friction coefficient of heating element and average performance of gas-gas heater (GGH) system in accordance with number of cells.
| Target | Grids | Values | Error [%] |
|---|---|---|---|
| Heating Element (Friction Coefficient, kg/m4) | 3.58992 × 10⁶ | 2.60217 | 21.2 |
| 6.86075 × 10⁶ | 2.35021 | 9.50 | |
| 1.42655 × 10⁷ | 2.16611 | 0.93 | |
| 2.01201 × 10⁷ | 2.14663 | 0.02 | |
| 2.18297 × 10⁷ | 2.14624 | - | |
| GGH system (Average Performance) | 1.14401 × 10⁶ | 53.52307 | 12.0 |
| 1.52084 × 10⁶ | 57.8901 | 4.82 | |
| 1.65237 × 10⁶ | 59.37745 | 2.38 | |
| 1.92192 × 10⁶ | 60.7366 | 0.14 | |
| 6.50828 × 10⁶ | 60.82319 | - |
Table 3.
Thermal-fluid characteristics comparison of base and optimal design on heating element and GGH system.
Table 3.
Thermal-fluid characteristics comparison of base and optimal design on heating element and GGH system.
| Target | Object | Base Design | Optimal Design |
|---|---|---|---|
| Heating Element | Area average heat transfer coefficient, | 35.07 W/m2 K | 34.04 W/m2 K |
| Friction coefficient, | 2.75 kg/m4 | 2.37 kg/m4 | |
| Interfacial area density, IAD | 315/m | 322/m | |
| Volume porosity, VP | 0.68 | 0.74 | |
| GGH system | Average pressure drop at untreated region | 220 Pa | 198 Pa |
| Average pressure drop at treated region | 357 Pa | 335 Pa | |
| Average temperature change at untreated region | 16.3 K | 15.9 K | |
| Average temperature change at treated region | 15.6 K | 15.4 K | |
| Average performance, | 60.7 | 65.4 |
© 2017 by the authors. Licensee MDPI, Basel, Switzerland. This article is an open access article distributed under the terms and conditions of the Creative Commons Attribution (CC BY) license (http://creativecommons.org/licenses/by/4.0/).
Share and Cite
MDPI and ACS Style
Lee, Y.M.; Chung, H.; Kim, S.H.; Bae, H.S.; Cho, H.H. Optimization of the Heating Element in a Gas-Gas Heater Using an Integrated Analysis Model. Energies 2017, 10, 1932. https://doi.org/10.3390/en10121932
AMA Style
Lee YM, Chung H, Kim SH, Bae HS, Cho HH. Optimization of the Heating Element in a Gas-Gas Heater Using an Integrated Analysis Model. Energies. 2017; 10(12):1932. https://doi.org/10.3390/en10121932
Chicago/Turabian StyleLee, Young Mun, Heeyoon Chung, Seon Ho Kim, Hyeng Sub Bae, and Hyung Hee Cho. 2017. "Optimization of the Heating Element in a Gas-Gas Heater Using an Integrated Analysis Model" Energies 10, no. 12: 1932. https://doi.org/10.3390/en10121932
Note that from the first issue of 2016, this journal uses article numbers instead of page numbers. See further details here.